Ammonia vapour sensing properties of in situ polymerized conducting PANI-nanofiber/WS2 nanosheet composites†
Ravindra Kumar
Jha
 a,
Meher
Wan
b,
Chacko
Jacob
c and
Prasanta Kumar
Guha
 *d
*d
aSchool of Nano Science and Technology, Indian Institute of Technology, Kharagpur, West Bengal-721302, India
bAdvanced Technology Development Centre, Indian Institute of Technology, Kharagpur, West Bengal-721302, India
cMaterials Science Centre, Indian Institute of Technology, Kharagpur, West Bengal-721302, India
dDepartment of Electronics and Electrical Communication Engineering, Indian Institute of Technology, Kharagpur, West Bengal-721302, India. E-mail: pkguha@ece.iitkgp.ernet.in; Tel: +91-3222-283538
First published on 29th November 2017
Abstract
Polyaniline (PANI)/inorganic-nanomaterial based nanocomposites are attractive for gas sensing applications due to the synergistic behavior arising at their interfaces. In this work, HCl doped-PANI-nanofibers/WS2 nanosheet based nanocomposites were prepared by the template-free in situ polymerization of aniline on WS2 nanosheets, which were previously obtained by direct liquid exfoliation. The optimal performance was shown by the PANI/WS2 (w/w 10%) sample and it was characterized extensively using electron microscopy (SEM and TEM), several spectroscopic techniques (UV-Vis, Raman and FTIR), and X-ray diffraction. The nanomaterial was deposited on gold interdigitated electrodes which were then used as chemiresistive transducers for ammonia sensing at room temperature. The device was tested for ammonia concentrations of 50–200 ppm. The resistance of the device was found to increase with the concentration of ammonia vapours and a maximum response of up to 81% was recorded for 200 ppm of ammonia. The long-term stability, selectivity, sensitivity, and repeatability of the device were investigated. Apart from these, the device was also found to perform well under humid conditions. A mechanism based on the synergistic behavior due to the p–n heterogeneous characteristics at the interface of PANI and WS2 is proposed.
1. Introduction
Ammonia (NH3) is a colourless, pungent gas which serves as a starting material for the production of many commercially available nitrogen compounds. Ammonia is used in the fertilizer industry, in textiles (e.g. to make nylon), in the petroleum industry (to neutralize acidic by-products), in the rubber industry (to prevent coagulation of latex), in the explosive industry (to manufacture trinitrotoluene (TNT) and nitroglycerin) and also as a coolant in refrigerators and air-conditioners. However, it is a toxic gas, which has detrimental effects on human health and environment. Ammonia easily hydrolyses to form ammonium-hydroxide after absorbing moisture through the mucous membranes of the respiratory tract and cause health hazards.1,2 In general, exposure to around 50 ppm of NH3 gas may cause acute poisoning, while exposure to higher concentrations can cause even pulmonary oedema (accumulation of fluid in the lungs) and complete blindness.3Most of the commercially available ammonia sensors are of the electrochemical type (e.g. ammonia sensors sold by Honeywell,4 Alphasense,5 and many others).6 There are also catalytic ammonia sensors (specifically sold for automobiles by Delphi7,8) and resistive ammonia sensors (sold by Figaro Japan (e.g. TGS 826),9 Zhengzhou Winsen Electronics (e.g. MQ137)10). Among these, electrochemical sensors are often quite expensive (∼$100), primarily because they are difficult to integrate with silicon microelectronics technology, and hence, require a separate evaluation board for interfacing. On the other hand, resistive sensors mostly use metal oxides as the sensing layer which reacts with gases at elevated temperature (200–500 °C).11,12 Thus, such sensors require quite large power (both Figaro and Zhengzhou Winsen ammonia sensors require power around 900 mW). However, resistive sensors can be integrated with microelectronics technology, which will reduce the sensor cost significantly because then the sensor and the interface circuit will be on the same silicon die (e.g., micro-hotplate platforms developed in the last few years which use both CMOS and MEMS technology).13–15
There has been a parallel research activity developed in the last few years, which focuses on sensing at near room temperature.16,17 This will reduce the power consumption of sensors drastically. In this respect, two-dimensional (2D) layered materials play a key role. There are recent reports of good ammonia sensors based on graphene and graphene oxide.18,19 Most of the inorganic ammonia sensing materials are based on metal-oxides (MOX) which include SnO2, ZnO, WO3, etc., while organic semiconductors (i.e. dialkyl tetrathiapentacene), conducting polymers (polypyrrole), carbon nanotubes, and reduced graphene oxide (RGO) are the major organic materials for ammonia sensors.20,21 Though the organic nanomaterial based ammonia sensors possess sensitivity at room temperature, their long response time and large thermal instability make them unsuitable for long term use.22,23 Apart from these, poor selectivity is a serious problem for both types of materials, and hence, lots of organic–inorganic nanocomposites/nanohybrids are being investigated for selective detection of ammonia along with the development of completely new sensing materials.24,25
The electrical and chemical properties of conducting polymers create new possibilities for employing them in devices.26 Conducting polymers on the nanoscale are special because they exhibit exotic electrical properties due to the chemical treatment with oxidizing or reducing agents. Chemical treatment with redox active agents can transform these polymers from an initial insulating state into an electrical conductive state.27 Thus, these polymers are very good candidates for use as chemical sensors, and biosensors.28,29 Among conducting polymers, polyaniline (PANI) has established itself as an excellent sensing material due to its convenient synthesis, high sensitivity, high electrical stability, unique doping chemistry, high conductivity and reversible redox reactions.30 It should be noted that the most common oxidation states of PANI are leucoemeraldine, pernigraniline, and emeraldine. Further, emeraldine can be synthesized in two forms: emeraldine salt (ES) and emeraldine base (EB), out of which, only ES has conductivity of the order of semiconductors at room temperature while others are insulators.31,32 It is evident from the literature that the poor chemical stability at higher temperatures and poor mechanical strength of PANI remain a challenge for its practical use as a good sensing material.33,34 However, there have been numerous approaches to address these problems such as introduction of inorganic metal oxides into PANI during synthesis. Until now, several metal oxide (e.g. ZnO, In2O3, TiO2, SnO2, and WO3etc.) nanostructures have been incorporated into PANI by the chemical oxidative polymerization of aniline, polymerization by reverse micelles, hydrothermal method, layer-by-layer (LbL) self-assembly approach, sol–gel technique, etc.35,36 However, there is an indispensable need for the improvement of room temperature gas sensing applications of these nanocomposites for stable gas sensors.
WS2 is an inorganic layered material which is known for its chemical and thermal stability, and seems to be a promising candidate for improving the sensing properties of PANI.37 Recently, exfoliated nanosheets of WS2 and other TMDs like MoS2 have been investigated for gas sensing, and preliminary theoretical and experimental results indicate that they can set a new paradigm of sensing performance in a 2D morphological form.38,39 PANI/MoS2 nanocomposites are being investigated for high-performance supercapacitors; however, PANI embedded with TMDs might have tremendous potential for gas sensing applications as well.40,41
In this work, a resistive transduction technique was used where the sensing material was the as-synthesized PANI/WS2 nanocomposites containing different weight percentages of few layered WS2 nanosheets (w/w 5–30%). These nanocomposites were prepared by the in situ polymerization of aniline on WS2 nanosheets. The as-synthesized nanocomposite was used for ammonia sensing in the concentration range of 50–200 ppm. Pure PANI was also synthesized under similar conditions and the responses of the composites were compared with the performance of pure PANI. It was found that the PANI/WS2 (w/w 10%) sample shows an optimal response at room temperature (22 °C). The response of the sensor was found to be stable, repeatable, and selective towards ammonia. Apart from aqueous ammonia vapour analyte tests, the sensing device was also subjected to dry ammonia gas and humidity. The effect of humidity on the ammonia sensing performance of the PANI/WS2 (10%) nanocomposite is also discussed in this manuscript.
2. Experimental
2.1. Materials, reagents, chemicals, labware, and instrumentation
WS2 (99.8% metal basis, micron powder) was purchased from Alfa Aesar. Hydrochloric acid solution (1.0 M, HCl), acetone, isopropanol and aniline were procured from Merck. Deionized (DI) water was obtained from a Merck Millipore system. Potassium hydrogen di-iodate (ACS reagent, 99.9%) was purchased from Sigma-Aldrich. A Thermo Fisher Scientific F2 Finn pipette of variable volume (0.2–1000 μL) was used during the experiment. USP Class VI Sterile certified 50 mL polypropylene/HDPE Spinwin conical bottom tubes were purchased from Tarsons for ultrasonication of bulk-WS2 crystals. These tubes were sealed after continuous purging of dry nitrogen, using a self-sealing flexible Parafilm obtained from Bemis Company, Inc. A single chamber bath sonicator (Microclean 102, Oscar Ultrasonic) operating at 80 Watt and 20 kHz was used to sonicate the bulk-WS2 powder. A REMI centrifuge was used to separate thinner and lighter nanosheets from comparatively thicker and heavier sheets. A Tarsons SPINOT digital magnetic stirrer cum hot plate with a temperature probing facility was used for stirring with continuous monitoring of temperature. A planar gold inter-digitated electrode (IDE) fabricated on a 0.25 × 0.25 dense aluminium oxide substrate was purchased from Synkera Technologies, Inc. Electrical characterization was performed using an Agilent 4156C precision semiconductor parameter analyser (SPA) integrated with an Agilent 4151B SMU, a pulse generator expander and an Agilent E5250A low leakage switch mainframe, which were connected to the device using an Agilent 16442A test fixture. A standard dry air cylinder was used to purge the gas testing chamber when ammonia was switched off.2.2. Material characterization
Initial morphological studies of the as-synthesized nanostructures were carried out using a MERLIN (ZEISS) field emission scanning electron microscope (FESEM) equipped with a GEMINI II column. 2 μL of the as-synthesized nanomaterials were spin coated on a p(100) silicon wafer, dried in an ambient environment and the wafer was then placed on a carbon conducting tape. An operating accelerating voltage of 5 kV was used during imaging except for WS2 nanosheets, where an accelerating voltage of 20 kV was used after gold coating. An analytical transmission electron microscope (TEM), FEI TECNAI G2 20S-TWIN, was used to obtain TEM images and selected area electron diffraction (SAED) patterns. High-resolution transmission electron microscopy (HRTEM) images were obtained using a JEM-2100 (JEOL) high resolution TEM. TEM samples were prepared by drop-casting freshly prepared suspensions containing nanostructures onto standard carbon-supported 300 mesh copper grids and drying them in an ambient environment. The phases formed were confirmed using a PANalytical high resolution X-ray diffractometer (PW 3040/60) operated at 40 kV and 30 mA using Cu Kα X-rays (1.5418 Å). X-ray photoelectron spectroscopy (XPS) measurements were carried out using a PHI 5000 Versa Probe II, ULVAC-PHI, Inc., Japan with an incident Al Kα X-ray of energy 1486.6 eV. A Scinco Neosys 2000 double beam UV-Vis spectrophotometer was employed for the UV-Vis absorption study of the nanomaterial in the dispersed state. A Thermo Nicolet (NEXUS-870) Fourier transform infrared (FTIR) spectrometer was used for FTIR spectroscopy and a T64000 (Jobin Yvon Horiba, France) Raman spectrometer integrated with a 1024 × 256 thermoelectrically cooled front illuminated CCD detector (SynpseTM) and an optical microscope (BX41, Olympus, Japan) was used for Raman spectroscopy. An Argon-Krypton mixed ion gas laser (2018 RM, Spectra Physics, USA) operating at a wavelength of 514.5 nm was used for excitation while keeping the laser power under 0.2 mW.2.3. Material synthesis
In a typical WS2 nanosheet synthesis process, 120 mg of bulk-WS2 micron sized powder was sealed in a polypropylene tube containing 20 mL of acetone and isopropanol mixture (80![[thin space (1/6-em)]](https://www.rsc.org/images/entities/char_2009.gif) :
:![[thin space (1/6-em)]](https://www.rsc.org/images/entities/char_2009.gif) 20 volume ratio) using Parafilms in an inert atmosphere. This dispersion was further sonicated for 10 hours in a single chamber bath sonicator. To avoid any increase in temperature during sonication, ice cubes were continuously added to the chamber. The bigger platelets were allowed to settle at the bottom of the tube for the next 24 hours and then, the dispersion was centrifuged at 1500 rpm for 50 minutes and the upper two-third of the supernatant was carefully collected with a 1000 μL pipette.
20 volume ratio) using Parafilms in an inert atmosphere. This dispersion was further sonicated for 10 hours in a single chamber bath sonicator. To avoid any increase in temperature during sonication, ice cubes were continuously added to the chamber. The bigger platelets were allowed to settle at the bottom of the tube for the next 24 hours and then, the dispersion was centrifuged at 1500 rpm for 50 minutes and the upper two-third of the supernatant was carefully collected with a 1000 μL pipette.
5 mL of 0.1 M aniline monomer was dissolved in 100 mL of 1 M HCl at room temperature by stirring at 800 rpm continuously for 1 hour. After mixing the aniline monomer and HCl homogeneously, the as-synthesized WS2 nanosheets were added in required amount. Further, 0.015 M of 100 mL of KH(IO3)2 was added slowly using a burette to the continuously stirred mixture of HCl and aniline with the required amount of WS2 at 1 °C ± 1 °C. A greenish suspended product of polymerized aniline over the WS2 nanosheets was formed after 1 hour. The product was centrifuged and filtered. The filtered product was washed with HCl (N/10) and acetone many times. The resulting materials were centrifuged gently and continuously washed with DI water until the filtrate became colourless. The separated nanocomposite was dried at 60 °C overnight.
2.4. Gas sensing set-up
An in-house custom made gas sensing set-up was used for ammonia sensing. Two mass flow controllers (MFCs, Alicat Scientific, Inc. USA) of 100 standard cubic centimetres per minute (sccm) and 500 sccm were used to control the ammonia gas flow and dry air purging respectively. The flow rates were controlled using the Flow Vision MX software (Alicat). The IDE was probed with platinum probes and was integrated with an Agilent 4156C SPA through an Agilent 16442A test fixture.3. Results and discussion
3.1. Sensing material
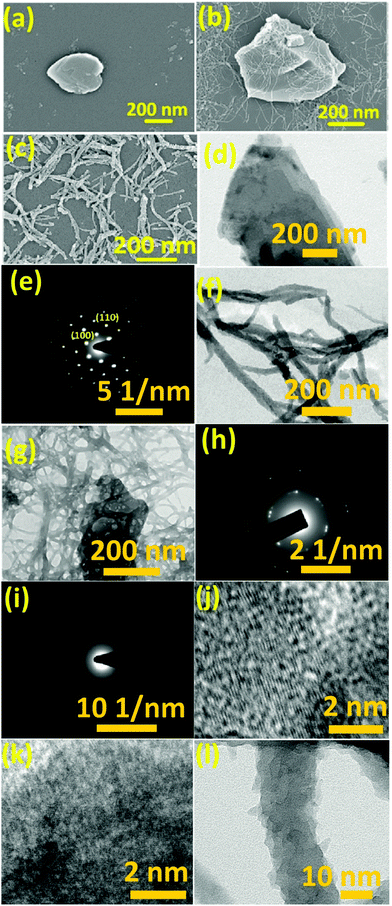
The surface morphology of the as-fabricated WS2 nanosheets was studied using FESEM and TEM. Fig. 1(a) shows the FESEM image of few-layered WS2. The ultrathin nature of these sheets was further confirmed by the TEM image in Fig. 1(d). The SAED pattern in Fig. 1(e) reveals the hexagonal lattice structure of WS2 with a lattice spacing of 0.27 nm and 0.16 nm assigned to (100) and (110) planes, respectively, which matches well with the reported values in the literature.42 HCl doped PANI was also synthesized separately as shown in Fig. 1(c). The lengths of nanofibers varied from few hundred nanometres to few micrometres as confirmed by the TEM image in Fig. 1(f). The amorphous nature of the PANI nanofibers was confirmed by the SAED pattern as shown in Fig. 1(i). The FESEM image of the PANI/WS2 (w/w 10%) nanocomposite in Fig. 1(b) shows that the WS2 nanosheets are embedded in a PANI nanofiber-network which is further confirmed by the TEM image in Fig. 1(g). Furthermore, the nanofibers were found to be linked together, resulting in the formation of more porous networks. The SAED pattern of the nanocomposite in Fig. 1(h) shows dot patterns due to the highly crystalline WS2 nanosheets and the ring patterns which are attributed to the amorphous PANI nanofibers. HRTEM images of the WS2 nanosheets, PANI/WS2 nanocomposite and PANI nanofibers are shown in Fig. 1(j–l). The periodic fringes of the (100) planes with a spacing of 2.7 Å are clearly visible in Fig. 1(i). These fringes are also present in the PANI/WS2 nanocomposites due to the presence of crystalline WS2 nanosheets as shown in Fig. 1(j) and due to the absence of crystallinity in the PANI nanofiber such fringes are not obtained for it. The HRTEM image of a single PANI nanofiber is shown in Fig. 1(l). FESEM and TEM images of nanocomposites of other compositions are shown in Fig. S1 and S2 respectively (ESI†). To gain more insight into the crystallinity of the nanomaterial XRD patterns were obtained. XRD patterns of the as-synthesized WS2 nanosheets along with PANI and PANI/WS2 (w/w 10%) nanocomposites are shown in Fig. 2. It is evident that the only broad peak that appeared at around 14.2° is the characteristic of HCl doped PANI and this corresponds to the (011) crystal plane.43,44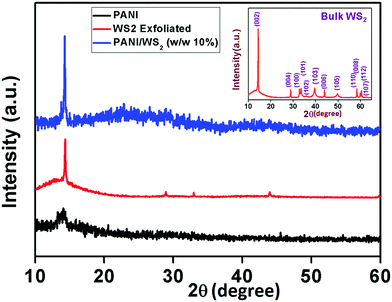 | ||
| Fig. 2 XRD pattern of PANI, exfoliated WS2 nanosheets, and the PANI/WS2 (w/w 10%) nanocomposite (bulk WS2 XRD pattern in the inset). | ||
The low crystallinity in PANI which is confirmed by the XRD pattern and SAED pattern (in Fig. 1(i)), is due to the inordinate orientations of benzenoid and quinoid rings in PANI chains. For WS2 nanosheets, a sharp peak corresponding to the (002) planes appears at 14.3° (close to the peak corresponding to the (011) plane of PANI) which suggests that the exfoliation has occurred along the (002) plane. However, bulk WS2 shows a number of characteristic peaks (as shown in the inset of Fig. 2) other than the (002) peak. A peak appears between 14°and15° (2θ) in the PANI/WS2 nanocomposite, which corresponds to WS2 nanosheets, while a slight broadening in this peak is attributed to the amorphous PANI nanofibers. The XRD results ruled out any chance of oxidation of the WS2 nanosheets, as no significant peak corresponding to tungsten oxide could be located. XRD patterns of other nanomaterials are shown in Fig. S3 (ESI†). Fig. 3(a) shows the FTIR response of the PANI/WS2 nanocomposite. The peaks at 2914 cm−1 and 2834 cm−1 corresponding to WS2 nanosheets are preserved after composite formation; however, they are shifted to slightly lower wavenumbers which may be due to the hydrogen bonding at the surface of WS2.45,46 The UV-Vis spectrum of the PANI/WS2 nanocomposite shows peaks at 330 nm and 629 nm. The first peak is attributed to the π–π* transition in the benzenoid rings, and the second peak is due to the exciton absorption of the quinoid rings which are due to the inter/intra chain charge transport which overlap with the absorption peak due to the WS2 nanosheets.47 The micro Raman spectra of the as-synthesized nanocomposites are shown in Fig. 3(c). A strong peak appears at 1603 cm−1 due to the C–C stretching mode of the semi-quinoid rings in the PANI/WS2 nanocomposite.48 A small peak at 1582 cm−1 appears due to the C![[double bond, length as m-dash]](https://www.rsc.org/images/entities/char_e001.gif) C stretching in the quinoid units.49 A strong C–N+ stretching vibration at 1339 cm−1 indicates a semi-quinone radical cation structure.50 The peaks at 355.5 cm−1 and 418.1 cm−1 can be assigned to the E12g modes (in-plane optical mode) and the A1g modes (out-of-plane vibration mode) of 2H-WS2 respectively.51 Raman spectra of other nanomaterials are shown in Fig. S4 (ESI†).
C stretching in the quinoid units.49 A strong C–N+ stretching vibration at 1339 cm−1 indicates a semi-quinone radical cation structure.50 The peaks at 355.5 cm−1 and 418.1 cm−1 can be assigned to the E12g modes (in-plane optical mode) and the A1g modes (out-of-plane vibration mode) of 2H-WS2 respectively.51 Raman spectra of other nanomaterials are shown in Fig. S4 (ESI†).
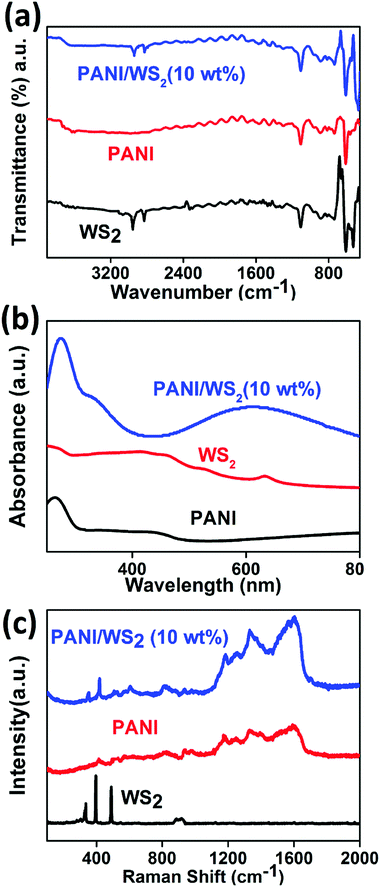 | ||
| Fig. 3 (a) FTIR response, (b) UV-Vis spectra and (c) Raman spectra of exfoliated WS2 nanosheets, PANI/WS2 (10 wt%) nanocomposite and PANI nanofibers. | ||
The XPS spectrum obtained from a survey scan of a spin coated PANI/WS2 (w/w 10%) sample is shown in Fig. 4(a). The N1s spectrum from the PANI nanofibers in the nanocomposite (Fig. 4(d)) shows three deconvoluted peaks at 401.4 eV, 400.3 eV, and 399.2 eV which correspond to the imine cation (–NH+), radical cation (![[double bond, length as m-dash]](https://www.rsc.org/images/entities/char_e001.gif) NH˙+), and benzenoid amine nitrogen (–N–H–) which confirms that the PANI nanofibers are present in the ES form.52Fig. 4(b) and (c) show the W 4f and S 2p core level spectra which are contributed by WS2 nanosheets in the nanocomposite. The absence of any tungsten atom in the +6 oxidation state confirms that the WS2 sheets were not oxidized in the process of nanocomposite formation.
NH˙+), and benzenoid amine nitrogen (–N–H–) which confirms that the PANI nanofibers are present in the ES form.52Fig. 4(b) and (c) show the W 4f and S 2p core level spectra which are contributed by WS2 nanosheets in the nanocomposite. The absence of any tungsten atom in the +6 oxidation state confirms that the WS2 sheets were not oxidized in the process of nanocomposite formation.
 | ||
| Fig. 4 (a) High resolution XPS surface scan, (b) W 4f core level, (c) S 2p core level, and (d) N 1s core level in the PNI/WS2 (10 wt%) nanocomposite. | ||
3.2. Ammonia sensing performance
To observe the sensing performance of the PANI/WS2 nanocomposite, it was drop cast onto gold IDEs and placed in a stainless steel chamber. The set-up for gas sensing measurement is shown in Fig. 5 (more details are available in the ESI†). A bias voltage of 5 volts was applied to the device during electrical measurements. Before gas testing, the baseline (resistance of the sensing layer in the absence of the target gas) of the sensor was made stable for 4 hours by purging dry air into the chamber.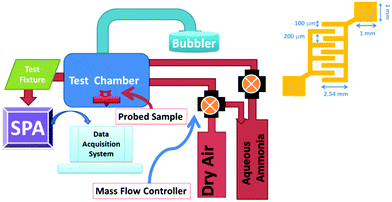 | ||
| Fig. 5 Schematic diagram of the in-house gas sensing unit and dimensions of interdigitated electrodes (inset). | ||
Current (I)–voltage (V) characteristics of all the devices were measured to ascertain proper electrical connection. All devices showed ohmic characteristics at room temperature as shown in Fig. S6 (ESI†). Aqueous ammonia vapours and dry ammonia gas were used for the measurement at seven different ammonia concentrations ranging from 50 to 200 ppm. The target gas was kept on for 20 minutes followed by 40 minutes off time (purging with dry air). The response of the device was calculated as
 | (1) |
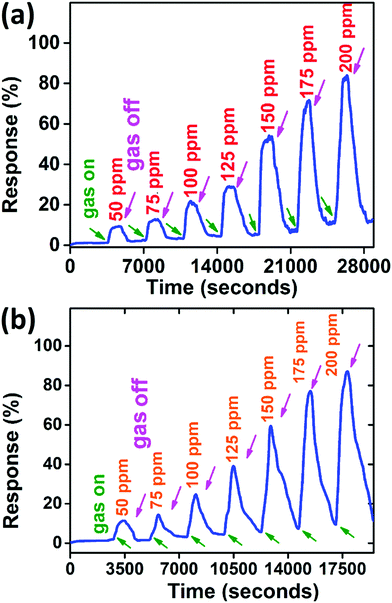 | ||
| Fig. 6 Response from the PANI/WS2 (10 wt%) sample (a) with aqueous ammonia and (b) with dry ammonia. | ||
An enhancement in the response of only 1.5–7% was observed as compared to aqueous ammonia vapours and the response was found to be varying between 11.5% (for 50 ppm dry ammonia gas concentration) and 87.2% (for 200 ppm dry ammonia concentration). This increment in the response can be understood as follows:
The predominant species in aqueous ammonia solution is only ammonia as shown in equilibrium 2.
| NH3(g) + H2O(l) ⇌ NH3(aq) + H2O(l) | (2) |
| NH3(aq) + H2O(l) ⇌ NH4+(aq) + OH−(l) (Kb = [NH4+][OH−]/NH3) | (3) |
Since there is not much difference in the relative responses of the sensor in the presence of ammonia vapours and dry ammonia gas, we measured the response of ammonia vapours for other measurements unless otherwise stated. The sensor was also tested at higher temperatures (<100 °C), but the response decreases with increase in temperature (as shown in Fig. 7(a)) which may be attributed to the desorption competing with the adsorption of NH3, hence all measurements were performed at room temperature (22 °C).54
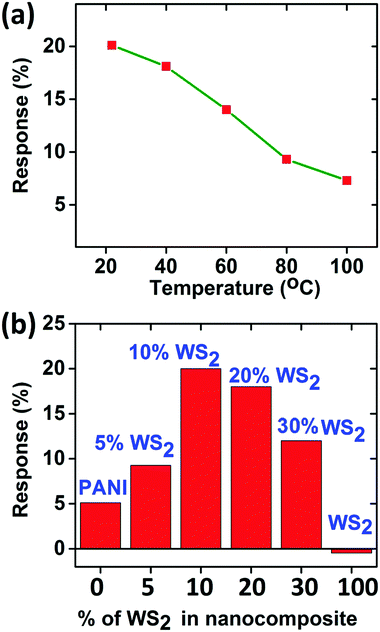 | ||
| Fig. 7 (a) Response at different temperatures for ammonia sensing at 100 ppm concentration, (b) comparison of responses for 100 ppm concentration of ammonia for 0–100 wt% PANI/WS2 composites. | ||
Gas testing was also carried out with pure PANI (dynamic response is shown in Fig. S5, ESI†) and composite samples with different weight percentages of WS2 to investigate the role of WS2 in the composite. It is evident from the histogram in Fig. 7(b) that as the percentage of WS2 increases in the composite, the sensitivity of the device increases, which is valid for relatively lower WS2 contents. However, there is an optimum amount of WS2; otherwise the PANI will no longer be in the continuous phase. In this work, the concentration of WS2 nanosheets was optimized to 10 weight percentage (wt%) of the aniline monomer's weight. The response time and recovery time are defined as the time required for reaching 90% of the total resistance change.55 At room temperature (22 °C), the response time and recovery time for PANI/WS2 (w/w 10%) were found to be 260 s and 790 s respectively when subjected to 100 ppm of ammonia.
The performance of the sensor for ammonia sensing was also evaluated in the presence of humidity, which is discussed in the ESI† in detail. It is evident from Fig. S9(a) (ESI†) that the response decreases slightly when the device is subjected to high humidity (60% RH). This may be due to the competitive sorption of H2O and NH3 molecules at the available active sites of the sensing material. Repeatability, stability, and selectivity are three important characteristics of any gas sensor. Hence, the developed sensor was tested for the above mentioned properties. Fig. 8(a) shows the response of the sensor for five repeated cycles (with 20 minutes gas-on and 40 minutes gas-off time constituting a cycle) at 100 ppm of ammonia concentration.
 | ||
| Fig. 8 (a) Repeatability, (b) stability, (c) selectivity, and (d) response of the sensor (experimental data and linear fit). | ||
The device performance was measured every week for a month. Fig. 8(b) shows the variation of response for 100 ppm ammonia over time. The response was found to be decreased by 3% over one month which may be due to the de-doping of PANI with exposure to ammonia and the partial conversion of ES to EB every time, it was exposed to ammonia ambience.
The device was also tested with common volatile organic compounds (VOCs) at 100 ppm concentration. Fig. 8(c) shows the comparative response of VOCs with ammonia. It is clearly evident that the device is selective towards ammonia. The response was found to be increasing linearly with the concentration of ammonia as shown in Fig. 8(d). The experimental data were fitted with a linear curve and the coefficient of regression was found to be 0.93408 which confirms the highly linear nature of the sensor response. Further we measured the humidity sensing properties of the PANI/WS2 (10%) nanocomposite which is detailed in the ESI.† The current characteristics of the device are opposite to those in the presence of ammonia analyte i.e. the current through the device decreases when it is subjected to dry ammonia gas and ammonia vapours, whereas the current increases when the sensor is subjected to different concentrations of humidity. This increase in current in humid air might be because of proton conductivity.56 Performances of ammonia sensing by the PANI/WS2 polymer–inorganic nanocomposites at room temperature have shown comparable sensing results with some recent reports which are summarized in Table 1.
| Material | Response | Response time (seconds) | Recovery time (seconds) | Transduction technique | Year of publication | Ref. |
|---|---|---|---|---|---|---|
| rGO–Co3O4 composite nanofibers | 53.6%@50 ppm | 4 | 300 | Resistive | 2016 | 58 |
| P3HT–MoS2 composite | 15%@20 ppm | — | 500 | Organic thin film transistors | 2016 | 59 |
| Polypyrrole-reduced graphene oxide hybrid | 50%@10 ppm | — | — | Resistive | 2017 | 60 |
| MoS2/ZnO LbL self assembly | 46.2%@50 ppm | 10 | 11 | Resistive | 2017 | 61 |
| Camphor sulfonic acid-doped PANI/α-Fe2O3 nanocomposite | 72%@100 ppm | 65 | 1575 | Impedance | 2017 | 62 |
| PANI/GO/PANI/ZnO | 38.31%@100 ppm | 30 | — | Impedance | 2017 | 63 |
| PANI–TiO2–Au ternary self-assembly nanocomposite | 15%@1 ppm | 120 | 300 | Resistive | 2017 | 64 |
| PANI-nanofibers/WS2 nanosheets composites | 81%@200 ppm | 260 | 790 | Resistive | This work |
3.3. Proposed mechanism
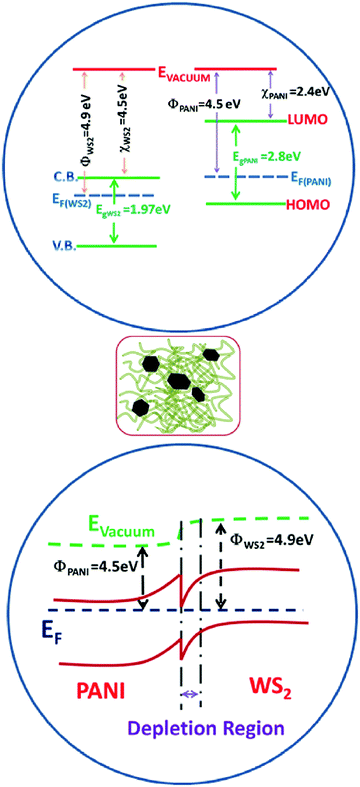
PANI is a p-type conducting polymer with a linear π-conjugated electron system, while WS2 is an n-type semiconductor whose band gap increases with decrease in the number of stacked layers. The increase in resistance in ammonia ambience is due to the fact that NH3 donates electrons to the p-type PANI which causes a decrease in the hole concentration and the deprotonation reaction causes the resistance of PANI to grow. In other words, the electron donation from the reducing gas NH3 causes the conversion of ES to EB to a certain extent thereby reducing its conductivity (as shown in Fig. 9). Also, during the in situ polymerization of p-type PANI on n-type WS2 nanosheets, the formation of p–n heterojunctions occurs which may play an important role in the improvement of gas sensing properties (as shown in Fig. 10). Apart from this heterojunction, other conductive paths may be n–n junctions (between two WS2 nanosheets), p–p junctions (among PANI nanofibers), and grain-voids.57 The reduction in hole concentration in PANI in the NH3 environment causes an increment in the depletion layer width and hence, decreases the number of conducting paths.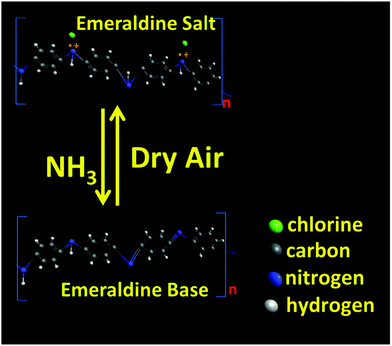 | ||
| Fig. 9 Conversion of emeraldine salt (ES) to emeraldine base (EB) when exposed to ammonia and its retrieval to ES to a certain extent in dry air ambience. | ||
Also, an inter-particle electron transition from WS2 to PANI causes the reduction of the enthalpy of physisorption for NH3 gas and the activation energy.65 It should be noted that with the increase in WS2 nanosheet concentration in the PANI/WS2 nanocomposites, the response increases initially due to the increase in p–n heterojunction interfaces in the sensing material. However, when it is increased further (above 10%) the response starts decreasing significantly (as shown in Fig. 7(b)) which may be due to the hindrance in carrier transport between conjugated chains of PANI nanofibers by WS2 nanoflakes.66
4. Conclusions
A PANI/WS2 nanocomposite was fabricated by in situ polymerization of aniline on liquid exfoliated WS2 nanosheets. It was used as a sensing material in a chemiresistive transduction based gas sensor. The observed response behaviour of the PANI/WS2 (10 wt%) nanocomposite was higher than those of pure PANI and WS2 based devices. It was clearly revealed by the response-recovery behaviour of the device that the WS2 nanosheets influenced the morphological, electrical and chemical properties of PANI nanofibers. The synergistic effect arising due to the presence of WS2 nanosheets in a PANI matrix was explained on the basis of the formation of a p–n heterogeneous structure at the interface of the two nanostructures. The device was found to be highly selective towards ammonia. The performance was stable and the results were highly repeatable when exposed to the same concentration of ammonia several times. The excellent ammonia sensing capability of the device even in a humid environment and when operated at room temperature makes it a suitable candidate for environmental monitoring.Conflicts of interest
There are no conflicts to declare.Acknowledgements
The authors acknowledge the Central Research Facility (CRF) at IIT Kharagpur for providing characterization facilities. R. K. Jha acknowledges Dr S. Santra, Ramanujan Fellow, Department of Physics and Meteorology, IIT Kharagpur, for her valuable suggestions. P. K. Guha is thankful to SRIC, IIT Kharagpur, for an ISIRD grant to partially support this work. We are also grateful to the DST-FIST laboratory (located at Dept. of Physics and Meteorology, IIT Kharagpur) for XPS measurements.Notes and references
- M. J. Fedoruk, R. Bronstein and B. D. Kerger, J. Exposure Sci. Environ. Epidemiol., 2005, 15, 534–544 CrossRef CAS PubMed.
- J. Wang, P. Yang and X. Wei, ACS Appl. Mater. Interfaces, 2015, 7, 3816–3824 CAS.
- B. Timmer, W. Olthuis and A. Van den Berg, Sens. Actuators, B, 2005, 107, 666–677 CrossRef CAS.
- Honeywell, Manning EC-F9-NH3 Sensor, http://www.honeywellanalytics.com/en/products/Manning-EC-F9-NH3, accessed: April 2017.
- Alphasense, NH3-B1 Ammonia Sensor, http://www.alphasense.com/WEB1213/wp-content/uploads/2017/03/NH3-B1.pdf, accessed: April 2017.
- R. Bogue, Sens. Rev., 2001, 21, 98–104 CrossRef.
- D. Wang, W. Symons, R. Farhat and S. Yao, US Pat., US20070080074A1, 2007 Search PubMed.
- Delphi, Ammonia Sensor, http://www.delphi.com/docs/default-source/old-delphi-files/ce0eeddf-9bf0-4bf2-a1f1-f45d508f1af6-pdf, accessed: April 2017.
- N. Murakami, K. Tanaka and K. Ihokura, US Pat., US4459577 A, 1984 Search PubMed.
- Y. Vashpanov, H. Choo and D. S. Kim, Sensors, 2011, 11, 10930–10939 CrossRef CAS PubMed.
- C. Wang, L. Yin, L. Zhang, D. Xiang and R. Gao, Sensors, 2010, 10, 2088–2106 CrossRef CAS PubMed.
- G. Korotcenkov, Mater. Sci. Eng., B, 2007, 139, 1–23 CrossRef CAS.
- J. W. Gardner, P. K. Guha, F. Udrea and J. A. Covington, IEEE Sens. J., 2010, 10, 1833–1848 CrossRef CAS.
- S. Z. Ali, S. Santra, I. Haneef, C. Schwandt, R. Kumar, W. Milne, F. Udrea, P. K. Guha, J. A. Covington and J. Gardner, Eighth IEEE SENSORS Conference, Institute of Electrical and Electronics Engineers, Christchurch, New Zealand, 2009.
- S. Santra, A. De Luca, S. Bhaumik, S. Ali, F. Udrea, J. Gardner, S. Ray and P. Guha, RSC Adv., 2015, 5, 47609–47616 RSC.
- Z. Pang, Z. Yang, Y. Chen, J. Zhang, Q. Wang, F. Huang and Q. Wei, Colloids Surf., A, 2016, 494, 248–255 CrossRef CAS.
- J. Zhang, X. Liu, G. Neri and N. Pinna, Adv. Mater., 2016, 28, 795–831 CrossRef CAS PubMed.
- N. B. Shustova, A. F. Cozzolino, S. Reineke, M. Baldo and M. Dinca, J. Am. Chem. Soc., 2013, 135, 13326-–13329 CrossRef CAS PubMed.
- S. Wang, Y. Kang, L. Wang, H. Zhang, Y. Wang and Y. Wang, Sens. Actuators, B, 2013, 182, 467–481 CrossRef CAS.
- J. Samà, S. Barth, G. Domènech-Gil, J.-D. Prades, N. López, O. Casals, I. Gràcia, C. Cané and A. Romano-Rodríguez, Sens. Actuators, B, 2016, 232, 402–409 CrossRef.
- I. Fratoddi, I. Venditti, C. Cametti and M. V. Russo, Sens. Actuators, B, 2015, 220, 534–548 CrossRef CAS.
- J. J. Miasik, A. Hooper and B. C. Tofield, J. Chem. Soc., Faraday Trans. 1, 1986, 82, 1117–1126 RSC.
- P. Kunzo, P. Lobotka, E. Kovacova, K. Chrissopoulou, L. Papoutsakis, S. H. Anastasiadis, Z. Krizanova and I. Vavra, Phys. Status Solidi B, 2013, 210, 2341–2347 CrossRef CAS.
- J. Zhang, S. Wang, M. Xu, Y. Wang, H. Xia, S. Zhang, X. Guo and S. Wu, J. Phys. Chem. C, 2009, 113, 1662–1665 CAS.
- C. Murugan, E. Subramanian and D. P. Padiyan, Synth. Met., 2014, 192, 106–112 CrossRef CAS.
- J. Hatfield, P. Neaves, P. Hicks, K. Persaud and P. Travers, Sens. Actuators, B, 1994, 18, 221–228 CrossRef CAS.
- R. Kohlman and A. J. Epstein, Insulator-metal transition and inhomogeneous metallic state in conducting polymers, Marcel Dekker, New York, 1998 Search PubMed.
- J. Janata and M. Josowicz, Nat. Mater., 2003, 2, 19–24 CrossRef CAS PubMed.
- M. Gao, L. Dai and G. G. Wallace, Electroanalysis, 2003, 15, 1089–1094 CrossRef CAS.
- Z. Wu, X. Chen, S. Zhu, Z. Zhou, Y. Yao, W. Quan and B. Liu, Sens. Actuators, B, 2013, 178, 485–493 CrossRef CAS.
- A. A. Syed and M. K. Dinesan, Talanta, 1991, 38, 815–837 CrossRef CAS PubMed.
- J.-P. Travers, F. Genoud, C. Menardo and M. Nechtschein, Synth. Met., 1990, 35, 159–168 CrossRef CAS.
- S. Cui, J. Wang and X. Wang, RSC Adv., 2015, 5, 58211–58219 RSC.
- S. Pawar, M. Chougule, S. Patil, B. Raut, P. Godse, S. Sen and V. Patil, IEEE Sens. J., 2011, 11, 3417–3423 CrossRef CAS.
- S. Pawar, S. Patil, M. Chougule, P. Godse, D. Bandgar and V. Patil, J. Nano- Electron. Phys., 2011, 3, 1056 Search PubMed.
- D. N. Huyen, N. T. Tung, N. D. Thien and L. H. Thanh, Sensors, 2011, 11, 1924–1931 CrossRef CAS PubMed.
- D. Voiry, H. Yamaguchi, J. Li, R. Silva, D. C. Alves, T. Fujita, M. Chen, T. Asefa, V. B. Shenoy and G. Eda, Nat. Mater., 2013, 12, 850–855 CrossRef CAS PubMed.
- D. J. Late, Y.-K. Huang, B. Liu, J. Acharya, S. N. Shirodkar, J. Luo, A. Yan, D. Charles, U. V. Waghmare, V. P. Dravid and C. N. R. Rao, ACS Nano, 2013, 7, 4879–4891 CrossRef CAS PubMed.
- J. Ravindra Kumar and G. Prasanta Kumar, Nanotechnology, 2016, 27, 475503 CrossRef PubMed.
- K. Gopalakrishnan, S. Sultan, A. Govindaraj and C. N. R. Rao, Nano Energy, 2015, 12, 52–58 CrossRef CAS.
- M. Kim, Y. K. Kim, J. Kim, S. Cho, G. Lee and J. Jang, RSC Adv., 2016, 6, 27460–27465 RSC.
- H. R. Gutiérrez, N. Perea-López, A. L. Elías, A. Berkdemir, B. Wang, R. Lv, F. López-Urías, V. H. Crespi, H. Terrones and M. Terrones, Nano Lett., 2013, 13, 3447–3454 CrossRef PubMed.
- A. Abdolahi, E. Hamzah, Z. Ibrahim and S. Hashim, Materials, 2012, 5, 1487–1494 CrossRef CAS.
- H. Chaudhari and D. Kelkar, J. Appl. Polym. Sci., 1996, 62, 15–18 CrossRef CAS.
- A. Mostafaei and A. Zolriasatein, Prog. Nat. Sci.: Mater. Int., 2012, 22, 273–280 CrossRef.
- Z. He, X. Wang, W. Xu, Y. Zhou, Y. Sheng, Y. Rong, J. M. Smith and J. H. Warner, ACS Nano, 2016, 10, 5847–5855 CrossRef CAS PubMed.
- S. Stafström, J. L. Brédas, A. J. Epstein, H. S. Woo, D. B. Tanner, W. S. Huang and A. G. MacDiarmid, Phys. Rev. Lett., 1987, 59, 1464–1467 CrossRef PubMed.
- G. Ćirić-Marjanović, M. Trchová and J. Stejskal, J. Raman Spectrosc., 2008, 39, 1375–1387 CrossRef.
- J. Zhang, C. Liu and G. Shi, J. Appl. Polym. Sci., 2005, 96, 732–739 CrossRef CAS.
- M. C. Bernard and A. Hugot-Le Goff, Electrochim. Acta, 2006, 52, 595–603 CrossRef CAS.
- D. Mao, Y. Wang, C. Ma, L. Han, B. Jiang, X. Gan, S. Hua, W. Zhang, T. Mei and J. Zhao, Sci. Rep., 2015, 5, 7965 CrossRef CAS PubMed.
- S. Cho, O. S. Kwon, S. A. You and J. Jang, J. Mater. Chem. A, 2013, 1, 5679–5688 CAS.
- K. Emerson, R. C. Russo, R. E. Lund and R. V. Thurston, J. Fish. Res. Board Can., 1975, 32, 2379–2383 CrossRef CAS.
- M. Matsuguchi, J. Io, G. Sugiyama and Y. Sakai, Synth. Met., 2002, 128, 15–19 CrossRef CAS.
- O. SeokáKwon and S. JooáPark, Chem. Commun., 2012, 48, 10526–10528 RSC.
- J. Travers and M. Nechtschein, Synth. Met., 1987, 21, 135–141 CrossRef CAS.
- D. H. Yoon, J. H. Yu and G. M. Choi, Sens. Actuators, B, 1998, 46, 15–23 CrossRef CAS.
- T. A. Shifa, F. Wang, K. Liu, K. Xu, Z. Wang, X. Zhan, C. Jiang and J. He, Small, 2016, 12, 3802–3809 CrossRef CAS PubMed.
- X. Tao, X. Guangzhong, S. Yuanjie, H. Du, Y. Zongbiao and J. Yadong, Nanotechnology, 2016, 27, 065502 CrossRef PubMed.
- J. Sun, X. Shu, Y. Tian, Z. Tong, S. Bai, R. Luo, D. Li and C. C. Liu, Sens. Actuators, B, 2017, 241, 658–664 CrossRef CAS.
- D. Zhang, C. Jiang and Y. E. Sun, J. Alloys Compd., 2017, 698, 476–483 CrossRef CAS.
- D. K. Bandgar, S. T. Navale, Y. H. Navale, S. M. Ingole, F. J. Stadler, N. Ramgir, D. K. Aswal, S. K. Gupta, R. S. Mane and V. B. Patil, Mater. Chem. Phys., 2017, 189, 191–197 CrossRef CAS.
- R. S. Andre, F. M. Shimizu, C. M. Miyazaki, A. Riul Jr, D. Manzani, S. J. L. Ribeiro, O. N. Oliveira Jr, L. H. C. Mattoso and D. S. Correa, Sens. Actuators, B, 2017, 238, 795–801 CrossRef CAS.
- C. Liu, H. Tai, P. Zhang, Z. Ye, Y. Su and Y. Jiang, Sens. Actuators, B, 2017, 246, 85–95 CrossRef CAS.
- H. Tai, Y. Jiang, G. Xie, J. Yu, X. Chen and Z. Ying, Sens. Actuators, B, 2008, 129, 319–326 CrossRef CAS.
- M. O. Ansari and F. Mohammad, Sens. Actuators, B, 2011, 157, 122–129 CrossRef CAS.
Footnote |
| † Electronic supplementary information (ESI) available. See DOI: 10.1039/c7nj03343e |
| This journal is © The Royal Society of Chemistry and the Centre National de la Recherche Scientifique 2018 |

