A design of experiment approach for efficient multi-parametric drug testing using a Caenorhabditis elegans model†
M. C.
Letizia
 ,
M.
Cornaglia
,
G.
Tranchida
,
R.
Trouillon
,
M.
Cornaglia
,
G.
Tranchida
,
R.
Trouillon
 and
M. A. M.
Gijs
 *
*
Microsystems Laboratory, École Polytechnique Fédérale de Lausanne, EPFL-STI-IMT-LMIS2, Station 17, Ch-1015 Lausanne, Switzerland. E-mail: martin.gijs@epfl.ch
First published on 21st December 2017
Abstract
When studying the drug effectiveness towards a target model, one should distinguish the effects of the drug itself and of all the other factors that could influence the screening outcome. This comprehensive knowledge is crucial, especially when model organisms are used to study the drug effect at a systemic level, as a higher number of factors can influence the drug-testing outcome. Covering the entire experimental domain and studying the effect of the simultaneous change in several factors would require numerous experiments, which are costly and time-consuming. Therefore, a design of experiment (DoE) approach in drug-testing is emerging as a robust and efficient method to reduce the use of resources, while maximizing the knowledge of the process. Here, we used a 3-factor-Doehlert DoE to characterize the concentration-dependent effect of the drug doxycycline on the development duration of the nematode Caenorhabditis elegans. To cover the experimental space, 13 experiments were designed and performed, where different doxycycline concentrations were tested, while also varying the temperature and the food amount, which are known to influence the duration of C. elegans development. A microfluidic platform was designed to isolate and culture C. elegans larvae, while testing the doxycycline effect with full control of temperature and feeding over the entire development. Our approach allowed predicting the doxycycline effect on C. elegans development in the complete drug concentration/temperature/feeding experimental space, maximizing the understanding of the effect of this antibiotic on the C. elegans development and paving the way towards a standardized and optimized drug-testing process.
Insight, innovation, integrationA Design of Experiment (DoE) approach was used to characterize in a microfluidic chip the dose-dependent effect of the doxycycline antibiotic, combined with temperature and concentration of food, on the duration of the larval development of the nematode Caenorhabditis elegans. Our results revealed the relative importance of temperature, food concentration and doxycycline dose on the C. elegans development time, by establishing a mathematical relationship between the three factors. Such a DoE approach allowed us to characterize the effectiveness of the drug, as well as the simultaneous influence of all the considered experimental factors on the treatment outcome. To the best of our knowledge, we think that our paper is the first in which the DoE approach was applied to extensively characterize the effect of a drug on the development time of an animal model in such an automated and systematic fashion. We believe that the use of a DoE approach would tremendously increase the efficiency of drug screening by minimizing the use of the resources – and therefore time and costs – while maximizing the knowledge of the process. |
Introduction
Drug discovery and testing research are mostly based on a one-factor-at-a-time variational approach, in which each experimental parameter is changed at a time, independent of the others.1,2 However, this approach inevitably requires a large number of experiments to cover the entire experimental domain, which makes drug development costly and time-consuming, thus limiting the discovery of interactions with the biological target of choice. Moreover, this technique is less suitable for studying the effect of the simultaneous change in several factors on the final outcome. Overall, the one-factor-at-a-time approach hinders the identification of a causal relationship between the experimental parameters and their influence on the target, or compromises the discovery of interactions between the parameters. A robust alternative to this traditional drug discovery method is given by the design of experiment (DoE) approach, whose application in the quality-oriented pharmacological sector has been recently recommended by the European Medicines Agency.3 In this method, the experimental parameters, called factors, are purposefully varied according to a precise design, in order to understand their effect on the target response, and a mathematical relationship is established between the factors and the response.4 Statistical thinking is therefore required before performing experiments rather than doing it a posteriori, in contrast with a one-factor-at-a-time approach.2 DoE enables minimizing the use of the experimental resources while maximizing the understanding of the process. It allows identifying the significance of each factor and its effect on the experimental outcome, as well as determining the interaction between the factors. Moreover, a DoE study allows interpolation of its findings in a rigorous mathematical way into the complete experimental space.4We focused on characterizing the effect of the antibiotic doxycycline in a variable temperature and food concentration environment on the development time of the nematode Caenorhabditis elegans as an animal model. Doxycycline is mostly employed in animal research to study biological pathways involved in the extension of longevity, and C. elegans represents a powerful model for such aging and metabolic studies,5–8 thanks to its relatively short lifespan of 2–3 weeks.9 Tetracycline antibiotics are generally used to control gene expression in a variety of animal models.7,10 However, apart from targeting bacterial translation, doxycycline also inhibits mitochondrial translation, which is thought to be a key factor in lifespan extension.6,7 Interestingly, it has been shown that doxycycline extends the lifespan of cells, worms, flies, plants and mice in a dose-dependent fashion.7 It is known to induce mitochondrial stress, leading to changes in nuclear gene expression and to severely alter the mitochondrial function in different animal models, including C. elegans and mice, even at low concentrations.7 Gravid worms and progeny were treated with doxycycline at concentrations of 60 μg mL−1 and 120 μg mL−1.11 In both cases, all the larvae arrested their development at the L3 stage, showed impaired gonad development and a dose-dependent delay in larval growth. Houtkooper et al. treated worms with doxycycline (30 μg mL−1 and 60 μg mL−1) for the entire lifespan and noticed a dose-dependent developmental delay and reduced worm respiration, while no abnormalities were observed at lower doses.6 Another group gave doxycycline to a worm population throughout its larval development at concentrations of 5 μg mL−1, 10 μg mL−1, and 15 μg mL−1.7 A dose-dependent decrease in the respiration rate, an increase in the development time and an increase in the percentage of larvae not completing the development were observed. Recently, microfluidic approaches have been used as an alternative to the traditional C. elegans culture on agar plates. Microfluidic chips for worm culture were fabricated and used to test the effect of doxycycline on worms.12 In particular, doxycycline at concentrations of 15 μg mL−1 and 30 μg mL−1 given to worms throughout their larval development dose-dependently delayed the worm growth.12
However, differences in the experimental and environmental parameters combined with a lack of control of the experimental protocols prevent the exact replication of these experiments and therefore limit the upfront comparison of the literature. Temperature13,14 and food amount15,16 are in fact the two most relevant factors that modulate the development and longevity of C. elegans. For example, C. elegans development time can be 52% shorter at 25 °C than at 16 °C, and 23% shorter at 20 °C than at 16 °C.13C. elegans larvae sense the concentration of E. coli bacteria, exerting a severe effect on their development time.17 Under-fed worms can reach adulthood in twice the time taken by normally fed worms under the same temperature conditions.18 Severe underfeeding conditions may even lead to a non-physiological development of the organism. On the other hand, overfeeding of wild-type C. elegans may reduce their lifespan by 10–20%,19 and long-term overfeeding may eventually result in bacterial accumulation in the worm's mouth and intestine, leading to a diseased state.18,20 Moreover, the combination of temperature and feeding amount has important effects on the development and lifespan of C. elegans. Low temperature and dietary restriction activate C. elegans pathways that eventually lead to a slower development and ultimately to a longer lifespan.16,21 However, interestingly, also exposure to high temperature, e.g. 25 °C, if combined with food deprivation and crowding during the larval development, may arrest the development or reversibly shift it towards a long-lasting state of diapause called a dauer stage.22,23
A precise dose-dependent characterization of the effect of doxycycline on C. elegans, with full control of the experimental parameters, namely temperature and feeding, is hence essential to provide rigorous culture conditions but is currently lacking. The possibility of parallelizing and automating the experiments promotes microfluidic platforms as the most efficient tool to enable such a systematic characterization. Most of the experimental repertoire was obtained from traditional C. elegans cultures on a solid medium where the food amount is not quantified but is usually abundant.13 Finding the right feeding protocol under liquid conditions that correspond to culture on solid agar plates is not straightforward and requires optimization. However, such a characterization is of primary importance for performing reproducible experiments and comparing the results, to disentangle any variation in food concentration and temperature from the tested drug response. Moreover, after performing a DoE analysis using controlled liquid media to culture worms, the correct drug dose that has to be used to achieve the desired outcome can be predicted, therefore avoiding either side effects due to over-dosage or ineffective treatments due to sub-optimal drug concentrations.
In this study, we investigated the role of doxycycline in C. elegans development, in combination with variations in temperature and concentration of E. coli as the food source in a microfluidic platform. A 3-factor Doehlert DoE was chosen to characterize the effect of those 3 factors on worm development. We designed a microfluidic chip enclosed in a custom-made thermal incubator to culture C. elegans larvae with full control of the experimental parameters, especially temperature and injected food amount. Our results revealed the relative importance of temperature, food concentration and doxycycline dose on the C. elegans development time. In particular, while doxycycline dose and temperature exerted a significant to severe effect on the duration of larval development, no significant development dependence on the E. coli concentration in the investigated range was found.
Materials and methods
Experimental design
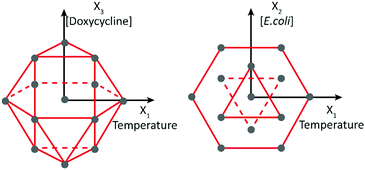
The factors under consideration were temperature (X1), the concentration of E. coli used as nutrient (X2) and the concentration of doxycycline (X3). Temperature was considered in the range of 15–25 °C, known as the characteristic range for C. elegans survival.13 The E. coli concentration was considered in the range of 2–6 × 10⁹ cells per mL, as values in this range were previously used to culture C. elegans worms in microfluidic chips.24 Finally, given the doxycycline concentrations used in the previously reported experiments, the range of 5–60 μg mL−1 was chosen for this third factor. The response (Y) was identified as the duration of larval development, expressed in hours, from stage L1 until the onset of adulthood and production of the first progeny. The application of a factorial 3-factor Doehlert design was well-suited to characterize the synergic effect of temperature and concentrations of E. coli and doxycycline on the larval development, as it offers a uniform distribution of points in the experimental domain. With k being the number of factors, the Doehlert design requires k2 + k + 1 number of experiments, 13 in our 3-factor case. These 13 combinations can be geometrically positioned in the experimental space as the vertices of a cubo-octahedron, as represented in Fig. 1.The coordinates used in the DoE model, called coded values, as well as the corresponding real experimental values of temperature, E. coli concentration and doxycycline concentration, are given in the model matrix in Table 1. Typically, the coded value 1 corresponds to the highest value of an experimental parameter, −1 to the lowest value and 0 to the linearly extrapolated center point.
| No. | Coded values | Experimental parameter values | |||||
|---|---|---|---|---|---|---|---|
| X 1 | X 2 | X 3 | Temp. °C | [E. coli] × 109 cells per mL | [Dox]/μg mL−1 | [Dox]/(μM) | |
| 1 | 0 | 0 | 0 | 20 | 4 | 32.5 | 63.4 |
| 2 | 1 | 0 | 0 | 25 | 4 | 32.5 | 63.4 |
| 3 | 0.5 | 0.866 | 0 | 22.5 | 5.73 | 32.5 | 63.4 |
| 4 | 0.5 | 0.289 | 0.816 | 22.5 | 4.58 | 54.96 | 107.1 |
| 5 | −1 | 0 | 0 | 15 | 4 | 32.5 | 63.4 |
| 6 | −0.5 | −0.866 | 0 | 17.5 | 2.27 | 32.5 | 63.4 |
| 7 | −0.5 | −0.289 | −0.816 | 17.5 | 3.42 | 10.03 | 19.6 |
| 8 | 0.5 | −0.866 | 0 | 22.5 | 2.27 | 32.5 | 63.4 |
| 9 | 0.5 | −0.289 | −0.816 | 22.5 | 3.42 | 10.03 | 19.6 |
| 10 | −0.5 | 0.866 | 0 | 17.5 | 5.73 | 32.5 | 63.4 |
| 11 | 0 | 0.577 | −0.816 | 20 | 5.15 | 10.03 | 19.6 |
| 12 | −0.5 | 0.289 | 0.816 | 17.5 | 4.58 | 54.96 | 107.1 |
| 13 | 0 | −0.577 | 0.816 | 20 | 2.85 | 54.96 | 107.1 |
The experiments corresponding to the central point [0, 0, 0] were performed three times to test their repeatability. In order to describe the development time Y as a function of the factors, a quadratic polynomial model was constructed, as described by eqn (1):
| ŷ = b0 + b1X1 + b2X2 + b3X3 + b11X12 + b22X22 + b33X32 + b12X1X2 + b13X1X3 + b23X2X3 | (1) |
Design and fabrication of the microfluidic chip
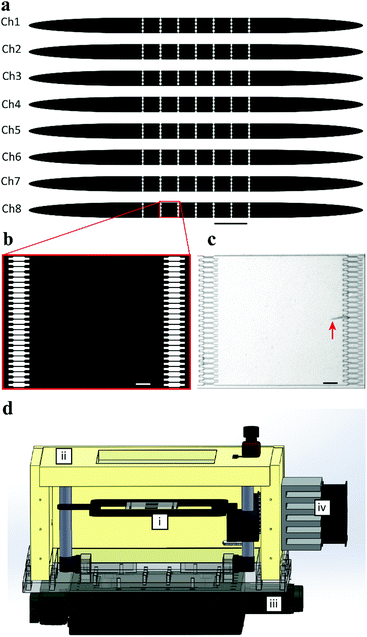
In order to test the 13 combinations of the three factors that contribute to the experimental variability and to unravel the influence on the DoE study, a microfluidic chip dedicated to the on-chip culture of C. elegans throughout its larval development was designed. In fact, compared to heavily manual and laborious traditional C. elegans culture protocols,13 microfluidics enables automated, more robust and reproducible culture experiments.24–26 By matching the channel dimensions with the worm size, C. elegans larvae of the desired stage can be automatically filtered and the population can consequently be synchronized.27 Moreover, by using dedicated syringe pumps, the feeding protocol can be first optimized and standardized, and then repeatedly executed in an automated way.The design of our microfluidic device is shown in Fig. 2a. This chip features 8 independent channels. Each channel is an array of 6 chambers separated by filters, to culture isolated worms and preserve their identity (Fig. 2b). The 8 μm-feature filters are designed to prevent the uncontrolled passage of L1 larvae to the adjacent chamber, as shown in the optical micrograph in Fig. 2c.
The microfluidic chips were prepared by soft lithography.28 First, a mold was fabricated by patterning an 80 μm-thick SU-8 structure on a silicon 4-inch wafer by standard photolithography. Secondly, this mold was used for polydimethylsiloxane (PDMS) casting. We poured a liquid PDMS mixture with a base![[thin space (1/6-em)]](https://www.rsc.org/images/entities/char_2009.gif) :
:![[thin space (1/6-em)]](https://www.rsc.org/images/entities/char_2009.gif) curing agent weight ratio of 10
curing agent weight ratio of 10![[thin space (1/6-em)]](https://www.rsc.org/images/entities/char_2009.gif) :
:![[thin space (1/6-em)]](https://www.rsc.org/images/entities/char_2009.gif) 1, kept for degassing and cured at 100 °C for 1 h. Thirdly, after de-molding, we diced each PDMS chip, punched holes into the PDMS to form inlets and outlets, and bonded each to a glass slide, using air–plasma surface activation. Finally, tubings were plugged into the PDMS holes and the fluidic connections were made, following the protocol described in ref. 12. For feeding the worms and for exposing them to drugs, plastic reservoirs are filled with a suspension of E. coli bacteria in S medium, containing the antibiotic doxycycline.
1, kept for degassing and cured at 100 °C for 1 h. Thirdly, after de-molding, we diced each PDMS chip, punched holes into the PDMS to form inlets and outlets, and bonded each to a glass slide, using air–plasma surface activation. Finally, tubings were plugged into the PDMS holes and the fluidic connections were made, following the protocol described in ref. 12. For feeding the worms and for exposing them to drugs, plastic reservoirs are filled with a suspension of E. coli bacteria in S medium, containing the antibiotic doxycycline.
Experimental setup
A microfluidic setup was integrated into a stereo microscope (SteREO Discovery.V8, Zeiss, Germany) equipped with a camera. A thermal incubator system was designed and manufactured to set and maintain a fixed temperature on the chip and in the reservoirs that contain the bacteria feeding solutions (Fig. 2d). The incubator box was made up of extruded polystyrene. The top and bottom of the incubator box featured a transparent polymethyl methacrylate (PMMA) window to allow microscopic observation of the chip inside. The incubator was fixed to an xy motorized stage (Standa, Lithuania). A temperature sensor (AD22100, Analog Devices, US) was placed in contact with the glass side of the chip for monitoring the temperature of the microfluidic device. The temperature signal was exploited to set the power provided to a thermoelectric module in a closed-loop configuration, for active control and constant monitoring of the temperature experienced by the worms inside the chip. A dedicated proportional–integral–derivative (PID) controller (see Fig. S1, ESI†) was designed to manage the temperature conditions.The microfluidic operations were controlled using a Kloehn pump (Norgren Kloehn, USA) and Micro-Manager microscopy software. The acquisition system was programmed so that brightfield pictures of each chamber were taken every 20 min.
Microfluidic experimental protocol
Initially, after sterilization by injection of 70% ethanol, the microfluidic chip was filled with S medium. L1 larvae were harvested from the culture plate and suspended in the S medium. Afterwards, they were injected into each channel from the corresponding inlet and distributed along the array by applying 1 s flow pulses of 2 μL inflow, to let the PDMS filters expand and the L1 larvae pass through, as described in ref. 12. We consistently obtained a uniform distribution of the larvae over the array, confining worms in separate chambers along each microfluidic line. Doing so, we prevented overcrowding and ensured proper worm growth. Typically, 1 to 3 worms get confined in each chamber, with about 15% of empty chambers and about 65% of the chambers containing 1 isolated worm. Each channel was then perfused with a flow of E. coli bacteria suspended in S medium, containing also the antibiotic doxycycline. The feeding protocol consisted of injecting 8 μL of bacterial solution at a flow rate of 100 nL s−1 every 30 min. Depending on the temperature conditions, different concentrations of E. coli and doxycycline were used, according to the combinations listed in Table 1. For example, runs 3, 4, 8 and 9 were performed simultaneously at a set temperature of 22.5 °C.C. elegans experimental model and subject details
C. elegans strain was cultured at 20 °C on nematode growth media (NGM) 90 mm Petri dishes seeded with the Escherichia coli strain OP50 (RRID = WB-STRAIN:OP50). The strain used in this study was the N2 strain, provided by the Caenorhabditis Genetics Center (University of Minnesota). Before starting the experiments, the plates were washed with S medium and L1 worms were harvested.E. coli culture
HT115 E. coli bacteria (RRID = WB-STRAIN:HT115) were grown overnight in Luria Broth (LB) with 100 μg mL−1 ampicillin and 12.5 μg mL−1 tetracycline in a thermal shaker at 37 °C. The following day, 50 μL of the confluent bacterial cultures were used to inoculate a freshly prepared LB medium containing only ampicillin. The new cultures were grown until an optical density between 0.6 and 0.8 was attained, and 90 μL were used for seeding the experimental plates. After the overnight culture, 50 mL of the bacterial cultures were centrifuged to remove LB; in this way, bacterial samples with the desired optical density were obtained by adding S medium accordingly. The concentration of each bacterial solution was measured using a commercial spectrophotometer (WPA CO8000, Biochrom, UK).Quantification and statistical analysis
The validity of the quadratic polynomial model in relation to the experimental data was assessed upon the analysis of variance (ANOVA), performed using a built-in Matlab function. The average value of each of the 13 conditions was used. The normality of the data distribution in each dataset was assessed by using the Matlab built-in function to display the quantiles of the sample and the theoretical quantiles from a normal distribution in a quantile–quantile plot (see Fig. S2, ESI†). For each experimental run, the dataset was obtained from the worms uniformly distributed along 2 channels of the same chip. The sample number N indicates the number of independent biological samples for each experimental run. Statistical significance was determined with a 2-way ANOVA with Tukey's correction for multiple comparisons using GraphPad Prism. The adjusted p-values are displayed in Table S3 of the ESI†.Results and discussion
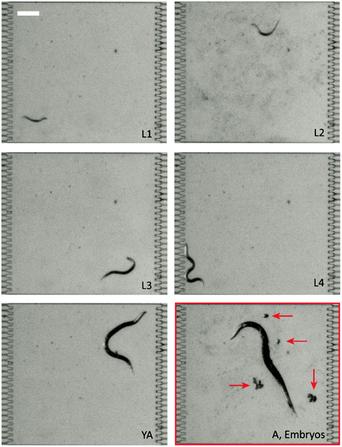
The larval development was monitored for each C. elegans worm in the chamber array. Under all the 13 conditions that we tested, the worms completed their development. All the larval stages (L1, L2, L3, and L4) were observed, as well as the young adult (YA) stage and adulthood (A), with the production of progeny in the microfluidic chamber (Fig. 3).The image stacks generated by combining all images of a given chamber over time were processed in order to measure the duration of larval development. Completion of the latter was identified by the observation of the first progeny production, i.e. eggs being laid in the chamber. For each experimental condition, the readout was obtained by averaging the development time of all the investigated animals. The experimental development times can be considered as the components of a vector and are shown in the left column of Table 2. From these results, we calculated the coefficients of the quadratic polynomial model using eqn (1) (Table S2, ESI†). Afterwards, the development times corresponding to each of the conditions were calculated from this quadratic model, as shown in the right column of Table 2.
| Experimental development time Y [h] | Interpolated values of development time as obtained using eqn (1) [h] | |
|---|---|---|
| Average ± SD (N) | Ŷ | |
| 1 | 95.8 ± 2.8 (11 + 13 + 12) | 95.8 |
| 2 | 80.9 ± 2.6 (12) | 80.0 |
| 3 | 89.8 ± 3.7 (13) | 89.2 |
| 4 | 103.3 ± 2.4 (12) | 104.7 |
| 5 | 115 ± 3.5 (14) | 115.8 |
| 6 | 109 ± 2.7 (12) | 109.6 |
| 7 | 80.5 ± 2.2 (14) | 79.1 |
| 8 | 92.4 ± 1.6 (12) | 90.9 |
| 9 | 63.5 ± 3.3 (13) | 65.7 |
| 10 | 104.9 ± 3.4 (14) | 106.3 |
| 11 | 66.3 ± 4.1 (12) | 65.4 |
| 12 | 129.3 ± 4.0 (13) | 127.1 |
| 13 | 110.6 ± 2.3 (14) | 111.4 |
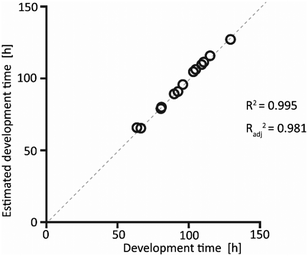
The interpolated data obtained from the model showed excellent fitting with the experimentally measured values, as shown in Fig. 4. This confirms that choosing a quadratic model was a correct assumption, as this model accounts for the recorded data.
To determine the contribution of each factor to the experimental data, an analysis of variance (ANOVA) was performed (see the explanation of this method in the ESI†). The results are presented in Table 3. The analysis of the Sum of Square (SS) and the Mean Square (MS) values, both giving information about the total variance of the observation, revealed that X1 and X3, respectively the temperature and the doxycycline concentration, had an effect on the larval development time, as their SS and MS are more than 100 times larger than the SS and MS of the error.
| Sum of square | DoF | Mean square | F | p-Value | |
|---|---|---|---|---|---|
| X 1 | 1276.79 | 1 | 1276.79 | 178.56 | 0.000905 |
| X 2 | 8.43 | 1 | 8.43 | 1.17 | 0.356937 |
| X 3 | 2947.96 | 1 | 2947.96 | 412.27 | 0.000261 |
| X 1 X 2 | 0.62 | 1 | 0.62 | 0.08 | 0.786475 |
| X 1 X 3 | 20.81 | 1 | 20.81 | 2.91 | 0.186533 |
| X 2 X 3 | 44.23 | 1 | 44.23 | 6.18 | 0.088702 |
| X 1 2 | 2.93 | 1 | 2.93 | 0.41 | 0.567483 |
| X 2 2 | 8.53 | 1 | 8.53 | 1.19 | 0.354517 |
| X 3 2 | 32.46 | 1 | 32.46 | 4.53 | 0.122926 |
| Error | 21.45 | 3 | 7.15 | 1 | 0.5 |
These considerations are also supported by the analysis of the p-values, as high significance was observed for X1 and X3. Interestingly, the second-order interactions between the factors did not have a significant effect on the larval development time. The overall p-value of the model, computed as 0.00258, confirmed the high accuracy of the quadratic polynomial model, as confirmed by the coefficient of determination Radj2 = 0.981.
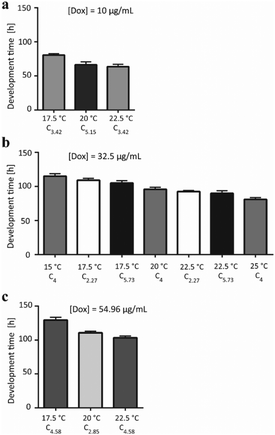
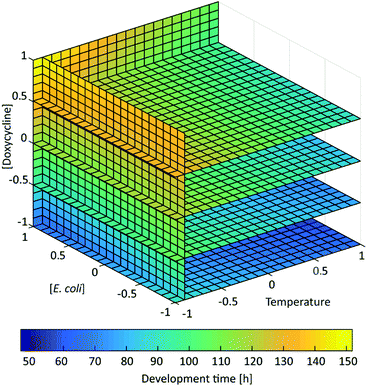
The results obtained for the 13 tested conditions were then compared by grouping them according to the doxycycline dose used and by ordering them for increasing temperature (Fig. 5). Moreover, in order to appreciate the effect of the 3 factors on the worm development in a more comprehensive fashion, the response was color-coded and represented in the experimental space by interpolating the different experimental conditions from eqn (1) (Fig. 6). This representation allows determining the interpolated development time for any combination of the 3 factors, beyond the 13 cases chosen in Table 1. The process behavior can be evaluated within the fully investigated experimental domain.
The shortest development time was obtained when worms were treated with the lowest dose of doxycycline and at high temperature (Fig. 5a and the dark blue area in Fig. 6). By comparing the development time in Fig. 5a–c, a progressively dramatic increase in the development time can be observed in correspondence with the increasing amount of doxycycline. In particular, the longest development time was obtained upon treatment with the highest doxycycline dose and at the lowest temperature (Fig. 5c and the yellow area in Fig. 6). In contrast to the roles of temperature and doxycycline, the developmental delay is not feeding-dependent for the used concentrations of bacteria. Similarly, in the color-coded representation of development time in Fig. 6, points corresponding to the same development time are described by different coordinates along the [E. coli] axis, confirming that food amount does not alter the duration of the development. Moreover, for a few experimental runs, development times showing no significant difference (p-value > 0.05; see Table S3, ESI†) were obtained. This occurred in pairs of independent experiments (run 6–run 10 and run 8–run 3) when the worms were exposed to the same amount of doxycycline, the same temperature and double E. coli concentrations, confirming that feeding – in the considered range of bacterial concentrations – does not play a significant role. The development times were also not statistically different when the worms were treated either with a low doxycycline dose at a low temperature level or with higher doxycycline dose at a higher temperature (run 7–run 2, run 6–run 13, and run 10–run 4). This finding suggests that the effect of the high temperature can counterbalance the impact of a strong antibiotic concentration.
These findings were supported by the isosurface–response representation shown in Fig. 7, where experimental points corresponding to the same larval development time lie on the same colored surface. This representation highlights all the possible combinations of the parameters that must be used to achieve a desired effect on the larval development time.
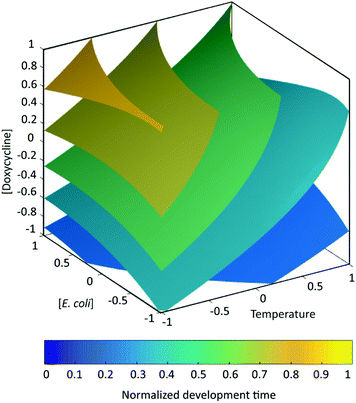 | ||
| Fig. 7 Isosurface representation of the normalized interpolated larval development time as a function of temperature, E. coli concentration and doxycycline concentration. The response is re-scaled between 0 and 1, so that these values represent the minimum and maximum development duration respectively. The factors are considered in their coded values (see Table 1). | ||
Conclusions
In this study, we used a DoE approach to characterize the effect of temperature, concentration of E. coli and dose of doxycycline antibiotic on the duration of the larval development of the nematode C. elegans. In particular, a Doehlert design was chosen to characterize the effect of those 3 factors on worm development. A microfluidic chip enclosed in a custom-made thermal incubator was designed to culture C. elegans larvae with full control of the experimental parameters.Our results confirmed the severe dose-dependent effect of doxycycline on the duration of larval development, making the concentration of doxycycline the major controlling factor (p-value = 0.000905). Indeed, worms treated with the highest doxycycline dose (54.96 μg mL−1) took about 65% more time to develop, compared to worms treated with the lowest dose (10 μg mL−1) at the same temperature. A milder but highly significant effect (p-value = 0.000905) on the larval development was induced by temperature. In fact, worms cultured at 15 °C took 42% more time to develop than the ones cultured at 25 °C and treated with the same doxycycline dose.
On the other hand, the concentration of food did not affect the larval development time. This finding allows us to conclude that E. coli concentrations in the range of 2–6 × 10⁹ cells per mL can be safely used in microfluidic culture protocols, without significantly affecting the development time. This could be considered as the appropriate feeding range for microfluidic cultures, as it prevented either underfeeding or bacterial gut invasion.
Our DoE approach has established a mathematical relationship between the larval development time and culture temperature, food concentration and drug dose, requiring only 13 well-designed experiments to characterize the treatment outcome. When performing the experiments, 3, 5 or 7 different levels (values) were varied for each factor over the 13 experiments (see Table 1). On the other hand, according to the standard one-factor-at-a-time approach, where only one factor is changed and the outcome is not interpolated over the full breadth of the experimental space, to explore the full combinations of three factors, each assuming 3, 5 and 7 levels (Table 1), 105 (3 × 5 × 7) experiments would have been necessary. At the same “experimental” cost (13 experiments), the standard approach would have allowed only about 2 levels for each factor, providing therefore very limited information on the control of the development time. Practically, as the fitted polynomial then allows the interpolation of any point in the considered experimental range with a very limited error; this allows the continuous exploration of the experimental setting and the identification of a possible ideal operation point.
Our analysis showed that there are only limited interactions between the different factors. It is worth noticing, however, that the ANOVA showed a p-value of 0.088 for the interaction between food amount and doxycycline dose. This p-value is too high to indicate a relevant impact, but is the third lowest recorded in the analysis. This may hint that there may be some interactions beyond the boundaries of the experimental space that we considered here. Indeed, a higher dose of doxycycline, which is an antibiotic, might damage or kill the bacteria and make them less nutritious for the worms, possibly affecting their life cycle. This fine contribution would have been impossible to observe with a standard experimental approach, thus highlighting the relevance of DoE and quadratic fitting.
Moreover, the DoE approach predicted the process behavior in the experimental space, by revealing the drug effect even upon additional combinations of experimental factors, not limiting the study to the 13 tested conditions. We believe that the use of a DoE approach would therefore tremendously increase the efficiency of a drug screening process, by minimizing the use of the resources – and therefore costs – while maximizing the knowledge of the process.
In this endeavor, the use of microfluidic platforms represents a crucial step towards the standardization and optimization of the drug testing protocols based on the use of small model organisms such as C. elegans. Thanks to our microfluidic platform, we automated the C. elegans culture and delivered the drug doxycycline in a precise spatio-temporal way. Moreover, our microfluidic device enabled reducing the overall drug-testing time, by parallelizing the experiments. In fact, not only were multiple animals simultaneously exposed to the same compound, but multiple conditions were also tested in parallel within independent channels of the same device. Continuous longitudinal monitoring throughout the entire larval development was performed and other phenotypes of interest could be extracted in principle via image processing. We believe that such a systematic drug dose test, following the principles of a DoE approach, would have high added value to predict the optimal conditions to eventually use in follow-up targeted drug experiments. This prior knowledge is instrumental in ensuring the drug effectiveness and disentangle its effect from any undesired effects of other possible contributors.
Conflicts of interest
M. A. M. G. and M. C. have an International Patent Application no. PCT/WO 2016/063199 A1, filed on October 20th 2014 as provisional application no. PCT/IB214/065472, for a device that is related to this work.Acknowledgements
The authors would like to thank Prof. J. M. Fuerbringer for the introduction to the Design of Experiment approach, L. Mouchiroud for his help with the worm preparation and Dr E. Montinaro and Dr E. Rollo for the fruitful discussions about the project. Work was supported by the Ecole Polytechnique Fédérale de Lausanne, the EU Ideas program (ERC-2012-AdG-320404) and by the Gebert Rüf Stiftung (GRS-025/16).References
- S. M. Paul, D. S. Mytelka, C. T. Dunwiddie, C. C. Persinger, B. H. Munos and S. R. Lindborg, et al., How to improve R&D productivity: the pharmaceutical industry's grand challenge, Nat. Rev. Drug Discovery, 2010, 9(3), 203–214 CAS.
- L. X. Yu, G. Amidon, M. A. Khan, S. W. Hoag, J. Polli and G. K. Raju, et al., Understanding Pharmaceutical Quality by Design, AAPS J., 2014, 16(4), 771–783 CrossRef CAS PubMed.
- European Medicines Agency, ICH guideline Q8 (R2) on pharmaceutical development – Step 5 [Internet], European Medicines Agency, 2017, available from: http://www.ema.europa.eu/docs/en_GB/document_library/Scientific_guideline/2009/09/WC500002872.pdf.
- S. N. Politis, P. Colombo, G. Colombo and D. M. Rekkas, Design of experiments (DoE) in pharmaceutical development, Drug Dev. Ind. Pharm., 2017, 43(6), 889–901 CrossRef CAS PubMed.
- E. Shapiro, T. Biezuner and S. Linnarsson, Single-cell sequencing-based technologies will revolutionize whole-organism science, Nat. Rev. Genet., 2013, 14(9), 618–630 CrossRef CAS PubMed.
- R. H. Houtkooper, L. Mouchiroud, D. Ryu, N. Moullan, E. Katsyuba and G. Knott, et al., Mitonuclear protein imbalance as a conserved longevity mechanism, Nature, 2013, 497(7450), 451–457 CrossRef CAS PubMed.
- N. Moullan, L. Mouchiroud, X. Wang, D. Ryu, E. G. Williams and A. Mottis, et al., Tetracyclines Disturb Mitochondrial Function across Eukaryotic Models: A Call for Caution in Biomedical Research, Cell Rep., 2015, 10(10), 1681–1691 CrossRef CAS PubMed.
- R. Trouillon, M. C. Letizia, K. J. Menzies, L. Mouchiroud, J. Auwerx and K. Schoonjans, et al., A multiscale study of the role of dynamin in the regulation of glucose uptake, Integr. Biol., 2017, 9(10), 810–819 RSC.
- J. J. Collins, C. Huang, S. Hughes and K. Kornfeld, The measurement and analysis of age-related changes in Caenorhabditis elegans, WormBook Online Rev. C. Elegans Biol., 2008, pp. 1–21.
- M. Gossen and H. Bujard, Tight control of gene expression in mammalian cells by tetracycline-responsive promoters, Proc. Natl. Acad. Sci. U. S. A., 1992, 89(12), 5547–5551 CrossRef CAS.
- W. Y. Tsang and B. D. Lemire, Mitochondrial Genome Content Is Regulated during Nematode Development, Biochem. Biophys. Res. Commun., 2002, 291(1), 8–16 CrossRef CAS PubMed.
- M. Cornaglia, G. Krishnamani, L. Mouchiroud, V. Sorrentino, T. Lehnert and J. Auwerx, et al., Automated longitudinal monitoring of in vivo protein aggregation in neurodegenerative disease C. elegans models, Mol. Neurodegener., 2016, 11 Search PubMed , available from: http://www.ncbi.nlm.nih.gov/pmc/articles/PMC4746889/.
- T. Stiernagle Maintenance of C. elegans, WormBook [Internet], 2006 [cited 2016 Oct 19], available from: http://www.wormbook.org/chapters/www_strainmaintain/strainmaintain.html.
- Molecular Cloning [Internet]. [cited 2017 Sep 19]. Available from: http://www.molecularcloning.com/.
- C. J. Kenyon, The genetics of ageing, Nature, 2010, 464(7288), 504–512 CrossRef CAS PubMed.
- L. Fontana, L. Partridge and V. D. Longo, Extending healthy life span–from yeast to humans, Science, 2010, 328(5976), 321–326 CrossRef CAS PubMed.
- R. C. Cassada and R. L. Russell, The dauerlarva, a post-embryonic developmental variant of the nematode Caenorhabditis elegans, Dev. Biol., 1975, 46(2), 326–342 CrossRef CAS PubMed.
- G. Walker, K. Houthoofd, J. R. Vanfleteren and D. Gems, Dietary restriction in C. elegans: from rate-of-living effects to nutrient sensing pathways, Mech. Ageing Dev., 2005, 126(9), 929–937 CrossRef CAS PubMed.
- D. Gems and D. L. Riddle, Genetic, behavioral and environmental determinants of male longevity in Caenorhabditis elegans, Genetics, 2000, 154(4), 1597–1610 CAS.
- D. Garigan, A.-L. Hsu, A. G. Fraser, R. S. Kamath, J. Ahringer and C. Kenyon, Genetic analysis of tissue aging in Caenorhabditis elegans: a role for heat-shock factor and bacterial proliferation, Genetics, 2002, 161(3), 1101–1112 CAS.
- L. Fontana and L. Partridge, Promoting Health and Longevity through Diet: From Model Organisms to Humans, Cell, 2015, 161(1), 106–118 CrossRef CAS PubMed.
- M. Ailion and J. H. Thomas, Dauer formation induced by high temperatures in Caenorhabditis elegans, Genetics, 2000, 156(3), 1047–1067 CAS.
- P. J. Hu Dauer. WormBook [Internet], 2007 [cited 2017 May 19], available from: http://www.wormbook.org/chapters/www_dauer/dauer.html.
- B. P. Gupta and P. Rezai, Microfluidic Approaches for Manipulating, Imaging, and Screening C. elegans, Micromachines, 2016, 7(7), 123 CrossRef.
- M. Muthaiyan Shanmugam and T. Subhra Santra, Microfluidic Devices in Advanced Caenorhabditis elegans Research, Molecules, 2016, 21(8), 1006 CrossRef PubMed.
- V. Sivagnanam and M. A. M. Gijs, Exploring Living Multicellular Organisms, Organs, and Tissues Using Microfluidic Systems, Chem. Rev., 2013, 113(5), 3214–3247 CrossRef CAS PubMed.
- M. Cornaglia, L. Mouchiroud, A. Marette, S. Narasimhan, T. Lehnert and V. Jovaisaite, et al., An automated microfluidic platform for C. elegans embryo arraying, phenotyping, and long-term live imaging, Sci. Rep., 2015, 5, 10192 CrossRef CAS PubMed.
- Y. Xia and G. M. Whitesides, Soft Lithography, Angew. Chem., Int. Ed., 1998, 37(5), 550–575 CrossRef CAS.
Footnote |
| † Electronic supplementary information (ESI) available. See DOI: 10.1039/c7ib00184c |
| This journal is © The Royal Society of Chemistry 2018 |

