
Competing reactions limit levoglucosan yield during fast pyrolysis of cellulose
Jake K.
Lindstrom
a,
Juan
Proano-Aviles
 ab,
Patrick A.
Johnston
c,
Chad A.
Peterson
a,
Jackson S.
Stansell
c and
Robert C.
Brown
*ac
ab,
Patrick A.
Johnston
c,
Chad A.
Peterson
a,
Jackson S.
Stansell
c and
Robert C.
Brown
*ac
aDepartment of Mechanical Engineering, Iowa State University, Ames, IA 50011, USA. E-mail: rcbrown3@iastate.edu
bUniversidad San Francisco de Quito, Quito, Ecuador
cBioeconomy Institute, Iowa State University, Ames, IA 50011, USA
First published on 3rd December 2018
Abstract
Efforts to understand the reaction mechanisms of cellulose pyrolysis have been stymied by short reaction times and difficulties in probing the condensed phase of cellulose intermediate products. Using time-resolved yields of both volatile and non-volatile products of pyrolysis, we demonstrate that cracking reactions generate anhydro-oligosaccharides while subsequent reactions produce levoglucosan from these anhydro-oligosaccharides. Eventually, cracking of anhydro-oligosaccharides is eclipsed by levoglucosan-producing reactions. These reactions compete with other reactions that produce light oxygenates and non-condensable gases. The relative reaction rates in this competition limit levoglucosan yields from cellulose pyrolysis to approximately 60 wt%.
Introduction
Thermal deconstruction of lignocellulosic biomass, by processes such as fast pyrolysis and solvent liquefaction, is a promising approach for producing renewable fuels and chemicals.1 In the ideal manifestation of thermal deconstruction, heat provides the energy to crack the biopolymers making up lignocellulose into monomers and dimers.2,3 In particular, cellulose yields predominantly the anhydro-monosaccharide levoglucosan (1,6-anhydro-β-D-glucopyranose) and anhydro-disaccharides, such as cellobiosan.4,5 In practice, cellulose also yields less desirable aldehydes, ketones, carboxylic acids, and furans5,6 from the fragmentation of pyranose rings.7–11The non-sugar products of polysaccharide thermal deconstruction are in part the product of reactions catalyzed by naturally occurring alkali and alkaline earth metals (AAEM) in lignocellulosic biomass12 or metal contamination in poorly prepared polysaccharide samples.3 These metals serve as strong ring-fragmentation catalysts,2 likely due to ion-dipole forces altering reaction rate coeffecients.13 Careful purification of polysaccharide samples or passivation of AAEM in lignocellulosic biomass can overcome this effect; however, even in the absence of AAEM and performed under well-controlled laboratory conditions, anhydro-monosaccharide yields from pyrolysis still appear to be limited to approximately 60 wt% from cellulose.4
Understanding the fundamental mechanisms of polysaccharide thermal deconstruction is important in designing reactors that maximize yields of simple sugars. Although pyrolysis of cellulose has been studied since the late 19th century, no consensus exists on the reactions responsible for the thermal depolymerization of this relatively simple polysaccharide.14 In the 1960s, experiments showed that cellulose passes through a liquid state during pyrolysis, termed “active cellulose”, before further decomposing to vapor products.14 In 1987, Radlein et al.15 identified the liquid intermediate products as anhydro-oligosaccharides. (For an extensive account, see Lédé's historical review.14) More recent experiments have reached general agreement that this liquid intermediate consists of anhydro-oligosaccharides with relatively few monomeric units.15–21 Cellulose and its derivative anhydro-oligosaccharides differ in two ways: degree of polymerization (DP) and the structure of a terminal monomer (Fig. 1). Cellulose typically contains thousands of monomers22 while the maximum measured DP of anhydro-oligosaccharides is usually no more than 7.14,16,23 However, it should be noted that a recent study identified anhydro-oligosaccharides with DP up to 18.18 Another difference is that cellulose is terminated by reducing and non-reducing ends while anhydro-oligosaccharides have anhydro and non-reducing ends. Cleavage of this anhydro-end monomer from an anhydro-oligosaccharide is expected to yield levoglucosan although the non-reducing end is also suspected to yield levoglucosan.24,25
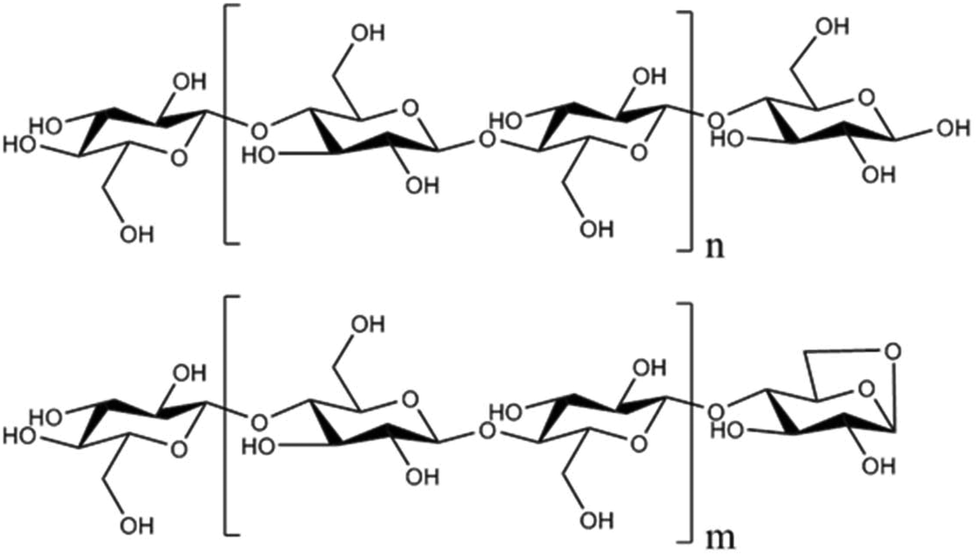 | ||
| Fig. 1 Cellulose (top) is terminated by reducing and non-reducing ends. In contrast, the anhydro-oligosaccharides (bottom) resulting from cellulose thermal depolymerization are terminated by an anhydro-end and non-reducing end. | ||
Originally thought to be the product of heterolytic fission, pyrolytic depolymerization of cellulose and its oligomers is now widely accepted to be a concerted reaction that breaks a mid-chain glycosidic bond (not at either end of the chain) to produce two anhydro-oligosaccharides fragments.24,26 This so-called cracking reaction (also known as initiation) is thought to occur at purely random locations along the chain. Fragmentation at either of the extreme ends of the chain (terminal glycosidic bonds) is thought to be distinct from cracking and is characterized as either a levoglucosan-producing reaction (LPR) or a degradation reaction (DR).
Computational chemistry has provided recent guidance in understanding fragmentation reactions.6,8,24,26,27 Although a number of LPRs have been identified,24,26 the most likely appear to produce levoglucosan from the anhydro-end and non-reducing end of anhydro-oligosaccharides. Computational studies suggest these two LPRs have identical reaction rates.24,25 On the other hand, Mayes and Broadbelt propose LPRs rates to be slower than cracking reactions at typical pyrolysis temperatures, although this difference lies within the margin of error.24
Degradation reactions constitute a diversity of reactions that form light oxygenates and non-condensable gases. The mechanisms of DRs are varied but most are pericylic reactions, likely catalyzed by hydroxyl groups on adjacent molecules.8 Agarwal et al.28 suggest that DRs are generally less thermodynamically favorable than LPRs.
Broadbelt et al. theorize that the majority of light oxygenates come from glucose molecules produced by thermohydrolysis reactions.10,11,25 Thermohydrolysis entails a water molecule hydrolyzing a terminal glycosidic bond resulting in a glucose molecule and an oligosaccharide that is one monomer shorter than the original. The water for thermohydrolysis is assumed to be generated by monomer dehydration reactions.10 Their mechanistic model predicts thermohydrolysis can occur more than twice as frequently as other reactions.11 Furthermore, they calculate thermohydrolysis yields as high as 18 wt% glucose during the course of cellulose depolymerization, which represents 60 wt% of the condensed phase products at that point in the reaction.11 Despite the importance of this glucose-producing reaction to the success of the computational model in predicting levoglucosan yields, there has yet to be experimental verification of glucose as a significant reaction intermediate during cellulose pyrolysis.15,18,19,29
Efforts to experimentally explore the fundamental reactions of biomass pyrolysis are challenged by difficulties in analyzing short-lived intermediate products in the condensed phase. Accordingly, most experimental studies have focused on analyzing vapor products as they are volatilized from pyrolyzing biomass. Because anhydro-oligosaccharides are non-volatile, this approach to studying pyrolysis overlooks these important intermediate products.30,31 The short-lived nature of intermediate products and the predominance of experimental methods that only detect volatile products bias studies away from the condensed phase.
The lifetime of short-lived intermediates can be prolonged by slowly heating samples, improving the prospects of sampling them from the condensed phase, but this methodology has dubious relevance to fast pyrolysis. For example, several authors have generated anhydro-oligosaccharides by gradually heating levoglucosan, hypothesizing that anhydro-oligosaccharides only form this way and not directly from cellulose. Using low heating rates conditions, typically less than 200 °C min−1 (3.33 °C s−1),32–34 levoglucosan, hampered by low volatility,30 slowly evaporates leaving it susceptible to polymerization into anhydro-oligosaccharides. This gradual temperature increase provides levoglucosan additional time to repolymerize compared to typical fast pyrolysis time scales. Zhang et al.35 tested this theory by attempting to pyrolyze levoglucosan in a Frontier Laboratories micropyrolyzer, which at 500 °C has a heating rate of approximately 10![[thin space (1/6-em)]](https://www.rsc.org/images/entities/char_2009.gif) 800 °C min−1 (180 °C s−1).36 The levoglucosan did not pyrolyze; instead it merely vaporized, indicating levoglucosan repolymerizes too slowly to be relevant to the time scales of fast pyrolysis.
800 °C min−1 (180 °C s−1).36 The levoglucosan did not pyrolyze; instead it merely vaporized, indicating levoglucosan repolymerizes too slowly to be relevant to the time scales of fast pyrolysis.
Experiments using high heating rates, although they complicate intermediate product sampling, show that cellulose produces anhydro-oligosaccharides. Flash pyrolysis, in this case using a radiant heat source, can be easily terminated by turning off the radiation source.16,23 Only the thermal mass of the cellulose and the platform holding it remain, which are often quite small, allowing for somewhat rapid cooling. These experiments14,16,23 demonstrate that anhydro-oligosaccharides of DP 2–7 readily form directly from cellulose at a variety of temperatures. Recent work using other kinds of pyrolysis reactors that partially-pyrolyze cellulose have detected up to DP 18 anhydro-oligosaccharides, as measured by ion chromatography.18,19 Although more than double the size of previously detected oligomers, compared to cellulose they are still relatively small. The detection of only low DP anhydro-oligosaccharides is likely due to instrumentation limits, not the absence of larger oligomers, as is discussed later in this paper.
In 2016, Dauenhauer's group, with the goal of rapidly truncating pyrolysis reactions, developed a reactor termed PHASR that both rapidly heats and cools small samples, typically thin films.37 In 2018, they tested multiple hypotheses to see if they could increase levoglucosan yields from cellulose pyrolysis.38 Using their PHASR they reported surprisingly low levoglucosan yields: approximately 8 wt% from cellulose pyrolysis.38 In contrast, Frontier Laboratories micropyolyzers produce the highest repeatable levoglucosan yields from cellulose pyrolysis, around 60 wt%.3,5,36 The reason for this discrepancy is likely due to differences in sample preparation rather than differences in heating rate as claimed.39 Thin film cellulose samples, typically a few micron thick,35,40 form lumps when applied unevenly which leads to additional char formation and catalytic degradation of monomers.35 This effect explains why some thin film samples produce low levoglucosan yields while powdered cellulose consistently produces higher yields.
Using a thin film of cellulose with the PHASR, Dauenhauer's group suggests that anhydro-oligosaccharides only form after cellulose is heated above 467 °C;37,41 however, anhydro-oligosaccharides have been previously reported from incomplete cellulose pyrolysis performed at temperatures below 467 °C.15,18,19,29 Confounding the issue, most of their experiments37,41 used α-cyclodextrin (which has a DP of six) as a surrogate for cellulose (which has a DP of thousands).22 While α-cyclodextrin may produce some volatile products at the same rate as thin film cellulose samples,42 it cannot mimic cellulose transforming into large oligomers—a key step. Furthermore the levoglucosan yield from α-cyclodextrin, 24 wt%,40 falls substantially short of that typically produced from powdered cellulose, approximately 60 wt%.3,5,36 Studies focused on understanding cellulose depolymerization are likely to have more success with powdered cellulose in high heating rate reactors with proven records of producing high levoglucosan yields.
Cellulose decomposition into large oligomers and then into increasingly smaller products can be described by a logistic function, a class of ordinary differential equations with a sigmoidal solution.43,44 These models were developed for thermal decomposition of solid, inorganic material, which can seem very dissimilar from large organic polymers; however, they describe similar phenomena: nucleation and growth. Cracking is analogous to nucleation—a starting point for another reaction—while LPRs represent growth of decomposition product. For example, the Prout–Tompkins model,45,46 which was developed to understand the decomposition of potassium permanganate during heating,45 has since been applied to and closely fits cellulose pyrolysis under low heating rate conditions.47–49 Other related solid decomposition models such as the Šesták–Berggren50 model also fit cellulose pyrolysis.44,48 These models, among others, were developed to understand two-step solid thermal decomposition, and appear to work well for cellulose pyrolysis43 but have not been applied to high heating rate experiments or directly correlated to specific products.
With the goal of resolving the mechanism of anhydro-oligosaccharide and levoglucosan formation from cellulose, we examined the time evolution of both volatile and non-volatile products during fast pyrolysis of cellulose. We present the first time-resolved measurements of levoglucosan and anhydro-oligosaccharides. We correlate evolution of levoglucosan from cellulose with other volatile products. These data suggest that the yield of levoglucosan from cellulose thermal deconstruction is limited by competition between LPRs and DRs.
Materials and methodologies
Frontier EGA/PY-3030 D micropyrolyzer
A Frontier EGA/PY-3030 D micropyrolyzer was used for the Controlled Pyrolysis Duration (CPD)-Quench reactor and Short Column (SC)-Flame Ionization Detector (FID). Proano-Aviles et al.36 determined the heating rates in this micropyrolyzer at 400 and 500 °C are 140 and 180 °C s−1, respectively. As sample temperature cannot be directly measured, temperatures indicated are always furnace temperature in subsequent descriptions and discussions. The interface, a heater at the bottom of the micropyrolyzer which typically contacts a gas chromatograph inlet, was maintained at 400 °C to prevent product condensation.All pyrolysis experiments were conducted with Sigmacell Type 50 cellulose from Sigma Aldrich. The cellulose was analyzed by High Performance Liquid Chromatography (HPLC) to check for the presence of levoglucosan: none was detected.
Samples for experiments with the CPD-Quench reactor were 500 ± 10 μg, which is small enough to avoid mass transfer issues.4,35,36 The samples for the SC-FID tests were 75 ± 25 μg. The cellulose particles were approximately 50 μm diameter. The weight average DP was 1871, as measured by the National Renewable Energy Laboratory35 which is typical for cellulose. Importantly, the cellulose was derived from softwood pulps. Other sources, such as bacteria, have differently sized and shaped cellulose microfibrils and are poorly representative of lignocellulosic biomass.51
Controlled Pyrolysis Duration-Quench reactor
Condensed phase products from fast pyrolysis of cellulose were recovered from a custom-built CPD-Quench analytical pyrolysis system based on a Frontier PY-3030 D micropyrolyzer. This apparatus allows cellulose to be pyrolyzed during well-controlled reaction times with recovery of volatile products and almost instantaneous quenching of condensed phase material including reactant (cellulose) and products (oligosaccharides and monosaccharides). As illustrated in Fig. 2, this reactor consists of a micropyrolyzer, a condenser to collect vapor products continuously, and a quench vessel that collects intermediate products existing as condensed phases after the prescribed pyrolysis duration. | ||
| Fig. 2 The CPD-Quench apparatus captures both volatile and condensed phase products of cellulose pyrolysis after prescribed reaction durations. The Swagelok T-junction and connector to the glass quench vessel are roughly depicted for clarity. | ||
Experiments began by heating the Frontier micropyrolyzer to the desired pyrolysis temperature followed by purging the reactor tube with helium carrier gas at 100 mL min−1 for two minutes to remove oxygen. To initiate pyrolysis, an automatically controlled linear actuator rapidly inserted a short, stainless steel sample cup containing the cellulose sample into the furnace section of the micropyrolyzer. Vapors released from the pyrolyzing cellulose were swept into the condenser which is cooled by liquid nitrogen. The condenser contained 3 mL of 1 mm diameter borosilicate glass spheres to increase surface area so all the products were captured. At the end of the prescribed pyrolysis time, the sample holder was dropped into a quench vessel containing chilled water. Condensed phase material in the sample holder cooled at rates estimated to be hundreds of degrees Celsius per second, rapidly quenching pyrolysis reactions. Up to thirty sequential trials of 500 μg samples were performed to accumulate sufficient condensed phase and volatile samples for chemical analysis. This repetition was also advantageous because it effectively produced an average of the pyrolysis experiments for each test point, reducing the impact of random error.
The 6 mm OD, 5 mm ID 316 stainless steel tubing used for the reactor tube and condenser was deactivated by SilcoTek's SilcoNert 1000 to prevent unwanted catalytic reactions. A custom heating jacket, made by Briskheat and controlled by an Oakton Temp 9000 Advanced Thermocouple Controller, heated the part of the reactor tube extending below the micropyrolyzer, the T-junction, and the horizontal part of the condenser to 400 °C. A brass Swagelok union tee composed the T-junction, and a stainless steel Swagelok Ultra-Torr adapter connected to a glass tube coupled to the glass flask by a conically tapered ground glass joint. For overall clarity, the Briskheat heater and Swagelok parts are omitted from Fig. 2.
The solvent and condensed phase material caught in the quench vessel and the liquid in the condenser were transferred to lightweight PTFE beaker liners from Welch Fluorocarbon to facilitate weighing on a microbalance (Mettler Toledo XP6). Water in the samples was evaporated in a vacuum oven before determining the mass of each product stream using a microbalance.
To verify the samples were dried completely, the samples were each divided into two subsamples. One of these was analyzed for moisture content via thermogravimetric analysis using a Mettler Toledo TGA/DSC 1. The other was separately dissolved in water and analyzed by HPLC and Gel Filtration Chromatography (GFC). This procedure was performed in duplicate for each experiment.
Short column-flame ionization detector
In order to measure the rate of volatile species production, a Varian GC-FID was slightly modified to create the SC-FID, first described in Proano-Aviles et al.36 Instead of using a standard 30 or 60 m column, an Agilent Technologies FS, Deactivated, Hi-Temp-0.250 mm × 5 m column was cut to 0.50 m and kept at 400 °C to prevent product condensation. The GC inlet with a Frontier PY-3030 D micropyrolyzer was connected by the shortened column to the FID, allowing time-resolved signal analysis. Unlike an analytical GC column, this short column does not separate chemical species but simply serves as a transfer line from the micropyrolyzer to the FID. Although the apparatus configured in this way does not allow identification of individual chemical species, it provides time resolution of the FID signal generated collectively from carbon-containing species volatilized from the cellulose sample.To maximize heat transfer and advection, a small cellulose sample was pyrolyzed on a small hook in a Frontier PY-3030 D micropyrolyzer mounted to the GC inlet. To prepare the sample for pyrolysis, a cellulose–water slurry was applied to the bottom of a hook normally used to hold the pyrolysis cup. The water in the slurry was evaporated overnight in a vacuum oven, leaving cellulose attached to the bottom of the hook. The hook was weighed before slurry addition and after drying to determine the sample mass. Additional details of this procedure are found in Proano-Aviles et al.36
Reaction modeling
SC-FID data was fit to the equations described in detail by Burnham.43,44 In particular the extended Prout–Tompkins model46,52 (ePT) (eqn (1)) was used, where α represents conversion. The sigmoid-shaped solution to this equation is appropriate for two-step processes such as crystal nucleation and growth and organic polymer decomposition. Specifically, the ePT was fit to the data by adjusting values of k, m, and n in eqn (1).53 Single step models43,44 were also considered, but were abandoned because of their poor fit to the experimental data. | (1) |
To compare to the ePT model, the SC-FID data had to be transformed. All data transformations were performed in Python 3.54 These manipulations converted FID signal [pV] over time [s] into normalized reaction rate and conversion, respectively. These steps, completed separately for each temperature, aid comparing disparate reaction rates and time scales.
The first step involved truncating the SC-FID data. Without this abbreviation the data points before and after pyrolysis would bias and subsequently over-fit the model toward low and high conversions. Furthermore, FID signal and noise is always positive, so the integral of the FID data (the next transformation) would always have a positive slope, thereby never appearing to reach complete conversion. To determine consistently when pyrolysis begins and ends, the first derivative of the FID signal [pV s−1] (dSFID/dt) was taken piecewise between each data point. The cutoff magnitude for dSFID/dt was set at one percent of the maximum of dSFID/dt. Data before and after this cutoff (excluding the change in sign as the reaction slows down) was ignored for subsequent transformations and curve fitting.
This truncated data set underwent multiple straightforward transformations. It was integrated piecewise at each data point, representing the accumulation of volatile pyrolysis products. The integrated data were transformed to conversion (alpha) by normalizing the accumulation with respect to the maximum integrated FID signal. The piecewise derivative was taken separately for alpha and time, and then change in alpha was divided by change in time to create the reaction rate. The reaction rate was normalized by its maximum value. The models were fit to normalized reaction rate and conversion with SciPy using the Levenburg–Marquardt damped least squares algorithm.
HPLC
A Dionex UltiMate® 3000 HPLC with a Refractive Index (RI) detector and two Bio-Rad® Aminex HPX-87P columns in series was used to quantify levoglucosan from the CPD-Quench. The method is described in depth by Choi et al.55 and Dalluge et al.56GFC
A Dionex UltiMate® 3000 HPLC with a RI detector and two Agilent Technologies PL aquagel-OH 20 columns in series was used to identify cellulose oligomers from the CPD-Quench. An Agilent Technologies PL aquagel-OH guard protected the two columns. The columns were kept at 25 °C with a 0.800 mL min−1 flow rate of 18.2 MΩ cm−1 deionized water as the eluent for analysis. The GFC with Chromeleon® software was calibrated using an Agilent Technologies Pullulan Polysaccharide Calibration Kit with the peak average molecule weights: 180, 667, 5900, 9600, and 21100. The anhydro-oligosaccharide structure was further confirmed with standards of cellobiosan purchased from Carbosynth LLC, and cellotriosan, cellotetraosan, and cellopentaosan from LC Scientific Inc. (now known as Synthose Inc.)
Results and discussion
Anhydro-oligosaccharide formation
The condensed phase products from the CPD-Quench show oligomeric products form in the first few seconds of pyrolysis. The Pullulan polysaccharide calibration does not fit these products, indicating they are not conventional oligosaccharides. Rather, they are anhydro-oligosaccharides, with their identity confirmed by low DP anhydro-oligosaccharide standards. Their retention times differ from conventional oligosaccharides due to non-size-exclusion effects arising from their differing end-structure. GFC shows the presence of a wide range of DPs but their intensity markedly decreases for anhydro-oligosaccharides with DP greater than 7 (Fig. 3). However, in the present experiments, this decline is likely due to the inverse relationship between anhydro-oligosaccharide DP and their solubility in water57 rather than the absence of larger oligosaccharides in the condensed phase products. For the same reason, instrumentation, such as HPLC, using water as an eluent cannot reliably detect anhydro-oligosaccharides larger than DP 7. However, extending our exponential trend line suggests that anhydro-oligosaccharides with DP of approximately 60 should be visible using GFC near or at room temperature, which is more than triple the highest previously reported DP for anhydro-oligosaccharides.18 Despite the inability to determine the entire range of anhydro-oligosaccharides with GFC, the presence of anhydro-oligosaccharides with DP values two and three orders of magnitude lower than the starting cellulose DP indicates very rapid depolymerization.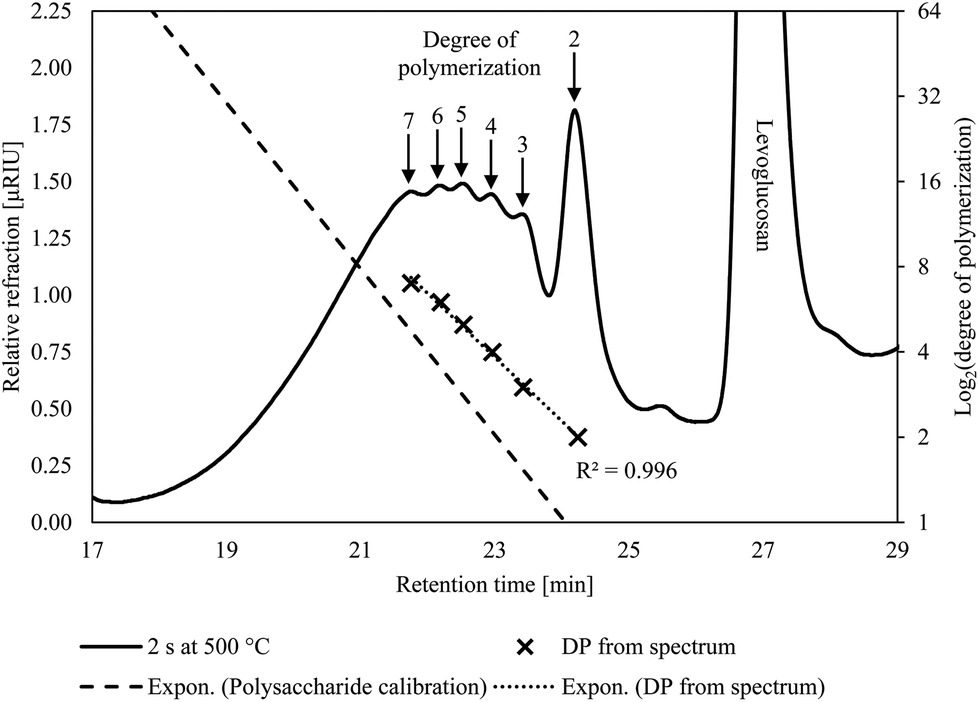 | ||
| Fig. 3 Anhydro-oligosaccharides are visible in the GFC spectrum from the condensed products after two seconds of pyrolysis at 500 °C. The exponential trendline created using the DP visible on the spectrum, and their respective retention times, has a high coefficient of determination (0.996) indicating all the visible peaks are homologous anhydro-oligosaccharides. | ||
Also noteworthy was the absence of glucose in either the condensed or volatile products. Broadbelt's mechanistic model predicts up to approximately 18 wt% glucose on a cellulose basis, 60 wt% of the condensed phase.11 This amount of glucose is well within the detection limits of the HPLC and GFC methodologies used on products from the CPD-Quench apparatus. This conspicuous absence of glucose calls into question the importance of thermohydrolysis in explaining the depolymerization mechanism of cellulose during fast pyrolysis.
The presence of anhydro-oligosaccharides, however, does not reveal whether they originated from depolymerized cellulose or repolymerized levoglucosan. Cellulose could have depolymerized from its non-reducing end producing levoglucosan and eventually yielding small anhydro-oligosaccharides. Furthermore, the condensed phase contains levoglucosan, as shown in Fig. 3, which could have formed exclusively from the non-reducing end followed by its repolymerization to anhydro-oligosaccharides—all without recourse to cracking reactions. However, low DP anhydro-oligosaccharides appear before significant amounts of levoglucosan form, as shown in Fig. 4. The presence of significant levoglucosan in the condensed phase would be expected if levoglucosan repolymerization were responsible for the presence of small anhydro-oligosaccharides.
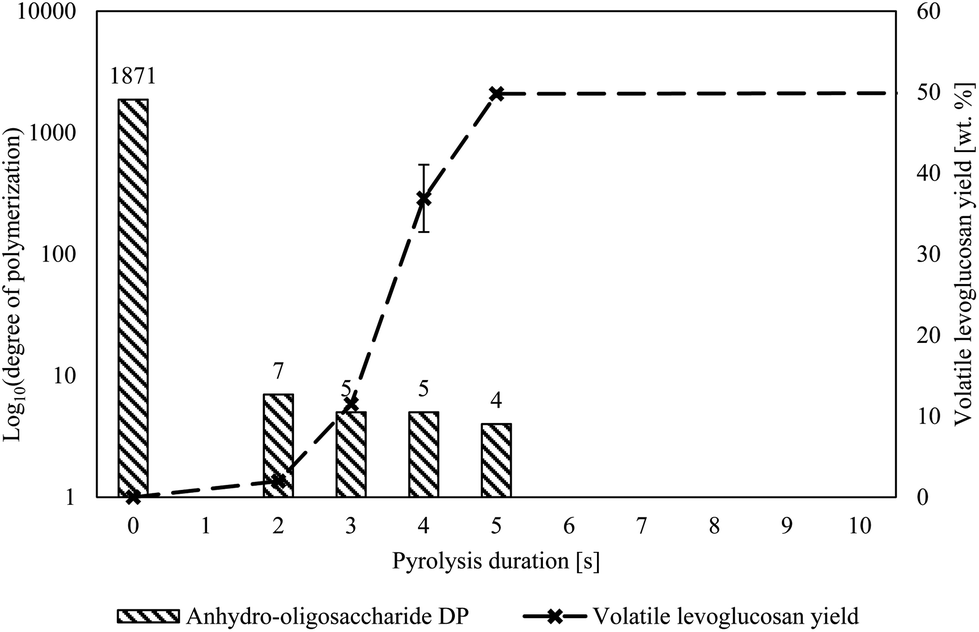 | ||
| Fig. 4 The DP of cellulose rapidly decreased ahead of any significant levoglucosan production, indicating extensive cracking of cellulose before substantial levoglucosan was produced. The DPs listed are the highest water-soluble anhydro oligosaccharides that can be directly detected by GFC. The DP of the cellulose before pyrolysis was measured by the National Renewable Energy Laboratory.35 The longest pyrolysis duration, 300 s, was omitted for clarity but produced 54.4 wt% levoglucosan. Pyrolysis temperature was 500 °C. | ||
The delay in the appearance of levoglucosan compared to the depolymerization of cellulose into small anhydro-oligosaccharides suggests that the initial rate of cracking is much faster than levoglucosan generation from end-chain LPRs. This result should not be surprising considering the plethora of potential cracking sites in long-chain anhydro-oligosaccharides (equal to DP minus two) compared to the small number of sites for end-chain reactions (two per anhydro-oligosaccharide molecule regardless of DP). Quantification of this phenomena is the subject of a future computational study.
Subsequent LPRs
The SC-FID was used to explore the role of LPRs in the rate of levoglucosan production from cellulose. This instrument allows high frequency data collection (10 Hz) on devolatilized pyrolysis products, although at the cost of not being able to individually resolve product species. Thus, there is the question whether the SC-FID signal correlates with levoglucosan, representing about 60 wt% of volatile products,4,35,36 or is also confounded by the effect of the other 40 wt% of products. To evaluate this question, the FID response was integrated with time to estimate the amount of accumulated products over the course of an experiment. This data was plotted against mass yield of volatilized levoglucosan as determined from the analysis of volatile products from the CPD-Quench under identical experimental conditions. As shown in Fig. 5, the correlation between volatile levoglucosan as determined in CPD-Quench experiments with the integrated FID signal is excellent, with coefficient of determination of 0.993. The close correlation suggests that the ratio of rates for LPRs and DRs are constant over the course of pyrolysis. It also indicates that the FID signal can serve as a proxy for levoglucosan production rate during pyrolysis and be used for ePT modeling.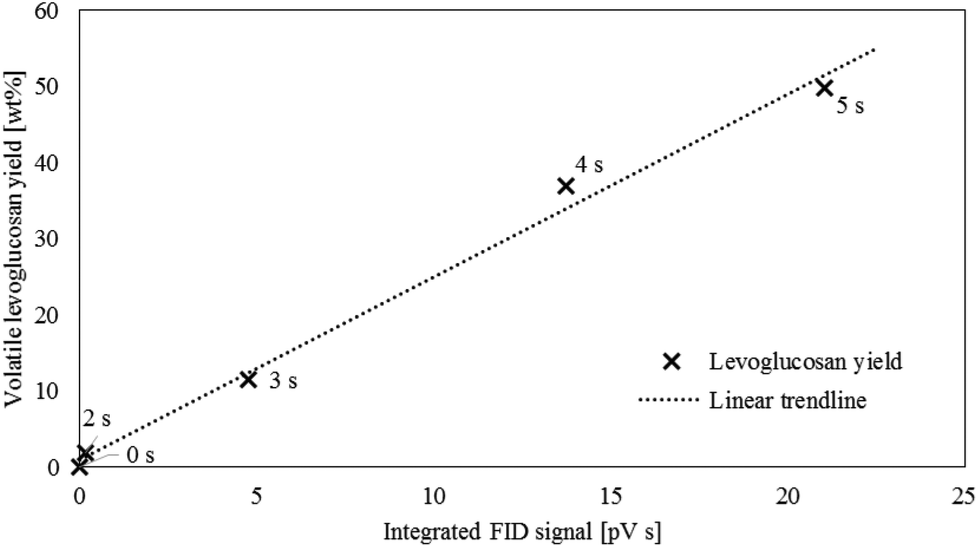 | ||
| Fig. 5 The average volatile levoglucosan yield from the CPD-Quench reactor plotted against the FID signal integrated with respect to time (both reactors at 500 °C) closely match (linear fit with a coefficient of determination of 0.993), showing that the FID signal can be used as a proxy for levoglucosan production. Pyrolysis time, in seconds, is indicated at each point. | ||
As described in the Materials and methodologies section, time-resolved FID data was transformed into normalized reaction rates and conversions (α) for pyrolysis experiments performed at three temperatures (433, 467, and 500 °C). The experimental data presented in this way (Fig. 6) clearly illustrates LPRs accelerating at low conversions (α less than 0.2 to 0.4, depending upon temperature) followed by decelerating reaction rate for higher conversions. Higher temperatures favor higher conversions before LPRs begins to slow down. The period of rapid increase in the rate of volatile evolution corresponds to LPRs overtaking cracking reactions. However, both cracking and LPRs occur at all pyrolysis temperatures tested, contrary to the theory of Dauenhauer et al.37,41 that cracking only occurs at pyrolysis temperatures above 467 °C. If this were the case, then normalized reaction rate should be constant with respect to conversion for the two experiments plotted in Fig. 6 at temperatures 433 and 467 °C,43 which is clearly not the case. The presence of both cracking and LPRs independent of temperature is quantified below in the discussion on fitting the experimental data to the ePT model.
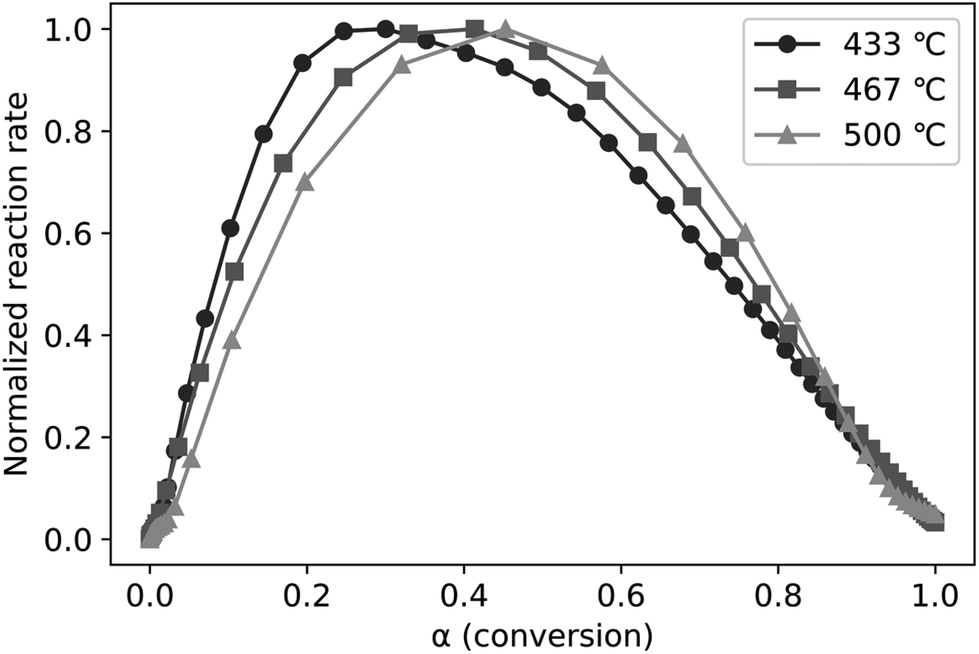 | ||
| Fig. 6 The normalized reaction rates plotted against conversion (α) clearly demonstrate an acceleration period (with a positive slope) followed by a deceleration phase (with a negative slope). In conjunction these zones indicate the consecutive dominance of cracking then LPRs. | ||
As shown in Fig. 7, the ePT model closely fits the experimental data, confirming a two-step reaction consisting of cracking followed by LPRs (and DRs). The skewness and constants derived from fitting these equations to the SC-FID data (Fig. 7) show the first reaction, cracking, initially occurs more frequently than LPRs. The peak reaction rate occurs at higher conversion for increasing temperatures. This shift is unsurprising as reaction rates accelerate with higher temperatures.
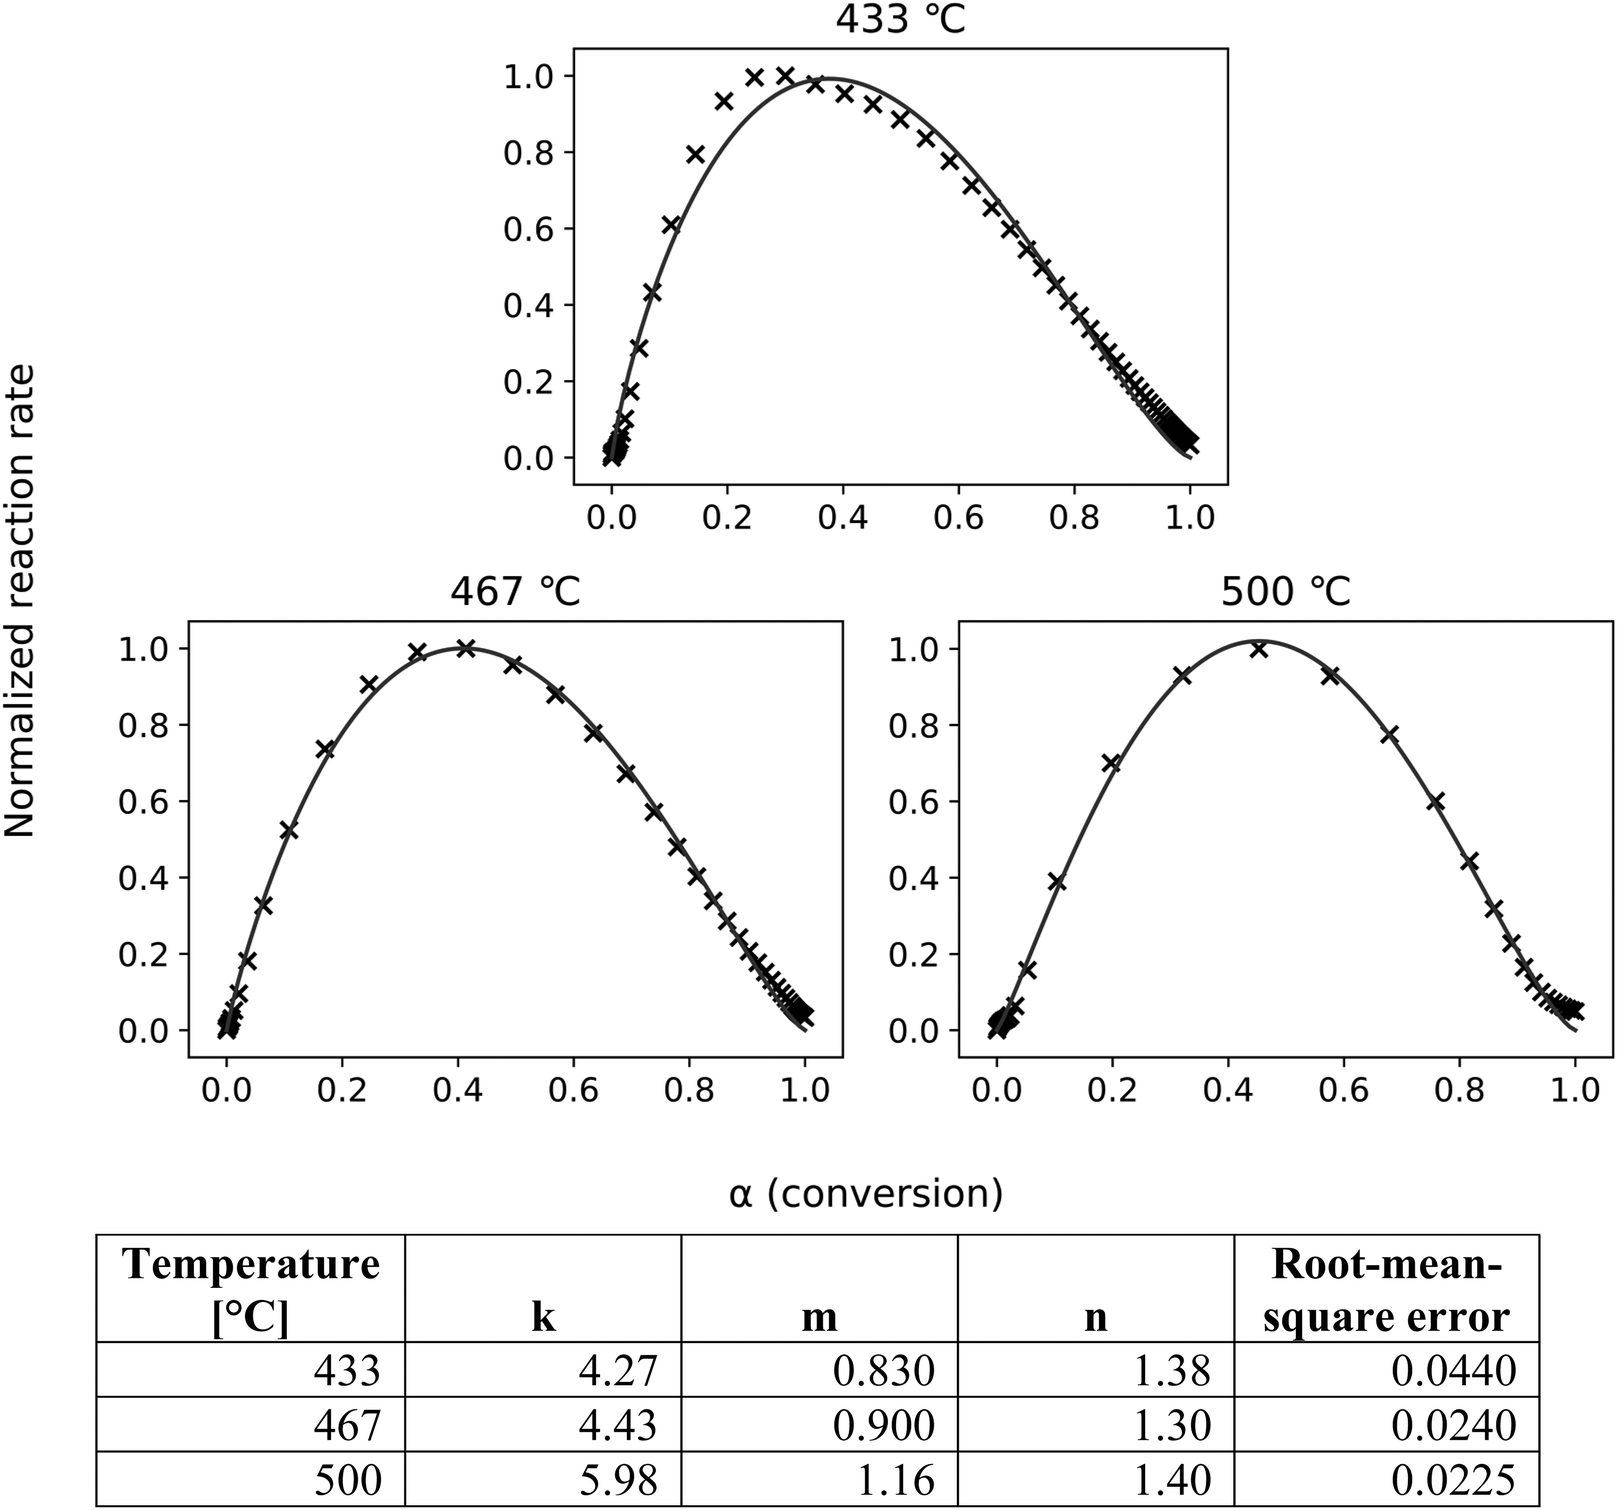 | ||
| Fig. 7 The ePT model (lines) closely fits the transformed SC-FID data (crosses). The root-mean-square errors show good fit for all tested temperatures. | ||
These results confirm previous global kinetic analyses that support the two-step scheme.44 Past work conducted at low heating rates provided important insight into these reactions but did not show if the reaction scheme holds true at higher heating rates more representative of large scale pyrolyzers. This work bridges that gap.
Conclusions
Cellulose exhibits two distinct reaction regimes—cracking then levoglucosan production—during fast pyrolysis at 433, 467, and 500 °C. The competition between LPRs and DRs limit levoglucosan yields from cellulose pyrolysis to approximately 60 wt%.Cellulose pyrolysis begins as cracking reactions convert cellulose into anhydro-oligosaccharides, regardless of temperature. Within a few seconds, cellulose with an initial DP of 187135 produces anhydro-oligosaccharides with a DP of less than 60, while in the same time frame, yields very little levoglucosan. Examining the oligosaccharide fragments of cellulose deconstruction is essential for understanding this process, something not possible through surrogates such as α-cyclodextrin. The presence of small anhydro-oligosaccharides from actual polysaccharides cannot be suitably explained without the intervention of cracking reactions that rapidly depolymerize cellulose.
LPRs rely on cracking to create anhydro-oligosaccharides,24 so increasing the amount of oligomers directly increases LPR rates. This dependence explains the second phase of cellulose pyrolysis: levoglucosan production. The SC-FID plots show cellulose pyrolyzes with the same reaction regimes regardless of temperature, which only changes the reaction rates.
The interplay between these LPRs and a host of DRs limit levoglucosan yields from cellulose to approximately 60 wt%. The DR mechanisms are certainly numerous but do not include thermohydrolysis to a detectable extent. Regardless of their mechanisms, every DR destroys a latent levoglucosan molecule, preventing cellulose from reaching its stoichiometric potential yield of 100 wt% levoglucosan. This prospect could be reached only if no DRs occur. Herein lies the difficulty.
The strong correlation between levoglucosan and less desirable products (light oxygenates and non-condensable gases) indicates an intrinsic link between cracking, LPRs, and DRs. Cracking creates increasing amounts of progressively smaller anhydro-oligosaccharides where LPRs and DRs compete for each monomer. This competition to utilize these anhydro-oligosaccharides is what limits levoglucosan yields. Understanding the conflict between LPRs and DRs is only possible by studying anhydro-oligosaccharides.
Anhydro-oligosaccharides pose distinct analytical challenges. Foremost, they are short-lived during cellulose pyrolysis, except for cellobiosan which is sometimes observed as a final product.15 Second, and perhaps the most vexing, they are poorly soluble in water. Cellulose, a polysaccharide with a DP of typically a few thousand, only becomes soluble and possible to analyze with common instrumental techniques after significant depolymerization has decreased its DP by two or three orders of magnitude. Despite these difficulties, the true nature of cellulose pyrolysis can be examined properly only by including the intermediate products.
By analyzing the volatile and non-volatile products, this experimental confirmation of the two-step mechanism improves understanding, assists future modeling, and also invites future study. Cellulose is a complicated material and its pyrolysis is correspondingly chaotic. Future work should integrate experiments that demonstrate the role of anhydro-oligosaccharides, preferably including those with a greater DP than can be analyzed with water as the solvent.
Conflicts of interest
There are no conflicts to declare.Acknowledgements
The financial support and guidance from ExxonMobil (ISU Project No. 128056-01), the National Science Foundation (grant numbers 1630404 and 1560012), and the Ecuadorian government through SENESCYT is greatly appreciated. Furthermore, the authors would like express their gratitude to Ross Mabon and Ryan G. Smith for guidance and useful discussions, Ross D. Mazur and Joshua Otto for experimental support, Eric Lindstrom for editing assistance, and lastly Paul J. H. Tjossem and Mira E. Hall for introducing JKL to the art of electronics.References
- Thermochemical Processing of Biomass: Conversion into Fuels, Chemicals and Power, ed. R. C. Brown and C. Stevens, Wiley, 2011 Search PubMed.
- P. R. Patwardhan, J. A. Satrio, R. C. Brown and B. H. Shanks, Bioresour. Technol., 2010, 101, 4646–4655 CrossRef CAS PubMed.
- P. R. Patwardhan, R. C. Brown and B. H. Shanks, ChemSusChem, 2011, 4, 636–643 CrossRef CAS PubMed.
- P. R. Patwardhan, J. A. Satrio, R. C. Brown and B. H. Shanks, J. Anal. Appl. Pyrolysis, 2009, 86, 323–330 CrossRef CAS.
- P. R. Patwardhan, D. L. Dalluge, B. H. Shanks and R. C. Brown, Bioresour. Technol., 2011, 102, 5265–5269 CrossRef CAS PubMed.
- H. B. Mayes, M. W. Nolte, G. T. Beckham, B. H. Shanks and L. J. Broadbelt, ACS Sustainable Chem. Eng., 2014, 2, 1461–1473 CrossRef CAS.
- C. P. Hutchinson and Y. J. Lee, ACS Sustainable Chem. Eng., 2017, 5, 8796–8803 CrossRef CAS.
- V. Seshadri and P. R. Westmoreland, J. Phys. Chem. A, 2012, 116, 11997–12013 CrossRef CAS PubMed.
- R. S. Assary and L. A. Curtiss, Energy Fuels, 2012, 26, 1344–1352 CrossRef CAS.
- X. Zhou, M. W. Nolte, H. B. Mayes, B. H. Shanks and L. J. Broadbelt, Ind. Eng. Chem. Res., 2014, 53, 13274–13289 CrossRef CAS.
- X. Zhou, M. W. Nolte, B. H. Shanks and L. J. Broadbelt, Ind. Eng. Chem. Res., 2014, 53, 13290–13301 CrossRef CAS.
- N. Kuzhiyil, D. Dalluge, X. Bai, K. H. Kim and R. C. Brown, ChemSusChem, 2012, 5, 2228–2236 CrossRef CAS PubMed.
- H. B. Mayes, M. W. Nolte, G. T. Beckham, B. H. Shanks and L. J. Broadbelt, ACS Catal., 2015, 5, 192–202 CrossRef CAS.
- J. Lédé, J. Anal. Appl. Pyrolysis, 2012, 94, 17–32 CrossRef.
- D. Radlein, A. Grinshpun, J. Piskorz and D. S. Scott, J. Anal. Appl. Pyrolysis, 1987, 12, 39–49 CrossRef CAS.
- J. Lédé, F. Blanchard and O. Boutin, Fuel, 2002, 81, 1269–1279 CrossRef.
- Y.-C. Lin, J. Cho, G. A. Tompsett, P. R. Westmoreland and G. W. Huber, J. Phys. Chem. C, 2009, 113, 20097–20107 CrossRef CAS.
- D. Liu, Y. Yu and H. Wu, Ind. Eng. Chem. Res., 2013, 52, 12785–12793 CrossRef CAS.
- X. Gong, Y. Yu, X. Gao, Y. Qiao, M. Xu and H. Wu, Energy Fuels, 2014, 28, 5204–5211 CrossRef CAS.
- M. R. Hurt, J. C. Degenstein, P. Gawecki, D. J. Borton II, N. R. Vinueza, L. Yang, R. Agrawal, W. N. Delgass, F. H. Ribeiro and H. I. Kenttämaa, Anal. Chem., 2013, 85, 10927–10934 CrossRef CAS PubMed.
- J. C. Degenstein, M. Hurt, P. Murria, M. Easton, H. Choudhari, L. Yang, J. Riedeman, M. S. Carlsen, J. J. Nash, R. Agrawal, W. N. Delgass, F. H. Ribeiro and H. I. Kenttämaa, Eur. J. Mass Spectrom., 2015, 21, 321–326 CrossRef CAS PubMed.
- B. B. Hallac and A. J. Ragauskas, Biofuels, Bioprod. Biorefin., 2011, 5, 215–225 CrossRef CAS.
- O. Boutin, M. Ferrer and J. Lédé, Chem. Eng. Sci., 2002, 57, 15–25 CrossRef CAS.
- H. B. Mayes and L. J. Broadbelt, J. Phys. Chem. A, 2012, 116, 7098–7106 CrossRef CAS PubMed.
- R. Vinu and L. J. Broadbelt, Energy Environ. Sci., 2012, 5, 9808–9826 RSC.
- X. Zhang, W. Yang and C. Dong, J. Anal. Appl. Pyrolysis, 2013, 104, 19–27 CrossRef CAS.
- X. Zhang, W. Yang and W. Blasiak, Fuel, 2012, 96, 383–391 CrossRef CAS.
- V. Agarwal, P. J. Dauenhauer, G. W. Huber and S. M. Auerbach, J. Am. Chem. Soc., 2012, 134, 14958–14972 CrossRef CAS PubMed.
- J. B. Wooten, J. I. Seeman and M. R. Hajaligol, Energy Fuels, 2004, 18, 1–15 CrossRef CAS.
- V. Oja and E. M. Suuberg, J. Chem. Eng. Data, 1999, 44, 26–29 CrossRef CAS.
- X. Bai and Y. Xue, in Fast Pyrolysis of Biomass: Advances in Science and Technology, ed. R. C. Brown and K. Wang, Royal Society of Chemistry, London, U.K., 2nd edn, 2017, pp. 57–77 Search PubMed.
- H. Kawamoto, M. Murayama and S. Saka, J. Wood Sci., 2003, 49, 469–473 CrossRef CAS.
- X. Bai, P. Johnston, S. Sadula and R. C. Brown, J. Anal. Appl. Pyrolysis, 2013, 99, 58–65 CrossRef CAS.
- T. Shoji, H. Kawamoto and S. Saka, J. Anal. Appl. Pyrolysis, 2014, 109, 185–195 CrossRef CAS.
- J. Zhang, M. W. Nolte and B. H. Shanks, ACS Sustainable Chem. Eng., 2014, 2, 2820–2830 CrossRef CAS.
- J. Proano-Aviles, J. K. Lindstrom, P. A. Johnston and R. C. Brown, Energy Technol., 2017, 5, 189–195 CrossRef CAS.
- C. Krumm, J. Pfaendtner and P. J. Dauenhauer, Chem. Mater., 2016, 28, 3108–3114 CrossRef CAS.
- S. Maduskar, V. Maliekkal, M. Neurock and P. J. Dauenhauer, ACS Sustainable Chem. Eng., 2018, 6, 7017–7025 CrossRef CAS.
- S. Maduskar, G. G. Facas, C. Papageorgiou, C. L. Williams and P. J. Dauenhauer, ACS Sustainable Chem. Eng., 2018, 6, 1387–1399 CrossRef CAS.
- M. S. Mettler, S. H. Mushrif, A. D. Paulsen, A. D. Javadekar, D. G. Vlachos and P. J. Dauenhauer, Energy Environ. Sci., 2012, 5, 5414–5424 RSC.
- C. Zhu, C. Krumm, G. G. Facas, M. Neurock and P. J. Dauenhauer, React. Chem. Eng., 2017, 2, 201–214 RSC.
- M. S. Mettler, A. D. Paulsen, D. G. Vlachos and P. J. Dauenhauer, Green Chem., 2012, 14, 1284 RSC.
- A. K. Burnham, in Global Chemical Kinetics of Fossil Fuels: How to Model Maturation and Pyrolysis, Springer International Publishing, 1st edn, 2017, pp. 25–74 Search PubMed.
- A. K. Burnham, X. Zhou and L. J. Broadbelt, Energy Fuels, 2015, 29, 2906–2918 CrossRef CAS.
- E. G. Prout and F. C. Tompkins, Trans. Faraday Soc., 1944, 40, 488–498 RSC.
- E. G. Prout and F. C. Tompkins, Trans. Faraday Soc., 1946, 42, 468–472 RSC.
- R. Capart, L. Khezami and A. K. Burnham, Thermochim. Acta, 2004, 417, 79–89 CrossRef CAS.
- P. E. Sánchez-Jiménez, L. A. Pérez-Maqueda, A. Perejón, J. Pascual-Cosp, M. Benítez-Guerrero and J. M. Criado, Cellulose, 2011, 18, 1487–1498 CrossRef.
- V. Mamleev, S. Bourbigot, M. Le Bras and J. Yvon, J. Anal. Appl. Pyrolysis, 2009, 84, 1–17 CrossRef CAS.
- J. Šesták and G. Berggren, Thermochim. Acta, 1971, 3, 1–12 CrossRef.
- J. F. Matthews, G. T. Beckham, M. Bergenstråhle-Wohlert, J. W. Brady, M. E. Himmel and M. F. Crowley, J. Chem. Theory Comput., 2012, 8, 735–748 CrossRef CAS PubMed.
- J. B. Austin and R. L. Rickett, Am. Inst. Min., Metall., Pet. Eng., 1939, 135, 396–415 Search PubMed.
- E. Jones, T. Oliphant and P. Peterson, SciPy: Open Source Scientific Tools for Python, http://www.scipy.org/ Search PubMed.
- F. Pérez and B. E. Granger, Comput. Sci. Eng., 2007, 9, 21–29 Search PubMed.
- Y. S. Choi, P. A. Johnston, R. C. Brown, B. H. Shanks and K.-H. Lee, J. Anal. Appl. Pyrolysis, 2014, 110, 147–154 CrossRef CAS.
- D. L. Dalluge, T. Daugaard, P. Johnston, N. Kuzhiyil, M. M. Wright and R. C. Brown, Green Chem., 2014, 4144–4155 RSC.
- E. Goss , Personal communication, January 22, 2016.
| This journal is © The Royal Society of Chemistry 2019 |