 Open Access Article
Creative Commons Attribution 3.0 Unported Licence
Iridium complexes catalysed the selective dehydrogenation of glucose to gluconic acid in water†
Pilar
Borja
 a,
Cristian
Vicent
b,
Miguel
Baya
 c,
Hermenegildo
García
 *d and
Jose A.
Mata
 *a
*a
aInstitute of Advanced Materials (INAM), Universitat Jaume I, Avda. Sos Baynat s/n, 12071, Castellón, Spain. E-mail: jmata@uji.es
bServeis Centrals d'Intrumentació Científica (SCIC), Universitat Jaume I, Avda. Sos Baynat s/n, 12071, Castellón, Spain
cInstituto de Síntesis Química y Catálisis Homogénea (ISQCH), Departamento de Química Inorgánica, CSIC-Universidad de Zaragoza, C/Pedro Cerbuna 12, E-50009 Zaragoza, Spain
dInstituto de Tecnología Química (ITQ), Universitat Politècnica de Valencia, Avda. Los Naranjos s/n, 46022, Valencia, Spain
First published on 10th August 2018
Abstract
We describe an unprecedented catalytic dehydrogenation of glucose by homogeneous catalysts. Iridium(III) complexes containing the fragment [Cp*Ir(NHC)]2+ (NHC = N-heterocyclic carbene ligand) are shown to be very active and highly selective catalysts for the dehydrogenation of glucose to gluconic acid and molecular hydrogen. Glucose is converted to gluconic acid at a catalyst loading of 2 mol%, at reflux in water, without additives and with a selectivity of over 95%. Experimental evidence obtained by 1H NMR spectroscopy and mass spectrometry (ESI/MS) reveals the formation of iridium coordinated to glucose and gluconic acid species. A plausible mechanism is proposed, based on the experimental evidence and supported by DFT calculations.
Introduction
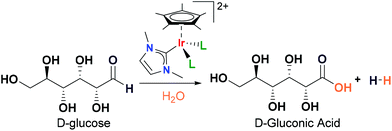
The production of chemicals from fossil resources is not a sustainable process because it generates considerable amounts of CO2. As an alternative, the conversion of biomass is an attractive and sustainable synthetic protocol for the green manufacture of profitable organic compounds.1–3 Among others, glucose is an abundant and renewable feedstock for the production of initial platform chemicals.4–7 Traditional systems for glucose transformation use harsh conditions such as high temperature or strong acids. The main challenge in the use of glucose is to control selectivity due to the presence of many functional groups.8–10 For instance, in the oxidation of glucose the formation of different acids and keto acids is normally observed. In the last few years, highly active heterogeneous catalysts have been developed using O2 as the oxidant. The Au/TiO2 based materials are among the most selective for the conversion of glucose to gluconic acid.11–14 However, industrial conversion of glucose is carried out by enzymatic biocatalysis. Glucose is selectively converted into gluconic acid by the enzyme glucose oxidase obtained from the fungus Aspergillus niger.15 Gluconic acid is an important building block in the production of other chemicals and it is used in the pharmaceutical and food industries.16 The production of gluconic acid by enzymes has limitations imposed by the use of these labile natural catalysts, such as the pH, oxygen pressure and catalyst recovery.In this manuscript, we describe an alternative process for the transformation of glucose into gluconic acid using iridium molecular complexes (Scheme 1). Traditional glucose oxidation involves the presence of air or oxygen with the concomitant formation of water. In contrast, in the catalytic dehydrogenation of glucose, water is the origin of both OH− groups of the carboxylic acid and the proton that releases molecular hydrogen. There are precedents in the literature describing the conversion of alcohols and aldehydes into carboxylic acids where water plays a key mechanistic role.17–25 We have experimental evidence in favour of the formation of iridium coordinated to glucose and gluconic acid species. Based on these observations as well as DFT calculations, a feasible reaction mechanism is proposed.
Results and discussion
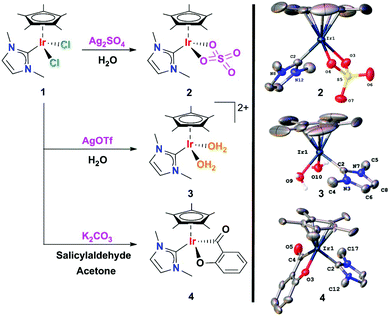
The catalytic dehydrogenation of glucose to gluconic acid was evaluated by using iridium(III) complexes containing the fragment [Cp*Ir(NHC)] (NHC stands for N-heterocyclic carbene). Iridium catalyst precursors were prepared by standard methods. The [Cp*Ir(NHC)(SO4)] complex 2 and the [Cp*Ir(NHC)(H2O)2](OTf)2 complex 3 were obtained from 1 using silver salts as halide abstractors and water as solvent (Scheme 2). A characterization study of complexes 2 and 3 by single crystal X-ray diffraction confirmed the chelating coordination mode of the sulfate ligand and the coordination of water molecules.In a typical catalytic experiment, the iridium complex was added to a solution of glucose in deionized water and the mixture was heated at reflux for an appropriate time. The progress of the reaction and product distribution was monitored by ESI/MS, NMR and HPLC. Given the potentially wide product distribution that can result from glucose oxidation, preliminary monitoring of the reaction outcome was performed by negative ESI-MS.26–28![[thin space (1/6-em)]](https://www.rsc.org/images/entities/char_2009.gif) ‡ The disappearance of the peak due to deprotonated glucose [glucose–H]− (m/z 179) concomitant with the sole formation of a new species at m/z 195 anticipated good selectivity toward gluconic acid. Details of the method optimization and chromatographic conditions for quantitation purposes are given in the ESI.†
‡ The disappearance of the peak due to deprotonated glucose [glucose–H]− (m/z 179) concomitant with the sole formation of a new species at m/z 195 anticipated good selectivity toward gluconic acid. Details of the method optimization and chromatographic conditions for quantitation purposes are given in the ESI.†![[thin space (1/6-em)]](https://www.rsc.org/images/entities/char_2009.gif) 29,30 The HPLC-MS/MS method consists of taking small aliquots of the crude reaction mixture, diluting them with water/methanol (95
29,30 The HPLC-MS/MS method consists of taking small aliquots of the crude reaction mixture, diluting them with water/methanol (95![[thin space (1/6-em)]](https://www.rsc.org/images/entities/char_2009.gif) :
:![[thin space (1/6-em)]](https://www.rsc.org/images/entities/char_2009.gif) 5) and directly injecting them into the HPLC-MS system. This methodology allows to (i) monitor glucose and gluconic acid without unnecessary work-up, minimizing the number of errors from sample pre-treatment steps, and (ii) obtain detailed temporal reaction profiles and rapid reaction optimization. Examples of the reaction profiles are shown in Fig. 1.
5) and directly injecting them into the HPLC-MS system. This methodology allows to (i) monitor glucose and gluconic acid without unnecessary work-up, minimizing the number of errors from sample pre-treatment steps, and (ii) obtain detailed temporal reaction profiles and rapid reaction optimization. Examples of the reaction profiles are shown in Fig. 1.
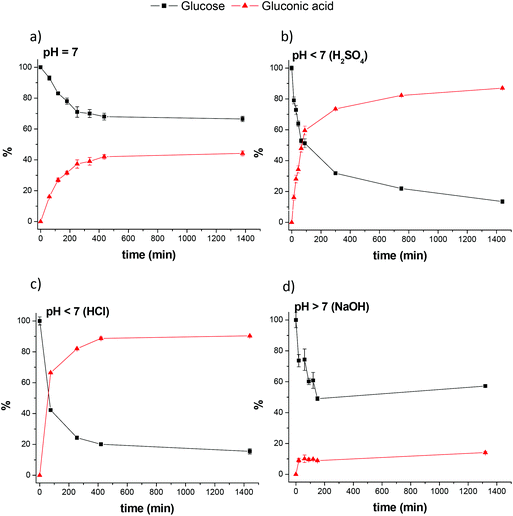 | ||
| Fig. 1 Temporal profile monitored by HPLC-MS/MS of glucose disappearance and gluconic acid formation. | ||
The results showed that catalyst precursors 1 and 2 were active in the conversion of glucose to gluconic acid without additives (Table 1). This transformation is a green process carried out under mild reaction conditions using water as solvent. Even more interesting is the formation of only gluconic acid among all the potential acids and ketoacids directly obtained from glucose (entries 3 and 4). We observed that glucose dehydrogenation is sensitive to pH variation. The addition of different amounts of base led to a significant decrease in gluconic acid yield accompanied by glucose degradation to unidentified products (entries 2, 5 and 6). The mass balance of the reactions could not be rationalized under basic conditions and glucose dehydrogenation was not further investigated in basic media. In this context, it is worth noting that under basic conditions in the absence of any catalyst (entry 2), glucose degradation without the formation of gluconic acid was also observed at identical reactions times. This suggests that both the intrinsic glucose degradation pathways caused by the presence of base and gluconic acid formation are simultaneously coexisting at basic pH values. The situation is completely reversed under acidic conditions. The use of 0.25 eq. of H2SO4 or HCl vs. glucose significantly accelerated glucose dehydrogenation without penalizing selectivity to gluconic acid (Fig. 1b and c). For example, under these conditions, 40% yield was obtained after 30 min whereas for the reaction at neutral pH, 40% yield was achieved after 6 h. Acidification enhanced glucose conversion and gluconic acid yield that increased from 44 to 88%. Further increasing the H2SO4 content did not substantially influence either the reaction yield (entries 7–10) or the kinetics of gluconic acid formation. The use of different amounts of HCl displayed identical reaction outcomes to those observed for H2SO4. Control experiments under these reaction conditions (entry 1) revealed that the iridium complexes are essential for glucose dehydrogenation.
| Entry | Cat. | Additive | Conv.a (%) | Yielda (%) | Selec.b (%) |
|---|---|---|---|---|---|
| Reaction conditions: glucose (80 mg, 0.44 mmol), catalyst loading (2 mol%), 24 h, 110 °C (bath temperature) and deionized H2O (20 mL).a Conversions and yields determined using HPLC-MS/MS.b Selectivity to gluconic acid was calculated as (moles of gluconic acid produced/moles of glucose reacted) × 100. | |||||
| 1 | — | H2SO4 (1 eq.) | 0 | 0 | 0 |
| 2 | — | NaOH (1 eq.) | 64 | 0 | 0 |
| 3 | 1 | — | 44 | 44 | 100 |
| 4 | 2 | — | 27 | 25 | 92 |
| 5 | 1 | NaOH (1 eq.) | 82 | 27 | 32 |
| 6 | 1 | NaOH (0.5 eq.) | 43 | 17 | 39 |
| 7 | 1 | H2SO4 (1 eq.) | 97 | 97 | 100 |
| 8 | 1 | H2SO4 (0.75 eq.) | 93 | 93 | 100 |
| 9 | 1 | H2SO4 (0.5 eq.) | 90 | 90 | 100 |
| 10 | 1 | H2SO4 (0.25 eq.) | 88 | 88 | 100 |
| 11 | 1 | HCl (0.25 eq.) | 86 | 86 | 100 |
| 12 | 2 | H2SO4 (0.5 eq.) | 39 | 39 | 100 |
| 13 | 2 | HCl (0.25 eq.) | 40 | 40 | 100 |
We also explored the potential application of iridium catalysts in the selective conversion of (poly)carbohydrates into gluconic acid. This represents a hot topic today with the main goal of affording valorised organic building-block chemicals, especially using water as solvent.31 Starch was selected as a target (poly)carbohydrate (Fig. 2). Starch is a polysaccharide made of glucose units bonded by β-glycosidic bonds. We used starch composed of 20–25% of amylose and 75–80% of amylopectin. In a typical reaction, starch was treated under the general conditions described for the dehydrogenation of glucose. Starch was dissolved in acidic water using 1 eq. of H2SO4 per glucose unit and heated at 100 °C in the presence of 2 mol% of catalyst 1. The reaction proceeded slowly due to the hydrolysis of glycosidic bonds and after 50 h, the conversion was 80% (considering all starch as glucose units). At that time, the yield of gluconic acid was 50% and the yield of glucose was 30%. The initial results reveal the potential application of iridium complexes as selective catalysts for the transformation of biomass into added-value chemical products. The success of the process lies in the high stability of catalyst 1 in acidic medium.
Mechanism
In order to understand the general mechanism of the dehydrogenation of glucose to gluconic acid, we first addressed the chemical speciation of 1 in aqueous solution and under catalytic conditions. Compound 1 is moderately soluble in water and different species coexist. The 1H NMR spectrum in D2O features broad signals for the NHC and the Cp* moieties, consistent with an equilibrium by chloride–water ligand exchange (Fig. S5†). This equilibrium has previously been established for other piano-stool complexes.32 The ESI/MS results also indicated that chloride cleavage and subsequent water coordination at the vacant sites took place upon dissolving 1 in water. A prominent hydroxo-ligated species of the formula [Cp*Ir(NHC)(OH)]+ (m/z 441.0) was observed in the ESI mass spectrum of aqueous solutions of 1 accompanied by doubly-charged species of the formula [Cp*Ir(NHC)]2+ (m/z 212.1) and [Cp*Ir(NHC)(H2O)]2+ (m/z 221.1). An additional peak at m/z 459 (Fig. S2†) was detected. This latter species indeed corresponded to a mixture of isobaric cations formulated as [Cp*Ir(NHC)Cl]+ and [Cp*Ir(NHC)(OH)(H2O)]+, as evidenced by its characteristic gas-phase fragmentation. The collision induced dissociation (CID) mass spectrum of mass-selected species at m/z 459 displays losses of Δm = 18 and 36, consistent with the sequential release of two water molecules simultaneously with one HCl molecule (Fig. S3†).Aqueous solutions of 1 undergo an equilibrium by chloride–water ligand exchange. This equilibrium is supported by 1H NMR and ESI/MS and generates complex [Cp*Ir(NHC)(H2O)2]2+ (32+) containing labile H2O ligands. Moreover, DFT calculations revealed that deprotonation of water molecules coordinated to organometallic complexes, such as in 32+, is a feasible process.33 Consequently, aqua and hydroxo species can exist in equilibrium in aqueous solutions, and it is reasonable to consider that this equilibrium can be shifted to the aqua 32+ species under acidic conditions. This explains the faster glucose conversion in acidic medium than at neutral pH and suggests that the 32+ dication is the active catalyst. For these reasons, we consider the aqua complex as the experimental input for the DFT studies.
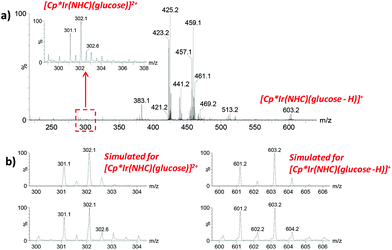
Next, we addressed the progress of the catalytic reaction by ESI/MS. The versatility of this technique for detecting short-lived or transient intermediates in mechanistic studies is well documented.34–36 In the present work, aliquots at different time intervals were taken, diluted with water and directly injected into the ESI mass spectrometer. Glucose coordination to the iridium complex was evidenced at the initial stages of the reaction by the m/z values, the isotopic pattern and fragmentation upon CID of species present in the mixture. Species formulated as [Cp*Ir(NHC)(glucose)]2+ (m/z 302) and [Cp*Ir(NHC)(glucose–H)]+ (m/z 603) were detected based on their m/z value, isotopic pattern (Fig. 3) and CID spectra (Fig. 4). It is worth noting that glucose binding at the Ir centre in the [Cp*Ir(NHC)(glucose)]2+ species was remarkable since glucose backbone fragmentation was preferred over neutral glucose release under CID conditions, suggesting strong glucose coordination. As the reaction proceeds, a new Ir-containing species could be detected in situ by ESI/MS monitoring, formally corresponding to gluconic acid ligation to the Ir complex. A peak at m/z 619 formulated as [Cp*Ir(NHC)(gluconic acid–H)]+ was observed according to its m/z value, isotopic pattern and CID mass spectrum (Fig. S4†).
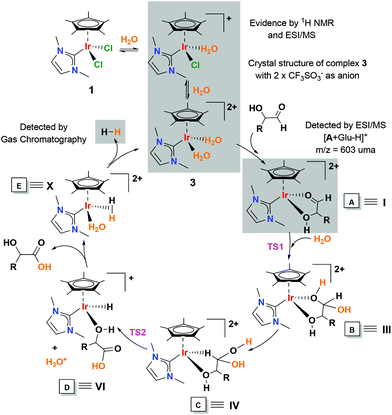
A plausible mechanism for the dehydrogenation of glucose is proposed, based on the above experimental evidence and complemented by density functional theory (DFT) calculations (Scheme 3). The initial hypothesis came from mechanistic investigations into the synthesis of carboxylic acids from alcohols in water,17,18,37–39 and from the conversion of aldehydes to carboxylic acids in the “Aldehyde-water shift” reaction.20 For the theoretical studies, a simplified model for the substrate, namely MeCH(OH)CHO ≡ 2-hydroxypropanal, was considered, minimizing the computational cost that would arise from the consideration of multiple glucose conformations.
The cycle starts with the formation of the aqua complex [Cp*Ir(NHC)(H2O)2]2+ (3) on the basis of the aqueous speciation described above. In order to prove that complex 3 is a competent catalytic active species, we performed the dehydrogenation of glucose using isolated 3 as a CF3SO3− salt. The results showed that complex 3 without additives is as efficient as complex 1 under acidic conditions for the conversion of glucose to gluconic acid in water. The H2O ligands in complex 3 are exchanged with glucose leading to species A. Species A was evidenced by ESI/MS and according to DFT calculations displays a chelate coordination mode via the carbonyl group and the hydroxo group. We hypothesize that this ordered cyclic arrangement not only confers remarkable stability to species A (as evidenced by CID experiments), but also is responsible for the propensity of the substrate to be converted selectively into gluconic acid. Experimental attempts to isolate crystals of glucose coordinated to 3 were unsuccessful. However, in a parallel experiment we observed the chelate coordination of a model substrate containing an ortho-substituted aldehyde and a hydroxyl group. The reaction of complex 1 with salicylaldehyde under basic conditions led to complex 4. Deprotonated salicylaldehyde was coordinated in a chelate mode as observed by single crystal X-ray diffraction (ESI, section S4†). This result lends indirect support to the proposed glucose chelate coordination mode. Then, a nucleophilic attack of water on the carbonyl of the coordinated glucose produces a gem-diol species B through a low barrier transition state 1 (12.9 kcal mol−1). Similar species have been detected and/or postulated in the conversion of alcohols to carboxylic acids in aqueous medium.40–42 If the nucleophilic attack on a coordinated carbonyl is produced by an amine or alcohol, the formed species is an hemiaminal or hemiacetal, respectively. These species are proposed as key intermediates in many transformations and are difficult to detect and/or isolate. Gusev et al. detected the formation of such species by ESI/MS using ruthenium and osmium catalysts.43,44 The gem-diol species rearranges to produce C that releases gluconic acid and a solvated proton (H3O+) and forms an iridium hydride (D). Then, the iridium hydride (D) is protonated, forming a dihydrogen species that releases hydrogen and regenerates the catalyst. Analysis by gas chromatography confirmed the gas evolution. As the reaction proceeds, a gluconic acid-coordinated species is also observed in the ESI/MS (Fig. S4†). This species is an out-of-cycle intermediate and results from the accumulation of gluconic acid in the reaction medium. Related acetate-ligated species have been identified and isolated in the pioneering examples of dehydrogenative oxidation of alcohols to carboxylic acid using Ru-based catalysts.17
The highest energy step, in this case also the rate determining step, corresponds to the hydride transfer from the gem diol to the iridium through TS2 (26.3 kcal mol−1), forming 2-hydroxypropanoic acid and H3O+ (Fig. 5). A similar high-energy step has been proposed in the “aldehyde-water shift reaction” using a bipyridine iridium complex.20 The energy profile diagram consists of a low barrier TS1 followed by a high barrier TS2 that support our experimental observations by ESI/MS. Although other pathways could be considered, the experimental results and the calculations support an energetically feasible route for the dehydrogenation of glucose as described in Scheme 3.
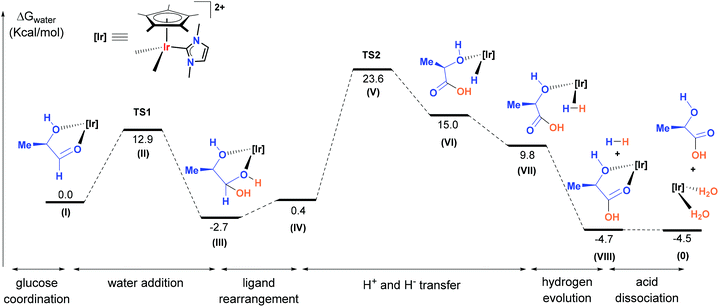 | ||
| Fig. 5 Abridged energy diagram for the conversion of R-MeCH(OH)CHO into the corresponding carboxylic acid catalysed by [Cp*Ir(NHC)]2+ (the complete mechanistic proposal is shown in Fig. S8†). | ||
Conclusions
Iridium complexes bearing NHC ligands are efficient catalysts for the production of gluconic acid from glucose in water and under mild reaction conditions. Glucose dehydrogenation in water represents a convenient methodology for the production of added-value chemicals from biomass. Using iridium complexes, the process is highly selective and we have not observed the formation of other acids or ketoacids. Experimental evidence obtained by 1H NMR spectrometry and mass spectroscopy (ESI/MS) shows the formation of catalytic intermediates that contain glucose coordinated to iridium. The results support an unprecedented catalytic dehydrogenation of glucose by homogeneous iridium complexes with the concomitant formation of hydrogen gas. A plausible mechanism is proposed based on the observation of these species and sustained by DFT calculations.Experimental section
General details
Complex 1 was prepared according to previously reported procedures.45 Complex 3 was previously synthesised using wet CH2Cl2 as solvent and in this manuscript, we report the synthesis of it using water as solvent.46D-Glucose (99%), D-gluconic acid (50% aq. sol), salicylaldehyde (98%), K2CO3 (99%), AgSO3CF3 (99%) and Ag2SO4 (99%) were purchased from commercial suppliers and used as received. HPLC-grade methanol (MeOH) and formic acid (HCOOH, content >98%) were purchased from Scharlab (Barcelona, Spain). HPLC-grade water was obtained from distilled water passed through a Milli-Q water purification system (Millipore, Bedford, MA, USA). Nuclear magnetic resonance (NMR) spectra were recorded on Bruker spectrometers operating at 300 or 400 MHz (1H NMR), 75 or 100 MHz (13C{1H} NMR) and 377 MHz (19F NMR), respectively, and referenced to SiMe4 or CCl3F (δ in ppm and J in Hz). NMR spectra were recorded at room temperature with the appropriate deuterated solvent.Methods
![[thin space (1/6-em)]](https://www.rsc.org/images/entities/char_2009.gif) 000 (FWHM). The drying and cone gas was nitrogen set to flow rates of 300 and 30 L h−1, respectively. A capillary voltage of 3.5 kV was used in the positive ESI(+) scan mode. The cone voltage was adjusted to a low value (typically Uc = 5–15 V) to control the extent of fragmentation in the source region. Chemical identification of the Ir-containing species was facilitated by the characteristic isotopic pattern at natural abundance of Ir and it was carried out by comparison of the isotope experimental and theoretical patterns using the MassLynx 4.1 software. Typically, aqueous solutions of compound 1 were stirred under catalytic conditions and aliquots were extracted at the required time intervals, diluted with water to a final concentration of 5 × 10⁻⁴ M (based on the initial Ir concentration) and directly introduced into the mass spectrometer. For CID experiments, the cations of interest were mass-selected using the first quadrupole (Q1) and interacted with argon in the T-wave collision cell at variable collision energies (Elaboratory = 3–15 eV). The ionic products of fragmentation were analysed with the time-of-flight analyser. The isolation width was 1 Da and the most abundant isotopomer was mass-selected in the first quadrupole analyser.
000 (FWHM). The drying and cone gas was nitrogen set to flow rates of 300 and 30 L h−1, respectively. A capillary voltage of 3.5 kV was used in the positive ESI(+) scan mode. The cone voltage was adjusted to a low value (typically Uc = 5–15 V) to control the extent of fragmentation in the source region. Chemical identification of the Ir-containing species was facilitated by the characteristic isotopic pattern at natural abundance of Ir and it was carried out by comparison of the isotope experimental and theoretical patterns using the MassLynx 4.1 software. Typically, aqueous solutions of compound 1 were stirred under catalytic conditions and aliquots were extracted at the required time intervals, diluted with water to a final concentration of 5 × 10⁻⁴ M (based on the initial Ir concentration) and directly introduced into the mass spectrometer. For CID experiments, the cations of interest were mass-selected using the first quadrupole (Q1) and interacted with argon in the T-wave collision cell at variable collision energies (Elaboratory = 3–15 eV). The ionic products of fragmentation were analysed with the time-of-flight analyser. The isolation width was 1 Da and the most abundant isotopomer was mass-selected in the first quadrupole analyser.
Synthetic procedures
![[thin space (1/6-em)]](https://www.rsc.org/images/entities/char_2009.gif) :
:![[thin space (1/6-em)]](https://www.rsc.org/images/entities/char_2009.gif) 1 v/v) as eluent to afford 4 as a yellow solid (yield. 37 mg, 68%). 1H-NMR (CD2Cl2, 400 MHz): 7.14 (d, 3JH3−H4 = 7 Hz, 1H, H3), 6.95 (d, 3J = 1 Hz, 1H, Him), 6.89 (d, 3J = 1 Hz, 1H, Him), 6.86 (d, 1H, H4), 6.75 (d, 3JH5−H6 = 8 Hz, 1H, H6), 6.23 (dd, 3JH4−H5 = 8 Hz, H5), 3.93 (s, 3H, –HN–CH3), 3.74 (s, 3H, –HN–CH3), 1.71 (s, 15H, HCp*). APT (CDCl3, 100 MHz): 179.98 (s, Ir–C
1 v/v) as eluent to afford 4 as a yellow solid (yield. 37 mg, 68%). 1H-NMR (CD2Cl2, 400 MHz): 7.14 (d, 3JH3−H4 = 7 Hz, 1H, H3), 6.95 (d, 3J = 1 Hz, 1H, Him), 6.89 (d, 3J = 1 Hz, 1H, Him), 6.86 (d, 1H, H4), 6.75 (d, 3JH5−H6 = 8 Hz, 1H, H6), 6.23 (dd, 3JH4−H5 = 8 Hz, H5), 3.93 (s, 3H, –HN–CH3), 3.74 (s, 3H, –HN–CH3), 1.71 (s, 15H, HCp*). APT (CDCl3, 100 MHz): 179.98 (s, Ir–C![[double bond, length as m-dash]](https://www.rsc.org/images/entities/char_e001.gif) O), 153.25 (s, C2), 145.21 (s, C–O–Ir), 132.54 (s, C4), 123.15 (s, CHim), 122.75 (s, CHim), 121.72 (s, C3), 115.38 (s, C6), 113.18 (s, C5), 91.04 (s, Cp*–C), 37.23 (s, N–CH3), 8.93 (s, Cp*–CH3); ESI/MS (cone 20 V; m/z, fragment): 545.2, [M + H]+, 568.2, [M + Na]+, 577.3, [M + CH3OH + H]+; elemental analysis calcd for C22H27IrN2O2, C: 48.60, H: 5.01, N: 5.15; found, C: 48.39, H: 4.78, N: 5.26.
O), 153.25 (s, C2), 145.21 (s, C–O–Ir), 132.54 (s, C4), 123.15 (s, CHim), 122.75 (s, CHim), 121.72 (s, C3), 115.38 (s, C6), 113.18 (s, C5), 91.04 (s, Cp*–C), 37.23 (s, N–CH3), 8.93 (s, Cp*–CH3); ESI/MS (cone 20 V; m/z, fragment): 545.2, [M + H]+, 568.2, [M + Na]+, 577.3, [M + CH3OH + H]+; elemental analysis calcd for C22H27IrN2O2, C: 48.60, H: 5.01, N: 5.15; found, C: 48.39, H: 4.78, N: 5.26.
Conflicts of interest
There are no conflicts to declare.Acknowledgements
The authors thank the MINECO (Severo Ochoa, CTQ2015-69153-C2-1-R, CTQ2015-69153-C2-2-R and CTQ2015-67461-P), Diputación General de Aragón (Grupo Consolidado E21) and Universitat Jaume I (P1.1B2015-09) for financial support. P. Borja thanks the Universitat Jaume I for a postdoctoral grant. The authors are very grateful to the ‘Serveis Centrals d'Instrumentació Científica (SCIC)’ of the Universitat Jaume I, S. Fuertes (Universidad of Zaragoza) for data collection of the X-ray structure of 4 and to the Instituto de Biocomputación y Física de Sistemas Complejos (BIFI) and the Centro de Supercomputación de Galicia (CESGA) for the generous allocation of computational resources.Notes and references
- A. Corma, S. Iborra and A. Velty, Chem. Rev., 2007, 107, 2411–2502 CrossRef PubMed.
- M. Besson, P. Gallezot and C. Pinel, Chem. Rev., 2014, 114, 1827–1870 CrossRef PubMed.
- R. A. Sheldon, Green Chem., 2014, 16, 950–963 RSC.
- L. T. Mika, E. Cséfalvay and Á. Németh, Chem. Rev., 2018, 118, 505–613 CrossRef PubMed.
- M. J. Climent, A. Corma and S. Iborra, Green Chem., 2011, 13, 520–540 RSC.
- M. J. Climent, A. Corma and S. Iborra, Chem. Rev., 2011, 111, 1072–1133 CrossRef PubMed.
- P. Gallezot, Chem. Soc. Rev., 2012, 41, 1538–1558 RSC.
- B. C. E. Makhubela and J. Darkwa, Johnson Matthey Technol. Rev., 2018, 62, 4–31 CrossRef.
- P. Gallezot, ChemSusChem, 2008, 1, 734–737 CrossRef PubMed.
- F. M. A. Geilen, B. Engendahl, A. Harwardt, W. Marquardt, J. Klankermayer and W. Leitner, Angew. Chem., Int. Ed., 2010, 49, 5510–5514 CrossRef PubMed.
- A. Mirescu, H. Berndt, A. Martin and U. Prüße, Appl. Catal., A, 2007, 317, 204–209 CrossRef.
- C. Baatz and U. Pruse, J. Catal., 2007, 249, 34–40 CrossRef.
- Y. Önal, S. Schimpf and P. Claus, J. Catal., 2004, 223, 122–133 CrossRef.
- S. Biella, L. Prati and M. Rossi, J. Catal., 2002, 206, 242–247 CrossRef.
- S. Ramachandran, P. Fontanille, A. Pandey and C. Larroche, Food Technol. Biotechnol., 2006, 44, 185–195 Search PubMed.
- P. Gallezot, Green Chem., 2007, 9, 295–302 RSC.
- E. Balaraman, E. Khaskin, G. Leitus and D. Milstein, Nat. Chem., 2013, 5, 122–125 CrossRef PubMed.
- T. Zweifel, J.-V. Naubron and H. Grützmacher, Angew. Chem., Int. Ed., 2009, 48, 559–563 CrossRef PubMed.
- K. Fujita, R. Tamura, Y. Tanaka, M. Yoshida, M. Onoda and R. Yamaguchi, ACS Catal., 2017, 7, 7226–7230 CrossRef.
- T. P. Brewster, W. C. Ou, J. C. Tran, K. I. Goldberg, S. K. Hanson, T. R. Cundari and D. M. Heinekey, ACS Catal., 2014, 4, 3034–3038 CrossRef.
- G. E. Dobereiner, J. Yuan, R. R. Schrock, A. S. Goldman and J. D. Hackenberg, J. Am. Chem. Soc., 2013, 135, 12572–12575 CrossRef PubMed.
- J. Choi, A. H. R. MacArthur, M. Brookhart and A. S. Goldman, Chem. Rev., 2011, 111, 1761–1779 CrossRef PubMed.
- C. Wang and J. Xiao, Chem. Commun., 2017, 53, 3399–3411 RSC.
- X. Wang, C. Wang, Y. Liu and J. Xiao, Green Chem., 2016, 18, 4605–4610 RSC.
- Y. Sawama, K. Morita, T. Yamada, S. Nagata, Y. Yabe, Y. Monguchi and H. Sajiki, Green Chem., 2014, 16, 3439–3443 RSC.
- D. W. Robbins and J. F. Hartwig, Science, 2011, 333, 1423–1427 CrossRef PubMed.
- L. Da Vià, C. Recchi, T. E. Davies, N. Greeves and J. A. Lopez-Sanchez, ChemCatChem, 2016, 8, 3475–3483 CrossRef PubMed.
- L. Da Vià, C. Recchi, E. O. Gonzalez-Yañez, T. E. Davies and J. A. Lopez-Sanchez, Appl. Catal., B, 2017, 202, 281–288 CrossRef.
- M. E. Monge, J. J. Pérez, P. Dwivedi, M. Zhou, N. A. McCarty, A. A. Stecenko and F. M. Fernández, Rapid Commun. Mass Spectrom., 2013, 27, 2263–2271 CrossRef PubMed.
- P. Sandín-España, M. Mateo-Miranda, C. López-Goti, A. De Cal and J. L. Alonso-Prados, Food Chem., 2016, 192, 268–273 CrossRef PubMed.
- I. Bodachivskyi, U. Kuzhiumparambil and D. B. G. Williams, ChemSusChem, 2018, 11, 642–660 CrossRef PubMed.
- P. Csabai and F. Joó, Organometallics, 2004, 23, 5640–5643 CrossRef.
- L. Bellarosa, J. Díez, J. Gimeno, A. Lledós, F. J. Suárez, G. Ujaque and C. Vicent, Chem. – Eur. J., 2012, 18, 7749–7765 CrossRef PubMed.
- D. Schröder, Acc. Chem. Res., 2012, 45, 1521–1532 CrossRef PubMed.
- K. L. Vikse, Z. Ahmadi and J. S. McIndoe, Coord. Chem. Rev., 2014, 279, 96–114 CrossRef.
- L. P. E. Yunker, R. L. Stoddard and J. S. McIndoe, J. Mass Spectrom., 2014, 49, 1–8 CrossRef PubMed.
- R. Kawahara, K. Fujita and R. Yamaguchi, J. Am. Chem. Soc., 2012, 134, 3643–3646 CrossRef PubMed.
- M. Trincado, D. Banerjee and H. Grützmacher, Energy Environ. Sci., 2014, 7, 2464–2503 RSC.
- D. Ventura-Espinosa, C. Vicent, M. Baya and J. A. Mata, Catal. Sci. Technol., 2016, 6, 8024–8035 RSC.
- C. Gunanathan and D. Milstein, Science, 2013, 341, 1229712 CrossRef PubMed.
- H. Li and M. B. Hall, J. Am. Chem. Soc., 2014, 136, 383–395 CrossRef PubMed.
- R. E. Rodríguez-Lugo, M. Trincado, M. Vogt, F. Tewes, G. Santiso-Quinones and H. Grützmacher, Nat. Chem., 2013, 5, 342–347 CrossRef PubMed.
- C. Vicent and D. G. Gusev, ACS Catal., 2016, 6, 3301–3309 CrossRef.
- D. Spasyuk, C. Vicent and D. G. Gusev, J. Am. Chem. Soc., 2015, 137, 3743–3746 CrossRef PubMed.
- X.-Q. Xiao and G.-X. Jin, J. Organomet. Chem., 2008, 693, 3363–3368 CrossRef.
- M. C. Lehman, J. B. Gary, P. D. Boyle, M. S. Sanford and E. A. Ison, ACS Catal., 2013, 3, 2304–2310 CrossRef.
Footnotes |
| † Electronic supplementary information (ESI) available: Experimental procedures, the HPLC-MS/MS method, crystallographic data and DFT calculations. CCDC 1850450 (2), 1850451 (3) and 1850452 (4). For ESI and crystallographic data in CIF or other electronic format see DOI: 10.1039/c8gc01933a |
| ‡ The versatility of MS for the discovery of new catalytic reactions is exemplified by Robbins and Hartwig in ref. 26; in particular, the analysis of oxidized products from glucose using ESI/MS has been documented in ref. 27 and 28. |
| This journal is © The Royal Society of Chemistry 2018 |

