One-pot synthesis of g-C3N4-doped amine-rich porous organic polymer for chlorophenol removal†
Haijian
Ou‡
a,
Weijun
Zhang‡
b,
Xiaofang
Yang
c,
Qingrong
Cheng
d,
Guiying
Liao
 *a,
Hua
Xia
a and
Dongsheng
Wang
*ac
aDepartment of Chemistry, Faculty of Material Science and Chemistry, China University of Geosciences, Wuhan, 430074, Hubei, China. E-mail: liaogy@cug.edu.cn
bSchool of Environmental Studies, China University of Geosciences, Wuhan 430074, Hubei, China
cState Key Laboratory of Environmental Aquatic Chemistry, Research Center for co-Environmental Sciences, Chinese Academy of Sciences, Beijing 100085, China. E-mail: wgds@rcees.ac.cn
dWuhan Institute of Technology, Wuhan 430074, China
First published on 24th November 2017
Abstract
A novel graphitic carbon nitride (g-C3N4)/amine-rich porous organic polymer (RAPOP) was synthesized via one-pot polymerization using various molar ratios of melamine (MA)/terephthalaldehyde (TA)/g-C3N4 of 4/4/1, 4/4/2 and 4/4/4. The g-C3N4 was used as a supporting scaffold, and its stratified structure provided a skeleton. Polymerization between MA and TA mostly occurred on the surface of g-C3N4, which formed porous spatial structures, in particular, that of MA/TA/g-C3N4 (4/4/2), of which the surface area and pore volume reached 540.36 m2 g−1 and 1.502 cm3 g−1, respectively. Their excellent adsorption performance towards 2,4-dichlorophenol was investigated under different conditions. A solution pH of 7 was favorable for adsorption. The presence of Na+ and Cl− ions had no adverse effects on the adsorption process, whereas humic acid (HA) led to a slight decrease in performance. Adsorption equilibrium was reached within 40 seconds, and the maximum adsorbed amounts were 188.70 mg g−1, 217.39 mg g−1, 238.10 mg g−1 and 270.27 mg g−1 for MA/TA (4/4), MA/TA/g-C3N4 (4/4/4), MA/TA/g-C3N4 (4/4/1) and MA/TA/g-C3N4 (4/4/2), respectively, at 298 K. Thermodynamic tests indicated that the adsorption proceeded spontaneously and endothermically. Moreover, the adsorbents maintained their high performance and stability after regeneration via treatment with alkali. This work demonstrates that g-C3N4/RAPOP can be practically employed to remove chlorophenols from aqueous solutions.
Environmental significanceCurrently, the discharge of harmful organic pollutants, including phenols, fatty acids, nitriles, etc., from households, agriculture and industry poses a great threat to the environment and human health. Chlorophenols, which are a typical class of phenols, have attracted growing attention because they are employed in many fields, for example, as pesticides and insecticides. They contain a stable conjugated system because of the presence of chlorine atoms and a benzene ring. As a result, they possess the properties of high toxicity, poor biodegradability and biological accumulation. They may induce damage to the structure of cellular phospholipid bilayers, which can cause carcinogenic and mutagenic effects. Therefore, there is an urgent need to rationally and efficiently treat discharged chlorophenol contaminants in wastewater. |
1. Introduction
Currently, the discharge of harmful organic pollutants, including phenols, fatty acids, nitriles, etc., from households, agriculture and industry poses a great threat to the environment and human health.1 Chlorophenols, which are a typical class of phenols, have attracted growing attention because they are employed in many fields, for example, as pesticides and insecticides. They contain a stable conjugated system because of the presence of chlorine atoms and a benzene ring. As a result, they possess the properties of high toxicity, poor biodegradability and biological accumulation.2,3 They may induce damage to the structure of cellular phospholipid bilayers, which can cause carcinogenic and mutagenic effects.4 Therefore, there is an urgent need to rationally and efficiently treat discharged chlorophenol contaminants in wastewater.Various treatments, such as biocatalysis, adsorption and oxidation, have been established for treating chlorophenols.5 Among these, adsorption has mainly attracted attention owing to its high efficiency, low cost and simple implementation. Various traditional adsorbents have been widely employed to remove chlorophenols. For example, Fanaie et al. removed 4-chlorophenol from aqueous solutions by using digested sludge.6 Oh et al. studied the use of granular activated carbon to adsorb a binary mixture of phenol and 4-chlorophenol.7 Soltani and Lee investigated the adsorption of 2-chlorophenol onto ultrasonically synthesized graphene materials.8 However, it can be seen that the adsorption capacity and rate of these materials were severely limited because of defects in their structure. Therefore, the development of novel adsorbent materials with large surface areas and porous structures is urgently required to increase adsorption capacities and accelerate adsorption rates.
In recent years, porous materials have been widely employed, such as covalent organic frameworks (COFs), metal–organic frameworks (MOFs) and polymer-based porous materials.9–12 Among these, polymer-based porous materials have attracted growing attention because they are endowed with the qualities of low density and high thermal and chemical stability, are linked by strong covalent bonds, and allow pore size control and functional tailoring.13–15 In particular, RAPOP was prepared by a polymerization process between an amine and phthalaldehyde, exhibited a macro/meso/microporous structure owing to the nano-aggregation effect16–18 and also possessed many valuable properties, including a large surface area, excellent porous structure, flexible chemical modification and abundant adsorptive sites.19–21 However, some drawbacks still existed; for example, the homogeneous porosity of its microscopic framework and the excessive aggregation of its nanoparticles made it imperfect as an outstanding porous structure with diversified adsorption performance. Different methods have been utilized to remedy its defects. For example, Zhang et al. synthesized a mesoporous carbon composite derived from RAPOP co-doped with an appropriate weight (4 g) of magnesium nitrate hexahydrate, and the capture capacity for CO2 increased from 2.27 mmol g−1 to 2.45 mmol g−1 at 298 K and 1 bar.17
As a covalently bonded polymeric material, g-C3N4 has attracted worldwide attention. It has a graphite-like stratified structure and abundant surplus amino groups. In each layer, the p electrons in the p orbitals of the carbon and nitrogen atoms form a complex conjugated system, which makes g-C3N4 very chemically stable. In each layer, hydrogen bonding interactions play a major role owing to the presence of nitrogen and oxygen atoms, which can provide abundant active sites and make g-C3N4 possess high thermal stability, excellent chemical stability and high reactivity.22,23 Hence, the doping of g-C3N4 into RAPOP was a significant attempt to provide a new pathway to enhance the adsorption performance of the polymer. Cao et al. fabricated a highly water-selective hybrid membrane by incorporating g-C3N4 nanosheets into a sodium alginate polymer (3 wt%), and the permeate flux of water was increased from 1653 g m−2 h−1 to 2469 g m−2 h−1 at 76 °C and a feed water concentration of 10 wt%.24 Thus, it can be seen that the capacity was greatly increased by doping an auxiliary support into the polymer. In particular, g-C3N4 seems to be one of the most promising supports for improving the applicability of these porous materials.
The selective use of g-C3N4 as a supporting scaffold plays an important role in facilitating the formation of architectures with large surface areas and outstanding porosity. In the synthesis of RAPOP, there were abundant uncertainties: the particle growth of the polymer was random and occurred at any possible position, and the specific surface area and pore size could easily be affected by internal and external conditions, such as the concentration of the monomers and moisture content of the solution.25 Upon the addition of g-C3N4, its particular stratified structure could provide a skeleton for polymerization, and the particle growth of the aggregates could be controlled and channeled in a specific direction. Therefore, the final product was synthesized according to a designed route.23,26
Here, g-C3N4/RAPOP was synthesized by using different molar ratios of MA/TA/g-C3N4 of 4/4/1, 4/4/2 and 4/4/4, and RAPOP was prepared via a Schiff base reaction between MA and TA. To evaluate the adsorption ability of samples towards chlorophenols, we selected 2,4-DCP as a model pollutant. Batch adsorption experiments were used to investigate the effects of the solution pH, adsorbent dosage, ionic strength, contact time, temperature and addition of humic substances on the removal of 2,4-DCP. In addition, the kinetics, isotherms and thermodynamics of adsorption were also discussed to study the underlying mechanism. Finally, the reusability and regenerability of the adsorbents were assessed.
2. Materials and methods
2.1. Materials
Melamine (MA) and terephthalaldehyde (TA) were dried at 100 °C in a vacuum. Dimethyl sulfoxide (DMSO) was distilled in a vacuum by drying over CaH2. 2,4-Dichlorophenol (2,4-DCP) was obtained from Aladdin, and other solvents and reagents were of analytical grade and were purchased from Sinopharm Chemical Reagent Co.2.2. Preparation of RAPOP and g-C3N4/RAPOP
A sample of g-C3N4 was prepared via calcination.27,28 In order to obtain g-C3N4 with surplus amine groups, 350 °C was used as the temperature for calcination. In detail, 5 g of MA in an alumina crucible was heated to 350 °C from room temperature in a tube furnace at a rate of 2.5 °C min−1 in an N2 atmosphere at ambient pressure and kept for 4 h at 350 °C. The synthetic route is displayed in Scheme 1(a). A light yellow sample of g-C3N4 was obtained after natural cooling and then ground to form powdered g-C3N4 (235 g mol−1).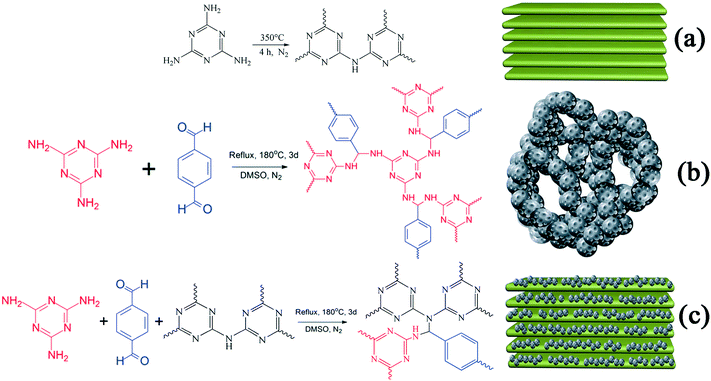 | ||
| Scheme 1 Synthetic routes and schematic illustrations of (a) g-C3N4, (b) RAPOP and (c) g-C3N4/RAPOP. | ||
RAPOP and g-C3N4/RAPOP were synthesized by thermal polymerization.18,29 In order to obtain amine-rich polymers and study the contribution of g-C3N4 to the structure and performance of the polymers, the molar ratio of MA/TA was 4/4 and those of MA/TA/g-C3N4 were 4/4/1, 4/4/2 and 4/4/4. In detail, MA (0.0100 mol), g-C3N4 (0.0000, 0.0025, 0.0050, and 0.0100 mol), TA (0.0100 mol) and DMSO (50 mL) were added to a 100 mL single-necked flask and stirred for 3 hours at 100 °C. Then, 2 mL toluene was added and the mixture was heated for 72 hours at 180 °C under inert conditions using a Dean–Stark apparatus. The synthetic routes are shown in Scheme 1(b and c). After natural cooling, 30 mL acetone was added and the mixture was stirred for 3 hours. Then, acetone, tetrahydrofuran and methylene chloride were separately used to wash the coarse solid. Finally, the product was dried for 12 hours at 100 °C in a vacuum, and the yields reached 65%, 78%, 83% and 72%, respectively.
2.3. Characterization
FE-SEM images were acquired using an FEI Sirion 200 (FEI Co., Netherlands) field emission scanning electron microscope at 10 kV. TEM images were recorded with a Tecnai G220 transmission electron microscope (FEI, Netherlands). Fourier transform infrared (FT-IR) spectra were recorded using a Vertex 70 spectrometer (Bruker, USA). Thermogravimetric analysis (TGA) was performed with a Pyris 1 TGA (PerkinElmer Instruments) thermal analyzer at a rate of 10 °C min−1 under an N2 atmosphere. X-ray diffraction (XRD) patterns were recorded using a Rigaku D/max-2550 diffractometer with Ni-filtered Cu Kα radiation in the 2θ range from 5° to 80° at 40 kV and 30 mA. X-ray photoelectron spectroscopy (XPS) was performed using a Vacuum Generators MultiLab 2000 spectrometer with monochromatic Al Kα radiation at 298 K. N2 adsorption–desorption isotherms were recorded with a Micromeritics 2020 HD88 (Micromeritics Instrument Co., USA) apparatus at 77 K. Surface areas were calculated by the Brunauer–Emmett–Teller method. Zeta potentials were measured with a Zetasizer Nano ZS90 analyzer (Malvern Instruments, UK).2.4. Adsorption experiments
Batch experiments were carried out to determine the effects of the solution pH, adsorbent dosage, ionic strength, contact time, temperature and addition of HA. Before the experiments, the adsorbents were dried at 100 °C for 12 hours in a vacuum. A solution of 2,4-DCP was obtained by dissolving the solid in high-purity water.The effect of pH was determined by mixing 10 mg samples of adsorbent into 40 mL of 20 mg L−1 2,4-DCP solutions (pH 2 to 10), which were then shaken in an orbital shaker at 180 rpm and 298 K for 2 minutes to ensure that adsorption equilibrium was reached. The solution pH was adjusted with 0.1 mol L−1 HCl and 0.1 mol L−1 NaOH solutions and measured with a Mettler Toledo FE20 pH meter. Finally, the solutions were separated from the adsorbents with a 0.45 mm syringe filter and analyzed using a Persee TU-1901 UV-vis spectrophotometer at 284 nm.5
The adsorbed amount qt (mg g−1) was calculated as follows:
 | (1) |
 | (2) |
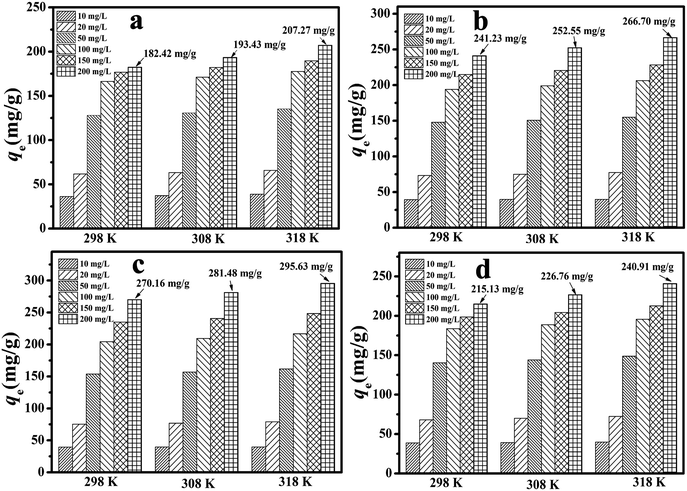
In order to select the adsorbent dosage, different masses of RAPOP and g-C3N4/RAPOP (1, 3, 5, 8, 10, 13, 15, and 20 mg) were added to 2,4-DCP solutions (pH 7, 40 mL, 20 mg L−1) for 2 minutes, respectively. To study the effect of ionic strength, different concentrations of NaCl (2 g L−1 to 10 g L−1) were added to 2,4-DCP solutions. To determine the equilibrium time, the reacted 2,4-DCP solutions (pH 7, 40 mL, 20 mg L−1) were tested at different times. The effect of temperature was determined by investigating the adsorption capacities of the as-prepared materials in 2,4-DCP solutions (pH 7, 40 mL) with different initial concentrations (10, 20, 50, 100, 150, and 200 mg L−1) for 2 minutes at 298 K, 308 K and 318 K, respectively. The effect of the addition of humic substances was investigated by gradually increasing the concentration (30 to 150 mg L−1) of humic acid (HA) in 2,4-DCP solutions, and the HA solution was analyzed using a Teledyne Tekmar TOC analyzer. Finally, to recycle the adsorbed materials, a 0.5 mol L−1 NaOH solution was utilized to elute the adsorbed RAPOP and g-C3N4/RAPOP until no 2,4-DCP was detected in the eluate.
3. Results and discussion
3.1. Characterization of RAPOP and g-C3N4/RAPOP
FE-SEM and TEM were used to observe their microstructures. As seen in Fig. 1(a and b), g-C3N4 possessed a typical layered structure. In each layer, the component particles were arranged closely and regularly. Between neighbouring layers, van der Waals forces were beneficial for forming the layered structure. As shown in Fig. 1(c and d), interconnected nanoparticles with sizes of 20–40 nm formed the skeleton of RAPOP, and a micro/meso/macroporous structure and three-dimensional network framework were both clearly observed.17,18,29 According to Fig. 1(e–l), the petaloid sheet structure and porous three-dimensional skeleton of g-C3N4/RAPOP were perfectly obtained, which suggests that the use of g-C3N4 as a supporting scaffold improved the porous structure. The incorporation of g-C3N4 provided a skeleton and more abundant reactive sites, and polymerization mostly occurred on the surface of g-C3N4, which made the product nanoparticles grow to form agglomerates along every sheet of the stratified structure and finally form more complex porous structures.26 However, when excess g-C3N4 was added, the nanoparticle sizes increased and the interstitial spaces became gradually narrower, which consequently resulted in a deterioration of the porous structure.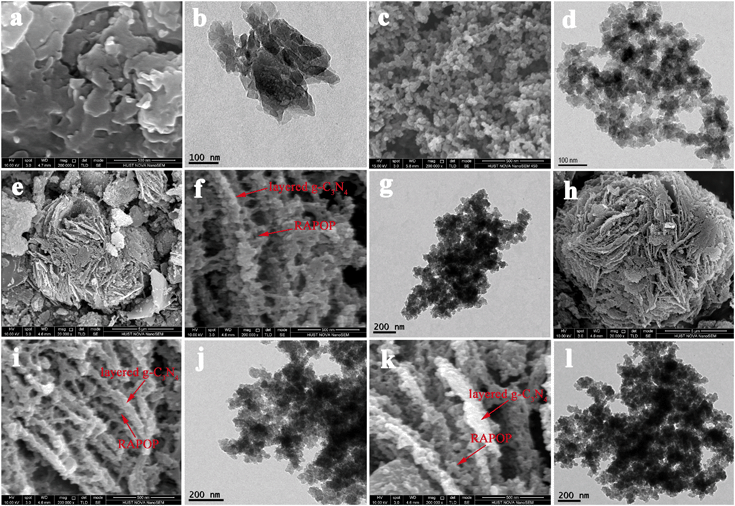 | ||
| Fig. 1 FE-SEM and TEM images of (a and b) g-C3N4, (c and d) RAPOP and g-C3N4/RAPOP with MA/TA/g-Cl3N4 ratios of (e–g) 4/4/1, (h–j) 4/4/2 and (k and l) 4/4/4. | ||
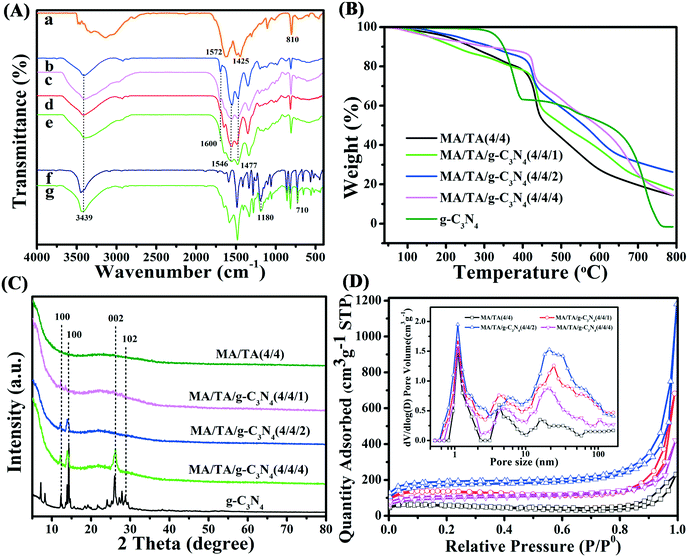
The FT-IR spectra are displayed in Fig. 2A. As seen in the spectra, g-C3N4 displayed typical absorption bands due to C![[double bond, length as m-dash]](https://www.rsc.org/images/entities/char_e001.gif) N stretching (1572 cm−1), aromatic C–N stretching (1425 cm−1) and deformation modes of s-triazine rings (810 cm−1).22,30 These indicated that the g-C3N4 precursor was successfully prepared. For RAPOP, absorption peaks (Fig. 2A(b)) due to quadrant and semicircle stretching vibrations of triazine rings (1477 cm−1 and 1546 cm−1) and C–N stretching vibrations (1600 cm−1) were observed.31–33 These results confirmed that RAPOP was polymerized to a significant extent. For g-C3N4/RAPOP (Fig. 2A(c–e)), the RAPOP peaks for triazine rings (1477 cm−1 and 1546 cm−1) and C–N stretching vibrations (1600 cm−1) were still retained, and characteristic peaks of g-C3N4 could also be found at 1572 cm−1, 1425 cm−1 and 810 cm−1. This demonstrated that g-C3N4 had been successfully incorporated into RAPOP. Characteristic peaks of 2,4-DCP (Fig. 2A(f)) were found at 3439 cm−1 and 710 cm−1 for phenolic hydroxyl groups and benzene rings, respectively, and at 1180 cm−1 for chlorine atoms at ortho- and para-positions to phenol groups.34,35 From Fig. 2A(g), it is obvious that the absorption bands of 2,4-DCP were present in the spectrum of the MA/TA/g-C3N4 (4/4/2) polymer, which revealed that 2,4-DCP was adsorbed on the polymer surface.
N stretching (1572 cm−1), aromatic C–N stretching (1425 cm−1) and deformation modes of s-triazine rings (810 cm−1).22,30 These indicated that the g-C3N4 precursor was successfully prepared. For RAPOP, absorption peaks (Fig. 2A(b)) due to quadrant and semicircle stretching vibrations of triazine rings (1477 cm−1 and 1546 cm−1) and C–N stretching vibrations (1600 cm−1) were observed.31–33 These results confirmed that RAPOP was polymerized to a significant extent. For g-C3N4/RAPOP (Fig. 2A(c–e)), the RAPOP peaks for triazine rings (1477 cm−1 and 1546 cm−1) and C–N stretching vibrations (1600 cm−1) were still retained, and characteristic peaks of g-C3N4 could also be found at 1572 cm−1, 1425 cm−1 and 810 cm−1. This demonstrated that g-C3N4 had been successfully incorporated into RAPOP. Characteristic peaks of 2,4-DCP (Fig. 2A(f)) were found at 3439 cm−1 and 710 cm−1 for phenolic hydroxyl groups and benzene rings, respectively, and at 1180 cm−1 for chlorine atoms at ortho- and para-positions to phenol groups.34,35 From Fig. 2A(g), it is obvious that the absorption bands of 2,4-DCP were present in the spectrum of the MA/TA/g-C3N4 (4/4/2) polymer, which revealed that 2,4-DCP was adsorbed on the polymer surface.
TGA was used to investigate the thermostability of the samples (Fig. 2B). RAPOP and g-C3N4/RAPOP exhibited slight weight losses below 250 °C owing to the release of residual moisture, solvent and carbon dioxide. Obvious weight loss was not observed until 400 °C, which suggested their outstanding thermal stability. These results were also found for other similar polymers.17,36 The weight of g-C3N4 was reduced dramatically above 350 °C owing to the loss of residual amine groups and a proportion of the nitrogen atoms in triazine rings. Importantly, the weight loss was much less when the molar ratio was increased gradually, which revealed that the incorporation of g-C3N4 improved the thermal stability of the polymers.
The XRD patterns of the samples are shown in Fig. 2C. The sharp diffraction peaks of g-C3N4 at 12.0°, 14.3°, 26.4° and 29.1° were attributed to the (100), (100), (002) and (102) crystallographic planes, respectively, which implied that the prominent layered structure was in the crystalline state.22,26,39 The patterns of g-C3N4/RAPOP displayed similar peaks to those of g-C3N4, which indicated that g-C3N4 was successfully incorporated into the polymers and the crystalline phase mainly comprised g-C3N4 in these samples of g-C3N4/RAPOP. However, with a decrease in the g-C3N4 ratio, less intense diffraction peaks of g-C3N4/RAPOP were observed, which indicated that RAPOP was in the amorphous state and g-C3N4 maintained its layered structure and served the function of supporting the polymer structure.
XPS was performed to analyze the surface binding state and elemental composition. Fig. 3 shows the XPS spectra of MA/TA/g-C3N4 (4/4/2). From Fig. 3(a), it is obvious that the polymer contained C, N and O elements, and their mass contents were 59.85%, 32.68% and 7.47%, respectively (inset of Fig. 3(a)), which indicated that the polymer mainly comprised C and N elements. In the high-resolution C 1s scan (Fig. 3(b)), there were three peaks at 287.7, 284.9 and 286.7 eV, which represented carbon atoms in triazine rings (–C![[double bond, length as m-dash]](https://www.rsc.org/images/entities/char_e001.gif) N–), aromatic rings (–C
N–), aromatic rings (–C![[double bond, length as m-dash]](https://www.rsc.org/images/entities/char_e001.gif) C–) and –N–C–N– linkages, respectively, which indicated that the monomers were successfully polymerized.12,22 The high-resolution N 1s scan (Fig. 3(c)) was fitted to four peaks at 398.2, 399.4, 400.0 and 398.8 eV, which corresponded to triazine groups (–C
C–) and –N–C–N– linkages, respectively, which indicated that the monomers were successfully polymerized.12,22 The high-resolution N 1s scan (Fig. 3(c)) was fitted to four peaks at 398.2, 399.4, 400.0 and 398.8 eV, which corresponded to triazine groups (–C![[double bond, length as m-dash]](https://www.rsc.org/images/entities/char_e001.gif) N–), tertiary amine groups (–N–(C)3), imine groups (–NH–) and amine groups (–NH2), respectively.26 The two peaks for O 1s at 533.4 and 532.1 eV (Fig. 3(d)) resulted from a small quantity of carbonyl groups (–C
N–), tertiary amine groups (–N–(C)3), imine groups (–NH–) and amine groups (–NH2), respectively.26 The two peaks for O 1s at 533.4 and 532.1 eV (Fig. 3(d)) resulted from a small quantity of carbonyl groups (–C![[double bond, length as m-dash]](https://www.rsc.org/images/entities/char_e001.gif) O) and hydroxyl groups (–OH), respectively, which belonged to surface adsorbed carbon dioxide and moisture.17 These results all demonstrated that MA and TA were polymerized to a sufficient extent and g-C3N4 was successfully incorporated into the polymers to form the novel g-C3N4/RAPOP polymer.
O) and hydroxyl groups (–OH), respectively, which belonged to surface adsorbed carbon dioxide and moisture.17 These results all demonstrated that MA and TA were polymerized to a sufficient extent and g-C3N4 was successfully incorporated into the polymers to form the novel g-C3N4/RAPOP polymer.
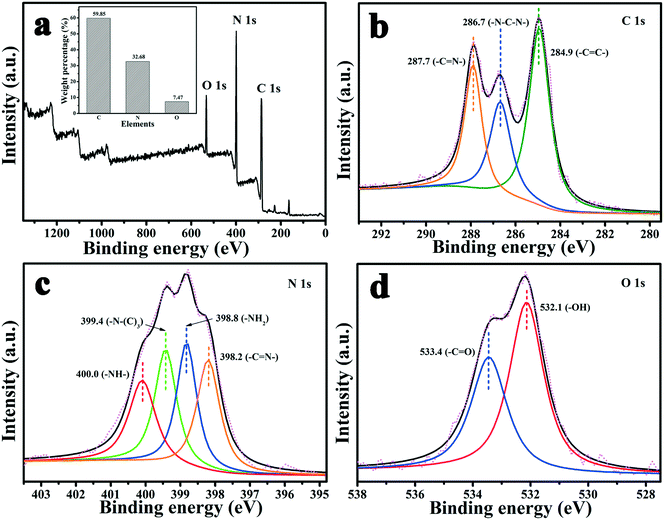 | ||
| Fig. 3 XPS spectra of the polymer (MA/TA/g-C3N4 (4/4/2)): (a) survey scan and high-resolution scans of (b) C 1s, (c) N 1s, and (d) O 1s, and the mass contents (inset of (a)). | ||
N2 adsorption–desorption isotherms (Fig. 2D) were employed to analyze the pore properties of the materials at 77 K, and the parameters are listed in Table 1. All the isotherms were type II isotherms with an H3 hysteresis loop, which indicated the aggregation of nanoparticles containing slit-shaped pores. At P/P0 < 0.1, a sharp upward trend in nitrogen adsorption appears, indicating the existence of a microporous structure. At P/P0 > 0.9, the rapid increase in the isotherm indicated the presence of macropores, which originated from interspaces between interconnected nanoparticles.37 In comparison with RAPOP, which had a Brunauer–Emmett–Teller (BET) surface area of 368.05 m2 g−1 and a total pore volume of 0.651 cm3 g−1, as calculated by non-local density functional theory (NLDFT), g-C3N4/RAPOP displayed excellent ability and high particle consistency. In detail, BET surface areas of 489.73, 540.36 and 445.19 m2 g−1 and total pore volumes of 1.175, 1.502 and 0.936 cm3 g−1 were measured for MA/TA/g-C3N4 (4/4/1), MA/TA/g-C3N4 (4/4/2) and MA/TA/g-C3N4 (4/4/4), respectively. Presumably, the g-C3N4 dopant introduced unreacted amine groups, which could also react with the aldehyde groups of TA and form hydrogen bonds between the amine-containing polymers, which contributed to the formation of a more complex porous structure.29,38 In terms of the pore size distribution (inset of Fig. 2D), there was a significant difference between RAPOP and g-C3N4/RAPOP. RAPOP predominantly contained micro- and mesopores with a Barrett–Joyner–Halenda (BJH) average pore size of 4.23 nm. However, the macropores in g-C3N4/RAPOP gradually increased in proportion upon doping with g-C3N4, and the BJH average pore sizes were 5.68, 6.33 and 5.19 nm for MA/TA/g-C3N4 (4/4/1), MA/TA/g-C3N4 (4/4/2) and MA/TA/g-C3N4 (4/4/4), respectively. These proved again that the use of g-C3N4 as a supporting skeleton was able to greatly improve the architecture with a larger specific surface area and more outstanding porous structure (as illustrated in Scheme 1(c)), which was consistent with the FE-SEM and TEM results shown in Fig. 1.
| Materials | S BET /m2 g−1 | S mic /m2 g−1 | V mic /cm3 g−1 | V meso /cm3 g−1 | V t /cm3 g−1 | D p /nm |
|---|---|---|---|---|---|---|
| a Determined by N2 adsorption using the Brunauer–Emmett–Teller (BET) method. b Micropore area, determined by DFT. c Micropore volume, calculated using the Dubinin–Astakhov method. d Mesopore volume, calculated as Vt − Vmic. e Total pore volume, determined at P/P0 = 0.9923. f Adsorption average pore width (4V/A by BET). | ||||||
| MA/TA (4/4) | 368.05 | 160.92 | 0.084 | 0.567 | 0.651 | 4.23 |
| MA/TA/g-C3N4 (4/4/1) | 489.73 | 271.42 | 0.148 | 1.027 | 1.175 | 5.68 |
| MA/TA/g-C3N4 (4/4/2) | 540.36 | 328.88 | 0.171 | 1.331 | 1.502 | 6.33 |
| MA/TA/g-C3N4 (4/4/4) | 445.19 | 229.08 | 0.129 | 0.807 | 0.936 | 5.19 |
3.2. Adsorption performance evaluation under different conditions
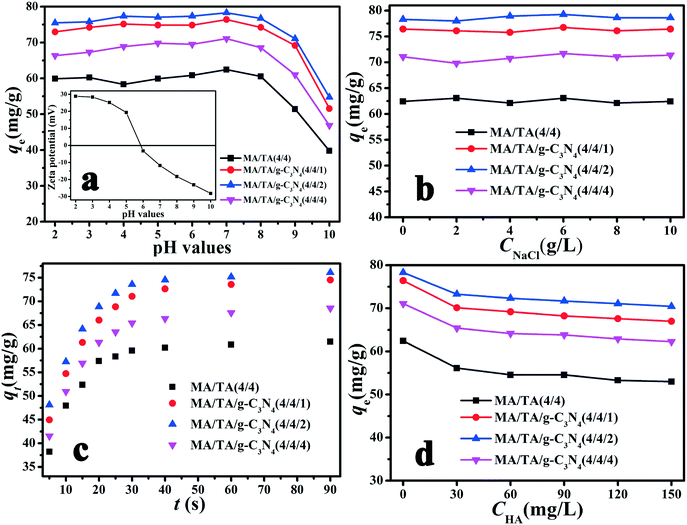
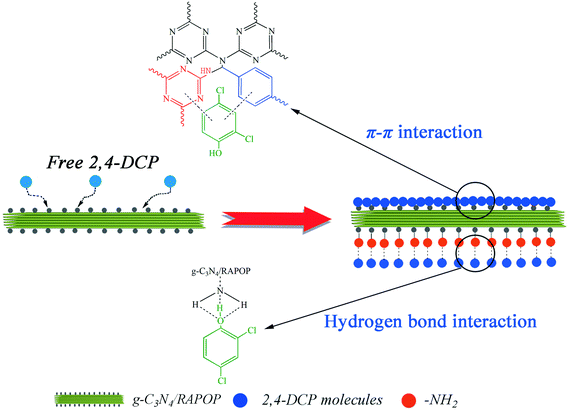
As shown in Fig. 4(a), the polymers exhibited relatively high adsorption capacities at a pH in the range of 2 to 7, whereas these were reduced sharply when the pH exceeded 7. To understand the influence of pH on the removal of 2,4-DCP, the zeta potentials of the MA/TA/g-C3N4 (4/4/2) polymer at different pH values were determined (inset of Fig. 4(a)). The isoelectric point was found to be around 5.8, which is consistent with the pKa value of amine groups in similar polymers.40 This means that the surface of the material is positively charged when the pH is below 5.8. Given that 2,4-DCP is a weak acid (pKa = 7.9),41 the adsorbed 2,4-DCP mostly existed in the non-ionized form in acidic solutions. Therefore, electrostatic repulsion would not occur between 2,4-DCP and the adsorbent. When the pH values exceeded 7, 2,4-DCP dissociated in basic solutions to form chlorophenolate anions. Moreover, the surface functional groups of the adsorbent were also negatively charged. As a result, the electrostatic repulsion between identical charges reduced the adsorption capacity. Therefore, a pH of 7 is the optimal value and was adopted in the following experiments. Under these conditions, electrostatic interactions could be neglected, and π–π interactions and hydrogen bonding interactions were mainly responsible for the adsorption of 2,4-DCP on the adsorbent surface (see Scheme 2). The backbone structures of RAPOP and g-C3N4/RAPOP comprise aromatic rings, and the p orbitals of the carbon and nitrogen atoms in these aromatic rings form a stable conjugated system. 2,4-DCP also contains a conjugated system. Moreover, the hydroxyl groups (–OH) of 2,4-DCP and amine groups (–NH2) of the adsorbent were abundant. When 2,4-DCP approached the surface of the adsorbent, hydrogen bonding interactions were gradually established between hydroxyl and amine groups, which bound the 2,4-DCP molecules located on the surface of the adsorbent. Furthermore, 2,4-DCP molecules, which contain π electrons, interacted with aromatic rings on the adsorbent surface via π–π interactions, which caused the 2,4-DCP molecules to be tightly arranged on the surface of the adsorbent. Thus, the underlying mechanism is believed to arise from the intrinsically high adsorption ability of the porous organic polymers, as well as the strong interactions between the polymers and 2,4-DCP, including π–π interactions and hydrogen bonding interactions.
3.3. Theoretical discussion of adsorption
| qt = qe(1 − e−k1t) | (3) |
 | (4) |
| Materials | q e(exp) (mg g−1) | Pseudo-first-order kinetic model | Pseudo-second-order kinetic model | ||||
|---|---|---|---|---|---|---|---|
| k 1 (s−1) | q e1(cal) (mg g−1) | R 2 | k 2 (× 10−3) (g mg−1 s−1) | q e2(cal) (mg g−1) | R 2 | ||
| MA/TA (4/4) | 63.99 | 0.177 | 59.72 | 0.9336 | 4.4 | 65.23 | 0.9792 |
| MA/TA/g-C3N4 (4/4/1) | 76.42 | 0.160 | 71.61 | 0.8940 | 3.1 | 78.91 | 0.9859 |
| MA/TA/g-C3N4 (4/4/2) | 78.32 | 0.174 | 73.45 | 0.8853 | 3.5 | 80.36 | 0.9784 |
| MA/TA/g-C3N4 (4/4/4) | 71.07 | 0.164 | 65.82 | 0.9052 | 3.6 | 72.40 | 0.9890 |
It was shown that the pseudo-second-order model gave higher R2 values for all adsorbents. On the basis of the experimental data (qe(exp)), the equilibrium adsorbed amounts (qe2(cal)) obtained from the pseudo-second-order model were more acceptable than those obtained from the pseudo-first-order model, which implied that the pseudo-second-order model could be used to describe the adsorption of 2,4-DCP on RAPOP and g-C3N4/RAPOP and revealed that the reaction rates were proportional to the square of the number of free sites.
 | (5) |
 | (6) |
| Materials | T (K) | Langmuir model | Freundlich model | ||||
|---|---|---|---|---|---|---|---|
| b (L mg−1) | q max (mg g−1) | R 2 | n | K f (mg1−1/n L1/n g−1) | R 2 | ||
| MA/TA (4/4) | 298 | 0.13315 | 188.70 | 0.9990 | 3.02389 | 39.6107 | 0.9622 |
| 308 | 0.13545 | 200.00 | 0.9978 | 3.12891 | 43.3454 | 0.9712 | |
| 318 | 0.13905 | 212.77 | 0.9952 | 3.51741 | 52.9633 | 0.9778 | |
| MA/TA/g-C3N4 (4/4/1) | 298 | 0.16601 | 238.10 | 0.9910 | 3.74532 | 66.5597 | 0.9931 |
| 308 | 0.16949 | 250.00 | 0.9880 | 4.06835 | 75.2338 | 0.9956 | |
| 318 | 0.18095 | 263.16 | 0.9850 | 4.11523 | 80.9312 | 0.9934 | |
| MA/TA/g-C3N4 (4/4/2) | 298 | 0.15102 | 270.27 | 0.9853 | 3.59195 | 70.2809 | 0.9942 |
| 308 | 0.16216 | 277.78 | 0.9821 | 3.92927 | 80.3024 | 0.9970 | |
| 318 | 0.18041 | 285.71 | 0.9791 | 4.18760 | 90.4503 | 0.9695 | |
| MA/TA/g-C3N4 (4/4/4) | 298 | 0.15282 | 217.39 | 0.9958 | 3.46260 | 54.7731 | 0.9810 |
| 308 | 0.15548 | 227.27 | 0.9935 | 3.56379 | 59.2165 | 0.9847 | |
| 318 | 0.16867 | 238.10 | 0.9908 | 4.09333 | 72.1466 | 0.9852 | |
It was demonstrated that the adsorption could be well described by the Langmuir model according to the values of R2, which implied that the adsorptive sites were effectively equivalent to monolayer adsorption. At room temperature, the qm values for the four adsorbents were 188.70, 217.39, 238.10 and 270.27 mg g−1 for MA/TA (4/4), MA/TA/g-C3N4 (4/4/4), MA/TA/g-C3N4 (4/4/1) and MA/TA/g-C3N4 (4/4/2), respectively. These results indicated that doping the appropriate dosage of g-C3N4 into RAPOP could boost its capacity to adsorb 2,4-DCP. Moreover, the values of n were all much greater than 1.0, which implied that this process is favorable for removing 2,4-DCP from wastewater.
 | (7) |
ΔG = −RT![[thin space (1/6-em)]](https://www.rsc.org/images/entities/char_2009.gif) ln ln![[thin space (1/6-em)]](https://www.rsc.org/images/entities/char_2009.gif) K0 K0 | (8) |
| ΔG = ΔH − TΔS | (9) |
The values of the parameters ΔH, ΔS, ΔG and the correlation coefficient (R2) are listed in Table 4. For MA/TA (4/4), MA/TA/g-C3N4 (4/4/1), MA/TA/g-C3N4 (4/4/2) and MA/TA/g-C3N4 (4/4/4) the ΔH values were 1.704, 3.374, 6.987 and 3.859 kJ mol−1, respectively, which indicated that all these adsorption processes were endothermic and were favored at higher temperatures. The ΔS values were 46.346, 53.762, 65.107 and 54.672 J mol−1 K−1, respectively, and the ΔG values at 298, 308 and 318 K were calculated to be −12.107, −12.571, and −13.034 kJ mol−1, −12.647, −13.185, and −13.722 kJ mol−1, −12.415, −13.066, and −13.717 kJ mol−1, and −12.433, −12.980, and −13.527 kJ mol−1, respectively. It was demonstrated that the adsorbent particles had a high affinity towards 2,4-DCP, and the adsorption process occurred spontaneously in natural conditions.
| Material | T (K) | ΔS (J mol−1 K−1) | ΔH (kJ mol−1) | ΔG (kJ mol−1) |
|---|---|---|---|---|
| MA/TA (4/4) | 298 | 46.346 | 1.704 | −12.107 |
| 308 | −12.571 | |||
| 318 | −13.034 | |||
| MA/TA/g-C3N4 (4/4/1) | 298 | 53.762 | 3.374 | −12.647 |
| 308 | −13.185 | |||
| 318 | −13.722 | |||
| MA/TA/g-C3N4 (4/4/2) | 298 | 65.107 | 6.987 | −12.415 |
| 308 | −13.066 | |||
| 318 | −13.717 | |||
| MA/TA/g-C3N4 (4/4/4) | 298 | 54.672 | 3.859 | −12.433 |
| 308 | −12.980 | |||
| 318 | −13.527 |
3.4. Recycling and reuse of g-C3N4/RAPOP
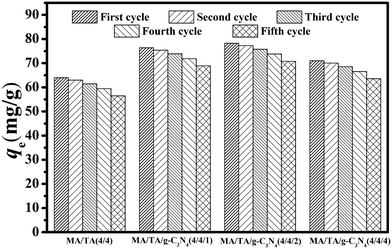
The reusability of an adsorbent material is a key factor for improving the process economics. The adsorbents consistently retained their porous structure because the adsorbed 2,4-DCP only occupied adsorptive sites on the adsorbent surface, which suggested that the used adsorbents can be easily recycled via common methods, such as desorption or biocatalysis.49,50 As described for the effect of the solution pH (Fig. 4(a)) in alkaline environments, both the adsorbents and 2,4-DCP were negatively charged and there was strong electrostatic repulsion between them, which led to the desorption of 2,4-DCP from the adsorbents. This observation revealed that the adsorbents can be effectively regenerated via treatment with alkali.Adsorption–desorption cycles were carried out five times, and the results are displayed in Fig. 6. For MA/TA (4/4), MA/TA/g-C3N4 (4/4/1), MA/TA/g-C3N4 (4/4/2) and MA/TA/g-C3N4 (4/4/4), the qe values for the virgin adsorbents equaled 63.99, 76.42, 78.31 and 71.07 mg g−1, respectively, whereas the regenerated adsorbents displayed outstanding regeneration with a slight reduction in the value of qe. Specifically, qe values of 57.24, 69.82, 72.32 and 64.53 mg g−1, respectively, were measured after five recycling runs. From the FT-IR spectra and TEM images of regenerated RAPOP and g-C3N4/RAPOP after five recycling runs (see Fig. S4 and S5†), the characteristic peaks of triazine rings (1477 cm−1 and 1546 cm−1), C–N stretching vibrations (1600 cm−1) and g-C3N4 (1572 cm−1, 1425 cm−1 and 810 cm−1) were retained, which implied that the regenerated polymers retained their functional groups and chemical bonds. Importantly, the porous structures with interconnected nanoparticles were completely preserved. These results all indicated that g-C3N4/RAPOP possessed excellent regenerability. The highly abundant pores, interconnecting pore channels and large specific surface areas of the as-prepared materials could greatly reduce the possibility of pore blockage by adsorbate molecules. The alkaline environment also made the adsorbents achieve excellent recycling performance. The outstanding regeneration of g-C3N4/RAPOP demonstrated good potential for the recovery and abatement of phenolic compounds in wastewater treatment.
3.5. Comparison with other adsorbents
To position the novel adsorbents with respect to other reported adsorbents that have also been used to remove 2,4-DCP, a comparison was made between the results of the present work and reported data. According to the results of the Langmuir model (see Table 3), the maximum adsorption capacities (qmax) reached 188.70, 238.10, 270.27 and 217.39 mg g−1 for MA/TA (4/4), MA/TA/g-C3N4 (4/4/1), MA/TA/g-C3N4 (4/4/2) and MA/TA/g-C3N4 (4/4/4), respectively, at 298 K. The adsorption capacities of other reported adsorbent materials for 2,4-DCP are listed in Table 5, which shows that RAPOP and g-C3N4/RAPOP exhibited excellent performance in the removal of the organic contaminant. In particular, the MA/TA/g-C3N4 (4/4/2) polymer had a higher adsorption capacity than the other adsorbents, which implied the efficient adsorption properties of g-C3N4/RAPOP towards 2,4-DCP. Hydrogen bonding interactions, π–π interactions and pore filling might be responsible for the higher adsorption capacity. Therefore, it can be positively concluded that g-C3N4/RAPOP has great potential for the adsorption and recovery of chlorophenols from wastewater.| Adsorbents | T (K) | pH | q max (mg g−1) | Ref. |
|---|---|---|---|---|
| Marine sediment | 298 | 7.0 | 3.85 | 51 |
| Rice husk | 298 | — | 40.50 | 52 |
| Cattail fiber-based activated carbon | 293 | — | 142.85 | 53 |
| Coir pith activated carbon | 308 | 7.0 | 5.78 | 54 |
| Oil palm empty fruit bunch carbon | 303 | 6.0 | 27.25 | 55 |
| Maize cob carbon | 303 | — | 17.94 | 56 |
| Multiwalled carbon nanotube | 298 | 6.0 | 138.00 | 57 |
| Palm pith carbon | 298 | 7.0 | 19.16 | 58 |
| β-CD/attapulgite composites | 308 | 7.0 | 19.04 | 59 |
| Cyclodextrin polymers | 298 | 7.0 | 15.70 | 60 |
| MA/TA (4/4) | 298 | 7.0 | 188.70 | This work |
| MA/TA/g-C3N4 (4/4/1) | 298 | 7.0 | 238.10 | This work |
| MA/TA/g-C3N4 (4/4/2) | 298 | 7.0 | 270.27 | This work |
| MA/TA/g-C3N4 (4/4/4) | 298 | 7.0 | 217.39 | This work |
4. Conclusions
In summary, g-C3N4/RAPOP was successfully synthesized by using different molar ratios of MA/TA/g-C3N4 of 4/4/1, 4/4/2 and 4/4/4, and RAPOP was prepared by a Schiff base reaction between MA and TA. The use of g-C3N4 as a supporting skeleton in RAPOP produced three major beneficial effects: (a) the specific surface areas and total pore volumes increased and were highest for MA/TA/g-C3N4 (4/4/2), for which they reached 540.36 m2 g−1 and 1.502 cm3 g−1, respectively. (b) The larger specific surface area, more outstanding porous structure, and surplus amine groups combined to improve the adsorption performance towards 2,4-DCP. The equilibrium time and highest maximum adsorption capacity were 40 seconds and 270.27 mg g−1 at 298 K, respectively. (c) The adsorption process occurred spontaneously, and the polymers exhibited excellent regeneration after treatment with alkali. Consequently, we fully believe that such a highly efficient, easily synthesized, and low-cost adsorbent can be employed in the treatment of wastewater and drinking water contaminated by phenolic compounds.Conflicts of interest
There are no conflicts to declare.Acknowledgements
This work was financially supported by the National Scientific Foundation of China (21477118, 51478445, 51678546).References
- O. S. Sanyal, Z. G. Liu, J. Yu, B. M. Meharg, J. S. Hong, W. Liao and I. Lee, J. Membr. Sci., 2016, 512, 21–28 CrossRef CAS.
- Y. Watanabe, T. Harada, H. Kawai, T. Kaji, M. Hiramoto and K. Nishiyama, J. Mol. Liq., 2016, 217, 51–56 CrossRef CAS.
- N. Tandjaoui, M. Abouseoud, A. Couvert, A. Amrane and A. Tassist, Chemosphere, 2016, 148, 55–60 CrossRef CAS PubMed.
- T. T. Li, G. Z. Lu, X. L. Hu, W. Q. Xie, Q. Xia and S. L. Luo, Mater. Lett., 2017, 188, 392–395 CrossRef CAS.
- D. Panda and S. Manickam, Ultrason. Sonochem., 2017, 36, 481–496 CrossRef CAS PubMed.
- V. R. Fanaie, M. Karrabi, M. M. Amin, B. Shahnavaz and A. Fatehizadeh, Int. J. Environ. Sci. Technol., 2017, 14, 37–48 CrossRef CAS.
- W. D. Oh, P. E. Lim, K. Y. Leong, S. L. Yong and H. Yin, Desalin. Water Treat., 2016, 57, 20476–20482 CrossRef CAS.
- T. Soltani and B. K. Lee, J. Colloid Interface Sci., 2016, 481, 168–180 CrossRef CAS PubMed.
- Y. T. Xia, Y. K. Li, Y. T. Gu, T. Jin, Q. Yang, J. Hu, H. L. Liu and H. L. Wang, Fuel, 2016, 170, 100–106 CrossRef CAS.
- J. Y. Zhang, D. Xu, W. J. Qian, J. Y. Zhu and F. Yan, Carbon, 2016, 105, 183–190 CrossRef CAS.
- J. B. Lee, M. K. Ahn, Y. H. Koh, H. Lee and H. E. Kim, Mater. Des., 2016, 101, 323–331 CrossRef CAS.
- G. W. Yang, H. Y. Han, C. Y. Du, Z. H. Luo and Y. J. Wang, Polymer, 2010, 51, 6193–6202 CrossRef CAS.
- M. Ghani, R. M. Frizzarin, F. Maya and V. Cerda, J. Chromatogr. A, 2016, 1453, 1–9 CrossRef CAS PubMed.
- R. E. Osta, A. Carlin-Sinclair, N. Guillou, R. I. Walton, F. Vermoortele, M. Maes, D. D. Vos and F. Millange, Chem. Mater., 2012, 24, 2781–2791 CrossRef.
- M. W. Dunlop, P. J. Blackall and R. M. Stuetz, J. Environ. Manage., 2016, 177, 306–319 CrossRef CAS PubMed.
- Y. L. Luo, B. Y. Li, L. Y. Liang and B. Tan, Chem. Commun., 2011, 47, 7704–7706 RSC.
- Z. Z. Zhang, C. M. Zhu, N. N. Sun, H. Wang, Z. Y. Tang, W. Wei and Y. H. Sun, J. Phys. Chem. C, 2015, 119, 9302–9310 CAS.
- H. J. Ou, Q. L. You, J. Li, G. Y. Liao, H. Xia and D. S. Wang, RSC Adv., 2016, 6, 98487–98497 RSC.
- F. B. Su, C. K. Poh, J. S. Chen, G. W. Xu, D. Wang, Q. Li, J. Y. Lin and X. W. Lou, Energy Environ. Sci., 2011, 4, 717–724 CAS.
- Y. Z. Liao, J. Weber and C. F. J. Faul, Macromolecules, 2015, 48, 2064–2073 CrossRef CAS.
- R. M. Li, A. M. Cao, Y. J. Zhang, G. Li, F. Jiang, S. M. Li, D. Q. Chen, C. R. Wang, J. C. Ge and C. Y. Shu, ACS Appl. Mater. Interfaces, 2014, 6, 20574–20578 CAS.
- Y. X. Zeng, C. B. Liu, L. L. Wang, S. Q. Zhang, Y. B. Ding, Y. Z. Xu, Y. T. Liu and S. L. Luo, J. Mater. Chem. A, 2016, 4, 19003–19010 CAS.
- M. Wu, J. M. Yan, X. W. Zhang and M. Zhao, Appl. Surf. Sci., 2015, 354, 196–200 CrossRef CAS.
- K. T. Cao, Z. Y. Jiang, X. S. Zhang, Y. M. Zhang, J. Zhao, R. S. Xing, S. Yang, C. Y. Gao and F. S. Pan, J. Membr. Sci., 2015, 490, 72–83 CrossRef CAS.
- X. L. Zhao and N. Yan, RSC Adv., 2015, 5, 69955–69961 RSC.
- H. H. Liu, D. L. Chen, Z. Q. Wang, H. J. Jing and R. Zhang, Appl. Catal., B, 2017, 203, 300–313 CrossRef CAS.
- Y. J. Zhong, Z. Q. Wang, J. Y. Feng, S. C. Yan, H. T. Zhang, Z. S. Li and Z. G. Zou, Appl. Surf. Sci., 2014, 295, 253–259 CrossRef CAS.
- P. Martin-Ramos, J. Martin-Gil, R. C. Dante, F. Vaquero, R. M. Navarro and J. L. G. Fierro, Int. J. Hydrogen Energy, 2015, 40, 7273–7281 CrossRef CAS.
- J. X. Hu, H. Shang, J. G. Wang, L. Luo, Q. Xiao, Y. J. Zhong and W. D. Zhu, Ind. Eng. Chem. Res., 2014, 53, 11828–11837 CrossRef CAS.
- W. N. Xing, C. M. Li, G. Chen, Z. H. Han, Y. S. Zhou, Y. D. Hu and Q. Q. Meng, Appl. Catal., B, 2017, 203, 65–71 CrossRef CAS.
- S. Uysal, J. Inclusion Phenom. Macrocyclic Chem., 2013, 76, 223–230 CrossRef CAS.
- S. Uysal and A. N. Kursunlu, J. Inorg. Organomet. Polym., 2011, 21, 291–296 CrossRef CAS.
- X. Q. Lin, X. Z. Li, F. Li, Y. Y. Fang, M. Tian, X. C. An, Y. Fu, J. Jin and J. T. Ma, J. Mater. Chem. A, 2016, 4, 6505–6512 CAS.
- Z. P. Cao, M. H. Zhang, J. L. Zhang and H. W. Zhang, Bioresour. Technol., 2016, 212, 138–143 CrossRef CAS PubMed.
- Y. J. Qian, J. Zhang, Y. L. Zhang, J. B. Chen and X. F. Zhou, Sep. Purif. Technol., 2016, 166, 222–229 CrossRef CAS.
- D. H. Yang, Z. Q. Yao, D. H. Wu, Y. H. Zhang, Z. Zhou and X. H. Bu, J. Mater. Chem. A, 2016, 4, 18621–18627 CAS.
- J. S. Wei, H. Ding, Y. G. Wang and H. M. Xiong, ACS Appl. Mater. Interfaces, 2015, 7, 5811–5819 CAS.
- J. H. Kou and L. B. Sun, Ind. Eng. Chem. Res., 2016, 55, 10916–10925 CrossRef CAS.
- J. J. Wang, L. Tang, G. M. Zeng, Y. N. Liu, Y. Y. Zhou, Y. C. Deng, J. J. Wang and B. Peng, ACS Sustainable Chem. Eng., 2017, 5, 1062–1072 CrossRef CAS.
- S. Fujii, M. Kido, M. Sato, Y. Higaki, T. Hirai, N. Ohta, K. Kojioa and A. Takahara, Polym. Chem., 2015, 6, 7053–7059 RSC.
- H. Yuan, Q. L. You, L. J. Song, G. Y. Liao, H. Xia and D. S. Wang, RSC Adv., 2016, 6, 95825–95835 RSC.
- M. Y. Guo, X. L. Weng, T. Wang and Z. L. Chen, Sep. Purif. Technol., 2017, 175, 222–228 CrossRef CAS.
- A. Demirak, O. Dalman, E. Tilkan, D. Yildiz, E. Yavuz and C. Gokce, Microchem. J., 2011, 99, 97–102 CrossRef CAS.
- F. Wang, S. Ma, Y. Si, L. F. Dong, X. L. Wang, J. Yao, H. L. Chen, Z. J. Yi, W. C. Yao and B. S. Xing, Carbon, 2017, 114, 671–678 CrossRef CAS.
- Y. L. Kong, J. Kang, J. M. Shen, Z. L. Chen and L. T. Fan, Environ. Sci. Pollut. Res., 2017, 24, 2381–2393 CrossRef CAS PubMed.
- P. Tian, X. Y. Han, G. L. Ning, H. X. Fang, J. W. Ye, W. T. Gong and Y. Lin, ACS Appl. Mater. Interfaces, 2013, 5, 12411–12418 CAS.
- M. V. Subbaiah and D. S. Kim, Ecotoxicol. Environ. Saf., 2016, 128, 109–117 CrossRef CAS PubMed.
- Q. Liu, L. B. Zhong, Q. B. Zhao, C. Frear and Y. M. Zheng, ACS Appl. Mater. Interfaces, 2015, 7, 14573–14583 CAS.
- A. Meng, J. Xing, Z. J. Li and Q. D. Li, ACS Appl. Mater. Interfaces, 2015, 7, 27449–27457 CAS.
- Y. J. Zhang, B. Prigent and S. U. Geißen, Chemosphere, 2016, 154, 132–137 CrossRef CAS PubMed.
- P. Wu, G. P. Yang and X. K. Zhao, J. Colloid Interface Sci., 2003, 265, 251–256 CrossRef CAS PubMed.
- V. Vadivelan and K. Kumar, J. Colloid Interface Sci., 2005, 286, 90–100 CrossRef CAS PubMed.
- L. Ren, J. Zhang, Y. Li and C. Zhang, Chem. Eng. J., 2011, 168, 553–561 CrossRef CAS.
- D. Kavitha and C. Namasivayam, Bioresour. Technol., 2007, 98, 14–21 CrossRef CAS PubMed.
- A. Zahangir, S. A. Muyibi and J. Toramae, J. Environ. Sci., 2007, 19, 674–677 CrossRef.
- M. Sathishkumar, A. R. Binupriya, D. Kavitha, R. Selvakumar, R. Jayabalan, J. G. Choi and S. E. Yun, Chem. Eng. J., 2009, 147, 265–271 CrossRef CAS.
- K. Yang, W. H. Wu, Q. F. Jing and L. Z. Zhu, Environ. Sci. Technol., 2008, 42, 7931–7936 CrossRef CAS PubMed.
- M. Sathishkumar, A. R. Binupriya, D. Kavitha and S. E. Yun, Bioresour. Technol., 2007, 98, 866–873 CrossRef CAS PubMed.
- J. Pan, X. Zou, X. Wang, W. Guan, Y. Yan and J. Han, Chem. Eng. J., 2010, 162, 910–918 CrossRef CAS.
- N. Li, Z. Mei and S. G. Ding, J. Inclusion Phenom. Macrocyclic Chem., 2010, 68, 123–129 CrossRef CAS.
Footnotes |
| † Electronic supplementary information (ESI) available. See DOI: 10.1039/c7en00787f |
| ‡ Authors Haijian Ou and Weijun Zhang contributed equally to this work. |
| This journal is © The Royal Society of Chemistry 2018 |

