
New applications of the mathematical model of a permeation passive sampler: prediction of the effective uptake rate and storage stability†
Faten
Salim
 a,
Tadeusz
Górecki
*a and
Marios
Ioannidis
b
a,
Tadeusz
Górecki
*a and
Marios
Ioannidis
b
aUniversity of Waterloo, Department of Chemistry, 200 University Avenue West, Waterloo, ON, Canada N2L 3G1. E-mail: tgorecki@uwaterloo.ca; Tel: +1 519 888 4567
bUniversity of Waterloo, Department of Chemical Engineering, 200 University Avenue West, Waterloo, ON, Canada N2L 3G1
First published on 22nd October 2018
Abstract
As the applications of passive sampling in environmental analysis are increasing, it is crucial to ensure that the methods applied in the measurement of pollutant concentrations provide sufficient accuracy in compliance with existing regulations. Additionally, as with any sampling method in an analytical process, sample integrity is essential for accurate determination of contaminants and their concentrations. In a recent study, a mathematical model was developed to describe the sampling process in permeation passive samplers. The model was able to predict the significance of potential uptake rate changes during sampling. The model also predicted the distribution of the sampled analyte within the different compartments of the sampler. In the present work, the model was extended to include two practical applications. In the first part, a novel method allowing prediction of the effective uptake rate of the sampler is presented. The method accounts for changes in the uptake rate during the exposure time caused by resistance to mass transfer in the sorbent bed, allowing accurate calculation of the time weighted average concentrations. The method was proven to be successful through experimental verification that involved sampling toluene and trichloroethylene using the Waterloo Membrane Sampler (WMS). In the second part, the post-sampling storage period of analytes in the WMS was evaluated. It was found both theoretically and experimentally that analyzing the sorbent only is sufficient to quantify the analytes collected, as the amount retained in the remaining compartments of the sampler (PDMS membrane, air inside the sampler and the storage vial) is negligible after sampling. The amounts of analytes collected by the sorbent were stable over up to three-weeks of storage at room temperature. These findings establish confidence in the use of the WMS for sampling Volatile Organic Compounds (VOCs).
Environmental significanceThe paper describes novel applications of a previously developed mathematical model of a permeation passive sampler used to measure VOC concentrations in air and soil gas. The model allows predictions of analyte concentrations in various sampler compartments (membrane, sorbent, air at equilibrium with the sorbent, and void volume) as a function of exposure time. This, in turn, allows predictions of uptake rate changes during exposure depending on the conditions and sampler design. In this work, an iterative procedure based on the model has been developed to estimate the actual average uptake rate during sampling, which in turn allows the calculation of corrected TWA concentration values. The method significantly improves the accuracy of TWA concentration determinations, which is of critical importance in the characterization of contaminated sites. In another application, the model was extended to describe the post-sampling storage period of analytes in the permeation passive sampler. It was found both theoretically and experimentally that analyzing the sorbent only should be sufficient to recover the analytes collected during exposure, as the amount retained in the other sampler compartments are negligible after sampling, and the amounts of analytes detected in the sorbent were stable over up to three-weeks of storage at room temperature. In particular, it was demonstrated that the PDMS membrane of the sampler serves only as the uptake rate-defining barrier, as intended, and does not compete in any significant way with the adsorbent inside the sampler. This is a very important finding, as the role of the membrane in the sampler has been a long-running source of controversy among practitioners. |
Introduction
Passive sampling is an approach that offers many advantages, including simplicity and low cost relative to the conventional active grab sampling method. In the latter approach, samples from the evaluated medium are collected at given times to be analysed online, or, in most cases, transferred to the laboratory for analysis. Unlike this method, the passive sampling approach does not require pumping or attendance during operation.1 Instead, analyte molecules are driven into the sampling medium by the chemical potential difference between the sampled and the collecting media.2 This method allows integration of several sample preparation goals, such as analyte isolation and pre-concentration, into the sampling process, and therefore, reduction of sample preparation time and cost and reduction of solvent use.2Passive sampling can operate in the kinetic or equilibrium regions. In the former case, analyte molecules continuously migrate through a rate-determining barrier before they are trapped in a receiving phase until the sampling process is stopped by the user. The rate-determining barrier can be a membrane or a diffusive region, whereas the receiving phase can be an adsorbent material or a solvent. The amounts of analytes collected by these types of samplers reflect their average concentrations over the time of exposure, so-called time-weighted average (TWA) concentrations. When passive sampling is conducted in the equilibrium region, the flow of analytes between the sampled medium and the receiving medium continues until equilibrium is reached between the two. In this case, the amounts of analytes collected by the sampler reflect the analyte concentrations around the time the sampler was collected. In both cases, the integrity of the collected samples is important to ensure accurate determination of the concentrations. This involves sufficient preservation of the sampled analytes during storage and shipment of the samples, as well as well-controlled and optimized analytical methods in which the analytes collected are introduced quantitatively to the analytical process.
The measurement of the TWA concentrations using the kinetic passive samplers is based on the assumption that the uptake rates of the sampler remain constant during the exposure and are independent of the analyte concentration and sampling time. The uptake rate of a passive sampler is a conventional expression of the sampling rate and can be defined as “the flow rate that would yield the same mass collected by the passive sampler if drawn through a sorptive medium within the same sampling time”.3 The TWA concentration can then be calculated using eqn (1) as follows:4
 | (1) |
 | (2) |
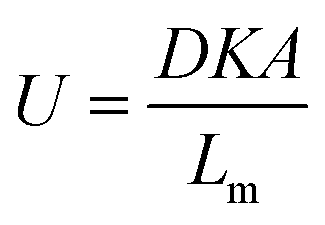
In this equation, D (m2 s−1) is the diffusion coefficient of the analyte in the membrane material, K (dimensionless) is the partition coefficient of the analyte between air and the membrane material, A (m2) is the sampling area and Lm (m) is the thickness of the membrane. These equations result from the assumption that the receiving phase (the sorbent) acts as a zero sink, meaning that analyte molecules permeating through the membrane into the sorbent are removed completely by sorption leaving negligible concentrations of the analyte at the membrane–sorbent interface.5
Determination of the uptake rate is achieved using one of three methods:6 (1) theoretical determination based on the knowledge of measured or estimated values of the parameters presented in eqn (2) (D and K in the case of permeation passive samplers) and the dimensions of the sampler; (2) experimental evaluation of the uptake rate by exposing the passive samplers to an atmosphere of the analyte vapor with known concentrations (from a parallel reference method); (3) Performance Reference Compounds (PRCs) or Depuration Compounds (DCs), which are usually deuterated compounds that are not present in the evaluated medium and are spiked into the receiving phase of the passive sampler before deployment. This method is based on the assumption that the loss rate of the PRC is controlled by the same mechanisms as the uptake of the target analyte.7 Although the last approach simplifies the calibration process and permits determination of site-specific sampling rates for individual analytes,6 its application is limited to linear sorption isotherms, as this method is based on the assumption that both the uptake and the release process are of first order kinetics and have the same rate constant (isotropic exchange),8 which mainly applies to absorption processes. The drawback of all of these approaches is that they produce a single value of the uptake rate towards each analyte, whereas variabilities associated with exposure time, concentration, or site-specific conditions should be taken into consideration.
The Waterloo Membrane Sampler (WMS), shown in Fig. S1-a in the ESI† section, is a permeation passive sampler developed at the University of Waterloo.5,9 In this sampler, a polydimethylsiloxane (PDMS) membrane is used as the permeation barrier, while an adsorbent material is used as the receiving phase. Details about the sampler components and preparation are provided in the Experimental section of the ESI.† The WMS has been utilized for sampling volatile organic compounds (VOCs) from air and soil gas.10–12 The sampler is exposed to the evaluated air for a certain time. During this time, analyte molecules permeate through the PDMS membrane and are trapped by the sorbent. The sampler is retrieved at the end of the assigned exposure period, repacked and sealed to be transferred to the laboratory for analysis.
In a previous study,3 a mathematical model was developed to describe the sampling process in a permeation passive sampler to assess the sampler performance during sampling and to identify the most important factors that affect this performance. Numerical solutions of this model were evaluated experimentally using the WMS. The model predicts the distribution of the collected analyte within the different compartments of the sampler as a function of the sampling time. It then uses this information to calculate the uptake rate of the sampler at any point in time to assess its stability. The purpose of the presented study is to demonstrate practical applications to exploit the model results. The scope of these applications is twofold. In the first part, a new method of estimating the effective uptake rate of the passive sampler, based on the model, is proposed. This method takes into account potential changes in the uptake rate as a result of the sampling process itself. In the second part, the model is extended to describe the post-sampling period using the WMS.
Many sources of variation of the passive sampler uptake rates are reported and evaluated in the literature. They include the effects of sampler configuration13 and housing,14 and the influence of meteorological parameters such as temperature, humidity and wind speed.15–18 Furthermore, other factors related to the sampling process itself were also found to be influential on the stability of the uptake rate of passive samplers. These factors are related to analyte accumulation in a non-uniform manner within the receiving phase of the passive sampler.19 This non-uniform distribution of analyte within the passive sampler challenges the zero-sink assumption and causes an increase in the analyte concentration in the primary air layer (just above the sorbent bed next to the sampler barrier).20 This, in turn, reduces the driving force for sampling, which is the concentration gradient across the sampler barrier.20 In such cases, using the ideal zero-sink assumption leads to quantitation errors as a result of the overestimation of the sampler linear range.19,20 Another source of error, also associated with non-uniform distribution of the analyte, is back-diffusion of the analyte into the evaluated medium when the concentration in this medium drops below the concentration in the primary air layer.20 Tolnai et al. developed a theoretical approach to describe the changes in the uptake rate of tube-type diffusive samplers,21 while Zhang and Wania proposed a mathematical model to describe analyte transfer through diffusive passive samplers, namely an XAD resin-based passive air sampler and a polyurethane foam passive air sampler.22
Similar conclusions were drawn from the model developed previously for permeation passive samplers:3 the uptake rate of the sampler was found to be affected by non-uniform distribution of the analyte at the interface of the sorbent bed with the membrane to a degree that depends on the concentration level, the sampling time and the selection of the analyte/sorbent pair. When this effect becomes significant, the sampler does not operate in the linear range anymore as a result of the increase in the analyte concentration in the primary air layer. Using the zero sink assumption in such scenarios leads to overestimation of the overall uptake rate of the sampler over the sampling time, and consequently, underestimation of the TWA concentration. In the first part of this paper, a new method of estimating the effective uptake rate of the passive sampler is presented. The purpose of this method is to account for any potential decrease in the uptake rate of the WMS using the model developed previously and, therefore, to more accurately predict the TWA concentration of the target analyte over the evaluation time. This method accounts for changes in the concentration gradient across the barrier as a result of the non-uniform distribution of the sampled analyte in the receiving phase. The method, afterwards, calculates the TWA concentration in a given sampling scenario. Back diffusion is not an issue when the concentration outside the sampler is steady as in the scenarios presented in this work. The influence of other factors, including temperature, humidity, and air velocity around the sampler, was evaluated previously.5,23
In the second part of this paper, the model is extended to describe the post-sampling storage period for the WMS. The objectives of this work were, first, to assess the stability of the collected analytes in the sampler during storage, and second, to evaluate the efficiency of the current analysis method in which the sorbent is the only component of the sampler that is analyzed. PDMS has important sorption properties that form the basis of many extraction techniques, such as solid phase microextraction (SPME), thin film extraction, stir bar sorptive extraction (SBSE), PDMS rod extraction, etc.24 It is crucial, therefore, to evaluate the significance of the potential sorption competition between the membrane and the sorbent, which could lead to losses of analytes that remain absorbed in the membrane if only the sorbent is analyzed.
Theory
The work is based on a previously developed model, which is briefly summarized below.3Sampling period (previous work)
As shown in Fig. S1-b,† the model is based on the assumption that mass transfer within the WMS occurs in one dimension. In the membrane, diffusion of analytes is described by eqn (3): | (3) |
In which Cm is the analyte concentration in the membrane (mol m−3), t is the time (s), Dm is the diffusion coefficient of the analyte in the membrane (m2 s−1), and x is the distance (m). On the other hand, mass balance equations for the free analyte molecules within the void spaces of the sorbent bed, and for the molecules sorbed to the solid particles, are presented in eqn (4) and (5), respectively:
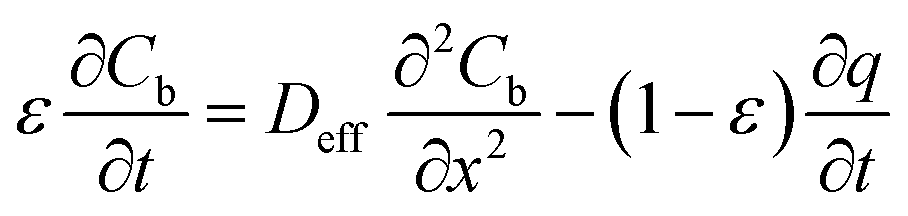 | (4) |
 | (5) |
 | (6) |
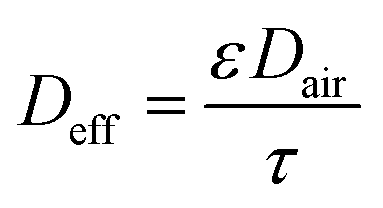
The effective diffusivity in the sorbent bed is calculated using eqn (7) as follows:
 | (7) |
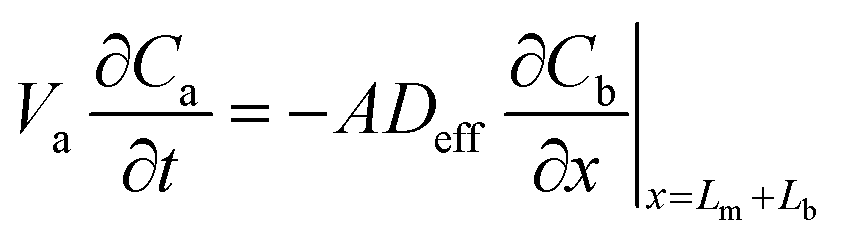
When the volume of the air gap is zero (Va = 0), that is, the sorbent completely fills the sampler, eqn (6) becomes:
 | (8) |
The sampler is assumed to be initially free of analytes; therefore, the initial concentration is zero within all the sampler compartments:
 | (9) |
Local equilibrium is assumed at the membrane's interface with the air outside the sampler and at the membrane's interface with the sorbent bed, as shown in eqn (10) and (11):
| Cm = KC0 | (10) |
| Cm = KCb | (11) |
 | (12) |
The partial differential eqn (3)–(6), subject to the initial and boundary conditions described above, were solved numerically using the method of lines in MATLAB (R2015a, MathWorks, USA). The reader is referred to previous work for details.3 The values of different parameters needed for the model, such as the diffusion coefficient in the membrane, the partition coefficient between air and the membrane material, the diffusion coefficient in air, and the isotherm parameters at a given sampling temperature need to be obtained from the literature, measured experimentally, or estimated using a validated method. The solutions provide the concentrations at a number of discrete points within the membrane and within the sorbent bed in both phases: “free” in the pores and “sorbed” onto the solid particles. These concentrations are calculated at a series of time steps during the course of sampling. The total number of moles in each compartment and in each phase is calculated afterwards at each time step tn by integration. The total number of moles of the adsorbed analyte, M(tn), is used to calculate the average uptake rate U(tn) (m3 s−1) over time tn (s) based on eqn (13):
 | (13) |
Calculating the effective uptake rate and the TWA concentration
In the proposed method, summarized in Fig. 1, the ideal uptake rate value calculated using eqn (2) is used to evaluate the concentration of the target analyte using eqn (1), following the determination of the amount of analyte collected by the sampler over the specified exposure time. The calculated concentration is then used as the input to the model (eqn (3)–(13)) to recalculate the effective uptake rate, accounting for its predicted decrease over the given time of exposure. The resulting uptake rate value is then entered again into eqn (1), and the concentration is re-calculated based on this uptake rate value. The procedure is repeated iteratively until the values of the uptake rate and concentration converge. The method was automated by writing a code in MATLAB (R2015a) (available upon request from the authors) that was based on the original code used to solve the model equations.3 The values of different parameters used in this evaluation are presented in Table S1.† | ||
| Fig. 1 Algorithm of the new method of estimating uptake rates and TWA concentrations. | ||
Storage (post-sampling) period
After retrieval, the sampler is placed in a bigger, well-sealed vial, as shown in Fig. 2a. This bigger vial is in turn placed in a sealed aluminized plastic bag containing a charcoal sorbent packet to remove any trace contamination that might be present in the air inside the bag. For analysis, the sampler is removed from the packaging and from the storage vial. The sampler is then de-crimped and the sorbent is analyzed. To describe the fate of the analyte during the storage time, another component is added to the model, which is the air inside the storage vial (see Fig. 2b). Eqn (3)–(8) are also applicable during the post-sampling period. In addition to those equations, assuming that the air in the outside vial is well-mixed, the mass balance of the analyte in the air of the storage vial can be expressed as follows: | (14) |
 | ||
| Fig. 2 An image of the WMS in the storage vial (a) and a conceptual representation of it (b). | ||
In this equation, Vo is the volume of air in the storage vial containing the sampler, and Cv is the concentration of the analyte within the storage vial.
The boundary conditions stated in eqn (10)–(12) are still valid; however, the equilibrium equation in eqn (10) becomes an equation that relates the concentration in the membrane at its interface with the air outside the sampler to the concentration in the storage vial, Cv, as shown in the following equation:
| Cm = KCv | (15) |
Therefore, the concentration in the membrane at x = 0 changes in response to changes in the concentration in the outside vial, as expressed in eqn (16):
 | (16) |
Furthermore, the initial analyte concentrations in the various sampler compartments are equal to the final concentrations at the end of the sampling time, therefore one can write:
 | (17) |
 | (18) |
Eqn (3)–(6) and (14), subject to the initial and boundary conditions listed in eqn (11), (12) and (15)–(18), were solved numerically using the same method used to evaluate the sampling process.
Experimental
Experimental details are included in the ESI† section. Only a summary of the experimental procedures is included here.Calculating the effective uptake rate and the TWA concentration
The proposed method was tested using experimental data on toluene sampling using the WMS,3 in addition to the results from an experimental evaluation of trichloroethylene (TCE) sampling. Passive sampling data were used to calculate analyte concentrations using the iterative uptake rate prediction method and then compare them with those obtained from active sampling. In these experiments, the amounts of the target analyte sampled by the WMS after different periods of exposure at known concentrations were determined. The amount collected after each exposure was then entered into the uptake rate prediction program along with the exposure time and the specific parameters related to the sampler and the sampled analyte (including diffusivity in the membrane, partition coefficient into the membrane, and isotherm parameters of the analyte sorption onto the sorbent). The output of the MATLAB program represented the predicted concentration. This concentration was compared with the concentration obtained from the reference active sampling method.The experiments were conducted by exposing the WMS to an atmosphere of nitrogen mixed with the target analyte vapour for different periods and at different concentrations. The standard gas mixture was generated by passing purified nitrogen gas through a flow-through vessel containing a permeation source of the target analyte. The vapor source was placed inside a GC oven to control the temperature and, therefore, the analyte vapor concentration. The standard gas then entered the exposure chamber in which the samplers were exposed. The chamber was kept at a temperature of 21 °C using a thermostated jacket. The concentration in the chamber was evaluated and monitored during the exposure of the samplers by analyzing samples of the standard gas directly through injection of gas samples into the GC-MS system or by passing known volumes of the standard gas through sorption tubes packed with a sorbent and analyzing them later using the same system.
Evaluation of the post-sampling period
To evaluate the fate and the distribution of the sampled analytes after sampling and during storage, the WMS was exposed for certain periods to known concentrations of the analytes. The sampler was then retrieved, repacked and sealed inside the storage vial. The sorbent and the membrane were analyzed separately after a certain storage period to evaluate the percentage of the analyte amount left in the membrane. The procedure was repeated for different storage periods to monitor the changes in the measured amounts over storage time.The experiments were conducted by exposing the WMS with a membrane of 100 μm thickness to an atmosphere of a single analyte or a mixture of analytes for a certain time. Three samplers were exposed simultaneously, but stored for different times. After each assigned storage time, the sampler was de-crimped, the membrane was removed and immediately placed in a sorption tube in between two layers of approximately 80 mg of Carbopack B™, held in place using three 1 cm-thick layers of glass wool, as demonstrated in Fig. S2.† The purpose of these sorbent layers was to preserve the analyte that was present in the membrane at the time of sorbent retrieval. By placing the membrane between two sorbent layers, any analyte that could be lost during handling of the tube and purging in the thermal desorption unit was preserved. The packed tubes with all components except for the membranes were thermally pre-cleaned and analyzed as blanks prior to membrane insertion for analysis. The sorbent of the WMS was transferred to a separate sorption tube and packed in between two 1 cm-thick layers of glass wool. For storage, the WMS was sealed in a 20 ml glass vial immediately after the end of the exposure. The vial was closed with a plastic cap equipped with an aluminium liner and a Teflon tape was used to improve the seal around the cap. The samplers inside the storage vials were left at room temperature in a ventilated area.
Results and discussion
Model results
 | ||
| Fig. 3 Progress of the iterative method for the uptake rate value (a), and the concentration in the evaluated air (b); calculated concentration is represented with the solid line, and the actual concentration is represented with the dashed line. | ||
Fig. 4 illustrates the changes in the analyte concentration profiles in the membrane over one hour (a) and one week (b) of storage, and in the free analyte concentration in the sorbent bed over one week of storage (c). Fig. 4a shows that the concentration gradient is immediately reversed after sampler placement in the storage vial (within the first minute), as the concentration of the analyte in the air outside the sampler is initially zero. As a result, a small fraction of the analyte amount present in the membrane and in the gas phase of the sorbent bed at the interface with the membrane at the end of the sampling period diffuses into the storage vial. Nonetheless, within one hour of storage this concentration gradient becomes zero, as presented in this figure. Afterwards, the analyte concentration in the membrane decreases with increasing storage time as shown in Fig. 4b. Examining the concentration profiles within the sorbent bed, as presented in Fig. 4c, helps elucidate these observations. Within the first hour after the end of the sampling period, the entire amount of the sorbed analyte is accumulated within the first three millimeters of the sorbent bed near the interface with the membrane. As a result, the concentration of the analyte in the gas phase at this interface is significantly higher relative to the rest of the sorbent bed. This concentration at the sorbent/membrane interface defines the concentrations in the membrane and consequently in the storage vial according to the equilibrium relationships presented in eqn (11) and (15). The concentration profile in the sorbent bed changes, however, over the storage time, as shown in Fig. 4c. Analyte molecules present in the sorbent bed diffuse deeper inside the sampler to occupy a larger volume of the sorbent bed, which, in turn, decreases the analyte concentration at the sorbent bed interface with the membrane, leading to a decrease in the equilibrium concentrations in the membrane and in the storage vial. It is critical to point out here that this description represents the worst-case scenario for the standard 2 mL sampler, as it assumes that the sorbent bed remains undisturbed after sampler retrieval. In real life, the sampler would be moved many times during repackaging, sealing and shipping, leading to mixing of sorbent particles. This, in turn, means that the analyte present in the sorbent bed would be more uniformly distributed immediately after sampling, and low concentrations in the membrane and in the storage vial would be established much faster than the calculations described above suggest.
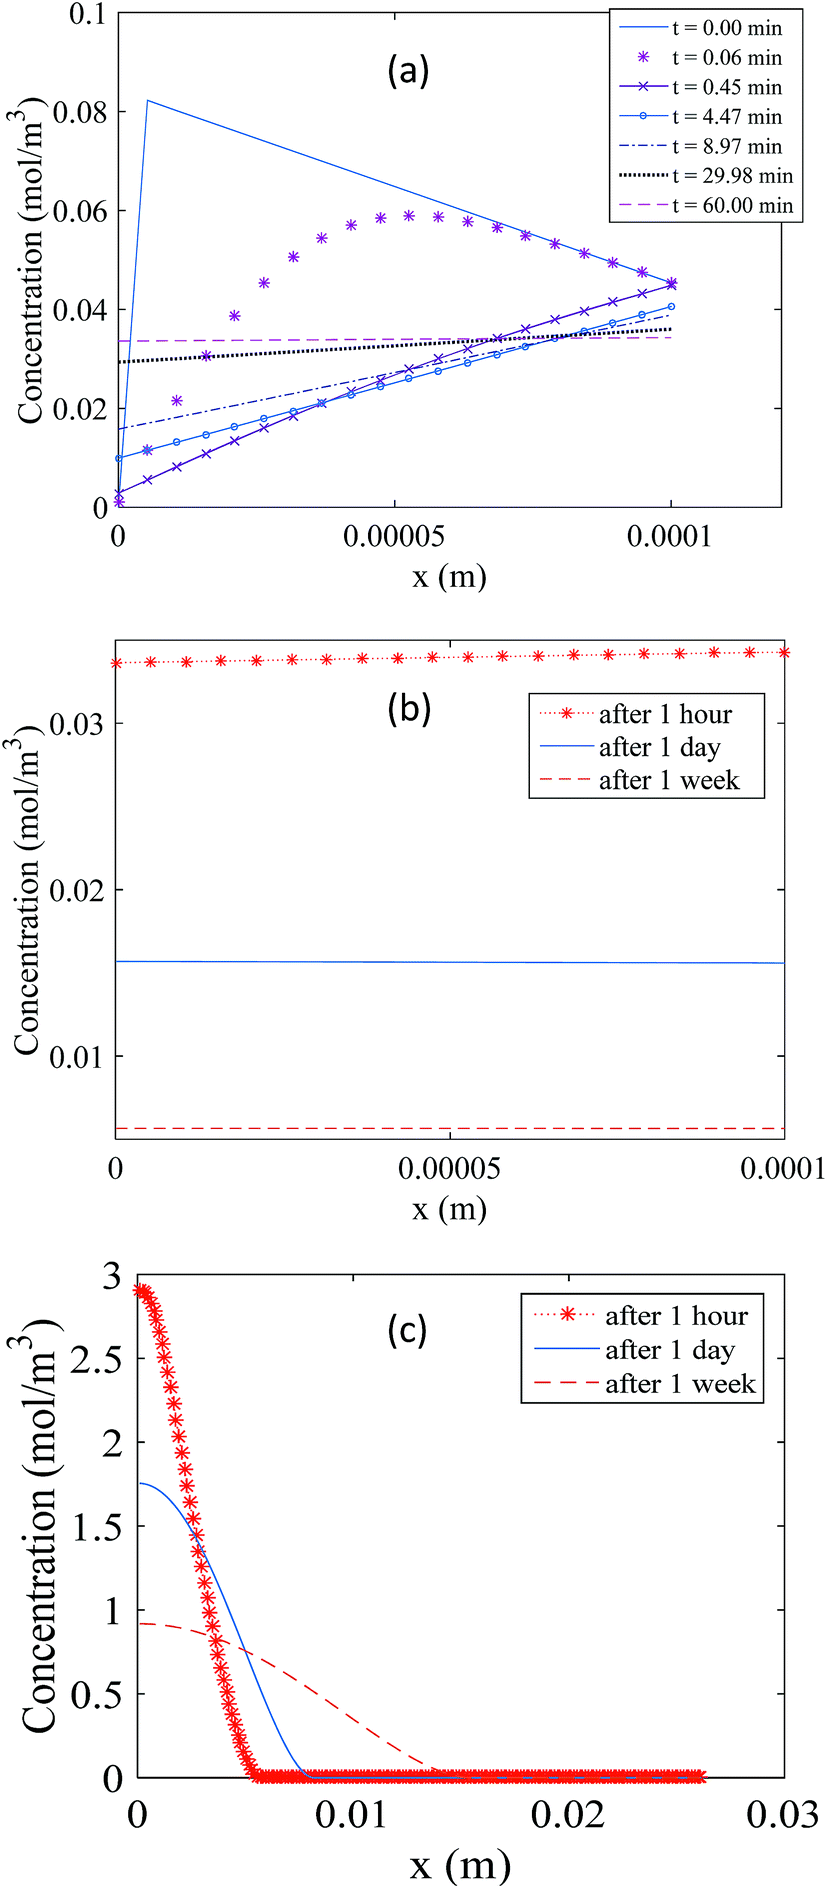 | ||
| Fig. 4 Propagation of the concentration profile during storage in the membrane over one hour (a) and one week (b), and the concentration profile for the free analyte molecules in the sorbent bed (c). | ||
Fig. 5a shows the results of the amounts sorbed to the solid particles over seven days of storage. It can be seen in this figure that this amount remains constant over time. Additionally, Fig. 5b presents the percent amounts present in all other sampler compartments during the same storage period relative to the sorbed amount in the sorbent bed. All fractions present in those compartments remain negligible (less than 1% in the storage vial, less than 0.1% in the membrane, and less than 0.001% in the gas phase of the sorbent bed) despite the initial increase in analyte fraction in the membrane and in the storage vial.
 | ||
| Fig. 5 Changes over time of the amount sorbed to the solid particles (a), and the percent amounts present in the different compartments of the stored WMS relative to that sorbed to the particles (b). | ||
The above results support the hypothesis that the sorbent particles are by far the major sink for the analytes collected by the WMS and that analysing these particles is sufficient to measure the amount of analyte collected by the sampler. Another conclusion drawn based on these results is that the collected analyte is preserved in the sorbent once the sampler is sealed inside the storage vial, and the length of the storage period does not affect the amount of the trapped analyte if no chemical degradation occurs.
Experimental verifications
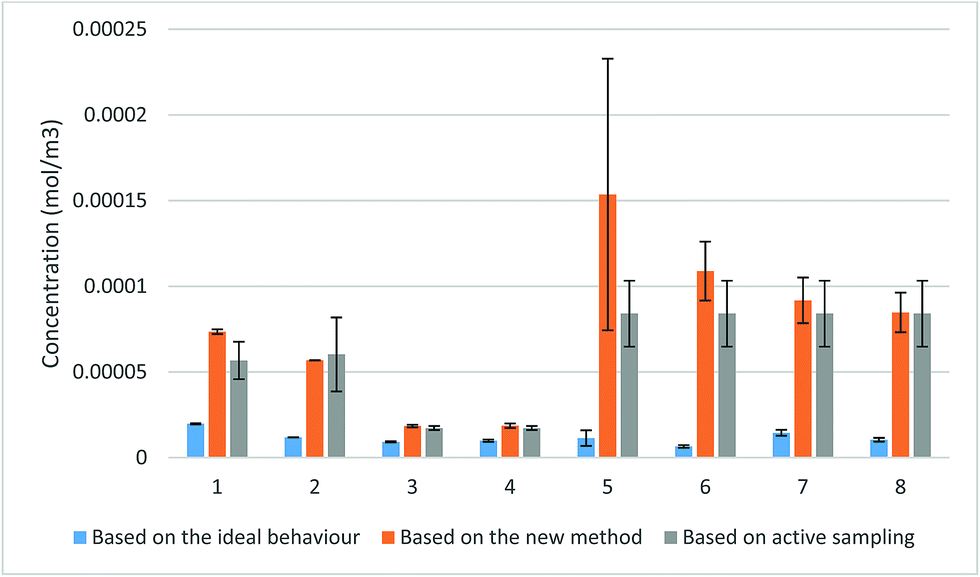 | ||
| Fig. 6 Demonstration of the performance of the proposed method in determining the TWA concentration using experimental data (error bars represent one standard deviation). In exposures 1–4, a WMS with a 100 μm-thick membrane was used to sample toluene vapor. A sampler with a membrane of the same thickness (100 μm) was used to sample TCE vapor in exposures 5 and 6, while a WMS with a 200 μm-thick membrane was used for TCE in exposures 7 and 8. | ||
The comparison between the concentrations produced by the proposed method and the concentrations calculated based on the ideal value of the uptake rate revealed a considerable increase in the TWA concentration when the new method was applied. The values obtained using the proposed method closely approached the values obtained from active sampling with overlapping uncertainty ranges. These values were in significantly better agreement with the active sampling measurements than the concentrations determined based on the ideal uptake rate values. The only exception was one measurement of TCE concentration in exposure 5 due to the uncharacteristically wide scatter between the amounts collected by the three samplers used in this measurement. Student’s t-test (paired two sample for means) at 95% probability level revealed that the differences between the calculated concentrations using the proposed method and the results of the active sampling were statistically insignificant with |tcalc| = 1.74 being smaller than tcritical = 1.89 (one-tail) and tcritical = 2.36 (two-tail). On the other hand, the same test demonstrated significant differences between the calculated values based on the ideal behaviour and the measured concentrations using active sampling with |tcalc| = 4.78, higher than both tcritical (one-tail) and tcritical (two-tail).
It is important to add here that the analytes detected “in” the membrane may have been, at least in part, adsorbed to fine sorbent particles still attached to the membrane after sampling (easily detected visually), which might also explain the high uncertainty in the measured fractions. Fig. S4† shows the difference in the appearance of the membrane before and after sampling. It can be seen in this figure that fine sorbent particles adhered to the membrane after sampling and could not be easily removed. Nevertheless, even with this contribution, the overall analyte loss to the membrane was insignificant in all the experiments presented in this paper.
In the next two sets of experiments, the WMS was exposed to mixtures of VOCs. Fig. 7 shows the amounts of seven VOCs found in the sorbent after up to three-weeks of storage time. The samplers were exposed for one hour to a mixture of the seven compounds with the concentrations presented in Table 1. The results presented in Fig. 7 demonstrate the stability of the amounts detected in the sorbent over the evaluated storage time. Table 1 also shows that the average fractions of each analyte detected in the membranes did not exceed 5% of the amount found in the sorbent. The variation of these fractions, however, did not affect the results of the analyte amount determination in the sorbent.
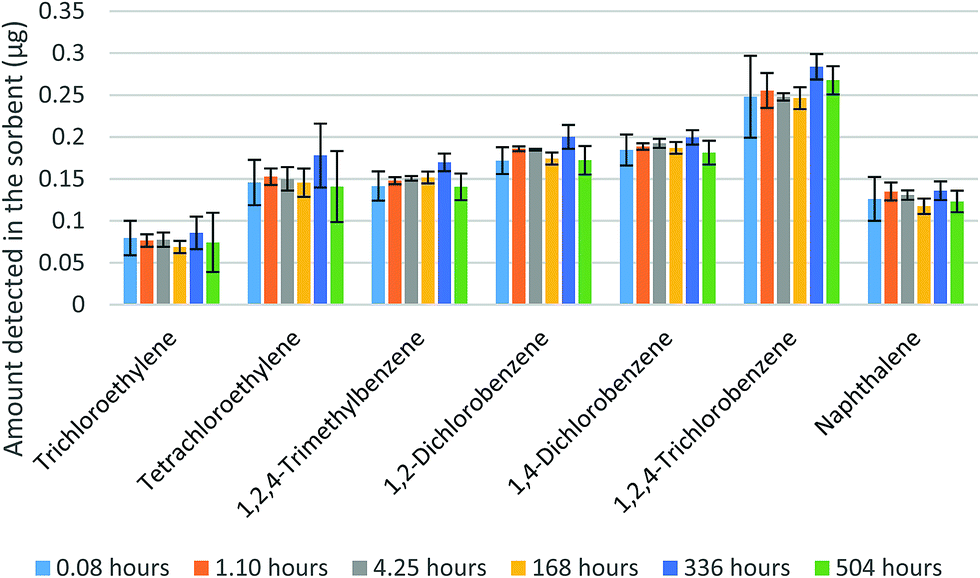 | ||
| Fig. 7 Amounts of analytes measured in the sorbent at different points of storage time (error bars represent one standard deviation). | ||
| Compound | Exposure concentration (mg m−3) | Storage time | |||||
|---|---|---|---|---|---|---|---|
| 0.083 | 1.1 | 4.25 | 168 | 336 | 504 | ||
| Average (membrane/sorbent) (%) | |||||||
| Trichloroethylene | 1.42 | 0.0 ± 0.0 | 0.0 ± 0.0 | 2.0 ± 6.6 | 0.7 ± 1.9 | 2.3 ± 5.0 | 5 ± 16 |
| Tetrachloroethylene | 1.79 | 0.50 ± 0.28 | 0.22 ± 0.48 | 0.12 ± 0.53 | 0.40 ± 0.49 | 0.4 ± 1.9 | 0.25 ± 0.37 |
| 1,2,4-Trimethylbenzene | 0.75 | 1.3 ± 1.0 | 0.29 ± 0.65 | 1.8 ± 3.6 | 0.29 ± 0.53 | 0.14 ± 0.15 | 0.3 ± 1.1 |
| 1,2-Dichlorobenzene | 0.83 | 0.008 ± 0.035 | 0.0 ± 0.0 | 0.0 ± 0.0 | 0.0 ± 0.0 | 0.0 ± 0.0 | 0.0 ± 0.0 |
| 1,4-Dichlorobenzene | 0.71 | 0.013 ± 0.054 | 0.5 ± 2.2 | 0.0 ± 0.0 | 0.52 ± 0.00 | 0.0 ± 0.0 | 0.5 ± 3.1 |
| 1,2,4-Trichlorobenzene | 0.72 | 3 ± 10 | 0.8 ± 3.5 | 2.7 ± 12 | 4.9 ± 6.9 | 0.1 ± 1.9 | 4 ± 11 |
| Naphthalene | 0.48 | 3 ± 13 | 1.3 ± 3.8 | 3.7 ± 16 | 3.7 ± 8.1 | 0.4 ± 5.2 | 4 ± 15 |
In the next experiment, the WMS were exposed to an atmosphere of nitrogen containing a mixture of 29 VOCs at concentrations presented in Table 2 for three hours. The average fractions of sampled analytes detected in the membrane did not exceed 2% of each analyte when the sampler was analyzed immediately after sampling. These fractions diminished to zero or close to zero after the one-week and two-week storage periods.
| Compound | Average exposure concentrations (mg m−3) | Average (membrane/sorbent) (%) | ||
|---|---|---|---|---|
| Immediately analyzed | 1 week storage | 2 week storage | ||
| 1,1-Dichloroethane | 1.56 | 0.0 ± 0.0 | 0.0 ± 0.0 | 0.0 ± 0.0 |
| cis-1,2-Dichloroethylene | 1.48 | 0.0 ± 0.0 | 0.0 ± 0.0 | 0.0 ± 0.0 |
| Chloroform | 1.71 | 0.5 ± 2.2 | 0.0 ± 0.0 | 0.0 ± 0.0 |
| 1,1,1-Trichloroethane | 2.48 | 0.0 ± 0.0 | 0.0 ± 0.0 | 0.0 ± 0.0 |
| Benzene | 1.89 | 0.38 ± 0.55 | 0.0 ± 0.0 | 0.0 ± 0.0 |
| 1,2-Dichloroethane | 1.63 | 0.0 ± 0.0 | 0.0 ± 0.0 | 0.0 ± 0.0 |
| Trichloroethylene | 1.75 | 0.77 ± 0.66 | 0.0 ± 0.0 | 0.0 ± 0.0 |
| 1,2-Dichloropropane | 1.95 | 1.4 ± 5.9 | 0.0 ± 0.0 | 0.0 ± 0.0 |
| Toluene | 1.73 | 0.13 ± 0.48 | 0.3 ± 1.2 | 0.0 ± 0.0 |
| 1,1,2-Trichloroethane | 1.65 | 0.8 ± 2.1 | 0.7 ± 1.5 | 0.6 ± 1.4 |
| Tetrachloroethylene | 1.79 | 0.03 ± 0.15 | 0.5 ± 2.0 | 0.0 ± 0.0 |
| Dibromochloromethane | 1.45 | 1.7 ± 4.0 | 1.6 ± 7.0 | 0.0 ± 0.0 |
| 1,2-Dibromoethane | 1.55 | 0.7 ± 2.8 | 0.0 ± 0.0 | 0.0 ± 0.0 |
| Chlorobenzene | 1.59 | 0.26 ± 0.44 | 0.0 ± 0.0 | 0.0 ± 0.0 |
| Ethylbenzene | 1.75 | 0.25 ± 0.31 | 0.0 ± 0.0 | 0.0 ± 0.0 |
| p-Xylene | 1.76 | 0.25 ± 0.28 | 0.0 ± 0.0 | 0.0 ± 0.0 |
| o-Xylene | 2.10 | 0.20 ± 0.43 | 0.0 ± 0.0 | 0.0 ± 0.0 |
| Isopropylbenzene | 1.73 | 0.30 ± 0.29 | 0.08 ± 0.34 | 0.06 ± 0.15 |
| 1,1,2,2-Tetrachloroethane | 1.35 | 0.7 ± 3.2 | 0.0 ± 0.0 | 0.0 ± 0.0 |
| 1,2,3-Trichloropropane | 1.54 | 0.11 ± 0.45 | 0.0 ± 0.0 | 0.0 ± 0.0 |
| Propylbenzene | 1.54 | 0.08 ± 0.34 | 0.0 ± 0.0 | 0.0 ± 0.0 |
| tert-Butylbenzene | 1.22 | 0.79 ± 0.89 | 0.0 ± 0.0 | 0.0 ± 0.0 |
| 1,2,4-Trimethylbenzene | 1.72 | 0.50 ± 0.27 | 0.0 ± 0.0 | 0.0 ± 0.0 |
| sec-Butylbenzene | 1.37 | 0.70 ± 0.41 | 0.0 ± 0.0 | 0.0 ± 0.0 |
| 1,2-Dichlorobenzene | 1.32 | 0.57 ± 0.46 | 0.0 ± 0.0 | 0.0 ± 0.0 |
| 1,4-Dichlorobenzene | 1.44 | 0.58 ± 0.49 | 0.0 ± 0.0 | 0.0 ± 0.0 |
| 1,3-Dichlorobenzene | 1.43 | 0.64 ± 0.54 | 0.0 ± 0.0 | 0.0 ± 0.0 |
| 1,2,4-Trichlorobenzene | 1.11 | 1.4 ± 2.2 | 0.0 ± 0.0 | 0.0 ± 0.0 |
| 1,2,3-Trichlorobenzene | 0.80 | 1.8 ± 2.2 | 0.0 ± 0.0 | 0.0 ± 0.0 |
Conclusions
Two applications were derived in this work as extensions of the mathematical model developed previously.3 The uptake rate prediction method allows calculation of the effective uptake rate of the WMS at the end of the sampling period. It provides a valuable tool for more accurate measurement of the TWA concentrations. The determination of these concentrations relies on the accuracy of the uptake rate values towards the target analytes. Changes in these values during sampling result in underestimation of the measured concentrations if an appropriate correction is not applied. This deviation from linearity is not unique to the WMS, but common for all passive samplers with an adsorbing receiving phase. The proposed method was implemented in a MATLAB program allowing the corrected concentration to be calculated once the amount of analyte collected by the sampler was determined. Experimental evaluation of the proposed method using actual amounts of analytes collected by the WMS over different exposure times showed excellent performance, with calculated concentrations that did not differ statistically significantly from the concentrations measured using a parallel active sampling method. The method presented in this work can also be applied to different types of passive samplers (e.g. diffusive ones) after adjusting the mathematical model to reflect the sampler of interest. More research is on the way to provide values of parameters needed in the model for a wide range of analytes of interest and sorbents in use. The method could be developed to be more practical by adding a library of the needed parameters of a wide range of common analytes at different temperatures, so that the user would only need to enter the target analyte, the sampling time and temperature, and the amount detected in the sampler to calculate the concentration in the evaluated medium.In the second part, the model was extended to describe the post-sampling storage of a permeation passive sampler (WMS). The developed model predicts the distribution of analytes within different compartments of the sampler and its storage container, in addition to the changes of this distribution during the storage time. The model revealed that negligible amounts of the analyte remain in the membrane and the storage container shortly after placing the sampler in storage, as analyte molecules diffuse deeper into the sorbent bed. As a result, the amounts of analyte collected by the sampler are expected to be preserved inside the sorbent throughout the storage period. Additionally, analyzing the sorbent is sufficient to correctly measure the collected amounts of the analytes, with only negligible analyte fractions being lost to the membrane and distributed in the air inside the storage vial. These conclusions were verified and confirmed by the experimental results obtained through the analysis of both the sorbent and the membrane (separately) at different points of the storage time. The results of this work are important in verifying the efficiency of the current storage and analysis methods in accurately reflecting the actual sampled amounts of VOCs, which, in turn, has a significant contribution to the accuracy of the concentrations determined in the evaluated medium. These results also address the concerns of some users about a potentially significant loss of analytes sorbed into the PDMS membrane, which is commonly excluded from the analysis. The results demonstrate unequivocally that the membrane serves only as the uptake rate-defining barrier, as intended, and does not compete in any significant way with the sorbent inside the sampler. Finally, based on the results of this study, it is recommended to mix the sorbent immediately after retrieval of the WMS after sampling to minimize the amount of the sampled analyte diffusing into the storage vial.
Conflicts of interest
There are no conflicts to declare.Acknowledgements
This work was funded by the Natural Sciences and Engineering Research Council (NSERC). The authors gratefully acknowledge Hashthana Puvanendran and Ruiyi Zhao for their contribution to some of the experiments included in this work.References
- B. Zabiegała, A. Kot-Wasik, M. Urbanowicz and J. Namieśnik, Passive sampling as a tool for obtaining reliable analytical information in environmental quality monitoring, Anal. Bioanal. Chem., 2010, 396, 273 CrossRef PubMed.
- T. Górecki and J. Namieśnik, Passive sampling, TrAC, Trends Anal. Chem., 2002, 21, 276 CrossRef.
- F. Salim, M. Ioannidis and T. Górecki, Experimentally validated mathematical model of analyte uptake by permeation passive samplers, Environ. Sci.: Processes Impacts, 2017, 19, 1363 RSC.
- S. Seethapathy, T. Górecki and X. Li, Passive sampling in environmental analysis, J. Chromatogr. A, 2008, 1184, 234 CrossRef CAS PubMed.
- S. Seethapathy and T. Górecki, Polydimethylsiloxane-based permeation passive air sampler. Part II: effect of temperature and humidity on the calibration constants, J. Chromatogr. A, 2010, 1217, 7907 CrossRef CAS.
- L. Tuduri, M. Millet, O. Briand and M. Montury, Passive air sampling of semi-volatile organic compounds, Trends Anal. Chem., 2012, 31, 38 CrossRef CAS.
- J. N. Huckins, J. D. Petty, J. A. Lebo, F. V. Almeida, K. Booij, D. A. Alvarez, W. L. Cranor, R. C. Clark and B. B. Mogensen, Development of the permeability/performance reference compound approach for in situ calibration of semipermeable membrane devices, Environ. Sci. Technol., 2002, 36, 85 CrossRef CAS.
- K. Booij and F. Smedes, An improved method for estimating in situ sampling rates of nonpolar passive samplers, Environ. Sci. Technol., 2010, 44, 6789 CrossRef CAS PubMed.
- S. Seethapathy and T. Górecki, Polydimethylsiloxane-based permeation passive air sampler. Part I: calibration constants and their relation to retention indices of the analytes, J. Chromatogr. A, 2011, 1218, 143 CrossRef CAS.
- T. McAlary, H. Groenevelt, S. Seethapathy, P. Sacco, D. Crump, M. Tuday, B. Schumacher, H. Hayes, P. Johnson and T. Górecki, Quantitative passive soil vapor sampling for VOCs – part 2: laboratory experiments, Environ. Sci.: Processes Impacts, 2014, 16, 491 RSC.
- T. McAlary, H. Groenevelt, S. Seethapathy, P. Sacco, D. Crump, M. Tuday, B. Schumacher, H. Hayes, P. Johnson, L. Parker and T. Górecki, Quantitative passive soil vapor sampling for VOCs – part 4: flow-through cell, Environ. Sci.: Processes Impacts, 2014, 16, 1103 RSC.
- T. McAlary, H. Groenevelt, P. Nicholson, S. Seethapathy, P. Sacco, D. Crump, M. Tuday, B. Schumacher, H. Hayes, P. Johnson, T. Górecki and I. Rivera-Duarte, Quantitative passive soil vapor sampling for VOCs – part 3: field experiments, Environ. Sci.: Processes Impacts, 2014, 16, 501 RSC.
- X. Zhang, C. Wong, Y. D. Lei and F. Wania, Influence of sampler configuration on the uptake kinetics of a passive air sampler, Environ. Sci. Technol., 2012, 46, 397 CrossRef CAS PubMed.
- X. Zhang, M. Hoang, Y. D. Lei and F. Wania, Exploring the role of the sampler housing in limiting uptake of semivolatile organic compounds in passive air samplers, Environ. Sci.: Processes Impacts, 2015, 17, 2006 RSC.
- J. M. Armitage, S. J. Hayward and F. Wania, Modeling the uptake of neutral organic chemicals on XAD passive air samplers under variable temperatures, external wind speeds and ambient air concentrations (PAS-SIM), Environ. Sci. Technol., 2013, 47, 13546 CrossRef CAS PubMed.
- J. Klánová, P. Èupr, J. Kohoutek and T. Harner, Assessing the influence of meteorological parameters on the performance of polyurethane foam-based passive air samplers, Environ. Sci. Technol., 2007, 42, 550 CrossRef.
- L. Tuduri, T. Harner and H. Hung, Polyurethane foam (PUF) disks passive air samplers: wind effect on sampling rates, Environ. Pollut., 2006, 144, 377 CrossRef CAS PubMed.
- F. Wania, L. Shen, Y. D. Lei, C. Teixeira and D. C. Muir, Development and calibration of a resin-based passive sampling system for monitoring persistent organic pollutants in the atmosphere, Environ. Sci. Technol., 2003, 37, 1352 CrossRef CAS.
- X. Zhang, M. Tsurukawa, T. Nakano, Y. D. Lei and F. Wania, Sampling medium side resistance to uptake of semivolatile organic compounds in passive air samplers, Environ. Sci. Technol., 2011, 45, 10509 CrossRef CAS PubMed.
- C. Walgraeve, K. Demeestere, J. Dewulf, K. Van Huffel and H. Van Langenhove, Uptake rate behavior of tube-type passive samplers for volatile organic compounds under controlled atmospheric conditions, Atmos. Environ., 2011, 45, 5872 CrossRef CAS.
- B. Tolnai, A. Gelencser and J. Hlavay, Theoretical approach to non-constant uptake rates for tube-type diffusive samplers, Talanta, 2001, 54, 703 CrossRef CAS.
- X. Zhang and F. Wania, Modeling the uptake of semivolatile organic compounds by passive air samplers: Importance of mass transfer processes within the porous sampling media, Environ. Sci. Technol., 2012, 46, 9563 CrossRef CAS.
- S. Seethapathy, Uptake rate modeling and field applications of a new permeation passive sampler, PhD thesis, University of Waterloo, 2009 Search PubMed.
- S. Seethapathy and T. Górecki, Applications of polydimethylsiloxane in analytical chemistry: a review, Anal. Chim. Acta, 2012, 750, 48 CrossRef CAS PubMed.
Footnote |
| † Electronic supplementary information (ESI) available. See DOI: 10.1039/c8em00397a |
| This journal is © The Royal Society of Chemistry 2019 |