
 Open Access Article
 This Open Access Article is licensed under a
 Creative Commons Attribution 3.0 Unported Licence
Elucidating lithium-ion and proton dynamics in anti-perovskite solid electrolytes†
James A.
Dawson
 *a,
Tavleen S.
Attari
b,
Hungru
Chen
a,
Steffen P.
Emge
c,
Karen E.
Johnston
*b and
M. Saiful
Islam
*a
*a,
Tavleen S.
Attari
b,
Hungru
Chen
a,
Steffen P.
Emge
c,
Karen E.
Johnston
*b and
M. Saiful
Islam
*a
aDepartment of Chemistry, University of Bath, Bath, BA2 7AY, UK. E-mail: j.a.dawson@bath.ac.uk; m.s.islam@bath.ac.uk
bDepartment of Chemistry, Durham University, Durham, DH1 3LE, UK. E-mail: karen.johnston@durham.ac.uk
cDepartment of Chemistry, University of Cambridge, Cambridge, CB2 1EW, UK
First published on 30th July 2018
Abstract
All-solid-state Li-ion batteries are currently attracting considerable research attention as they present a viable opportunity for increased energy density and safety when compared to conventional liquid electrolyte-based devices. The Li-rich anti-perovskite Li3−xOHxCl has generated recent interest as a potential solid electrolyte material, but its lithium and proton transport capabilities as a function of composition are not fully characterised. In this work, we apply a combination of ab initio molecular dynamics and 1H, 2H and 7Li solid-state NMR spectroscopy to study the mobility of lithium ions and protons in Li3−xOHxCl. Our calculations predict a strongly exothermic hydration enthalpy for Li3OCl, which explains the ease with which this material absorbs moisture and the difficulty in synthesising moisture-free samples. We show that the activation energy for Li-ion conduction increases with increasing proton content. The atomistic simulations indicate fast Li-ion diffusion but rule out the contribution of long-range proton diffusion. These findings are supported by variable-temperature solid-state NMR experiments, which indicate localised proton motion and long-range Li-ion mobility that are intimately connected. Our findings confirm that Li3−xOHxCl is a promising solid electrolyte material for all-solid-state Li-ion batteries.
Broader contextEnergy storage is a fundamental technology for a clean energy economy. However, substantial advancements in energy density compared to traditional Li-ion batteries are essential. One possible avenue to higher energy density, as well as improved operational safety, is the combination of a solid electrolyte with a lithium metal anode to create an all-solid-state battery. The discovery of new solid electrolytes and their optimisation are aided by the synergistic combination of computational chemistry and atomic-scale experimental characterisation. Here, we apply a combination of ab initio molecular dynamics and solid-state NMR spectroscopy to examine the mobility of lithium ions and protons in the promising anti-perovskite solid electrolyte material, Li3−xOHxCl. We show that Li-ion transport is highly correlated with the proton and Li-ion vacancy concentrations, whilst confirming that proton hopping is restricted as a result of the large separation between oxygen ions. A new Li-ion hopping mechanism is proposed on the basis of the strong correlation between long-range Li-ion transport and OH− rotation. Our results suggest that the Li-rich anti-perovskite system is an excellent candidate electrolyte for all-solid-state batteries. |
Introduction
Interest in fast Li-ion conducting solid electrolytes for the next generation of Li-ion batteries is ever increasing. By replacing the flammable liquid electrolytes currently used in commercial Li-ion batteries with solid electrolytes, the safety of the devices can be greatly enhanced.1–3 In addition to the safety benefits, solid electrolytes have the potential to enable the use of Li metal anodes, resulting in increased energy densities, and extended electrochemical windows.4–6 A significant number of materials, typically based on the garnet, LISICON and perovskite structures, have been investigated as possible Li-ion solid electrolytes.7–11Although the high Li-ion conductivities of Li-rich anti-perovskite materials have been known for decades,12,13 it is only recently that significant interest has been generated for solid electrolyte applications.14–28 Zhao and Daemen14 reported high ionic conductivities (>10−3 S cm−1 at room temperature) and low activation energies (0.18–0.26 eV) for Li3OX-based compositions, where X = Cl or Br. However, subsequent reports have noted reduced Li-ion conductivities and increased activation barriers for these materials.16–21,23
It has been suggested that the as-prepared samples in the work of Zhao and Daemen were in fact hydrated compositions, i.e., Li2OHCl,19 based on their hygroscopic nature.12,13,15,19,22 The measured ionic conductivities of these materials are known to be highly dependent on the sample preparation.16
Hood et al. explored Li2OHCl as a potential solid electrolyte system and found that it possesses high Li-ion conductivity and a reasonable activation energy.15 Li et al. reported that fluorine doping of Li2OHX (X = Cl or Br) resulted in a promising solid electrolyte with high Li-ion conductivity.19 More recently, the ionic conductivities of Li3−xOHxCl were measured as a function of proton concentration using impedance spectroscopy.22
However, the Li-ion and proton dynamics of the Li3−xOHxCl system are not fully characterized, especially at the atomic scale. Here, ab initio molecular dynamics (AIMD) calculations and solid-state 1H, 2H and 7Li NMR spectroscopy are used to study the dependence of Li-ion conductivity on the stoichiometry of the Li3−xOHxCl system and to identify the contribution of proton transport. We show that the reaction of Li3OCl and water is highly exothermic and that the activation energy for Li-ion transport increases with increasing proton concentration. Long-range proton transport is shown to be inhibited as a result of the large interatomic distances between adjacent oxygen ions.
Methods
Ab initio simulations
All calculations were performed using density functional theory (DFT) based on the Vienna ab initio simulation package (VASP).29 A plane-wave cut-off energy of 400 eV, the projector augmented wave method30 and the PBEsol exchange–correlation functional were employed. This functional has been used in previous successful studies of Li-ion battery materials.27,31–33 The k-space was sampled with a k-point mesh spacing smaller than 0.05 Å−1 and the gamma-point only for the reaction enthalpy and AIMD calculations, respectively. Structural optimisation was performed until the residual force on each atom was smaller than 0.03 eV Å−1. AIMD simulations were carried out to examine Li+ ion diffusion in Li3−xOHxCl with 4 × 4 × 4 supercells containing 320 atoms. Each composition was first equilibrated for 10 ps. Statistical properties were then obtained from the following 50 ps simulations using the NVT ensemble with a Nose–Hoover thermostat.34 The AIMD calculations were carried out at 600, 700, 800, 900 and 1000 K, with a short time step of 1 fs due to the presence of hydrogen. Self-diffusion data for Li were obtained from the mean square displacement (MSD) according to:| 〈ri2(t)〉 = 6DLit | (1) |
 | (2) |
Synthesis and characterisation
Samples of Li2OHCl were synthesised via solid-state methods. Stoichiometric amounts of commercial LiCl (Alfa Aesar, ultra dry, 99.9%) and LiOH (Acros Organics, anhydrous, 98%) were mixed and ground in an agate mortar and pestle inside an argon-filled glovebox. The powdered sample was placed in an alumina crucible and heated at 350 °C for 30 min in a muffle furnace located inside the Ar-filled glovebox. Once the reaction was complete, the furnace was allowed to cool to room temperature and the sample was recovered. A sample of Li2OHCl was deuterated for 2H NMR experiments using the same procedure outlined above, using the deuterated starting reagent LiOD.Samples in the series Li3−xOHxCl, x = 0.25, 0.5 and 0.75, were also synthesised via a solid-state route using the same precursors. The powdered samples were placed in an alumina crucible that was placed inside a quartz tube. The quartz tube was sealed, removed from the glovebox, connected to a conventional Schlenk line apparatus and evacuated to 10−3 mbar for 1 h. All samples were heated at 350 °C for 30 min. Once the reaction was complete, the sealed quartz tube was removed from the furnace and allowed to cool to room temperature. Once cooled, the tube was returned to the Ar-filled glovebox, where the product was recovered. Post synthesis, the proton content of each sample was determined via integration of the appropriate 1H NMR spectrum, as detailed in the ESI.†
X-ray diffraction
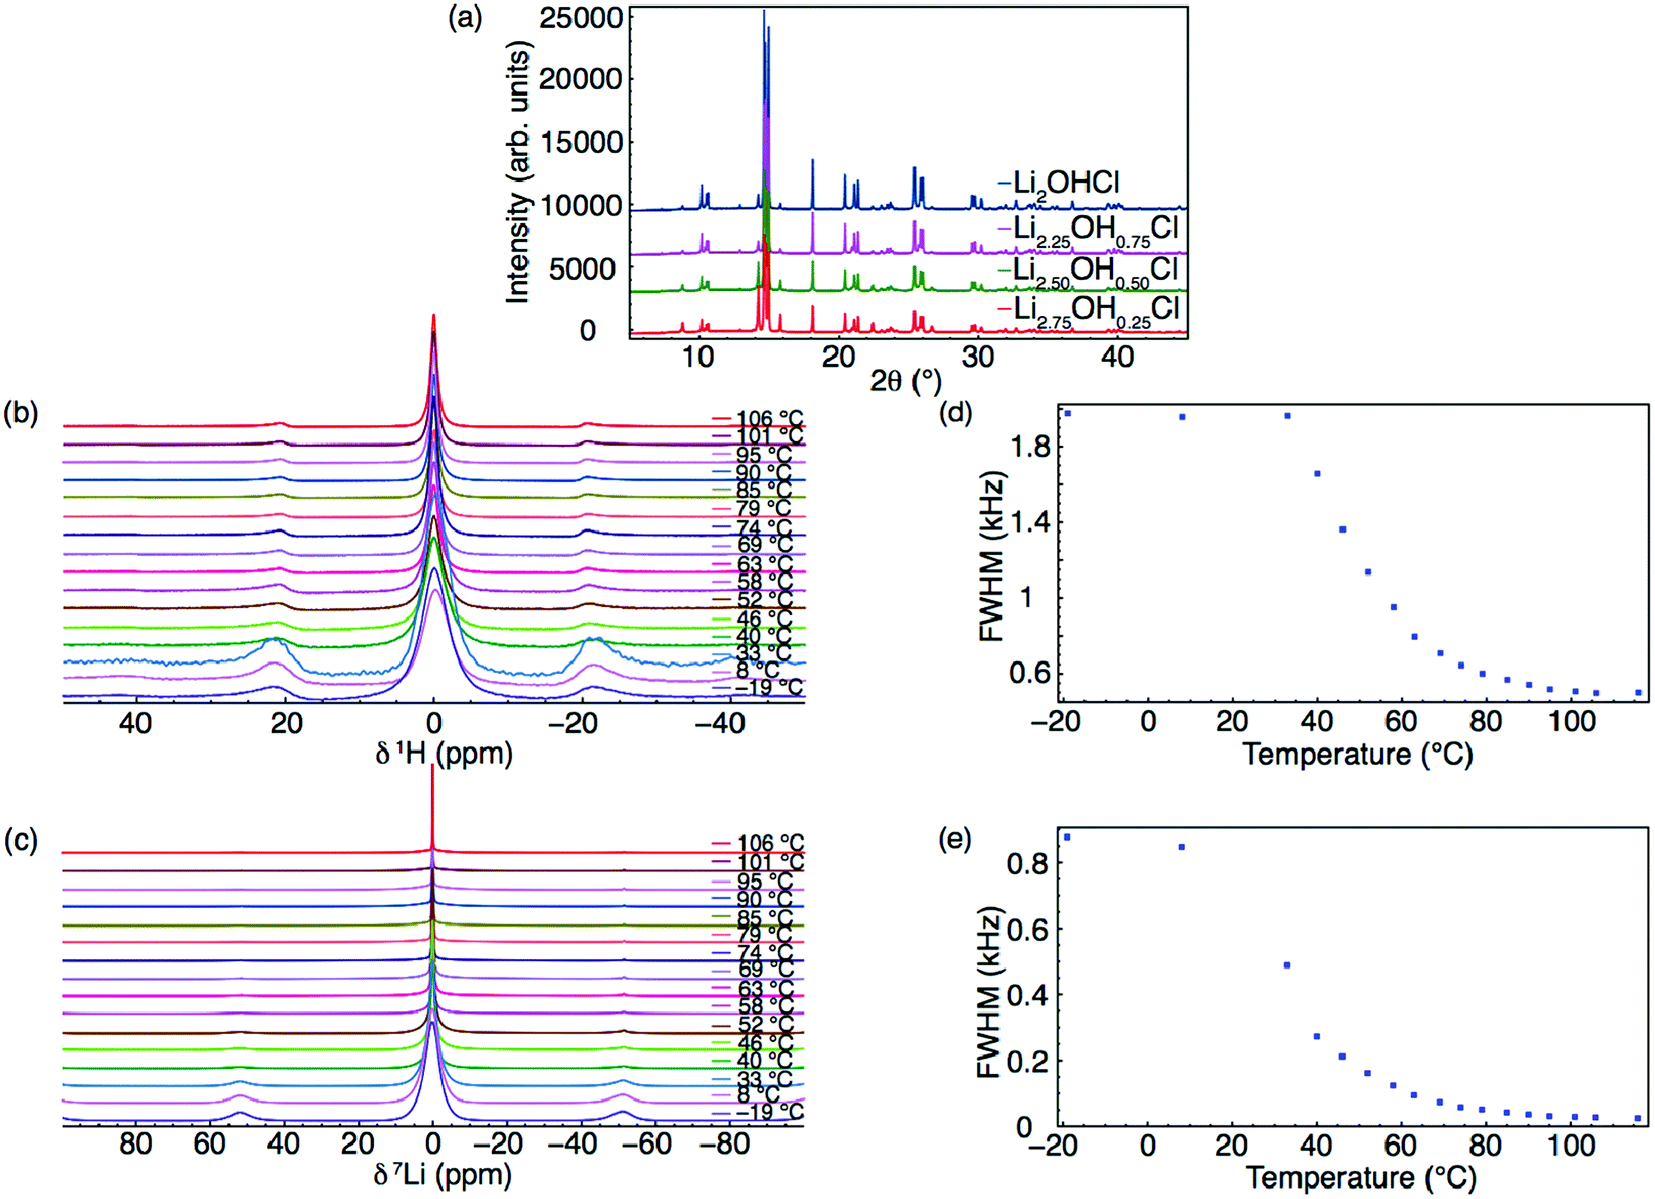
All samples were characterised by X-ray diffraction (XRD) using a Bruker d8 diffractometer using Mo (λ = 0.71073 Å) radiation. Variable-temperature (VT) XRD patterns were obtained for Li2OHCl, where the temperature was increased at a rate of 2 °C h−1.NMR spectroscopy
All solid-state NMR spectra were acquired using a Bruker 500 Avance III HD spectrometer, equipped with a wide-bore 11.7 T Oxford magnet, using Larmor frequencies of 499.69 MHz for 1H (I = 1/2), 76.77 MHz for 2H (I = 1) and 194.20 MHz for 7Li (I = 3/2). Powdered samples were packed into conventional 4.0 mm ZrO2 rotors under an Ar atmosphere, and a magic-angle spinning (MAS) rate of 10 kHz was employed. 1H chemical shifts were referenced to neat tetramethylsilane, by setting the resonance from a sample of adamantane to δiso = 1.9 ppm. 7Li chemical shifts were referenced to 1 M LiCl(aq). 2H chemical shifts were referenced to (CD3)4Si using a sample of CDCl3, δiso = 7.24 ppm.Standard VT 1H, 2H and 7Li MAS NMR experiments were completed for samples in the series Li3−xOHxCl between −19 and 110 °C using conventional hardware and the parameters detailed in the ESI.† Additional VT static 7Li NMR experiments were completed for Li2OHCl over a temperature range of −65 to 230 °C using a Bruker 400 Avance III HD spectrometer, equipped with a wide-bore 9.7 T magnet, using a Larmor frequency of 155.5 MHz for 7Li. The sample was packed into a 5.0 mm ceramic rotor inside an Ar-filled glovebox and placed into a Bruker 5.0 mm static probe. In all cases, quoted temperatures have been calibrated and reflect the true temperature of the sample during the experiment. Additional experimental details are given in the ESI.†
Pulsed-field gradient (PFG)-NMR spectroscopy
7Li PFG-NMR experiments were performed using a Bruker Diff50 PFG probe equipped with a Z-gradient and an EVT 7Li saddle coil in a 7.046 T magnet. Spectra were acquired using a stimulated diffusion pulse sequence (Scheme S1, ESI†) and varying gradient strengths. The effective gradient length, δ, was set to 5 ms and a maximum gradient strength of 1800 G cm−1 was used. The diffusion time, Δ, was kept constant and set to either 100, 175 or 250 ms. Diffusion coefficients were obtained by fitting the decaying signal. All acquisitions were performed at an elevated temperature of 373 K. All samples were sealed into glass tubes under an Ar atmosphere.Results and discussion
Hydration of Li3OCl
The hygroscopic nature of the anti-perovskites has been shown experimentally.12,13,15,19 In addition, it has been demonstrated that the preparation of Li3OX (X = Cl or Br) from dry Li2O and LiX is challenging, even at high temperatures of 773–873 K.19 This is in agreement with previous DFT calculations that predict Li3OX to be metastable relative to Li2O and LiX.45,46 Li3OX is usually prepared by annealing LiOH and LiX together.14,19 The hydration of Li3OX is charge-compensated by Li-ion vacancies.To quantify the uptake of hydrogen in Li3OCl, we first calculate its hydration enthalpy, based on the following reaction:
 | (3) |
Structures of Li3−xOHxCl
Two phases have been confirmed for the hydrated phase, Li2OHCl, using XRD.13 Below ∼308 K, Li2OHCl is reported to exist as an orthorhombic structure in space group Amm2. However, to date, no crystallographic information has been reported for this phase, although DFT-based techniques have been used in an attempt to rectify this.21 Above this temperature, Li2OHCl undergoes a phase transition to the cubic anti-perovskite phase with space group Pm![[3 with combining macron]](https://www.rsc.org/images/entities/char_0033_0304.gif) m.13 This phase transition, which is clearly observed during the present study via both VT XRD and 1H and 7Li MAS NMR studies (Fig. 1 and Fig. S2, ESI†), is known to increase the Li-ion conductivity by several orders of magnitude.13,15,19 Moreover, it has been reported that the presence of cubic symmetry is a prerequisite for high ionic mobility in these materials.13 There is a strong correlation between the Li motion and OH− group rotation in Li3−xOHxCl, with the OH− groups being able to freely rotate in the cubic phase, whereas they are believed to be static in the orthorhombic phase as a result of the reduced Li motion (vide infra).13,47
m.13 This phase transition, which is clearly observed during the present study via both VT XRD and 1H and 7Li MAS NMR studies (Fig. 1 and Fig. S2, ESI†), is known to increase the Li-ion conductivity by several orders of magnitude.13,15,19 Moreover, it has been reported that the presence of cubic symmetry is a prerequisite for high ionic mobility in these materials.13 There is a strong correlation between the Li motion and OH− group rotation in Li3−xOHxCl, with the OH− groups being able to freely rotate in the cubic phase, whereas they are believed to be static in the orthorhombic phase as a result of the reduced Li motion (vide infra).13,47
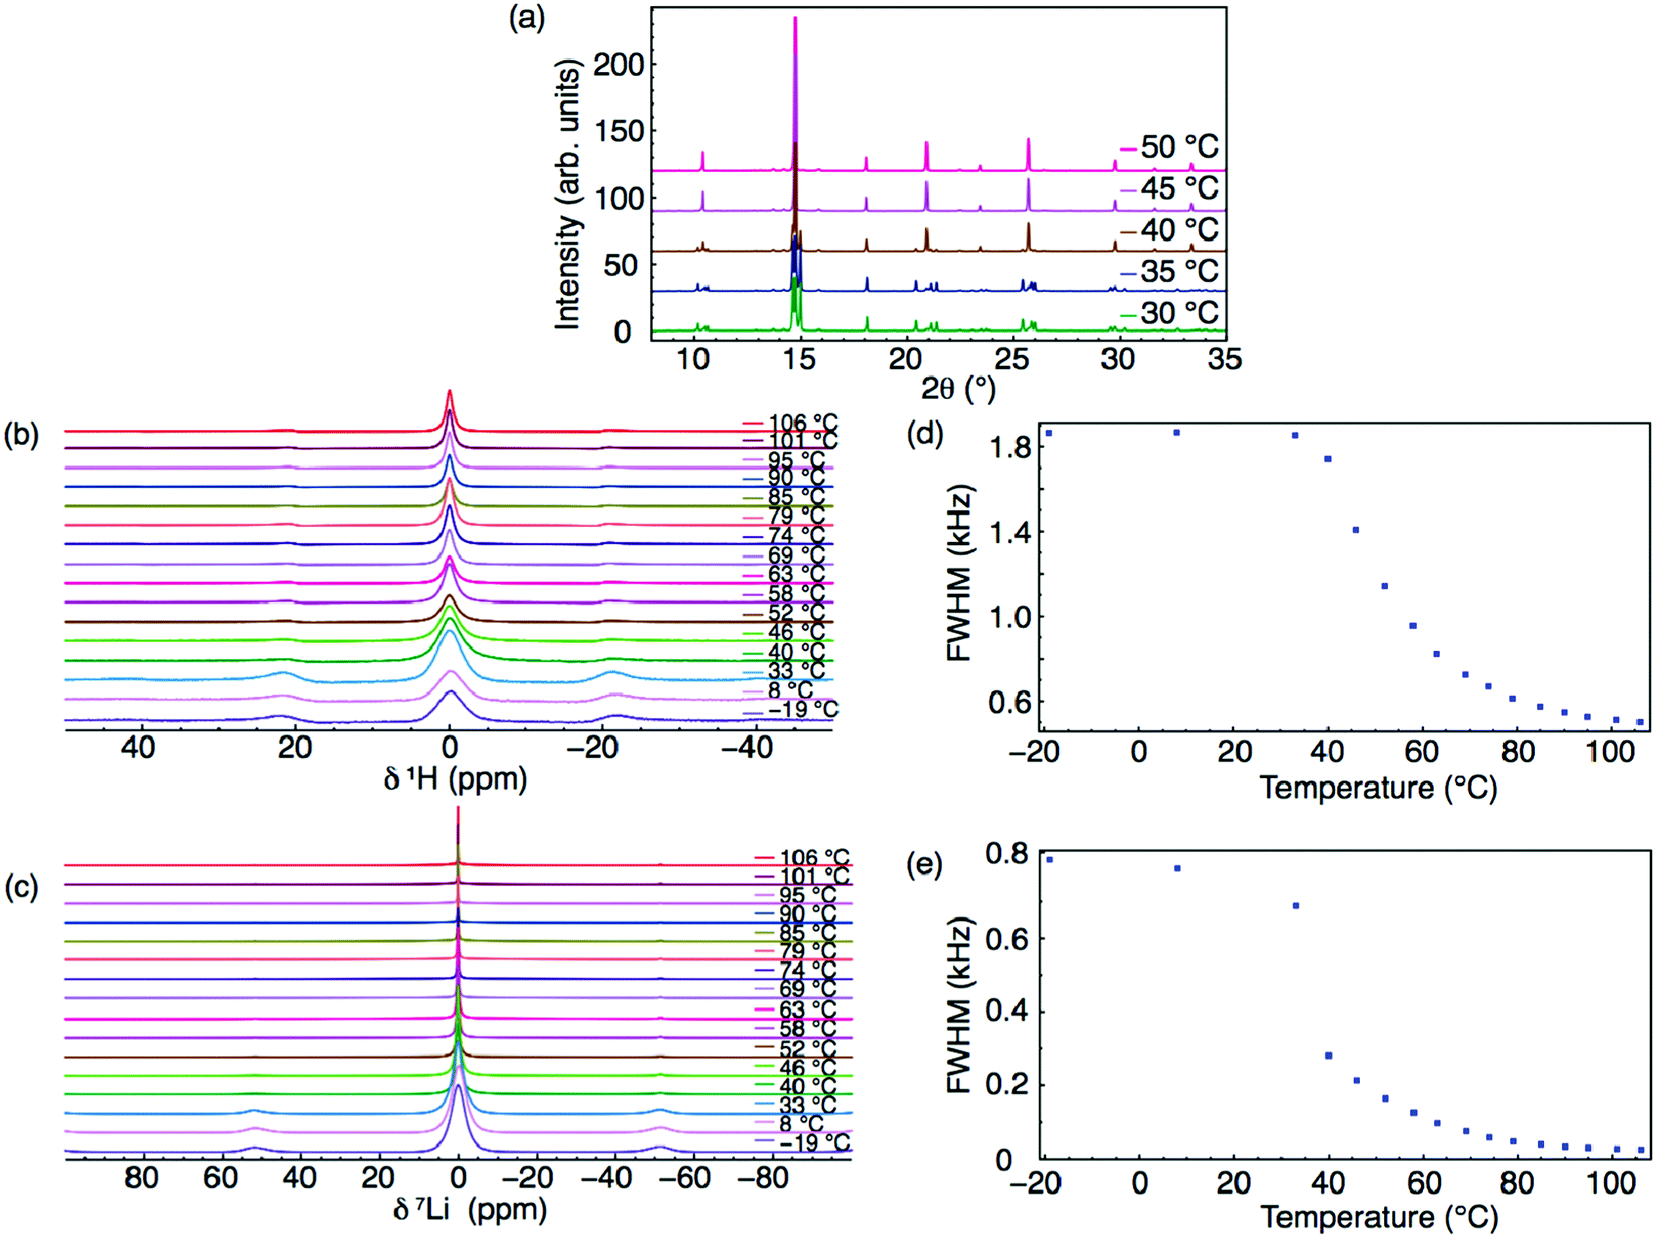 | ||
| Fig. 1 VT (a) XRD patterns and (b) 1H and (c) 7Li MAS NMR spectra acquired for Li2OHCl between −19 and 106 °C. The corresponding variation in FWHM of 1H and 7Li are shown in (d) and (e), respectively. All spectra were acquired using a MAS rate of 10 kHz. | ||
In our calculations, we find that the ground state of Li2OHCl is a tetragonal structure with all the OH− groups aligned along the a direction. It is noteworthy that a tetragonal structure was also determined for Li2.17OH0.83Cl using XRD.13 For the AIMD simulations, the cubic phase of Li2OHCl was obtained by heating the tetragonal structure to high temperature. The OH− groups are randomly orientated in the simulated cubic phase.
The tetragonal and cubic Li2OHCl structures are illustrated in Fig. 2. In the conventional perovskite structure, ABX3, the A and B sites are occupied by cations and the X site is an anion, whereas in the anti-perovskite structure, the A and B sites are occupied by anions and the X site is a cation. In Li2OHCl, the B-site oxygen ion is coordinated to four Li+ ions and one proton, while the A-site Cl− ion is coordinated to eight Li+ ions.
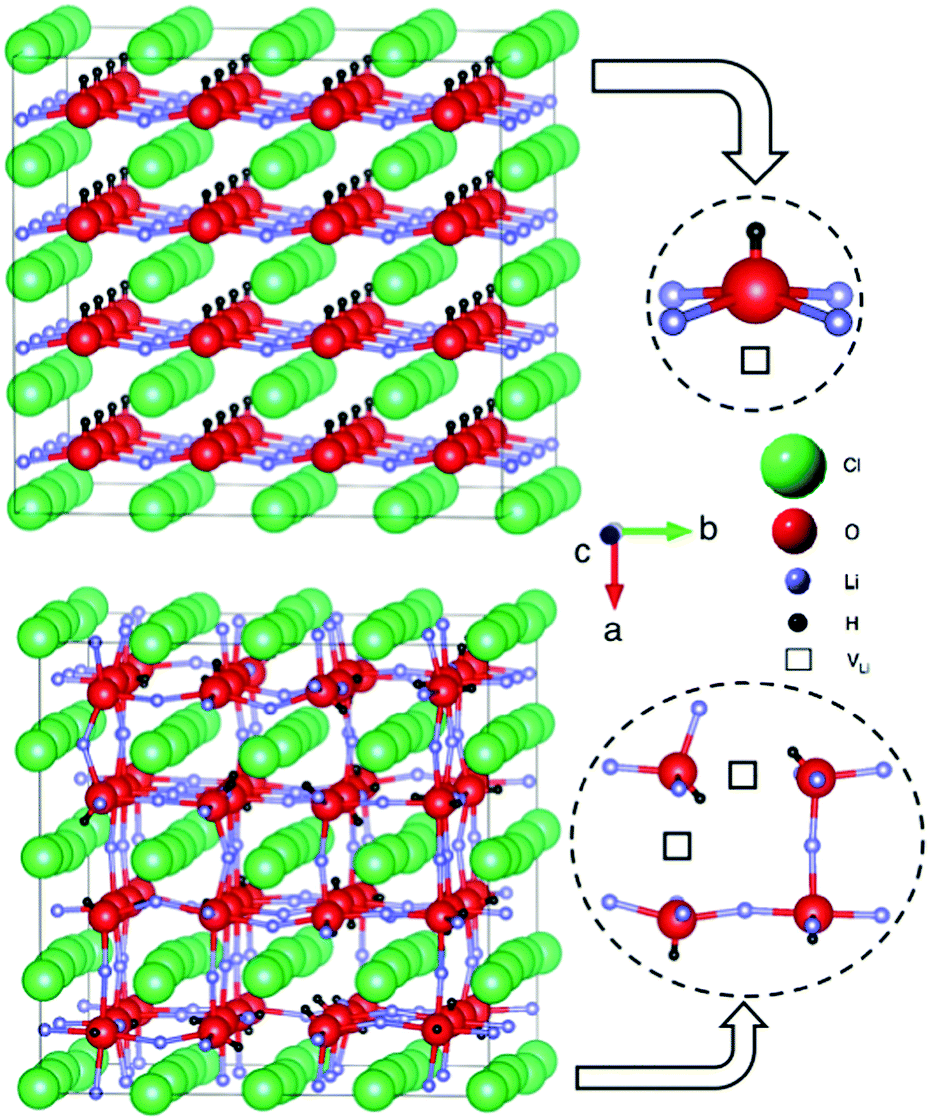 | ||
| Fig. 2 Anti-perovskite structures of (a) tetragonal and (b) cubic Li2OHCl. The local coordination environments of the oxygen ions (to Li, H and Li vacancies, VLi) are also displayed. | ||
The calculated and experimental lattice parameters of the Li3−xOHxCl compositions are given in Table 1, indicating good agreement. The results show that the lattice parameters remain mostly unaltered with increasing proton incorporation. This is also the case for the values obtained from XRD experiments. The contracted a lattice parameter of tetragonal Li2OHCl is a result of the alignment of the OH− groups along this direction, as shown in Fig. 2.
| System | Calculation (Å) | Experiment (Å) |
|---|---|---|
| Li3OCl | a = 3.847 | a = 3.90748 |
| Li2.5OH0.5Cl | a = 3.832 | a = 3.909 |
| Li2OHCl | a = 3.855 | a = 3.913 |
| Li2OHCl | a = 3.591, b = c = 3.853 | — |
Li-ion conductivity of Li3−xOHxCl
It is possible to monitor ion mobility using variable temperature solid-state NMR spectroscopy. The 1H and 7Li MAS NMR spectra obtained for Li2OHCl over the temperature range of −19–106 °C are shown in Fig. 1(b) and (c), respectively, where a single resonance is observed in each, indicating a single Li and H environment. In the VT 1H MAS NMR spectra (Fig. 1(b)), a narrowing of the lineshape is observed with increasing temperature. A corresponding plot of the full width at half maximum (FWHM) vs. temperature is shown in Fig. 1(d), which confirms a narrowing of the lineshape with increasing temperature. Between −19 and 33 °C, there is minimal change in the linewidth, suggesting the protons are static and not freely moving. As the temperature is increased to 52 °C, there is a sudden decrease in linewidth, believed to correspond to the known phase transition to the Pmm phase. There is a further, more gradual, reduction in linewidth above 52 °C, believed to indicate the movement or mobility of protons within the structure, likely rotation or free movement of the OH− groups. However, it is noted that between 33 and 52 °C, it is challenging to accurately differentiate the precise contribution of the phase transition versus the mobility of the OH− groups to the change in linewidth.
Similar line narrowing is observed in the VT 7Li NMR data (Fig. 1(c) and (e)). The phase transition from orthorhombic to cubic symmetry is clearly observed between 33 and 40 °C. Further line narrowing is observed as the temperature is increased, relating to mobile Li species within the structure. It is noted that the degree of line narrowing observed for 7Li is greater than that observed for 1H, suggesting Li has greater mobility in Li2OHCl (vide infra).
Samples in the series Li3−xOHxCl (x = 0.25, 0.5 and 0.75) were synthesised and analysed via XRD and solid-state NMR spectroscopy. The XRD patterns obtained at room temperature for each composition are shown in Fig. 3(a), where the same phase observed for Li2OHCl is also observed. The room temperature and VT 1H and 7Li MAS NMR spectra obtained for Li2.5OH0.5Cl are shown in Fig. 3(b) and (c), respectively. In each case, a single resonance is observed and, similar to Li2OHCl, there is a reduction in the linewidth with increasing temperature, again suggesting both a phase change and ion mobility. The variation in FWHM with increasing temperature for 1H and 7Li is shown in Fig. 3(d) and (e). The changes observed are similar to those observed for Li2OHCl, suggesting both protons and lithium ions are mobile at temperatures of >45 °C. Similar findings were observed for the remaining compositions in the series (see Fig. S3 and S4, ESI†). A comparison of the FWHM with changing composition is shown in Fig. S5 (ESI†). Small compositional changes appear to have little effect on the FWHM within this temperature range, as a similar reduction in linewidth is consistently observed across the series.
 | ||
| Fig. 3 (a) XRD patterns obtained for the series Li3–xOHxCl, where x = 0.25, 0.5, 0.75 and 1. VT (b) 1H and (c) 7Li MAS NMR spectra obtained for Li2.5OH0.5Cl. The corresponding variation in FWHM of 1H and 7Li for Li2.5OH0.5Cl are shown in (d) and (e), respectively. All spectra were acquired using a MAS rate of 10 kHz. | ||
Fig. 4 shows representative mean square displacement plots for the Li3−xOHxCl system at 800 K from the AIMD simulations. Several key points emerge from these plots. First, it is clear that with increasing proton concentration, there is a concomitant increase in Li-ion diffusion at this temperature. This is perhaps unsurprising given the increase in Li vacancy concentration as a result of hydration. It is well known that Li vacancies are the dominant charge carriers in the anhydrous Li3OCl material.27,28,38,45 These results reinforce the fact that there is strong correlation between Li-ion transport and proton concentration.
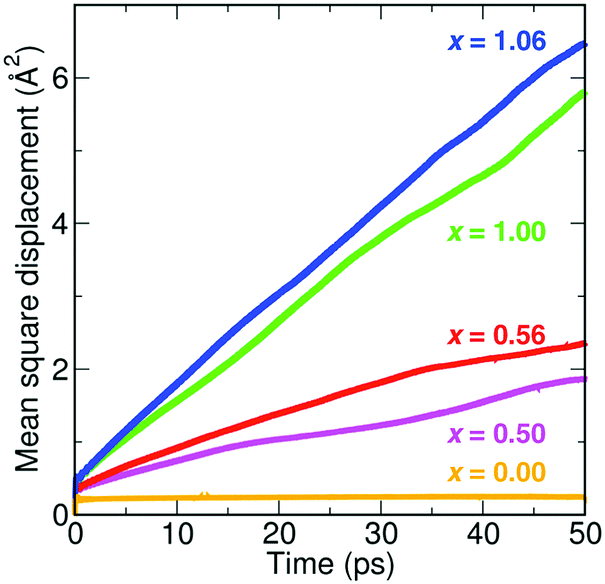 | ||
| Fig. 4 MSD plots of Li+ in five different compositions of Li3−xOHxCl at 800 K, showing higher Li-ion diffusion with increasing proton concentration. | ||
Second, the increase in Li-ion diffusion extends beyond x = 1, i.e., Li2OHCl. This indicates that the formation of water molecules at low concentrations does not hinder Li-ion transport and the increasing Li vacancy concentration still dominates. However, for large proton concentrations (x = 2), it is known experimentally that LiOH2Cl (or LiCl·H2O) is orthorhombic with space group Cmcm.13 This is indicative of Li ordering, as confirmed by single crystal XRD studies,49 and a reduction in Li-ion mobility. The poor Li-ion conductivity of LiCl·H2O was confirmed by Schwering et al.,13 with the values dropping below the levels of detection (<10−8 S cm−1) of the impedance analyser.
Third, in the Li3OCl system (x = 0), there is no Li diffusion due to the lack of Li vacancies. Disorder is usually introduced into this system via LiCl Schottky defect pairs, as found experimentally18 and computationally.38 Our calculations indicate that proton incorporation can provide an alternative mechanism for introducing disorder in the anti-perovskite material.
The self-diffusion coefficients for Li were converted into Li-ion conductivities and are presented as an Arrhenius plot in Fig. 5. The conductivity data of the four compositions can be divided into two groups. For low proton concentrations of x = 0.50 and 0.56, low activation barriers of 0.32 and 0.30 eV are obtained, respectively. For high proton concentrations of x = 1.00 and 1.06, slightly higher barriers of 0.41 and 0.42 eV, respectively, are found. It is clear that although the Li-ion conductivities of Li2OHCl and Li1.94OH1.06Cl are higher than those of Li2.5OH0.5Cl and Li2.44OH0.56Cl at high temperatures (>550 K), they are significantly lower at typical solid-state battery operating temperatures (∼270–400 K). These results suggest that compositions with small proton concentrations (x = ∼0.5) will have superior Li-ion transport properties in practical battery applications compared to compositions with high levels of protons.
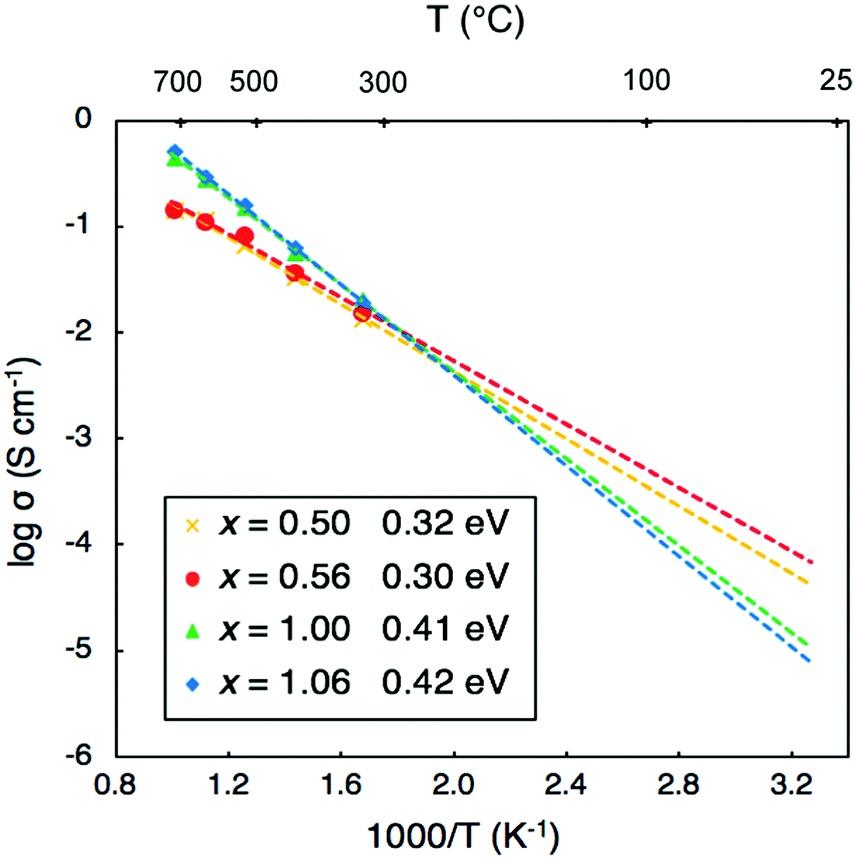 | ||
| Fig. 5 Li-ion conductivities and activation energies of Li3−xOHxCl derived from the AIMD simulations. | ||
We can compare our conductivity values to experiment by extrapolating our calculated values to lower temperatures. Hood et al.15 obtained a conductivity of ∼1 × 10⁻⁴ S cm−1 at 373 K for fast-cooled Li2OHCl, which is in excellent agreement with our extrapolated value of ∼1.7 × 10⁻⁴ S cm−1. In addition, Li et al.19 measured the Li-ion conductivity of Li2(OH)0.9F0.1Cl. They obtained a Li-ion conductivity of 1.9 × 10⁻³ S cm−1 at 373 K, which is an order of magnitude higher than that measured for Li2OHCl.15 Fluorine doping was shown to both increase the Li-ion conductivity of Li2OHCl and stabilise the cubic phase at room temperature.
Our calculated activation energy of 0.41 eV obtained for Li2OHCl is comparable to the values of 0.56 and 0.52 eV determined by Hood et al.15 and Li et al.,19 respectively, using electrochemical impedance spectroscopy. It is interesting to note that the values of 0.32 eV for Li2.5OH0.5Cl and 0.30 eV for Li2.44OH0.56Cl are similar to the initial value of 0.26 eV for Li3OCl determined by Zhao and Daemen.14 More recently, Song et al.22 reported low activation energies of 0.24–0.26 eV for Li3−xOHxCl (x = 0.3–1.0). The proposed reason for these low barriers was related to the ease with which these materials can form Schottky defects.
Lithium-ion vs. proton transport
There has been debate over whether the Li-ion conductivities from impedance measurements may include contributions from fast proton transport in these materials.19 To probe this issue, we plot the MSDs from our AIMD simulations for each element in Li2OHCl, as shown in Fig. 6. While long-range diffusion for Li is clear from the linear increase of the MSD with time, this is not the case for proton transport as the proton MSD begins to flatten out before the end of the simulation time. In addition, the proton MSD never exceeds 2 Å2, which is far below the O–O distance of 3.91 Å in Li2OHCl.13 This suggests that proton transport via the Grotthuss mechanism,50,51 which is found in proton-conducting solid–oxide materials, does not occur in Li2OHCl.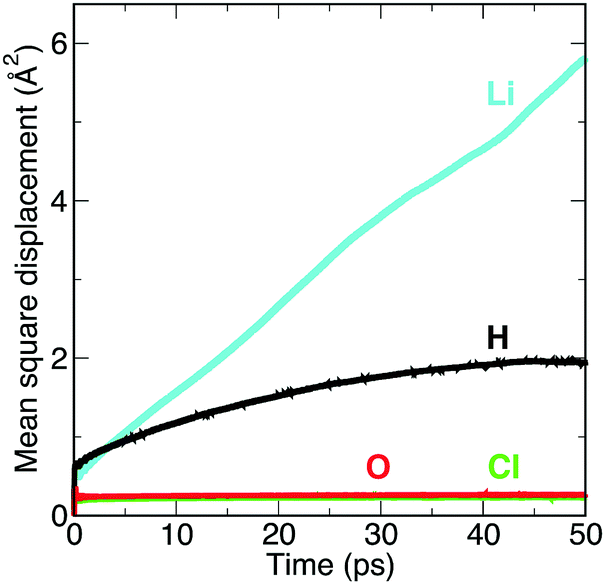 | ||
| Fig. 6 MSD plots for each element in Li2OHCl at 800 K. | ||
To gain further insight into proton and Li mobility within Li2OHCl, 1H and 7Li T1 values were measured and are shown in Fig. 7. It is noted that to determine 7Li T1 values, static 7Li NMR experiments were completed over a wider temperature window, namely, −65 to 230 °C. The corresponding spectra are shown in Fig. 7(a). Below room temperature, the static 7Li NMR spectra exhibit the lineshape expected for a spin 3/2 nucleus, i.e., a dipolar broadened lineshape at ∼0 ppm, corresponding to the central transition (+1/2 ↔ −1/2). A broad resonance is also observed, corresponding to the satellite transitions (3/2 ↔ 1/2 and −1/2 ↔ −3/2). Broadening of the central transition is due to strong 7Li–7Li homonuclear dipolar interactions that are averaged out as the temperature is increased. This is due to greater Li+ ion mobility and results in motional narrowing of the NMR linewidths.
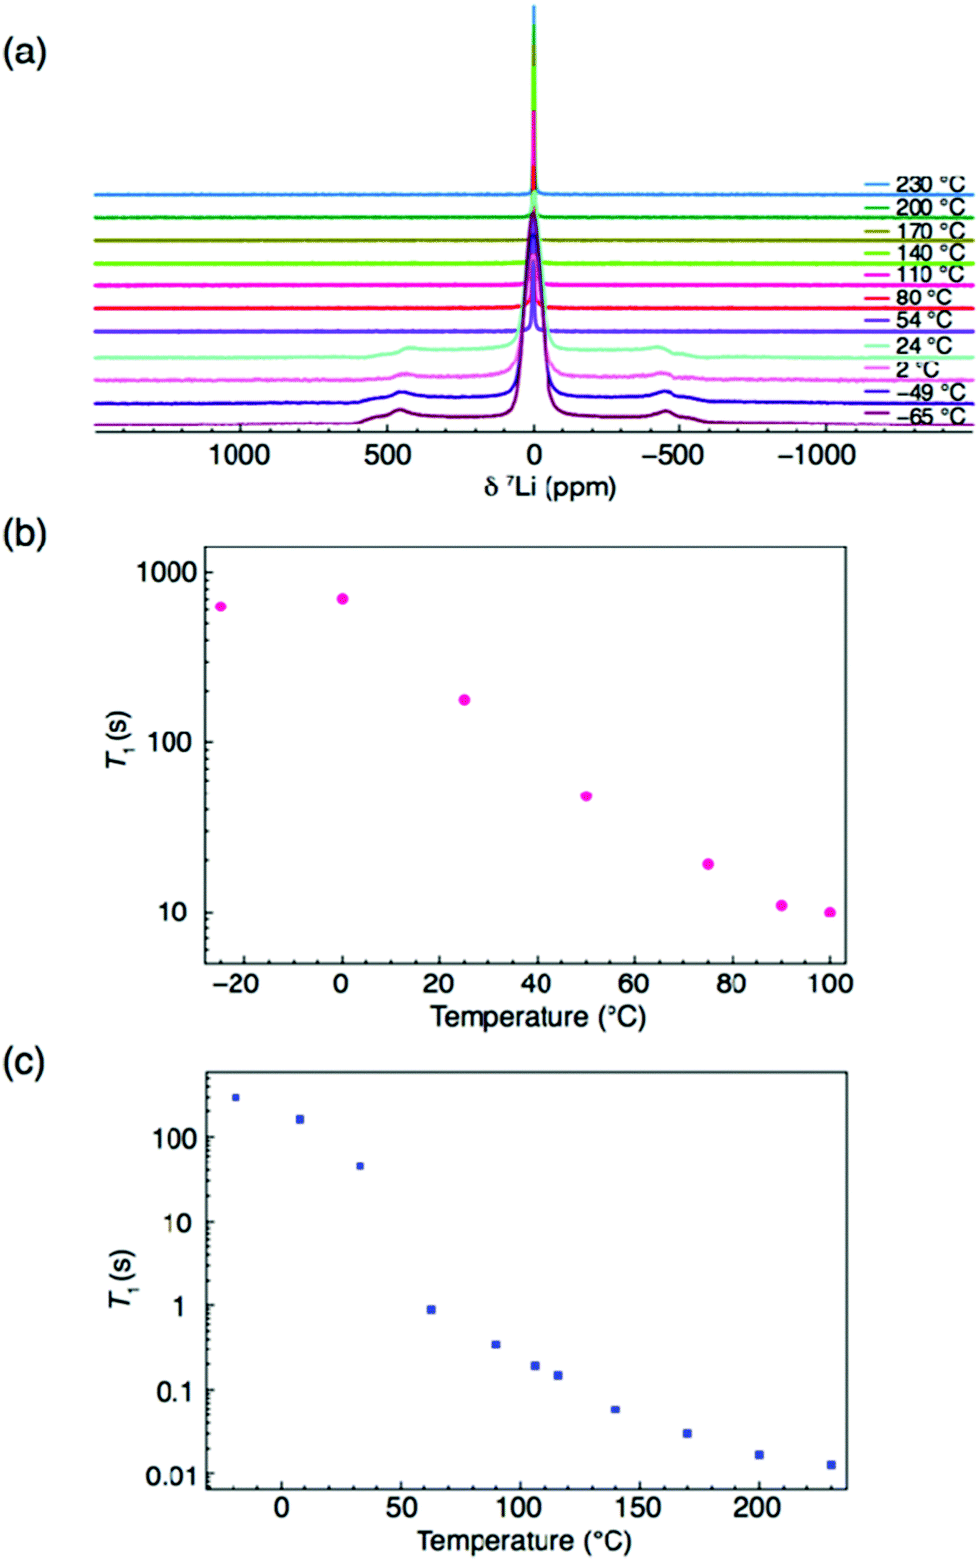 | ||
| Fig. 7 NMR spectra for Li2OHCl. (a) Static VT 7Li NMR spectra between −65 and 230 °C. Also shown in (b) and (c) are the 1H and 7Li T1 values. | ||
All spectra obtained at temperatures >54 °C exhibit a single sharp resonance, corresponding to the cubic phase of Li2OHCl. The corresponding FWHM plot vs. temperature is shown in Fig. S6 (ESI†), which confirms the phase transition occurring between 24 and 54 °C. Between 54 and 230 °C, there is a gradual reduction in the linewidth, indicative of Li ion mobility. The T1 values obtained (Fig. 7(b) and (c)) appear to indicate that Li is the more mobile species. In both cases, a rapid change in T1 is observed between 0 and ∼60 °C, believed to correspond to the expected phase change from orthorhombic to cubic symmetry. A more gradual change in 1H T1 is then observed between 70 and 100 °C, where the value is on the order of seconds. This is in contrast to the 7Li T1 measurements, where there is a gradual, but significant change between 90 and 230 °C, where the value of T1 is 0.01 s. It is noted that only a limited temperature range could be studied for 1H based on current hardware limitations. However, comparing the 1H and 7Li T1 values at 100 °C, there is an order of magnitude difference in the value of T1. Such values of T1 suggest high Li mobility in Li2OHCl and limited proton mobility.
Based on the current data it is likely that the protons are only locally mobile, i.e., rotating or flipping around a localised point, whereas the Li can move freely throughout the structure. In good agreement with our ab initio simulations, these NMR results indicate that any conductivity within Li2OHCl will be due to movement of the Li ions. Li-ion diffusion and limited proton mobility were further confirmed via PFG-NMR experiments, where the Li diffusion coefficient, DLi, was determined to be ∼6 × 10⁻⁹ cm2 s−1 at 373 K. Full details are given in the ESI.† This value is in excellent agreement with our ab initio MD calculated value of ∼3 × 10⁻⁹ cm2 s−1 extrapolated at 373 K.
To further investigate the local behaviour and mobility of the OH− groups, a sample of Li2OHCl was deuterated and studied using 2H solid-state NMR. Variable-temperature 2H MAS NMR data was acquired for Li2ODCl at −19, 33, 63, 69, 95 and 110 °C (Fig. 8) and static 2H NMR data was acquired at −19, 69 and 110 °C (Fig. S12, ESI†). In both cases, between −19 and 63 °C a classic, axially symmetric lineshape (MAS) and powder pattern (static) are obtained, indicative of the absence of motion and, hence, static OH−/OD− groups. The MAS lineshape was simulated and fitted (Fig. S13, ESI†) to obtain the quadrupolar NMR parameters, CQ = 259(1) kHz and ηQ = 0.0(1), which are in good agreement with those commonly reported for static 2H environments.52 The known phase transition from orthorhombic to cubic symmetry occurs at ∼35–40 °C. The 2H NMR data presented indicates that even at 63 °C, when Li2ODCl is known to be in the cubic phase, the OH−/OD− groups are still static, indicating that even though the phase transition has occurred, the OH−/OD− groups are not yet mobile. Hence, the phase transition alone is not responsible for mobility of the OH−/OD− groups.
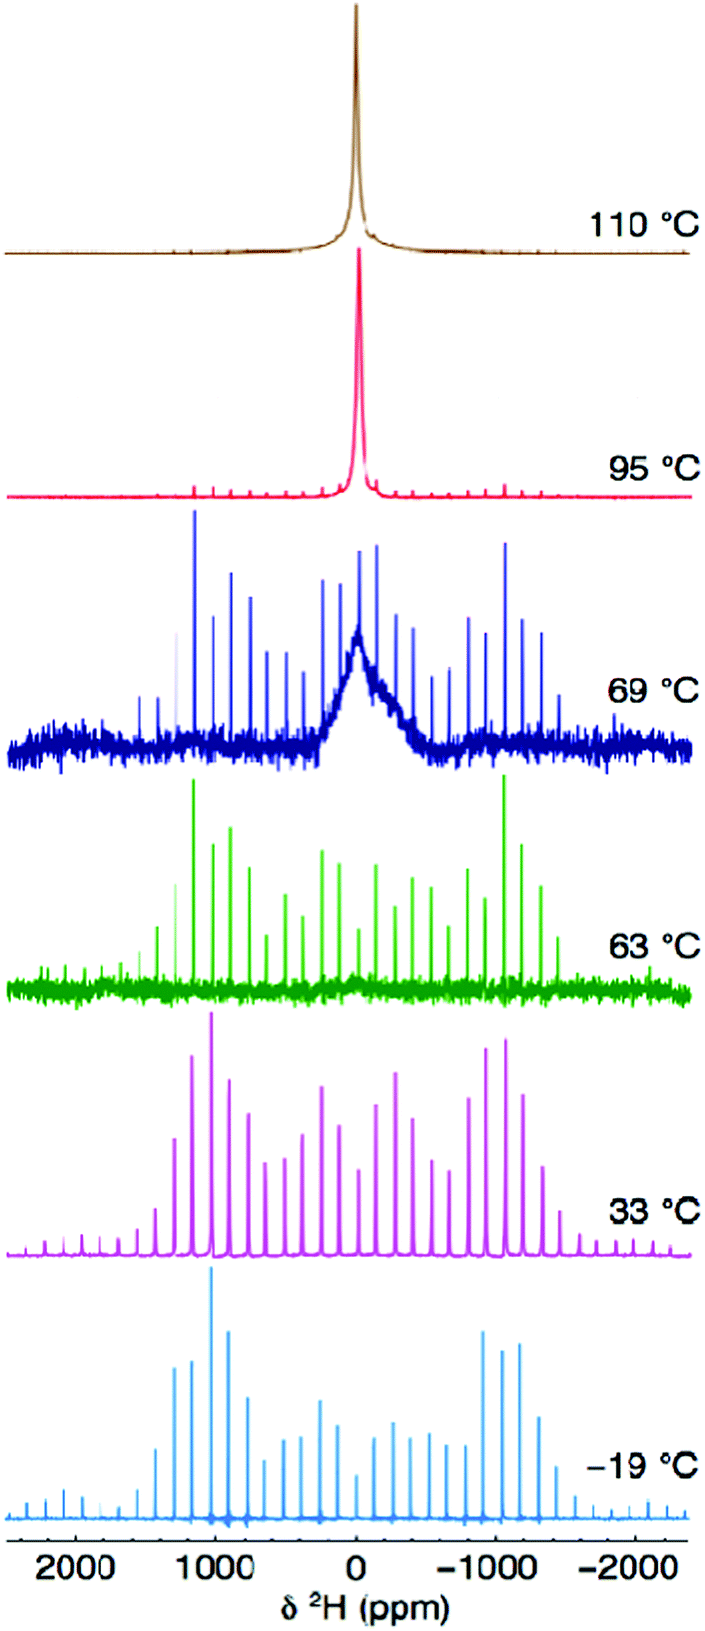 | ||
| Fig. 8 Variable-temperature 2H MAS NMR spectra acquired for Li2ODCl at −19, 33, 63, 69, 95 and 110 °C. The MAS rate was 10 kHz. | ||
At 69 °C, there is an obvious change in the appearance of the 2H MAS NMR spectrum (Fig. 8). The spectrum contains both a broad resonance and the axially symmetric lineshape previously observed at low temperatures. This suggests a change in the mobility of the OH−/OD− groups at this temperature and the presence of two different OH−/OD− environments simultaneously, i.e., both static and mobile OH−/OD− groups. As the temperature is increased to 95 and 110 °C, a single, relatively broad resonance is observed, confirming mobility of the OH−/OD− groups.
It is well documented that for fast moving deuterons, a single, sharp “solution-like” lineshape (e.g., 20 Hz), with very high intensity, will be observed in the 2H MAS NMR spectrum, owing to complete averaging of the quadrupolar tensor.53 Such a sharp, narrow resonance is characteristic of a deuteron dissociating and being able to move freely throughout the structure.52,53 Here, however, the linewidth of the resonance is still relatively large (ca. 2.7 kHz), suggesting movement of the OD− group rather than that of a free deuteron, i.e., rotation of the H/D around the oxygen (vide infra). It is also noted that at high temperatures (95 and 110 °C) the manifold of spinning sidebands remains (albeit at very low intensities), indicating the presence of static OH−/OD− groups. Hence, two different OH−/OD− environments are always present in the cubic phase of Li2ODCl, both static and locally rotating OH−/OD− groups (vide infra).
Coupling these findings with our 1H and 7Li NMR data, we believe that mobility of the Li ions in Li2ODCl is intimately connected to the position of the OH−/OD− groups within the structure. Based on both the experimental and computational data presented, we believe that the change from orthorhombic to cubic symmetry alone is not sufficient to increase the ionic conductivity of Li2OHCl. Our AIMD calculations indicate that, in the cubic phase, the OH−/OD− groups point towards a Li vacancy and as the temperature is increased, the Li ions become mobile, starting to ‘hop’ into the Li vacancies and moving through the structure. As the temperature is increased further, the Li ions start to hop at a faster rate. Since the OH−/OD− groups point directly towards a Li vacancy, the movement of the Li ions will directly influence the position of the OH−/OD− groups, i.e., when a Li vacancy is filled, the H/D will rotate around the oxygen, repositioning itself so that it is always pointing towards a vacancy, as it will therefore have the greatest degree of freedom and movement. Essentially, whatever the position of a Li vacancy, the OH−/OD− groups will reorient themselves to ensure they always point in the direction of a vacancy, as illustrated in Fig. 9.
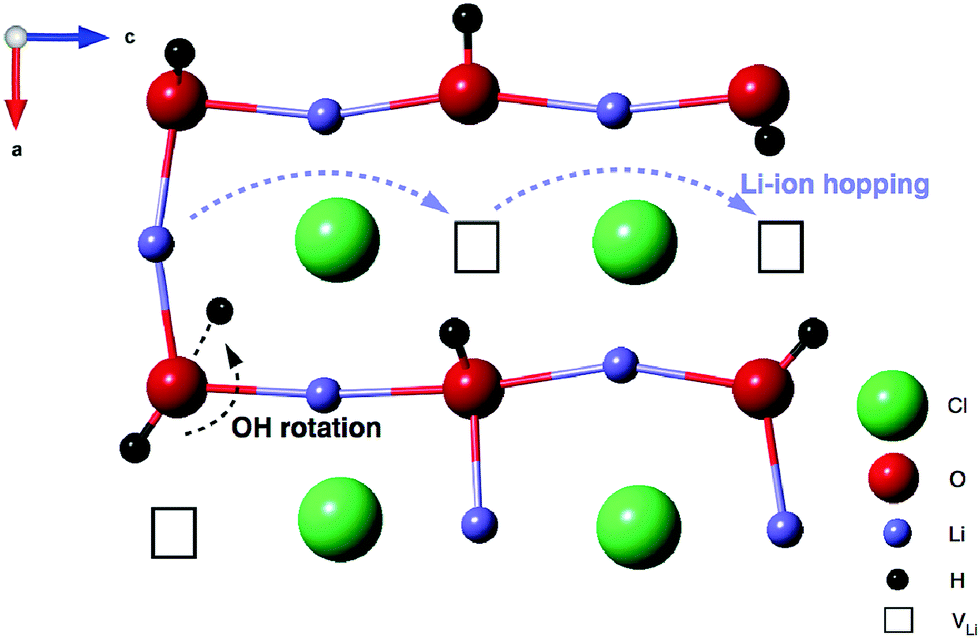 | ||
| Fig. 9 Schematic representation of the Li-ion hopping mechanism in the cubic Pmm phase of Li2OHCl. The OH− groups point towards Li vacancies. Li-ion hopping occurs via these vacancies, denoted by the blue dashed arrows. Rotation of the OH− groups occurs as a result of a nearby Li ion hopping to an adjacent site, denoted by the black dashed arrow. | ||
Interestingly, in our AIMD calculations, there are O atoms coordinated to different numbers of Li ions, namely, three, four or five. For oxygen atoms coordinated to three Li ions, the proton movement is faster as it has more space to rotate into (because there are effectively three vacant sites). Conversely, for the O atoms coordinated to five Li ions, the movement is more restricted and hence the OH− groups are limited in the spaces they can rotate into. Hence, the presence of multiple coordination environments in the supercell calculations correlates well with the 2H NMR findings, and the presence of both static and mobile OH−/OD− groups.
We also produce diffusion density maps from our AIMD simulations for Li and H in Li2OHCl, given in Fig. 10, which are a sum of all the trajectories of these species accumulated over the length of the simulation. It can be seen for both Li and H that the largest densities are located around the corresponding crystallographic sites with considerable local oscillation. Moreover, significant Li-ion diffusion occurs via a vacancy mechanism, in which Li+ ions diffuse to adjacent vacant sites both diagonally and laterally to create long-range diffusion pathways. For Li3OCl, we find significant Li-ion densities along the edges of the oxygen octahedra (shown in Fig. 10), which is indicative of the favourable migration pathways along these pathways, as found previously.28
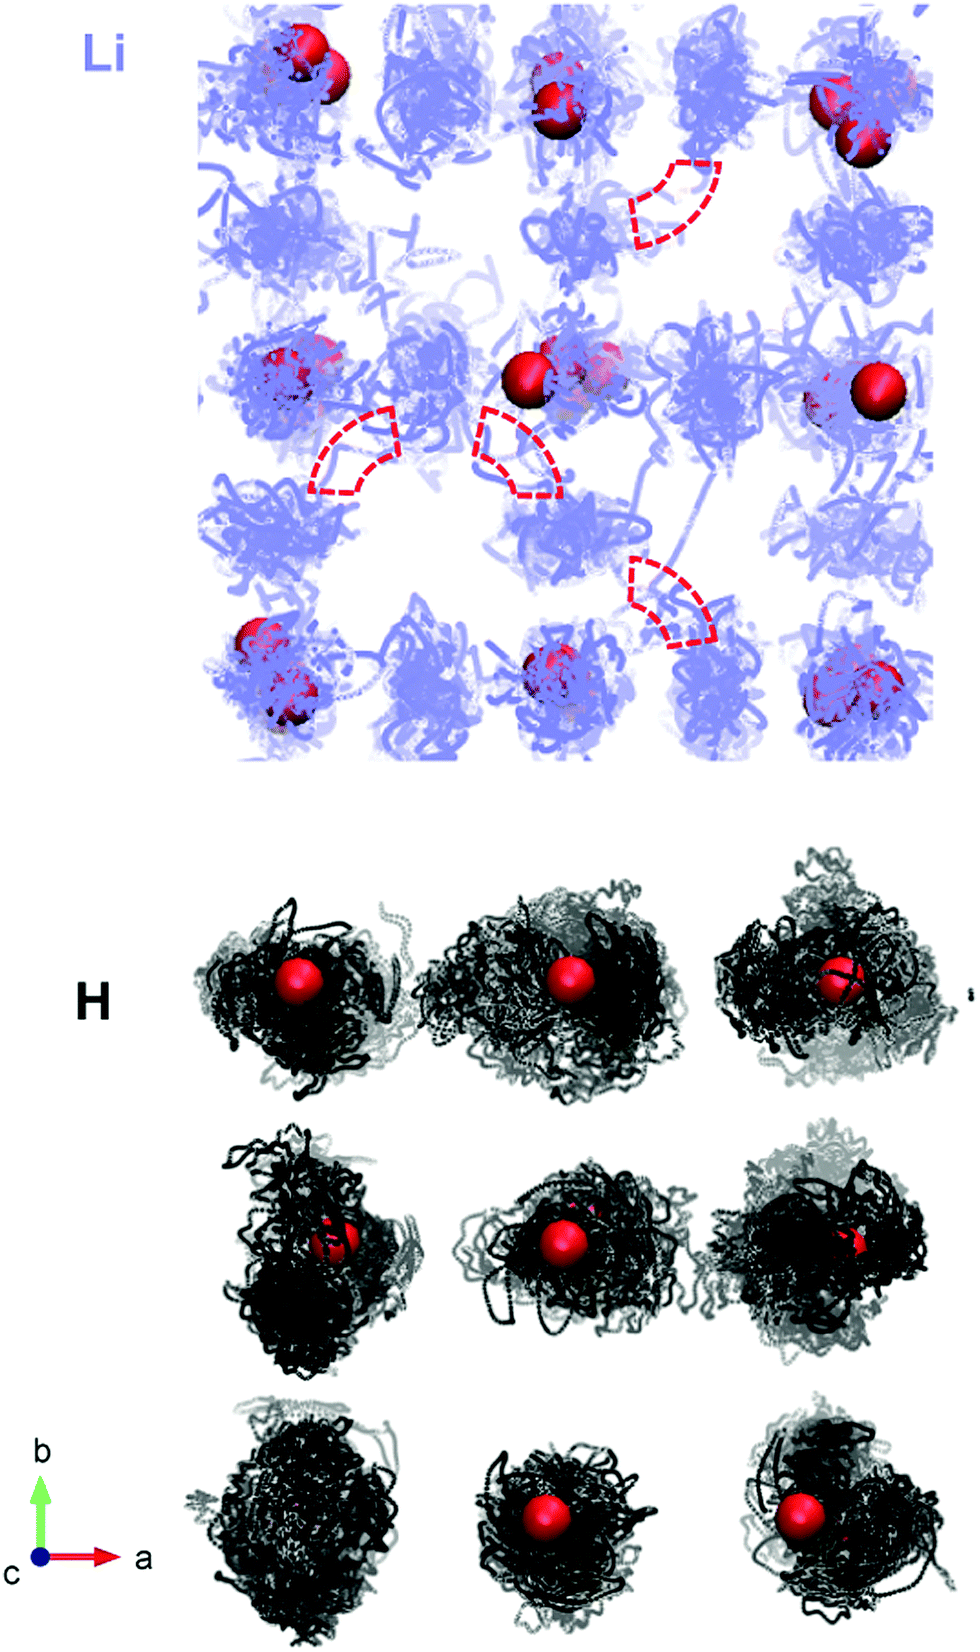 | ||
| Fig. 10 Density plots of trajectories for lithium ions (blue) and protons (black) in Li2OHCl at 800 K. Oxygen positions are given in red. Chlorine ions are omitted for clarity. Examples of local Li-ion jumps are highlighted with red dashed lines. | ||
In contrast, there are no long-range proton diffusion pathways, with only O–H rotational motion. This is perhaps unsurprising when we consider the O–O distance of 3.91 Å in these materials compared to proton-conducting perovskite oxides, such as BaZrO3 (with an O–O separation of 2.97 Å).54 Clearly, the large O–O distances in these anti-perovskite systems will inhibit significant proton hopping transport.
The important relationship between the Li-ion transport mechanism and O–H rotation in these systems has been recently reported by Song et al.22 and Howard et al.21 It was reported that short and fast rotating O–H bonds provide extra space that facilitates the formation of Frenkel defects, which are crucial in achieving fast, correlated Li-ion transport in these materials.22
Our simulation findings (Fig. 10) are in good agreement with the VT 1H and 7Li NMR data presented in Fig. 1, 7 and 8. As the temperature is increased, line narrowing is observed in both the 1H and 7Li NMR data. Hence, both the H and Li are, to some extent, mobile within the system. However, the changes observed in both the 1H T1 values and the FWHM indicate that the protons are not as mobile as the Li. Higher 1H T1 values and reduced line narrowing indicate proton mobility is limited to rotation of the OH− groups. This is further validated by the 2H MAS NMR data.
Conclusions
Through an effective combination of ab initio molecular dynamics simulations and variable-temperature 1H, 2H and 7Li MAS NMR spectroscopy, we have elucidated lithium-ion and proton transport mechanisms in the Li3−xOHxCl solid electrolyte system. First, we report a high exothermic hydration enthalpy for Li3OCl, which explains the ease with which this material absorbs moisture and the difficulty in synthesising moisture-free samples.Second, we show that Li-ion transport is highly correlated with the proton concentration and Li-ion vacancy levels. Our calculations show long-range 3D diffusion of Li ions, but proton hopping is restricted as a result of the large separation between oxygen ions (∼4 Å). There is excellent agreement between our calculated Li diffusion coefficient of the order 10−9 cm2 s−1 at 373 K and the value obtained from PFG-NMR measurements. Furthermore, proton incorporation can be used as a strategy for inducing disorder into the solid electrolyte systems and as a possible route to optimising the Li-ion conductivity.
Finally, these findings are supported by variable temperature 1H, 2H and 7Li MAS NMR data, which indicate that proton movement is limited to rotation of the OH− groups and that Li-ion mobility is long range. The presence of both static and locally mobile OH− groups in the cubic phase of Li2OHCl was confirmed using 2H NMR. Both the simulations and NMR experiments show that the protons point towards Li vacancy sites and that there is a strong correlation between long-range Li-ion transport and OH− rotation.
Given the recent surge of interest in Li-rich anti-perovskite materials for solid electrolytes, atomic-scale studies of ionic conduction in the hydrated anti-perovskites are timely. The results presented here suggest that the Li3−xOHxCl system is an excellent candidate electrolyte for all-solid-state batteries.
Conflicts of interest
There are no conflicts to declare.Acknowledgements
We gratefully acknowledge support from the EPSRC Supergen Energy Storage Hub (EP/H019596), the EPSRC Programme Grant “Enabling next generation lithium batteries” (EP/M0009521/1), The Royal Society (RG170123) and the Archer HPC facility through the Materials Chemistry Consortium (EP/L000202/1). KEJ and TSA would also like to thank Dr David Apperley for experimental assistance.References
- J. Janek and W. G. Zeier, Nat. Energy, 2016, 1, 16141 CrossRef.
- J. C. Bachman, S. Muy, A. Grimaud, H.-H. Chang, N. Pour, S. F. Lux, O. Paschos, F. Maglia, S. Lupart, P. Lamp, L. Giordano and Y. Shao-Horn, Chem. Rev., 2016, 116, 140–162 CrossRef PubMed.
- A. Manthiram, X. Yu and S. Wang, Nat. Rev. Mater., 2017, 2, 16103 CrossRef.
- D. Lin, Y. Liu and Y. Cui, Nat. Nanotechnol., 2017, 12, 194–206 CrossRef PubMed.
- Y. Wang, W. D. Richards, S. P. Ong, L. J. Miara, J. C. Kim, Y. Mo and G. Ceder, Nat. Mater., 2015, 14, 1026–1031 CrossRef PubMed.
- Y. Guo, H. Li and T. Zhai, Adv. Mater., 2017, 29, 1700007 CrossRef PubMed.
- V. Thangadurai, H. Kaack and W. J. F. Weppner, J. Am. Ceram. Soc., 2003, 86, 437–440 CrossRef.
- R. Murugan, V. Thangadurai and W. Weppner, Angew. Chem., Int. Ed., 2007, 46, 7778–7781 CrossRef PubMed.
- P. G. Bruce and A. R. West, J. Electrochem. Soc., 1983, 130, 662–669 CrossRef.
- R. Kanno, T. Hata, Y. Kawamoto and M. Irie, Solid State Ionics, 2000, 130, 97–104 CrossRef.
- S. Stramare, V. Thangadurai and W. Weppner, Chem. Mater., 2003, 15, 3974–3990 CrossRef.
- P. Hartwig, A. Rabenau and W. Weppner, J. Less-Common Met., 1981, 78, 227–233 CrossRef.
- G. Schwering, A. Hönnerscheid, L. van Wüllen and M. Jansen, ChemPhysChem, 2003, 4, 343–348 CrossRef PubMed.
- Y. Zhao and L. L. Daemen, J. Am. Chem. Soc., 2012, 134, 15042–15047 CrossRef PubMed.
- Z. D. Hood, H. Wang, A. Samuthira Pandian, J. K. Keum and C. Liang, J. Am. Chem. Soc., 2016, 138, 1768–1771 CrossRef PubMed.
- S. Li, J. Zhu, Y. Wang, J. W. Howard, X. Lü, Y. Li, R. S. Kumar, L. Wang, L. L. Daemen and Y. Zhao, Solid State Ionics, 2016, 284, 14–19 CrossRef.
- X. Lu, G. Wu, J. W. Howard, A. Chen, Y. Zhao, L. L. Daemen and Q. Jia, Chem. Commun., 2014, 50, 11520–11522 RSC.
- X. Lü, J. W. Howard, A. Chen, J. Zhu, S. Li, G. Wu, P. Dowden, H. Xu, Y. Zhao and Q. Jia, Adv. Sci., 2016, 3, 1500359 CrossRef PubMed.
- Y. Li, W. Zhou, S. Xin, S. Li, J. Zhu, X. Lü, Z. Cui, Q. Jia, J. Zhou, Y. Zhao and J. B. Goodenough, Angew. Chem., Int. Ed., 2016, 55, 9965–9968 CrossRef PubMed.
- J. A. Dawson, P. Canepa, T. Famprikis, C. Masquelier and M. S. Islam, J. Am. Chem. Soc., 2018, 140, 362–368 CrossRef PubMed.
- J. Howard, Z. D. Hood and N. A. W. Holzwarth, Phys. Rev. Mater., 2017, 1, 75406 CrossRef.
- A.-Y. Song, Y. Xiao, K. Turcheniuk, P. Upadhya, A. Ramanujapuram, J. Benson, A. Magasinski, M. Olguin, L. Meda, O. Borodin and G. Yushin, Adv. Energy Mater., 2017, 8, 1700971 CrossRef.
- M. Wu, B. Xu, X. Lei, K. Huang and C. Ouyang, J. Mater. Chem. A, 2018, 6, 1150–1160 RSC.
- A. K. Sagotra, D. Errandonea and C. Cazorla, Nat. Commun., 2017, 8, 963 CrossRef PubMed.
- A. K. Sagotra and C. Cazorla, ACS Appl. Mater. Interfaces, 2017, 9, 38773–38783 CrossRef PubMed.
- Z. Deng, B. Radhakrishnan and S. P. Ong, Chem. Mater., 2015, 27, 3749–3755 CrossRef.
- S. Stegmaier, J. Voss, K. Reuter and A. C. Luntz, Chem. Mater., 2017, 29, 4330–4340 CrossRef.
- R. Mouta, M. Á. B. Melo, E. M. Diniz and C. W. A. Paschoal, Chem. Mater., 2014, 26, 7137–7144 CrossRef.
- G. Kresse and J. Furthmüller, Phys. Rev. B: Condens. Matter Mater. Phys., 1996, 54, 11169–11186 CrossRef.
- J. P. Perdew, A. Ruzsinszky, G. I. Csonka, O. A. Vydrov, G. E. Scuseria, L. A. Constantin, X. Zhou and K. Burke, Phys. Rev. Lett., 2008, 100, 136406 CrossRef PubMed.
- B. J. Morgan and P. A. Madden, Phys. Rev. B: Condens. Matter Mater. Phys., 2012, 86, 35147 CrossRef.
- T. Baba and Y. Kawamura, Front. Energy Res., 2016, 4, 22 Search PubMed.
- J. A. Dawson, A. J. Naylor, C. Eames, M. Roberts, W. Zhang, H. J. Snaith, P. G. Bruce and M. S. Islam, ACS Energy Lett., 2017, 2, 1818–1824 CrossRef.
- D. J. Evans and B. L. Holian, J. Chem. Phys., 1985, 83, 4069–4074 CrossRef.
- L. J. Miara, S. P. Ong, Y. Mo, W. D. Richards, Y. Park, J.-M. Lee, H. S. Lee and G. Ceder, Chem. Mater., 2013, 25, 3048–3055 CrossRef.
- R. Xiao, H. Li and L. Chen, Sci. Rep., 2015, 5, 14227 CrossRef PubMed.
- C. Yu, S. Ganapathy, N. J. J. de Klerk, I. Roslon, E. R. H. van Eck, A. P. M. Kentgens and M. Wagemaker, J. Am. Chem. Soc., 2016, 138, 11192–11201 CrossRef PubMed.
- Z. Lu, C. Chen, Z. M. Baiyee, X. Chen, C. Niu and F. Ciucci, Phys. Chem. Chem. Phys., 2015, 17, 32547–32555 RSC.
- A. R. Armstrong, C. Lyness, P. M. Panchmatia, M. S. Islam and P. G. Bruce, Nat. Mater., 2011, 10, 223–229 CrossRef PubMed.
- R. Tripathi, S. M. Wood, M. S. Islam and L. F. Nazar, Energy Environ. Sci., 2013, 6, 2257–2264 RSC.
- D. A. Tompsett, S. C. Parker and M. S. Islam, J. Am. Chem. Soc., 2014, 136, 1418–1426 CrossRef PubMed.
- Y. Deng, C. Eames, J.-N. Chotard, F. Lalère, V. Seznec, S. Emge, O. Pecher, C. P. Grey, C. Masquelier and M. S. Islam, J. Am. Chem. Soc., 2015, 137, 9136–9145 CrossRef PubMed.
- J. A. Dawson and J. Robertson, J. Phys. Chem. C, 2016, 120, 22910–22917 CrossRef.
- P. Canepa, J. A. Dawson, G. Sai Gautam, J. M. Statham, S. C. Parker and M. S. Islam, Chem. Mater., 2018, 30, 3019–3027 CrossRef.
- A. Emly, E. Kioupakis and A. Van der Ven, Chem. Mater., 2013, 25, 4663–4670 CrossRef.
- M.-H. Chen, A. Emly and A. Van der Ven, Phys. Rev. B: Condens. Matter Mater. Phys., 2015, 91, 214306 CrossRef.
- C. Eilbracht, W. Kockelmann, D. Hohlwein and H. Jacobs, Phys. B, 1997, 234, 48–50 CrossRef.
- O. Reckeweg, B. Blaschkowski and T. Schleid, Z. Anorg. Allg. Chem., 2012, 638, 2081–2086 CrossRef.
- A. Hönnerscheid, J. Nuss, C. Mühle and M. Jansen, Z. Anorg. Allg. Chem., 2003, 629, 312–316 CrossRef.
- N. Agmon, Chem. Phys. Lett., 1995, 244, 456 CrossRef.
- P. Knauth and M. L. Di Vona, Solid State Proton Conductors: Properties and Applications in Fuel Cells, Wiley & Sons Ltd, 2012 Search PubMed.
- L. A. O’Dell and C. I. Ratcliffe, in NMR of Quadrupolar Nuclei in Solid Materials, ed. R. E. Wasylishen, S. E. Ashbrook and S. Wimperis, Wiley & Sons Ltd, Chichester, 2012, ch. 14, pp. 213–232 Search PubMed.
- G. Kim, F. Blanc, Y.-Y. Hu and C. P. Grey, J. Phys. Chem. C, 2013, 117, 6504–6515 CrossRef.
- J. A. Dawson, J. A. Miller and I. Tanaka, Chem. Mater., 2015, 27, 901–908 CrossRef.
Footnote |
| † Electronic supplementary information (ESI) available. See DOI: 10.1039/c8ee00779a |
| This journal is © The Royal Society of Chemistry 2018 |