 Open Access Article
Creative Commons Attribution 3.0 Unported Licence
The modular synthesis of rare earth-transition metal heterobimetallic complexes utilizing a redox-active ligand†
James R.
Hickson
ab,
Samuel J.
Horsewill
a,
Christopher
Bamforth
a,
Jake
McGuire
 a,
Claire
Wilson
 a,
Stephen
Sproules
 a and
Joy H.
Farnaby
 *a
*a
aSchool of Chemistry, WestCHEM, University of Glasgow, Glasgow, UK. E-mail: Joy.Farnaby@glasgow.ac.uk
bDepartment of Chemistry, Imperial College London, South Kensington, London, UK
First published on 6th June 2018
Abstract
We report a robust and modular synthetic route to heterometallic rare earth-transition metal complexes. We have used the redox-active bridging ligand 1,10-phenathroline-5,6-dione (pd), which has selective N,N′ or O,O′ binding sites as the template for this synthetic route. The coordination complexes [Ln(hfac)3(N,N’-pd)] (Ln = Y [1], Gd [2]; hfac = hexafluoroacetylacetonate) were synthesised in high yield. These complexes have been fully characterised using a range of spectroscopic techniques. Solid state molecular structures of 1 and 2 have been determined by X-ray crystallography and display different pd binding modes in coordinating and non-coordinating solvents. Complexes 1 and 2 are unusually highly coloured in coordinating solvents, for example the vis-NIR spectrum of 1 in acetonitrile displays an electronic transition centred at 587 nm with an extinction coefficient consistent with significant charge transfer. The reaction between 1 and 2 and VCp2 or VCpt2 (Cpt = tetramethylcyclopentadienyl) resulted in the isolation of the heterobimetallic complexes, [Ln(hfac)3(N,N′-O,O′-pd)VCp2] (Ln = Y [3], Gd [4]) or [Ln(hfac)3(N,N′-O,O′-pd)VCpt2] (Ln = Y [5], Gd [6]). The solid state molecular structures of 3, 5 and 6 have been determined by X-ray crystallography. The spectroscopic data on 3–6 are consistent with oxidation of V(II) to V(IV) and reduction of pd to pd2− in the heterobimetallic complexes. The spin-Hamiltonian parameters from low temperature X-band EPR spectroscopy of 3 and 5 describe a 2A1 ground state, with a V(IV) centre. DFT calculations on 3 are in good agreement with experimental data and confirm the SOMO as the dx2−y2 orbital localised on vanadium.
Introduction
The cooperativity between metal centres in multimetallic complexes, clusters and polymeric species gives rise to very remarkable chemistry in a diverse range of fields.1 The potential applications of complexes containing both transition metals and lanthanides are significant. In particular there is research interest in the design of rare earth-transition metal single-molecule magnets (SMM) and catalysts.2,3The chemistry of multimetallic complexes containing f-elements is significantly less well developed than that of transition metals. This is attributable to the fact that the directed synthesis of f–d complexes is non-trivial. The inspiration for our approach was the Tb analogue of the [{(SiMe3)2N}Ln]2N2K system. This complex was remarkable both for the (N2)3˙– anion and the SMM behaviour.4 It generated significant subsequent interest in multimetallic lanthanide radical bridged complexes.5 The very recent reports of magnetic hysteresis at 60 K in a dysprosocenium cation are a testament to the power of the organometallic molecular design approach.6,7
Our aim was to identify and use a redox-active bridging ligand with multiple and selective binding sites as the template for a general and modular synthetic route to heterometallic d–f or f–f′ complexes. The ligand used in this work 1,10-phenathroline-5,6-dione (pd) has been predominantly studied for its physical organic, biological and bio-inorganic chemistry, particularly as a precursor to DNA intercalation agents and photocatalysts.8,9 Metal complexes of pd have been targeted for applications as diverse as electrocatalysis, sensitised Ln emission and thermochromism.10–12
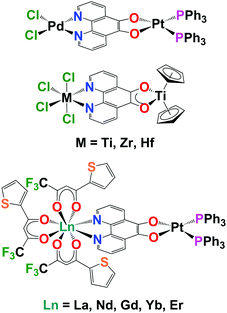
There is transition metal literature precedent for using pd as a bridging ligand to synthesise multi-metallic complexes. The first transition metal complexes of pd were synthesised by Balch by the addition of Pt(PPh3)4 to pd to form [(O,O’-pd)Pt(PPh3)2].13 The electrochemical and electrocatalytic properties of these complexes were subsequently investigated by Abruna.10 Pierpont demonstrated that [(O,O’-pd)Pt(PPh3)2] could be used as a bipyridine equivalent to bind a second metal.14 This paper also reported the selective N,N’-pd binding of PdCl2 and the first crystal structures of transition metal pd complexes (Chart 1). Eisenberg combined pd and bipyridine (bipy) to form the homobimetallic Pt complexes, [PtCl2(N,N’-O,O’-pd)Pt(di-tert-butyl-bipy)]. These were then used as precursors to synthesise [Pt(L)(N,N’-O,O’-pd)Pt(di-tert-butyl-bipy)] (where L = dithiolate, dicatecholate or pd) and probe electronic structure.15
Directly relevant to this work, is the first report of the coordination and redox chemistry of group 4 and 5 metals with pd, by Pampaloni and Calderazzo.16 These groups subsequently published a number of studies demonstrating that pd will selectively bind N,N′ with a coordination chemistry precursor or O,O′ with a reducing organometallic precursor and can form homo- and heterometallic transition metal complexes.17–19 Prior to this work there are just two reports of structurally characterised molecular lanthanide complexes of pd, both by Faulkner and Ward, which describe the sensitised NIR emission of [Ln(tta)3(N,N’-O,O’-pd)Pt(PPh3)2] (Ln = La, Nd, Gd, Er, Yb; tta = 1-thenoyl-5,5,5-trifluoroacetylacetonate).12,20 We note that there are reports of the biological activity of combinations of Ln and pd.
Here we report a robust and modular synthesis and first structural characterisation of [Ln(hfac)3(N,N’-pd)] (Ln = Y, Gd) complexes. We also report the reduction of these coordination chemistry complexes using vanadocenes to form heterobimetallic rare earth-transition metal complexes. The [Ln(hfac)3(N,N′-O,O′-pd)VCpR2] complexes have been fully characterised by a range of spectroscopic techniques. These complexes are spectroscopically rich and represent the first building-blocks in our studies of rare earth-transition metal complexes.
Results and discussion
Synthesis of [Ln(hfac)3(N,N’-pd)]
Metal precursor choice is particularly important in f-element chemistry. In this work, we chose to use the Ln(OTf)3 (Ln = Y, Gd, OTf = CF3SO3) more commonly applied in organic synthesis as Lewis acid catalysts.21 This was due to the ease of preparation from inexpensive Ln2O3 starting materials, their stability in H2O and facile dehydration by comparison to commercially available LnCl3·(H2O)x. The hfac (hfac = 1,1,1-5,5,5-hexafluoroacetylacetonate) ligand was chosen because [Ln(hfac)3(glyme)] are well-defined molecular species.22,23 The hfac ancillary ligand environment has good solubility and stability, with 19F NMR as an additional probe of solution behaviour. We note that while you can access [Ln(hfac)3(glyme)] directly from Ln2O3, the synthesis requires the addition of chelating polyethers to prevent aggregation.24However, using a salt elimination reaction enables this synthetic route to be modular and applicable to other ligand environments. The coordination complexes [Ln(hfac)3(N,N’-pd)] were synthesised in high yield. Ln(OTf)3 (Ln = Y, Gd), pd and 3 equivalents of K(hfac) were combined dry, and THF added at room temperature with stirring, giving a colour change from yellow to deep green. The reaction was stirred at room temperature for 16 h, and THF removed in vacuo. Extraction into toluene, filtration to exclude K(OTf) and removal of toluene in vacuo gave the neutral complexes [Ln(hfac)3(N,N′-pd)] as pastel green solids in excellent yields (Ln = Y: 82% [1], Gd: 79% [2]) (Scheme 1). Elemental analyses of 1 and 2 crystallised from toluene at −35 °C support the [Ln(hfac)3(N,N′-pd)] formulation, with one toluene of crystallisation associated. 1 and 2 are soluble in both coordinating and non-coordinating solvents, to give green and yellow solutions, respectively.
Spectroscopy of [Ln(hfac)3(N,N’-pd)]
The room temperature 1H NMR spectrum of 1 in d6-benzene is consistent with complexation to form the 1![[thin space (1/6-em)]](https://www.rsc.org/images/entities/char_2009.gif) :
:![[thin space (1/6-em)]](https://www.rsc.org/images/entities/char_2009.gif) 1 adduct. The pd resonances in 1 at δ = 6.37, 7.53, and 9.16 ppm are shifted downfield relative to the pd free ligand and the aromatic splitting pattern (dd) is no longer observed for the protons neighbouring the N,N′-pocket. The expected ratio of 2
1 adduct. The pd resonances in 1 at δ = 6.37, 7.53, and 9.16 ppm are shifted downfield relative to the pd free ligand and the aromatic splitting pattern (dd) is no longer observed for the protons neighbouring the N,N′-pocket. The expected ratio of 2![[thin space (1/6-em)]](https://www.rsc.org/images/entities/char_2009.gif) :
:![[thin space (1/6-em)]](https://www.rsc.org/images/entities/char_2009.gif) 2
2![[thin space (1/6-em)]](https://www.rsc.org/images/entities/char_2009.gif) :
:![[thin space (1/6-em)]](https://www.rsc.org/images/entities/char_2009.gif) 2
2![[thin space (1/6-em)]](https://www.rsc.org/images/entities/char_2009.gif) :
:![[thin space (1/6-em)]](https://www.rsc.org/images/entities/char_2009.gif) 3 is observed between the pd resonances and the hfac singlet at δ = 6.23 ppm. The 19F NMR spectrum displays a singlet at δ = −76.9 ppm. The X-band EPR spectrum of 2 at room temperature (see ESI†) is common for Gd(III) and simulation gave giso = 1.989, close to that of the free electron, which is typical for Gd(III).25 The 8S0 ground state of Gd(III) has no angular orbital momentum, and so unlike its f-block counterparts, Gd(III) gives an EPR response at room temperature. The Evans Method was used to determine the magnetic moment of 2 in d8-thf at room temperature. The corrected magnetic moments are in the range of 7.56–7.71μB for 2, consistent with Gd(III).
3 is observed between the pd resonances and the hfac singlet at δ = 6.23 ppm. The 19F NMR spectrum displays a singlet at δ = −76.9 ppm. The X-band EPR spectrum of 2 at room temperature (see ESI†) is common for Gd(III) and simulation gave giso = 1.989, close to that of the free electron, which is typical for Gd(III).25 The 8S0 ground state of Gd(III) has no angular orbital momentum, and so unlike its f-block counterparts, Gd(III) gives an EPR response at room temperature. The Evans Method was used to determine the magnetic moment of 2 in d8-thf at room temperature. The corrected magnetic moments are in the range of 7.56–7.71μB for 2, consistent with Gd(III).
IR spectroscopy cannot definitively assign the coordination mode of the pd ligand but does provide a useful measure of its carbon–oxygen bond order. The reported ranges of νCO are: neutral pd = 1678 cm−1, radical anion pd˙− 1500–1400 cm−1 and dianion pd2− 1400–1300 cm−1.14,16 The IR spectra of 1 and 2 have several absorptions in the νCO region, complex 1 at 1699, 1668 and 1647 cm−1 and 2 at 1697, 1661, 1647 cm−1. The νCO at 1647 is assigned to the hfac ligand based on the IR of closely related complexes, [Ln(hfac)3(glyme)], which have very strong absorption between 1650 and 1660 cm−1.23 The νCO at 1699 and 1697 cm−1 are assigned as N,N′-pd. This is consistent with complexes formulated as, [PdCl2(N,N′-pd)],13 [Fe(N,N′-pd)3][PF6]2,10 and [MCl4(N,N′-pd)] (M = Ti, Zr, Hf)16 which have strong absorptions in the range 1680–1705 cm−1. We propose additionally that the νCO at 1668 and 1661 cm−1 may result from the short contacts seen between the Ln metal centre and one pd-O atom of the neighbouring molecule (Fig. 3 and ESI†).
The deep green colour of 1 and 2 in coordinating solvents is an unexpected property as neither 4d0 Y(III) nor 4f7 Gd(III) often give rise to strongly coloured complexes. It is of note that related Ln complexes with 1,10-phenanthroline (phen) or neutral 2,2-bipyridyl (bipy) ligands are not strongly coloured.24,26,27 The electronic spectra of 1 and 2 in acetonitrile display peaks centred at 587 nm (ε = 2390 M−1 cm−1) and 597 (ε = 129 M−1 cm−1), respectively (see ESI† for spectra). We assign this as ligand to metal charge transfer.
Crystallography of [Ln(hfac)3(N,N’-pd)]
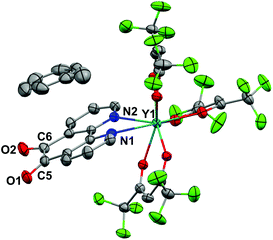
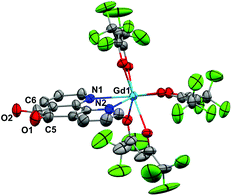
Crystals of 1 suitable for X-ray diffraction were grown from either a saturated Et2O solution at −35 °C over 7 days (1a) or a saturated toluene solution at −15 °C overnight (1b). Similarly crystals of 2 suitable for X-Ray diffraction were grown from either a saturated Et2O solution at −35 °C overnight (2a) or a saturated toluene solution at −15 °C overnight (2b). The solid state molecular structures and selected parameters are shown in Fig. 1–3 or in the ESI.†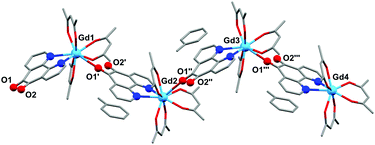 | ||
| Fig. 3 Molecular structure of 2b, showing the polymeric structure. All atoms depicted as wireframe or ball and stick. | ||
All structures adopt a distorted square antiprismatic geometry, and confirm N,N′-pd coordination. As expected the pd C–O distances in 1a–2b are unchanged from the free ligand (1.213(5) and 1.216(5) Å).28 The Ln–O(hfac) distances to the hfac ligands are consistent between both structures, and are in agreement with the crystal structures of other examples of Ln(hfac)3 complexes in the range of 2.299(2)–2.343(3) Å.23,29 The Ln–N(pd) distances in structures 1a–2b of 2.501(3)–2.585(8) Å are directly comparable to those reported in [Ln(tta)3(N,N’-O,O’-pd)Pt(PPh3)2] (Ln = Er, Gd; tta = 1-thenoyl-5,5,5-trifluoroacetylacetonate) of 2.499(7)–2.539(7) Å,12 as the ionic radius of Er(III) is an appropriate size match for Y(III).30 Complex 1 is the first crystallographically characterised example of an yttrium pd complex. The Y–N(pd) distances are also comparable to those seen in [Y(pyrMe2-acac)3(phen)] (pyrMe2-acac = 1,5-(1,3-dimethyl-1H-pyrazol-4-yl)acetylacetonate) of 2.562(4)–2.579(4) Å.24
The structure of 2b from toluene is a coordination polymer as a result of N,N’-O-pd binding to the next Gd in the chain (Fig. 3). The only other structure in the CCDC that displays this binding mode is the Ag(I) coordination polymer [Ag(ClO4)(N,N’-O-pd)]n.31 The Gd1–O2 distance is 2.830(2) Å, and the coordination polymer exhibits a zig-zag structure with an angle of 77.56° between Gd–pd planes. Analysis of short contacts in 1b reveals a Y1–O2 interaction within the sum of the van der Waals radii at 3.154 Å, giving a pseudo-coordination polymer structure with an angle of 83.98° between Y–pd planes (see ESI†). As a result of the N,N’-O-pd binding, both 2b and 1b feature significant distortion within the pd ring. The three rings of pd are no longer coplanar and there is an out-of-plane O2-ring distortion and associated out-of-plane displacement of O2.
Reduction chemistry of 1 and 2
The pd ligand can be sequentially reduced by two electrons, first to the semiquinone radical anion pd˙− and then to the fully reduced and diamagnetic catecholate pd2–; the reduction potentials are −0.85 and −1.71 V vs. Fc+/Fc, respectively.10,32 Almost all published metal complexes of the reduced pd ligand contain pd2− and the few examples of the radical anion of pd˙− were generated in situ, usually under electrochemical conditions and characterised by electronic spectroscopies such as EPR and UV-vis-NIR. This is in spite of the ease of reduction of pd to pd˙− relative to the structurally related 1,10-phenanthroline10 and 2,2′-bipyridine.33Complex 1 is unstable under standard electrochemical conditions. Therefore, we used the reduction potentials of the free pd ligand to rationalise the choice of organometallic reducing agent.34 The first reversible oxidation process of V(II) to V(III) in VCp2 to VCp2+ is a good match at −0.93 V vs. Fc+/Fc.35 We note that VCp2 has been previously shown to reduce pd, with the product formulated as [(O,O′-pd)VCp2] and in our hands this reaction formed intractable dark green solids.16 Additionally, we used a substituted vanadocene, VCpt2 (Cpt = tetramethylcyclopentadienyl) to test whether the added steric bulk would promote the formation of an ion pair. The substituted Cpt ligand environment is also a good model for extending this synthetic route to incorporate f-element organometallics.36
Synthesis of [Ln(hfac)3(N,N′-O,O′-pd)VCpR2]
A Schlenk flask charged with 1 or 2 and VCp2 was cooled to −78 °C and Et2O was added with stirring. The colour of the resultant solution was dark green-black. The reaction mixture was warmed to room temperature and Et2O was removed in vacuo. Recrystallisation of the solids from a mixture of toluene and hexane at −15 °C gave [Ln(hfac)3(N,N′-O,O′-pd)VCp2] as black microcrystalline solids (Ln = Y: 56% [3], Ln = Gd: 64% [4]). The analogous reaction between 1 or 2 and VCpt2 (t = Me4), resulted in the isolation of dark green-black micro-crystalline solids of [Ln(hfac)3(N,N–O,O-pd)VCpt2] (Ln = Y: 50%, [5] Ln = Gd: 42% [6]) (Scheme 1). The composition and purity of complexes 4–6 was confirmed by elemental analysis.Spectroscopy of [Ln(hfac)3(N,N′-O,O′-pd)VCpR2]
Complexes 3–6 are paramagnetic and NMR silent. The Evans Method was used to determine the magnetic moment of 3, 5 and 6, in d8-thf at room temperature. The corrected magnetic moments are in the range of 1.71–1.74μB for 3, 1.72–1.75μB for 5 and 7.99–8.41μB for 6. The data for 3 and 5 are consistent with a single unpaired electron i.e. 3d1 V(IV), resulting from the oxidative addition of V(II) to V(IV) and the concomitant reduction of pd by two electrons to pd2−. The data for 6 are consistent with the value predicted by the spin only formula for Gd(III) and V(IV). This is chemical behaviour similar to the oxidative addition of VCp2 to acetylene to form the metallocyclopropane.37The IR spectra of complexes 3–6, are consistent with pd reduction. The νCO at 1699 and 1697 cm−1 assigned to neutral N,N′-pd and at 1668 and 1661 cm−1 assigned to N,N′-O-pd are no longer visible. Instead, complexes 3–6, display νCO in the range 1370–1381 cm−1, consistent with the reported examples of pd2– complexes.14,16
An overlay of the electronic spectra of 3 and 4 collected in MeCN are contrasted with the electronic spectra of 5 and 6 collected in THF and presented in Fig. 4. The d–d transitions at 740 and 640 nm usually present in pseudo-tetrahedral vanadocenes38,39 are not directly observed as they are hidden underneath the charge transfer transitions. The transitions are assigned with the aid of computational analysis (vide infra).
 | ||
| Fig. 4 Overlay of the electronic spectra of 3 and 4 in MeCN (top) and 5 and 6 in THF (bottom) recorded at room temperature. | ||
Crystallography of [Ln(hfac)3(N,N′-O,O′-pd)VCpR2]
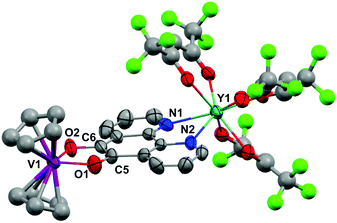
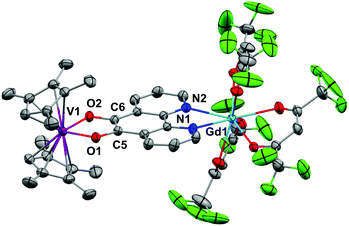
Crystals of 3, 5 and 6 suitable for X-ray diffraction were grown by diffusion of hexane vapour into a toluene or Et2O solution at −35 °C or by cooling a toluene/hexane mixture to −35 °C over several days. The structures and selected structural parameters are shown in Fig. 5 and 6 or in the ESI.† Complexes 3, 5 and 6 feature yttrium or gadolinium in a distorted square antiprismatic geometry and N,N’-pd bound analogous to 1a and 2a. The VCpR2 units are O,O’-pd bound, resulting in a pseudo-tetrahedral geometry typical for V(IV) metallocenes.40,41 The metal to ancillary ligand bonding metrics are normal. The five membered ring formed between the V and the O,O’-pocket of the pd is a common structural motif. The V1–O1 and V1–O2 distances in 3, 5 and 6 are consistent with those observed in related complexes [Na2(Et2O)2][V({dippCO}2)3], [VCp2(acac)][OTf] and V(IV) catecholates such as [NHEt3]2[V(cat)3] and [H2PrDA][VO(cat)2] (cat = 1,2-dihydroxybenzene, PrDA = 1,3-diaminopropane).42–45The metrics that are important in assessing the reduction of the pd ligand are C5–C6, C5–O1 and C6–O2. The C5–C6 bond distances in 3 of 1.40(3) Å, in 5 of 1.38(2) Å and in 6 of 1.387(3) Å are significantly shortened from that of 1b (1.524(6) Å) consistent with double bond formation. The C5–O1 and C6–O2 distances in 3 of 1.40(2) and 1.24(2) Å, in 5 of 1.34(2) and 1.35(2) Å and in 6 of 1.333(3) Å are significantly elongated from 1b (1.213(5) and 1.216(5) Å). The average C–O distances in 3, 5 and 6 are consistent with reduction to single C–O bonds. We note the disparity in the C–O distances in 3 but do not think it is chemically significant. These metrics in 3, 5 and 6 are consistent with pd2− and are essentially identical to those found in [Ln(tta)3(N,N’-O,O’-pd)Pt(PPh3)2] (Ln = Gd, Er).12
EPR of [Ln(hfac)3(N,N′-O,O′-pd)VCpR2]
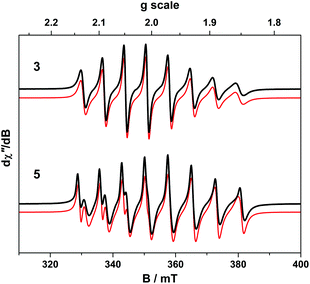
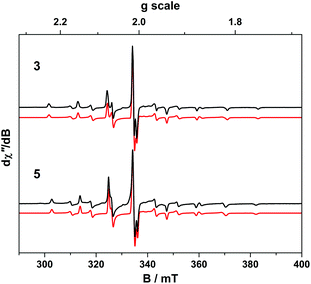
The room temperature X-band EPR spectra of 3 and 5 shown in Fig. 7 are typical for V(IV) with an 8-line pattern from coupling of the electron spin (S = 1/2) to the I = 7/2 nuclear spin of the 51V (99.8% abundance). The spectral simulation of 3 was gave giso = 1.9799 and Aiso = 65.8 × 10⁻⁴ cm−1, which are synonymous with non-oxo vanadyl species.40–42,44 In contrast, the spectrum of 5 exhibits the two overlapping 8-line signals; simulations yielded an equal mix of one entity with giso = 1.9819, Aiso = 68.4 × 10⁻⁴ cm−1, and the other giso = 1.9779 Aiso = 64.9 × 10⁻⁴ cm−1 (Table 1).The corresponding frozen solution spectra recorded in toluene at 130 K clearly depicts a signal indicative of a single chemical species of 3 and 5 (Fig. 8). The simulation parameters are nearly identical, with g = (1.9657, 1.9776, 1.9978) and A = (106.6, 78.1, 11.0) × 10−4 cm−1 for 3, and g = (1.9654, 1.9794, 1.9978) and A = (104.1, 78.0, 9.5) × 10−4 cm−1 for 5. The existence of one signal in the frozen matrix suggests two conformations of 5 are present in fluid solution with subtle differences in their spin-Hamiltonian parameters. The spectral profile for 3 and 5 describes a 2A1 ground state (dx2−y2 orbital in C2v symmetry) with archetypal gx ≈ gy < gz < ge and Ax ≈ Ay > Az splitting patterns.38 The narrow lines neatly show a slight rhombicity in the spectrum with a notable inequivalence of gx and gy, and Ax and Ay in this ligand field. This is in contrast to three-fold symmetric tris(chelate)vanadium complexes, which have the same 2A1 ground state but overall three-fold symmetry, such that gx = gy and Ax = Ay.38,41,42
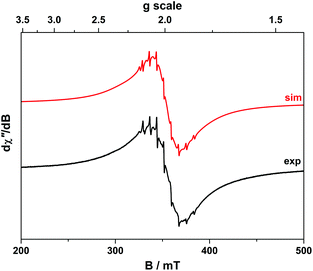
The X-band EPR spectrum of 4 is shown in Fig. 9 and displays a superposition of the single broad signal for Gd(III) entwined with the 8-line pattern of V(IV). The spectrum was simulated with three subspectra, two of which arise from different conformations of the complex which are distinguished by the g-values of the V(IV) centre because of the narrow linewidth as seen for 5. In 4 the major (10.5%) and minor (1.8%) conformer sum to a seventh of proportion of the intensity as expected for a heterobimetallic species with one Gd(III) S = 7/2 ion and one V(IV) S = 1/2 ion. In addition we observe no manifestation of exchange coupling between the Gd(III) and V(IV) centres such that J ≈ 0 (i.e. two uncoupled spins).
DFT calculations on 3
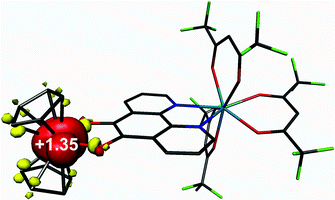
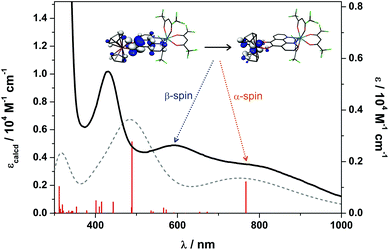
Density functional theoretical (DFT) calculations were carried out on 3 (S = 1/2). The optimised structure is in excellent agreement with the crystallographic structures of both 3 and 5 (Table S2†). The computed C–C and average C–O bond distances of 1.391 and 1.336 Å, respectively, are representative of a bridging pd ligand in its dianionic (catecholate) form. The highest occupied molecule orbital (HOMO) is singly-occupied (SOMO) with 91% vanadium d character that depicts the dx2−y2 orbital which is a1 in C2v symmetry as shown by EPR (vide supra). The Mulliken spin population analysis shows + 1.35 spins (α-spin) located on the V(IV) centre with matching β-spin on the first coordination sphere atoms (Fig. 10). This is the result of bond polarisation inherent to the relatively Lewis acidic V(IV) ion.41Time-dependent (TD) DFT calculations were carried out on 3 in order to assign the electronic spectra of this series of heterobimetallic compounds. Each complex (3–6) displays two low-energy bands at ca. 800 and 600 nm (Fig. 4). These signature spectral features were well-reproduced in the TD-DFT analysis (Fig. 11). Both bands are ligand-to-metal charge transfer (LMCT) transitions between the same donor and acceptor orbitals. These are the b2 symmetric HOMO−1, which is localised on the O,O′ end of the pd bridging ligand, and the LUMO, which is the vanadium dxy orbital (Fig. 11). The computed spectrum reveals the spin-up (α-spin) excitation at 767 nm which perfectly matches the experimental peak at 800 nm in 3. The corresponding spin-down (β-spin) excitation appears at 489 nm which is ca. 100 nm blue shifted from the experimental peak. This aforementioned polarisation inherent to Lewis acidic V(IV) sees the α-spin manifold is exchange stabilised relative to the β-spin manifold by virtue of the unpaired electron in the dx2−y2 orbital. This is the same phenomenon that results in >1 spins located at the V(IV) centre in the spin population analysis (Fig. 10). The experimental polarisation is 0.54 eV is overestimated by the calculations at 0.92 eV. This is typical for DFT as energies of virtual (unoccupied) orbitals are less reliable especially given the TD-DFT computed spectrum is derived from energy differences between donor and acceptor orbitals based on the ground state calculation. This neglects additional factors that can (de)stabilise excited states, and therein fail to accurately reproduce electronic spectra of paramagnetic compounds. Nevertheless, this approximation is sufficient to assign the observed spectral features. The prominent band at 410 nm is tentatively assigned as a π → π* transition from the pd2– ligand.
Conclusions
We have demonstrated the synthesis and first structural characterisation of [Ln(hfac)3(N,N’-pd)] for both Y and Gd complexes. The synthetic route works in exactly the same way for both diamagnetic Y and paramagnetic Gd. Considering the size of Gd and Y, this synthetic route would be expected to be directly applicable to all the Ln elements from Sm–Lu. As the route is modular, a range of ancillary ligand environments would also be expected to be synthetically accessible. We have also shown the reduction of these coordination chemistry complexes using vanadocenes to form heterobimetallic rare earth-transition metal complexes. The spectroscopic data for [Ln(hfac)3(N,N′-O,O′-pd)VCpR2] are consistent with oxidation of V(II) to V(IV) and reduction of pd to pd2– in these complexes. This redox chemistry is driven by the O,O′-pd binding of the VCpR2 unit. Work is ongoing to isolate rare-earth transition metal complexes containing the radical anion of pd bridging the metal centres and to synthesise heterobimetallic f–f′ complexes using 4f and 5f elements.Experimental
General details
All air-sensitive manipulations were carried out in an MBraun glovebox (O2 and H2O < 1 ppm) or by using standard Schlenk techniques under N2. All glassware was dried at 130 °C overnight prior to use. Filter cannulas were prepared using Whatman 25 mm glass microfiber filters and were pre-dried at 130 °C overnight. Dry solvents were obtained using an Innovative Technology Inc. Pure Solv 400-5-MD solvent purification system (activated alumina columns). Solvents were sparged with N2 and stored in ampoules over activated molecular sieves under N2. Deuterated benzene and THF were dried by refluxing over K. Deuterated acetonitrile was dried by refluxing over CaH2. Dry deuterated solvents were degassed by three freeze–thaw cycles, vacuum distilled, and kept in ampoules in the glovebox under N2. The following starting materials were prepared according to literature procedures: VCp2, VCpt2.46 Hexafluoroacetylacetone (Hhfac) was purchased from Aldrich and degassed by three freeze–thaw cycles before use. Potassium hydride in mineral oil was purchased from Aldrich, the mineral oil removed by washing with anhydrous hexanes, and stored under N2. Ln2O3 (Ln = Y, Gd), trifluoromethanesulfonic acid and 1,10-phenanthroline were purchased from Aldrich and used without further purification.Physical methods
1H NMR data were recorded on an AVIII 400 MHz instrument and were referenced internally to the appropriate residual protio-solvent and are reported relative to tetramethylsilane (δ = 0 ppm). 19F and 19F{1H} NMR spectra were recorded on a Bruker AVIII 400 MHz spectrometer and were referenced to CFCl3 (δ = 0 ppm). All spectra were recorded at a constant temperature of 300 K. Coupling constants (J) are reported in hertz (Hz). Standard abbreviations indicating multiplicity were used as follows: m = multiplet, d = doublet, t = triplet, s = singlet. UV/vis/NIR spectra were collected using a Shimadzu UV-3600 UV/vis/NIR spectrometer using anhydrous solvents, which were filtered through Celite® prior to use. ATR-IR spectra were collected using either a Shimadzu IRAffinity-1S or a Shimadzu FTIR 8400S spectrometer. Abbreviations indicating strength of bands were used as follows: s = strong, m = medium, w = weak.Elemental analysis was performed at the University of Strathclyde, and a combustible (tungstic oxide) was used to ensure complete combustion of all complexes.
Crystallographic data were collected for single crystals of [Y(hfac)3(N,N′-pd)] (1a/1b), [Y(hfac)3(N,N′-O,O′-pd)VCp2] (3) and [Gd(hfac)3(N,N′-O,O′-pd)VCpt2] (6) on a Bruker D8 VENTURE diffractometer at 100 K using Mo-Kα radiation (λ = 0.71073 Å). Single-crystal structure data for [Gd(hfac)3(N,N′-pd)]·Et2O (2a), [Gd(hfac)3(N,N′-pd)]·Tol (2b) and [Y(hfac)3(N,N′-O,O′-pd)VCpt2] (5) were collected by the EPSRC UK National Crystallography Service using a Rigaku AFC12 goniometer, mounted at the window of a FR-E+ SuperBright molybdenum rotating anode generator, and equipped with a (HG) Saturn724+ detector. CCDC numbers 1832429–1832434 and 1841191† contain the crystallographic information for this paper.
X-band EPR spectra were collected on a Bruker ELEXSYS E500 spectrometer and simulations were performed using Bruker's Xsophe software package.47
Synthesis of [Y(hfac)3(N,N′-pd)] (1)‡
THF (15 mL) was added to a Schlenk flask charged with a dry mixture of Y(OTf)3 (1.16 g, 2.17 mmol), pd (0.456 g, 2.17 mmol) and K(hfac) (1.60 g, 6.51 mmol) at room temperature with stirring. The yellow suspension was stirred at room temperature for 1 h, whereupon the solution became deep green. The green solution was stirred for 16 h, THF was removed in vacuo and the green solids were extracted into toluene (3 × 5 mL), giving a yellow solution. Removal of toluene in vacuo gave green solids, which were washed with hexane (2 × 5 mL) to give [Y(hfac)3(N,N′-pd)] as a pale green solid (1.70 g, 1.84 mmol, 85% yield). Single crystals suitable for X-ray diffraction were grown from both a saturated Et2O solution at −35 °C over 1 week ([Y(hfac)3(N,N′-pd)]·Et2O, 1a) and a saturated toluene solution at −15 °C overnight ([Y(hfac)3(N,N′-pd)]·Tol, 1b). 1H NMR (C6D6): δ 6.23 (3H, s, hfac-C![[H with combining low line]](https://www.rsc.org/images/entities/b_char_0048_0332.gif) ) 6.37 (2H, dd, JHH = 7.8, 5.5 Hz, pd C3,8-H) 7.53 (2H, d, JHH = 8.7 Hz, pd C4,7-H) 9.16 (2H, d, JHH = 5.2 Hz, pd C2,9-H) ppm. 19F{1H} NMR (C6D6): δ −76.93 (s, hfac-C
) 6.37 (2H, dd, JHH = 7.8, 5.5 Hz, pd C3,8-H) 7.53 (2H, d, JHH = 8.7 Hz, pd C4,7-H) 9.16 (2H, d, JHH = 5.2 Hz, pd C2,9-H) ppm. 19F{1H} NMR (C6D6): δ −76.93 (s, hfac-C![[F with combining low line]](https://www.rsc.org/images/entities/b_char_0046_0332.gif) 3) ppm. Anal. calcd for C27H9N2O8F18Y·C7H8: C, 35.24%; H, 0.99%; N, 3.04%. Found: C, 35.06%; H, 0.96%; N, 3.14%. IR(ATR) 1699 (w, νCO) 1668 (w) 1647 (s) 1610 (w) 1579 (w) 1495 (m) 1426 (m) 1251 (s) 1197 (s) 1136 (s) 794 (s) 651 (s) 582 (m) cm−1. λmax (MeCN)/nm (ε/M−1 cm−1): 590 (2300).
3) ppm. Anal. calcd for C27H9N2O8F18Y·C7H8: C, 35.24%; H, 0.99%; N, 3.04%. Found: C, 35.06%; H, 0.96%; N, 3.14%. IR(ATR) 1699 (w, νCO) 1668 (w) 1647 (s) 1610 (w) 1579 (w) 1495 (m) 1426 (m) 1251 (s) 1197 (s) 1136 (s) 794 (s) 651 (s) 582 (m) cm−1. λmax (MeCN)/nm (ε/M−1 cm−1): 590 (2300).
Synthesis of [Gd(hfac)3(N,N′-pd)] (2)
THF (15 mL) was added to a Schlenk flask charged with a dry mixture of Gd(OTf)3 (0.759 g, 1.26 mmol), K(hfac) (0.997 g, 3.77 mmol) and 1,10-phenanthroline-5,6-dione (0.263 g, 1.25 mmol). The yellow suspension was stirred for 20 h, turning green after ca. 1 h. THF was removed in vacuo and [Gd(hfac)3(N,N′-pd)] was extracted into toluene (3 × 10 ml) to give a yellow solution. Toluene was removed in vacuo to give a green solid, which was washed with hexanes to give [Gd(hfac)3(N,N′-pd)] as a pale green solid (0.992 g, 1.00 mmol, 79% yield). Single crystals suitable for X-ray diffraction were grown from both saturated Et2O ([Gd(hfac)3(N,N′-pd)]·Et2O, 2a) and toluene ([Gd(hfac)3(N,N′-pd)]·Tol, 2b) solutions cooled to −35 °C overnight. Anal. calcd for C27H9N2O8F18Gd·C7H8: C, 37.79%; H, 1.59%; N, 2.59%. Found: C, 37.58%; H, 1.47%; N, 2.54%. IR(ATR): 1697 (w, νCO) 1661 (w) 1647 (s) 1495 (m) 1252 (m) 1202 (m) 1142 (s) 1098 (w) 802 (s) 732 (m) 660 (s). λmax (MeCN)/nm (ε/M−1 cm−1): 597 (129). μeff (298 K, d8-THF) 7.56–7.71 BM.Synthesis of [Y(hfac)3(N,N′-O,O′-pd)VCp2] (3)
Et2O (10 mL) was added to a −78 °C cooled Schlenk flask charged with a dry mixture of 1 (0.50 g, 0.54 mmol) and VCp2 (0.10 g, 0.54 mmol), immediately giving a dark green solution. The reaction was allowed to warm to room temperature and stirred for 2 h. Et2O was removed in vacuo and the green/black product recrystallised from toluene/hexane at −15 °C to give [Y(hfac)3(N,N′-O,O′-pd)VCp2] as a black microcrystalline solid (0.335 g, 0.30 mmol, 56% yield). Crystals suitable for X-ray diffraction were grown from a toluene/hexane mixture at −35 °C overnight. Anal calcd For C37H19F18N2O8VY: C, 40.35%; H, 1.74%; N, 2.54%. Found: C, 39.88%; H, 1.81%; N, 2.56%. IR(ATR): 1651 (s) 1504 (m) 1371 (m, νCO) 1250 (s) 1197 (s) 1134 (s) 794 (s) 651 (s) 582 (m) cm−1. λmax (MeCN)/nm (ε/M−1 cm−1): 431 (5400), 600 (2630), 788 (1840). μeff (298 K, d8-THF): 1.71–1.74 BM.Synthesis of [Gd(hfac)3(N,N′-O,O′-pd)VCp2] (4)
THF (15 mL) was added to a dry mixture of [Gd(hfac)3(N,N′-pd)] (500 mg, 0.505 mmol) and V(Cp)2 (91.3 mg, 0.504 mmol) and the dark suspension was stirred for 24 h. THF was removed in vacuo. [Gd(hfac)3(N,N′-O,O′-pd)V(Cp)2] was extracted into toluene and cooled to −15 °C, whereupon it precipitated as a black powder (378 mg, 0.322 mmol, 64% yield). Anal. calcd for C37H19F18N2O8VGd: C, 37.99%; H, 1.64%; N, 2.39%. Found: C, 37.11%; H, 1.70%; N, 2.38%. IR(ATR): 1651 (m) 1497 (m) 1381 (w, νCO) 1258 (m) 1204 (w) 1134 (s) 1018 (s) 795 (s) 656 (m). λmax (MeCN)/nm (ε/M−1 cm−1): 425 (4650) 576 (3430) 797 (2740).Synthesis of [Y(hfac)3(N,N′-O,O′-pd)VCpt2] (5)
Et2O (30 mL) was added to a −78 °C cooled Schlenk flask charged with VCptet (250 mg, 0.83 mmol) and [Y(hfac)3(N,N′-pd)] (770 mg, 0.83 mmol), giving a dark green suspension. The reaction was allowed to warm to room temperature, and stirred for 16 hours. The dark suspension was filtered into a Schlenk and dried in vacuo to give deep-green solids, which were recrystallised from a saturated solution of toluene and hexane at −15 °C overnight. The micro-crystals were isolated, washed with hexanes (3 × 15 mL), and dried in vacuo to give [Y(hfac)3(N,N′-O,O′-pd)VCpt2] as a dark green powder (520 mg, 10.43 mmol, 50% yield). Crystals suitable for X-ray diffraction were grown by diffusion of hexane vapour into a toluene solution at −35 °C over several days. Anal. calcd for C45H35F18N2O8VY: C, 44.54%; H, 2.91%; N, 2.31%. Found: C, 44.49%; H, 3.78%; N, 2.49%. IR(ATR): 1651 (s), 1506 (m), 1373 (m, νCO), 1250 (s), 794 (m), 727 (w), 659 (m). λmax (THF)/nm (ε/M−1 cm−1): 418 (6970), 553 (2920), 816 (2340). μeff (298 K, d8-THF) 1.72–1.75 BM.Synthesis of [Gd(hfac)3(N,N′-O,O′-pd)VCpt2] (6)
Et2O (30 mL) was added to a −78 °C cooled Schlenk flask charged with VCptet2 (38 mg, 0.13 mmol) and [Gd(hfac)3(N,N′-pd)] (130 mg, 0.13 mmol), giving a dark green suspension. The reaction was allowed to warm to room temperature, and stirred for 16 hours. The dark suspension was filtered into a Schlenk and dried in vacuo to give deep-green solids, which were recrystallised from a saturated solution of toluene and hexane at −15 °C overnight. The micro-crystals were isolated, washed with hexanes (3 × 15 mL), and dried in vacuo to give [Gd(hfac)3(N,N′-O,O′-pd)VCpt2] as a dark green powder (70 mg, 5.40 mmol, 42% yield). Crystals suitable for X-ray diffraction were grown by diffusion of hexane vapour into an Et2O solution at −35 °C over several days. Anal. calcd for C45H35F18N2O8VGd: C, 42.16%; H, 2.75%; N, 2.19%. Found: C, 42.45%; H, 3.18%; N, 2.04%. IR(ATR): 1650 (s), 1500 (m), 1370 (w, νCO), 1250 (s), 800 (m), 733 (w), 662 (m). λmax (THF)/nm (ε/M−1 cm−1): 435 (6260), 792 (1420). μeff (298 K, d8-THF) 7.99–8.41 BM.Conflicts of interest
There are no conflicts to declare.Acknowledgements
We acknowledge the EPSRC for PhD studentships to JRH (EP/L504786/1) and SJH (EP/M508056/1), Imperial College London (JRF to JHF) and the University of Glasgow for funding. We thank Professor Nick Long for his mentorship while at ICL and for useful discussions. We also acknowledge the EPSRC UK National Crystallography Service at the University of Southampton.References
- J. F. Berry and C. M. Thomas, Dalton Trans., 2017, 46, 5472–5473 RSC.
- K. Liu, W. Shi and P. Cheng, Coord. Chem. Rev., 2015, 289–290, 74–122 CrossRef.
- K. Griffiths, A. C. Tsipis, P. Kumar, O. P. E. Townrow, A. Abdul-Sada, G. R. Akien, A. Baldansuren, A. C. Spivey and G. E. Kostakis, Inorg. Chem., 2017, 56, 9563–9573 CrossRef PubMed.
- J. D. Rinehart, M. Fang, W. J. Evans and J. R. Long, J. Am. Chem. Soc., 2011, 133, 14236–14239 CrossRef PubMed.
- S. Demir, L.-R. Jeon, J. R. Long and T. D. Harris, Coord. Chem. Rev., 2015, 289–290, 149–176 CrossRef.
- C. A. P. Goodwin, F. Ortu, D. Reta, N. F. Chilton and D. P. Mills, Nature, 2017, 548, 439–442 CrossRef PubMed.
- F.-S. Guo, B. M. Day, Y.-C. Chen, M.-L. Tong, A. Mansikkamäki and R. A. Layfield, Angew. Chem., Int. Ed., 2017, 56, 11445–11449 CrossRef PubMed.
- A. E. Friedman, J.-C. Chambron, J.-P. Sauvage, N. J. Turro and J. K. Barton, J. Am. Chem. Soc., 1990, 112, 4960–4962 CrossRef.
- K. Peuntinger, T. D. Pilz, R. Staehle, M. Schaub, S. Kaufhold, L. Petermann, M. Wunderlin, H. Görls, F. W. Heinemann, J. Li, T. Drewello, J. G. Vos, D. M. Guldi and S. Rau, Dalton Trans., 2014, 43, 13683–13695 RSC.
- C. A. Goss and H. D. Abruna, Inorg. Chem., 1985, 24, 4263–4267 CrossRef.
- J. Yuasa, T. Suenobu and S. Fukuzumi, J. Phys. Chem. A, 2005, 109, 9356–9362 CrossRef PubMed.
- N. M. Shavaleev, L. P. Moorcraft, S. J. A. Pope, Z. R. Bell, S. Faulkner and M. D. Ward, Chem. – Eur. J., 2003, 9, 5283–5291 CrossRef PubMed.
- A. Y. Girgis, Y. S. Sohn and A. L. Balch, Inorg. Chem., 1975, 14, 2327–2331 CrossRef.
- G. A. Fox, S. Bhattacharya and C. G. Pierpont, Inorg. Chem., 1991, 30, 2895–2899 CrossRef.
- W. Paw and R. Eisenberg, Inorg. Chem., 1997, 36, 2287–2293 CrossRef PubMed.
- F. Calderazzo, F. Marchetti, G. Pampaloni and V. Passarelli, J. Chem. Soc., Dalton Trans., 1999, 4389–4396 RSC.
- E. K. Brechin, L. Calucci, U. Englert, L. Margheriti, G. Pampaloni, C. Pinzino and A. Prescimone, Inorg. Chim. Acta, 2008, 361, 2375–2384 CrossRef.
- F. Calderazzo, G. Pampaloni and V. Passarelli, Inorg. Chim. Acta, 2002, 330, 136–142 CrossRef.
- F. Calderazzo and G. Pampaloni, J. Organomet. Chem., 1987, 330, 47–59 CrossRef.
- N. M. Shavaleev, L. P. Moorcraft, S. J. A. Pope, Z. R. Bell, S. Faulkner and M. D. Ward, Chem. Commun., 2003, 1134–1135 RSC.
- S. Kobayashi, M. Suguira, H. Kitagawa and W. W.-L. Lam, Chem. Rev., 2002, 102, 2227–2302 CrossRef PubMed.
- K. D. Pollard, H. A. Jenkins and R. J. Puddephatt, Chem. Mater., 2000, 12, 701–710 CrossRef.
- G. Malandrino, R. L. Nigro, I. L. Fragala and C. Benelli, Eur. J. Inorg. Chem., 2004, 500–509 CrossRef.
- I. V. Taidakov, Y. A. Strelenko, R. S. Borisov, A. Z. Temerdashev, N. P. Datskevich and A. G. Vitukhnovskii, Russ. J. Coord. Chem., 2015, 41, 230–239 CrossRef.
- M. Hardiman, J. Pellisson, S. E. Barnes, P. E. Bisson and M. Peter, Phys. Rev. B: Condens. Matter Mater. Phys., 1980, 22, 2175–2194 CrossRef.
- D. Roitershtein, A. Domingos, L. C. J. Pereira, J. R. Ascenso and N. Marques, Inorg. Chem., 2003, 42, 7666–7673 CrossRef PubMed.
- V. S. Herzog and K. Gustav, Z. Anorg. Allg. Chem., 1966, 346, 150–161 CrossRef.
- J.-W. Dai, Z.-Y. Li and O. Sato, Acta Crystallogr., Sect. E: Struct. Rep. Online, 2014, 70, o573 Search PubMed.
- A. Y. Rogachev, A. V. Mironov, S. I. Troyanov, N. P. Kuzmina and A. V. Nemukhin, J. Mol. Struct., 2006, 789, 187–194 CrossRef.
- R. D. Shannon, Acta Crystallogr., Sect. A: Cryst. Phys., Diffr., Theor. Gen. Crystallogr., 1976, 32, 751–767 CrossRef.
- M. Wen, E. Kejia, M. Munakata, Y. Suenaga, T. Kuroda-Sowa, M. Maekawa and S. G. Yan, Mol. Cryst. Liq. Cryst., 2006, 457, 203–213 CrossRef.
- D. M. Murphy, K. McNamara, P. Richardson, V. Sanchez-Romaguera, R. E. P. Winpenny and L. J. Yellowlees, Inorg. Chim. Acta, 2011, 374, 435–441 CrossRef.
- F. Ortu, J. Liu, M. Burton, J. M. Fowler, A. Formanuik, N. F. Chilton, M-E. Boulon and D. P. Mills, Inorg. Chem., 2017, 56, 2496–2505 CrossRef PubMed.
- N. G. Connelly and W. E. Geiger, Chem. Rev., 1996, 96, 877–910 CrossRef PubMed.
- J. D. L. Holloway and W. E. Geiger Jr., J. Am. Chem. Soc., 1979, 101, 2038–2044 CrossRef.
- W. J. Evans, Organometallics, 2016, 35, 3088–3100 CrossRef.
- J. L. Petersen and L. Griffith, Inorg. Chem., 1980, 19, 1852–1858 CrossRef.
- J. L. Petersen and L. F. Dahl, J. Am. Chem. Soc., 1975, 97, 6422–6432 CrossRef.
- D. P. Bakalik and R. G. Hayes, Inorg. Chem., 1972, 11, 1734–1738 CrossRef.
- J. A. Belot, R. D. McCullough, A. L. Rheingold and G. P. A. Yap, Organometallics, 1996, 15, 5062–5065 CrossRef.
- B. Gleeson, J. Claffey, M. Hogan, H. Müller-Bunz, D. Wallis and M. Tacke, J. Organomet. Chem., 2009, 694, 1369–1374 CrossRef.
- P. Ghosh, S. Ghosh, C. Navara, R. K. Narla, A. Benyumov and F. M. Uckun, J. Inorg. Biochem., 2001, 84, 241–253 CrossRef PubMed.
- G. H. Spikes, S. Sproules, E. Bill, T. Weyhermu and K. Wieghardt, Inorg. Chem., 2008, 47, 10935–10944 CrossRef PubMed.
- S. R. Cooper, Y. B. Koh and K. N. Raymond, J. Am. Chem. Soc., 1982, 104, 5092–5102 CrossRef.
- C. Zixiang, Z. Linli, L. Xiaoming, Y. Hongtao and L. Bing, Z. Anorg. Allg. Chem., 2012, 638, 1523–1530 CrossRef.
- L. E. Manzer, E. A. Mintz and T. J. Marks, Inorg. Synth., 1989, 28, 260–263 Search PubMed.
- G. R. Hanson, K. E. Gates, C. J. Noble, M. Griffin, A. Mitchell and S. Benson, J. Inorg. Biochem., 2004, 98, 903–916 CrossRef PubMed.
Footnotes |
| † Electronic supplementary information (ESI) available. CCDC 1832429–1832434 and 1841191. For ESI and crystallographic data in CIF or other electronic format see DOI: 10.1039/c8dt01262h |
| ‡ We note that a complex formulated as [Y(hfac)3(N,N′-pd)] was reported in the following paper, Chem. Papers, 2016, 70, 43. However, the spectroscopic data reported therein is not consistent with our full characterisation of compound 1. |
| This journal is © The Royal Society of Chemistry 2018 |

