 Open Access Article
Creative Commons Attribution 3.0 Unported Licence
Tin guanidinato complexes: oxidative control of Sn, SnS, SnSe and SnTe thin film deposition†‡
Ibrahim Y.
Ahmet
 a,
Michael S.
Hill
 *ab,
Paul R.
Raithby
 b and
Andrew L.
Johnson
 *ab
*ab
aCentre for Sustainable Chemical Technologies, Department of Chemistry, University of Bath, Claverton Down, Bath, BA2 7AY, UK
bDepartment of Chemistry, University of Bath, Claverton Down, Bath, BA2 7AY, UK. E-mail: A.L.Johnson@bath.ac.uk; M.S.Hill@bath.ac.uk
First published on 7th March 2018
Abstract
A family of tin(II) guanidinate complexes of the general form [{RNC(NMe2)NR}2Sn] (R = iPr (6), Cy (7), Tol (9) and Dipp (10)) and [{tBuNC(NMe2)NtBu}Sn{NMe2}] (8) have been synthesised and isolated from the reaction of tin(II) bis-dimethylamide and a series of carbodiimides (1–5). The cyclic poly-chalcogenide compounds [{CyNC(NMe2)NCy}2Sn{Chx}] (Ch = S, x = 4 (11); Ch = Se, x = 4 (12), and Ch = S, x = 6 (13)) with {SnChx} rings were prepared by the oxidative addition of elemental sulfur and selenium to the heteroleptic stannylene complex [{CyNC(NMe2)NCy}2Sn] (7) in THF at room temperature. Similarly, reaction of compounds 6 and 7 with an equimolar amount of the chalcogen transfer reagents (SC3H6 and Se![[double bond, length as m-dash]](https://www.rsc.org/images/entities/char_e001.gif) PEt3, respectively) led to the formation of the chalcogenide tin(IV) complexes [{RNC(NMe2)NR}Sn(Ch)] (R = Cy: Ch = S (14); R = iPr, Ch = Se (15); R = Cy, Ch = Se (16)) with terminal Sn
PEt3, respectively) led to the formation of the chalcogenide tin(IV) complexes [{RNC(NMe2)NR}Sn(Ch)] (R = Cy: Ch = S (14); R = iPr, Ch = Se (15); R = Cy, Ch = Se (16)) with terminal Sn![[double bond, length as m-dash]](https://www.rsc.org/images/entities/char_e001.gif) Ch (14 and 16) and dimeric bridged seleno-tin {Sn2Se2} rings (15), respectively. The mono telluro-compounds [{RNC(NMe2)NR}Sn(Te)] (R = iPr (17); R = Cy (18)) were similarly prepared by the oxidative addition of elemental tellurium to 7 and 8, respectively. All of the tin containing compounds have been investigated by multinuclear NMR (1H, 13C 119Sn and 77Se/125Te, where possible), elemental analysis and single crystal X-ray structural analysis (7, 8, 10–13, 15–18). Thermogravimetric analysis (TGA) was used to probe the possible utility of complexes 6–8, 11–12 and 14–18 as single source Sn and SnCh precursors. The Sn(II) compounds 6 and 7 have been utilised in the growth of thin films by aerosol-assisted chemical vapor deposition (AACVD) at both 300 and 400 °C. The thin films have been analysed by pXRD, EDS, SEM and AFM and shown to be Sn metal. Subsequent studies provided film growth at temperatures as low as 200 °C. Similarly, the mono-chalcogenide systems 14, 16 and 18 have been utilised in the AACVD of thin films. These latter studies provided films, grown at 300 and 400 °C, which have also been analysed by pXRD, Raman spectroscopy, AFM, and SEM and are shown to comprise phase pure SnS, SnSe and SnTe, respectively. These preliminary results demonstrate the potential of such simple guanidinate complexes to act as single source precursors with a high degree of oxidative control over the deposited thin films.
Ch (14 and 16) and dimeric bridged seleno-tin {Sn2Se2} rings (15), respectively. The mono telluro-compounds [{RNC(NMe2)NR}Sn(Te)] (R = iPr (17); R = Cy (18)) were similarly prepared by the oxidative addition of elemental tellurium to 7 and 8, respectively. All of the tin containing compounds have been investigated by multinuclear NMR (1H, 13C 119Sn and 77Se/125Te, where possible), elemental analysis and single crystal X-ray structural analysis (7, 8, 10–13, 15–18). Thermogravimetric analysis (TGA) was used to probe the possible utility of complexes 6–8, 11–12 and 14–18 as single source Sn and SnCh precursors. The Sn(II) compounds 6 and 7 have been utilised in the growth of thin films by aerosol-assisted chemical vapor deposition (AACVD) at both 300 and 400 °C. The thin films have been analysed by pXRD, EDS, SEM and AFM and shown to be Sn metal. Subsequent studies provided film growth at temperatures as low as 200 °C. Similarly, the mono-chalcogenide systems 14, 16 and 18 have been utilised in the AACVD of thin films. These latter studies provided films, grown at 300 and 400 °C, which have also been analysed by pXRD, Raman spectroscopy, AFM, and SEM and are shown to comprise phase pure SnS, SnSe and SnTe, respectively. These preliminary results demonstrate the potential of such simple guanidinate complexes to act as single source precursors with a high degree of oxidative control over the deposited thin films.
Introduction
Over the past decade significant progress has been made in the synthesis of the p-type IV–VI semiconducting tin(II) chalcogenide materials SnS, SnSe and SnTe. These materials have the potential to be exploited in a range of applications including thermoelectric devices, microelectronics, superconducting crystals, rechargeable batteries and solar cells, because of their semiconductor properties and variable band gaps.1–3 The tin mono-chalcogenides ‘SnCh’ (Ch = S, Se and Te) have intense absorption across the electromagnetic spectrum, with the ground state phases exhibiting narrow band gaps (Ch = S, 1.1 eV (direct), 1.3 eV (indirect); Ch = Se, 0.9 eV (direct), 1.3 eV (indirect); Ch = Te, 0.18 eV).4 For optoelectronic applications, properties such as charge transfer and charge transport strongly depend on the morphology and crystallinity of the materials i.e. thin films vs. nanocrystals, size and surface quality.5,6 Literature over the past two decades shows quite clearly that the most critical and significant aspect of controlling the morphology of both thin films and nanocrystals is the selection of starting molecular precursors.7,8 It is this selection that determines subsequent features such as solvent and reaction temperature in the case of nanocrystal formation, and deposition procedure and deposition temperature in the case of thin film chemical vapor deposition (CVD).9Lewis et al. have recently reviewed routes to both thin film and nanoparticle IV–VI chalcogenide materials.3 A key feature in the development of successful precursors for phase pure Sn(II) chalcogenide materials is the ability to control the oxidation state of the tin during the deposition process, so as to suppress the production of higher oxidation state materials (i.e. Sn2S3 SnS2, Sn2Se3 and SnSe2), the presence of which can be detrimental to the performance of binary Sn(II) chalcogenide materials.3,10 The ability to control the formation of these materials is paramount and while large number of ligand systems have been developed in an attempt to do so, only a handful have been successful.
We have recently reported the development of single source precursors, for the exclusive production of phase pure SnO11,12 and SnS10,13 materials respectively, which display unprecedented oxidation state control. These compounds provide the necessary kinetic control over the tin oxidation state through the design of ligand systems which decompose under only mild thermal stimulus. A majority of these compounds are based around the modification of tin(II) bis (dimethylamide) by reaction with isocyanates or thioisocyanates, respectively.
The reactivity of tin(II) amides with other simple heterocumulenes CO2, COS and CS2 has also been the subject of investigation forming a range of products from Sn(II) alkoxides to Sn(II) carbamates, thio-carbamates and dithiocarbamates, depending on the nature of the metal amide.14–16
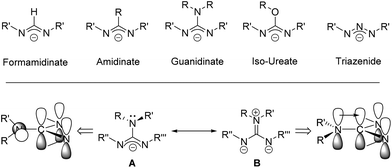
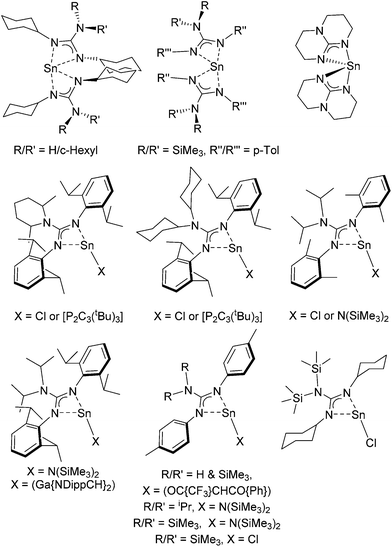
Guanidinate ligands, [R–NC(NR′R′′)N–R′′′]− are part of a wider family of N,N′-bidentate ligands, including formamidinate, amidinate, iso-ureate and triazenide ligands, built around a central sp2-hybridised carbon atom and a Y-shaped planar {CN3} core. For guanidinate ligands the possibility exists of significant lone-pair interaction and delocalisation of electron density from the {NR2} substituents into the {NCN} core; any such delocalisation has a substantive effect on the orientation of the both the {NR2} moiety, as shown in Scheme 1. Due to the variety of both {NR′′R′′′} and {NR′} groups these ligands offer great electronic flexibility due to the variable contributions of the two main resonance forms: 1,3-diazaallyl (A in Scheme 1) and iminium-diamide (B in Scheme 1), which are determined by the electronic requirements of the metal.17 Moreover, the steric bulk and electronic properties of guanidinate ligands can also be easily adjusted through the judicious choice of the organic substituents (R, R′, R′′ and R′′′). Consequently, these ligands display a rich coordination chemistry with most metals. While Sn(II) guanidinate complexes have been known for some time, their numbers are limited to a handful of systems which typically contain sterically bulky groups (Fig. 1).18–24
More recently Růžička et al. have described the insertion reaction of the bulky bis-[bis (trimethylsilyl)amino]tin with a range of carbodiimides to provide the corresponding homo- or heteroleptic tin(II) guanidinate complexes.25
Here we describe the reaction of tin(II) bis (dimethylamide) with a series of carbodiimides and the subsequent reactive chemistry of the resultant Sn(II) guanidinate complexes with sources of chalcogenides to form a family of Sn(IV) mono and poly-chalcogenide complexes. We also report the remarkable potential of these Sn(II) and Sn(IV) guanidinate complexes to act as single source precursors to thin films of metallic Sn(0) and tin(II) chalcogenide materials, SnCh (Ch = S, Se or Te), displaying extraordinary oxidative control over the phase distribution of CVD products.
Results and discussion
Synthesis and solid state studies of Sn(II) guanidinate systems
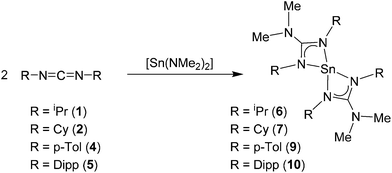
Reaction of the carbodiimides 1–5 (Schemes 2 and 3) in THF, with Sn(NMe2)2 in a 2![[thin space (1/6-em)]](https://www.rsc.org/images/entities/char_2009.gif) :
:![[thin space (1/6-em)]](https://www.rsc.org/images/entities/char_2009.gif) 1 molar ratio afforded the tin guanidinate complexes 6–10 (Scheme 2). Subsequent recrystallisation of the products from hexanes and storage at low temperature (−28 °C) resulted in the formation of crystalline materials suitable for single crystal X-ray diffraction in case of compounds 7–8 and 10. In the case of compounds 6 and 9, microcrystalline powders were isolated. In all cases the products were characterised by solution state NMR (1H, 13C and 119Sn) spectroscopy and elemental analysis.
1 molar ratio afforded the tin guanidinate complexes 6–10 (Scheme 2). Subsequent recrystallisation of the products from hexanes and storage at low temperature (−28 °C) resulted in the formation of crystalline materials suitable for single crystal X-ray diffraction in case of compounds 7–8 and 10. In the case of compounds 6 and 9, microcrystalline powders were isolated. In all cases the products were characterised by solution state NMR (1H, 13C and 119Sn) spectroscopy and elemental analysis.
In the case of complexes 6–7 and 9–10 the 1H NMR spectra contain a single resonance associated with {NMe2} at δ = 2.54 (6), 2.61 (7), 2.26 (9) and 1.96 (10) ppm. Accompanying resonances for the {C–H} moiety for the isopropyl and cyclohexyl groups can be clearly observed in the respective 1H NMR spectra of 6 and 7 (δ = 3.83 and 3.43 ppm respectively). Similarly, the methyl groups of the p-tolyl (δ = 2.08 ppm) and isopropyl groups of the {Dipp} substituents (δ = 1.18 (d), 1.25 (d) and 3.11(m) ppm) are also clearly observable.
In all cases the relative integrals of these resonances suggest an insertion into both tin amide bonds, and the formation of homoleptic tin(II) bis-guanidinate complexes (Scheme 2). The 13C {1H} NMR spectra are also informative, showing a single resonance for the quaternary carbon atom at the core of the guanidinate ligand, with chemical shift values at δ = 165.9 (6), 165.8 (7), 161.9 (9) and 160.4 ppm (10). The 119Sn {1H} NMR spectra also consist of single singlet resonances at δ = −382.5 (6), −380.9 (7) −350.5 (9) and −351.4 ppm (10) and are consistent with previously reported homoleptic Sn(II) guanidinates,25 and contrasts with that of the starting material at δ = +123.5 ppm. The elemental analyses for all compounds match the expected values for formation of the tin(II) homoleptic bis-guanidinate systems.
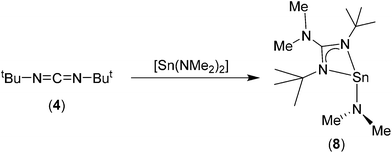
For bis-tbutyl-carbodiimide, 3, insertion into the {Sn–N} bonds of Sn(NMe2)2 appears to occur only once, irrespective of reaction ratio, resulting in the formation of the heteroleptic Sn(II) amino guanidinate complex, 8 (Scheme 3). We assume that this very selective reaction is a result of either electronic or more probably steric/kinetic factors. The 1H NMR spectrum of 8 clearly shows three singlet resonances in a ratio of 18![[thin space (1/6-em)]](https://www.rsc.org/images/entities/char_2009.gif) :
:![[thin space (1/6-em)]](https://www.rsc.org/images/entities/char_2009.gif) 6
6![[thin space (1/6-em)]](https://www.rsc.org/images/entities/char_2009.gif) :
:![[thin space (1/6-em)]](https://www.rsc.org/images/entities/char_2009.gif) 6 ratio consistent with presence of a single {Sn–NMe2} moiety (δ = 3.18 ppm) and a 1,3-di-tertbutyl-2-dimethylguanidinate ligand (δ = 1.1826 and 2.34 {NMe2} ppm). The 119Sn{1H} NMR spectrum of 8 consists of singlet resonances (δ = −121.0 ppm). While strikingly different to resonances reported for 6–7 and 9–10, this is consistent with the 119Sn{1H} NMR previously reported heteroleptic Sn(II) amino guanidinates.25 For compounds 6–10, elemental analysis is consistent with the structures deduced by NMR spectroscopy and the solid state observations. It should be noted that complexes 6 and 8 (low melting solid; m.p. 32 °C) are both susceptible to decomposition on standing (under Ar); making them unsuitable as thin film deposition precursors. In contrast, the cyclohexyl derivative, 7, and the aryl derivatives 9 and 10 show no signs of decomposition and can be stored for long periods.
6 ratio consistent with presence of a single {Sn–NMe2} moiety (δ = 3.18 ppm) and a 1,3-di-tertbutyl-2-dimethylguanidinate ligand (δ = 1.1826 and 2.34 {NMe2} ppm). The 119Sn{1H} NMR spectrum of 8 consists of singlet resonances (δ = −121.0 ppm). While strikingly different to resonances reported for 6–7 and 9–10, this is consistent with the 119Sn{1H} NMR previously reported heteroleptic Sn(II) amino guanidinates.25 For compounds 6–10, elemental analysis is consistent with the structures deduced by NMR spectroscopy and the solid state observations. It should be noted that complexes 6 and 8 (low melting solid; m.p. 32 °C) are both susceptible to decomposition on standing (under Ar); making them unsuitable as thin film deposition precursors. In contrast, the cyclohexyl derivative, 7, and the aryl derivatives 9 and 10 show no signs of decomposition and can be stored for long periods.
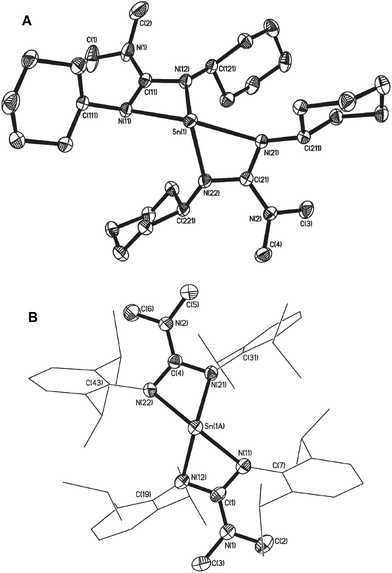
Single crystals of 7, 8 and 10 suitable for single crystal X-ray diffraction analysis were isolated. The result of these studies are consistent with our spectroscopic observations, revealing complexes 7 and 10 to be the four coordinate double insertion products (Fig. 2), and complex 8 to be the three coordinate mono-insertion product (Fig. 3). Selected bond lengths and angles for 7, 8 and 10 can be found in Table 1.
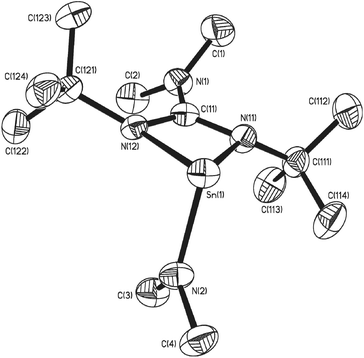 | ||
| Fig. 3 Molecular structure of one of the two molecules of complex 8 in the asymmetric unit cell. Hydrogen atoms have been omitted for clarity. Thermal ellipsoids are shown at 50% probability. | ||
| 7 | 10 | ||
|---|---|---|---|
| Bond lengths | |||
| Sn(1)–N(11) | 2.4149(12) | Sn(1A)–N(11) | 2.325(2) |
| Sn(1)–N(12) | 2.1780(12) | Sn(1A)–N(12) | 2.258(3) |
| Sn(1)–N(21) | 2.4149(12) | Sn(1A)–N(21) | 2.246(3) |
| Sn(1)–N(22) | 2.1895(12) | Sn(1A)–N(22) | 2.370(3) |
| C(11)–N(1) | 1.388(1) | C(1)–N(1) | 1.362(4) |
| C(21)–N(2) | 1.392(1) | C(4)–N(2) | 1.369(4) |
| Bond angles | |||
| N(11)–Sn(1)–N(21) | 138.39(4) | N(11)–Sn(1A)–N(22) | 127.90(9) |
| N(12)–Sn(1)–N(22) | 102.54(5) | N(12)–Sn(1A)–N(21) | 121.52(9) |
| N(11)–Sn(1)–N(12) | 58.03(4) | N(11)–Sn(1A)–N(12) | 58.10(9) |
| N(21)–Sn(1)–N(22) | 57.86(4) | N(21)–Sn(1A)–N(22) | 57.54(9) |
| 8 | |||
|---|---|---|---|
| Bond lengths | |||
| Sn(1)–N(11) | 2.272(2) | Sn(1)–N(2) | 2.053(2) |
| Sn(1)–N(12) | 2.214(2 | C(11)–N(1) | 1.380(3) |
| Bond angles | |||
| N(11)–Sn(1)–N(12) | 59.99(8) | ||
Complex 7 crystallises in the triclinic space group P![[1 with combining macron]](https://www.rsc.org/images/entities/char_0031_0304.gif) with one molecule in the asymmetric unit cell, whereas complexes 8 and 10 crystallise in the monoclinic space groups P21/a and P21/n respectively. In the case of complex 8 there are two molecules in the asymmetric unit cell. These complexes share many of the same gross structural features of previously structurally characterised Sn(II) guanidinates. As can be seen in Fig. 2, complex 7 possesses a geometry derived from a distorted trigonal bipyramid in which one equatorial vertex about the Sn(II) centre is occupied by a stereochemically active lone pair of electrons, and two nitrogen atoms of the guanidinate groups in pseudo-axial positions and two in pseudo-equatorial positions. The substantial distortion of pseudoaxial vector away from linearity is caused by the restricted bite angle of the ligands, typical of other amidinate and guanidinate compounds. The geometry about the Sn(II) centre in 10 is more accurately described as pseudo square based pyramidal despite the Sn–N bond lengths and bite angles in 10 being comparable to related 2,6-disopropylphenyl-substituted amidinate27,28 and formamidinate29 complexes in which the geometries are defined as distorted trigonal bipyramid.
with one molecule in the asymmetric unit cell, whereas complexes 8 and 10 crystallise in the monoclinic space groups P21/a and P21/n respectively. In the case of complex 8 there are two molecules in the asymmetric unit cell. These complexes share many of the same gross structural features of previously structurally characterised Sn(II) guanidinates. As can be seen in Fig. 2, complex 7 possesses a geometry derived from a distorted trigonal bipyramid in which one equatorial vertex about the Sn(II) centre is occupied by a stereochemically active lone pair of electrons, and two nitrogen atoms of the guanidinate groups in pseudo-axial positions and two in pseudo-equatorial positions. The substantial distortion of pseudoaxial vector away from linearity is caused by the restricted bite angle of the ligands, typical of other amidinate and guanidinate compounds. The geometry about the Sn(II) centre in 10 is more accurately described as pseudo square based pyramidal despite the Sn–N bond lengths and bite angles in 10 being comparable to related 2,6-disopropylphenyl-substituted amidinate27,28 and formamidinate29 complexes in which the geometries are defined as distorted trigonal bipyramid.
In the case of complex 8, mono insertion of a bis-tbutyl carbodiimide into a Sn–NMe2 bond results in the formation of the heteroleptic complex [{Me2NC(NtBu)2}Sn(NMe2)] (Fig. 3) in which the metal centre resides in a distorted pseudo tetrahedral environment with one vertex occupied by the stereoactive lone pair of electrons, resulting in a pyramidal array about the metal centre. The tin–guanidinate bonds are comparable to the nominally equatorial Sn–N bonds observed in complex 7 with only a very slight asymmetry. The terminal Sn–NMe2 bond in 8 (i.e. 2.053(2) Å) is comparable to that found in [Sn(μ2-NMe2)(NMe2)]2 (2.06 Å).30
The planarity of the {NCN} backbone within all three compounds, as indicated by the sum of angles about the {![[C with combining low line]](https://www.rsc.org/images/entities/char_0043_0332.gif) N3} backbone approaching 360°, signifies a high degree of π-electron delocalisation. This delocalisation of the π-bond in the {N–C–N} unit of the ligand is further reflected in the C–N bonds [average C–N between 1.33–1.34 Å]. However, this delocalisation appears to be restricted to the diazometallacylic fragment, as indicated by the C–N bonds between the exocyclic {NR2} groups and the {CN2} units, which show no evidence of shortening and increased multiple bond character.
N3} backbone approaching 360°, signifies a high degree of π-electron delocalisation. This delocalisation of the π-bond in the {N–C–N} unit of the ligand is further reflected in the C–N bonds [average C–N between 1.33–1.34 Å]. However, this delocalisation appears to be restricted to the diazometallacylic fragment, as indicated by the C–N bonds between the exocyclic {NR2} groups and the {CN2} units, which show no evidence of shortening and increased multiple bond character.
Strikingly, in the case of both complex 7 and 10 the sum of angles about one of the two nitrogen atoms in the guanidinate ligand, i.e. the axially coordinated nitrogen atoms, are less than 360° [7: ∑N(11) = 336.42(8)°, ∑N(21) = 339.39(8)°; 10: ∑N(11) = 340.7(3)°, ∑N(21) = 339.9(3)°] indicating a degree of pyramidalisation and sp3 character. In the case of 8, this pyramidalisation is even more pronounced, with both nitrogen atoms of the guanidinate displaying angles <360° [8: ∑N(11) = 354.1(2)°, ∑N(12) = 351.1(2)°, ∑N(21) = 352.5(2)°, ∑N(21) = 354.6(2)°], presumably a result of the steric encumbrance caused by the tBu groups, and their proximity to the {NMe2} moiety.
Oxidative additions to homoleptic Sn(II) guanidinates
The bis(amido) complexes, [M{HMDS}2] (M = Ge, Sn; HMDS = N(SiMe3)2), have been shown to undergo reaction with chalcogenide elements (Ch = S, Se, Te) to yield the bridged dimers [(μ-Ch)M{HMDS}2]2.31 The reaction of Sn(II) species with elemental chalcogens are typically unpredictable and can result in a range of systems including complexes containing both bridging and terminal {Ch2−} fragments as well as {Ch22−} and {Ch42−} groups. While transition metal complexes containing these types of ligand are numerous, there is a general paucity of examples containing main group metals. Noteworthy exceptions in this area are a series of tin complexes incorporating bulky aryl substituents, e.g., Tb(Mes)Sn(Ch)4, [Tb(Mes)Sn(μ-Ch)]2 and Bbt(Tb)Sn(Ch) (Ch = S, Se; Mes = mesityl; Tb = 2,4,6-[(SiMe3)2CH]3C6H2; Bbt = 2,6-[2′-((CH3)2CH)2C6H3]2C6H3) as well as the amidinate complexes [{MeC(NCy)2}2Sn(S)], [{tBuC(NCy)2}2Sn(S)] and [{MeC(NCy)2}(HMDS)Sn(S4)], and more recently the guanidinate complexes [{iPr2N(NDipp)2}(HMDS)Sn(μ-Se)]2 and [{iPr2N(NDipp)2}(HMDS)Sn(S4)] (Dipp = 2,6-(CH3)2CH)2C6H3).32–40Here, the reaction of equimolar amounts (1![[thin space (1/6-em)]](https://www.rsc.org/images/entities/char_2009.gif) :
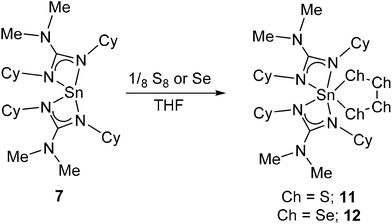
:![[thin space (1/6-em)]](https://www.rsc.org/images/entities/char_2009.gif) 1) of complex 7, with elemental sulfur or selenium powder, in THF (Scheme 4) respectively, results in the low yielding formation and isolation of the new complexes, 11 (10%) and 12 (15%) as intense yellow and orange crystals. In both cases, the 1H NMR spectra comprise of single resonances for the {NMe2} groups [11: δ = 2.32 ppm, 12: δ = 2.70 ppm] as well as NMR peaks associated with the cyclohexyl groups. Here, unlike the spectra of the starting material, 7, the 1H NMR spectra for 11 and 12 reveals the presence of 2 resonances associated with the {CH} moieties of the bis-cyclohexyl guanidinate ligand, indicating a degree of asymmetry in the product. This asymmetry is further confirmed with an inspection of the 13C NMR spectra for 11 and 12 respectively, which show the presence of 12 resonances associated with the {CH} and {CH2} groups on the bis-cyclohexyl guanidinate ligand. The 119Sn{1H} NMR spectrum of complex 11 displays a single resonances at δ = −383 ppm. In the case of the selenium derivertive, 12, the 119Sn{1H} NMR spectra clearly shows coupling between 119Sn and 77Se nuclei with the observation of a well-defined doublet [12: δ = −396 ppm, 2JSnSe = 3060 Hz]. Interrogation of the associated 77Se NMR spectra reveals the presence of two Se environments [12: δ = 131 ppm and 566 ppm (2JSeSn = 306 Hz)], only one of which displays evidence of Se–Sn coupling. Elemental analysis of complexes 11 and 12 are consistent with the formation of the 1,2,3,4,5-tetrachalcogenastannolane systems [{Me2NC(NCy)2}2Sn(Ch4)] Ch = S(11), or Se(12). Although several related structures containing {SnCh4} rings are known in the literature 119Sn and 77Se NMR data for these species is unreported.32,41
1) of complex 7, with elemental sulfur or selenium powder, in THF (Scheme 4) respectively, results in the low yielding formation and isolation of the new complexes, 11 (10%) and 12 (15%) as intense yellow and orange crystals. In both cases, the 1H NMR spectra comprise of single resonances for the {NMe2} groups [11: δ = 2.32 ppm, 12: δ = 2.70 ppm] as well as NMR peaks associated with the cyclohexyl groups. Here, unlike the spectra of the starting material, 7, the 1H NMR spectra for 11 and 12 reveals the presence of 2 resonances associated with the {CH} moieties of the bis-cyclohexyl guanidinate ligand, indicating a degree of asymmetry in the product. This asymmetry is further confirmed with an inspection of the 13C NMR spectra for 11 and 12 respectively, which show the presence of 12 resonances associated with the {CH} and {CH2} groups on the bis-cyclohexyl guanidinate ligand. The 119Sn{1H} NMR spectrum of complex 11 displays a single resonances at δ = −383 ppm. In the case of the selenium derivertive, 12, the 119Sn{1H} NMR spectra clearly shows coupling between 119Sn and 77Se nuclei with the observation of a well-defined doublet [12: δ = −396 ppm, 2JSnSe = 3060 Hz]. Interrogation of the associated 77Se NMR spectra reveals the presence of two Se environments [12: δ = 131 ppm and 566 ppm (2JSeSn = 306 Hz)], only one of which displays evidence of Se–Sn coupling. Elemental analysis of complexes 11 and 12 are consistent with the formation of the 1,2,3,4,5-tetrachalcogenastannolane systems [{Me2NC(NCy)2}2Sn(Ch4)] Ch = S(11), or Se(12). Although several related structures containing {SnCh4} rings are known in the literature 119Sn and 77Se NMR data for these species is unreported.32,41
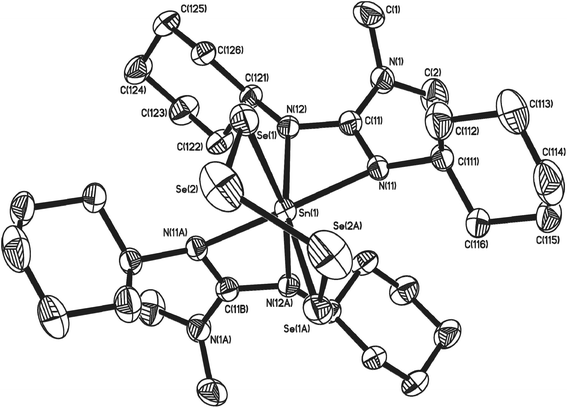
Structural parameters for complexes 11, 12 and 13 were determined by single crystal X-ray diffraction. Complexes 11 and 12 crystallise in the monoclinic space group C2/c. The asymmetric unit cell of 11 contains two molecules of complex, as well as one molecule of hexane. The asymmetric unit cell of 12 consists of one half of a molecule of complex and half a molecule of THF. Both molecules are essentially isostructural and show analogous gross structural features. Fig. 4 shows the molecular structure of complex 12 (the molecular structure of 11 is included in the ESI‡). Selected bond lengths and angles for complexes 11 and 12 are shown in Table 2.
| 11* | 12 | ||
|---|---|---|---|
| Bond lengths (Å) | |||
| Sn(1)–N(12) | 2.188(4) | Sn(1)–N(12) | 2.210(2) |
| Sn(1)–N(21) | 2.189(4) | Sn(1)–N(11) | 2.195(2) |
| Sn(1)–N(11) | 2.193(3) | ||
| Sn(1)–N(21) | 2.191(4) | ||
| Sn(1)–S(1) | 2.5017(14) | Sn(1)–Se(1) | 2.6322(3) |
| Sn(1)–S(4) | 2.5285(12) | ||
| S(1)–S(2) | 2.0597(19) | Se(1)–Se(2) | 2.3231(5) |
| S(4)–S(3) | 2.0558(19) | ||
| S(2)–S(3) | 2.057(2) | Se(2)–Se(2A) | 2.3340(10) |
| Bond angles (°) | |||
| S(1)–Sn–S(4) | 92.72(4) | Se(1)–Sn(1)–Se(1A) | 97.785(16) |
| N(12)–Sn(1)–N(22) | 145.29(14) | N(11)–Sn(1)–N(11A) | 144.70(12) |
| N(11)–Sn(1)–N(21) | 106.02(13) | N(12)–Sn(1)–N(12A) | 100.93(11) |
| N(11)–Sn(1)–N(12) | 61.05(13) | N(11)–Sn(1)–N(12) | 60.68(7) |
| N(21)–Sn(1)–N(22) | 60.93(15) | ||
In both complexes the Sn(IV) centre exhibits a distorted six-coordinate geometry consisting of two bidentate guanidinate ligands and two chalcogen atoms of the chelating tetrachalcogenide ligand, [Ch4]2−. The 5-membered {SnCh4} rings both reside in a distorted half chair conformation comparable to those observed by others.31,36,39,42
A comparison of the Sn–N bond lengths in 11 and 12 with those observed in the starting material 7, shows that with the change in oxidation state, from Sn(II) to Sn(IV) there is a concomitant general reduction in the Sn–N bond lengths. The change in environment also results in a “straightening” of the axial N–Sn–N vector in 7, from 138.39° to 145.29°(14) in 11, and 144.70(12), in 12 respectively. Whilst analysis of the bonding parameters within the guanidinate ligands of 7 and 11/12, reveals no significant differences in {C–N} bond lengths or {N–C–N} angles, the change in geometry about the Sn(IV) metal center results in a small, but significant, increase in the “bite angle” of the guanidinate ligands [11: 61.05(13)° and 60.93(15)°; 12: 60.68(7)°; cf.7: 58.03(4)° and 57.86(4)°]. As with the parent complex 7, it is the axial nitrogen atoms which experience the most significant pyramidalisation [11: ∑N(11) = 348.4(4)°, ∑N(12) = 356.5(4)°, ∑N(21) = 356.9(4)°, ∑N(22) = 350.5(4)°; 12: ∑N(11) = 349.2(1), ∑N(12) = 358.1(1)].
Subsequent reaction of 7 with S and Se using a stoichiometric ratio of 1![[thin space (1/6-em)]](https://www.rsc.org/images/entities/char_2009.gif) :
:![[thin space (1/6-em)]](https://www.rsc.org/images/entities/char_2009.gif) 4 (Sn
4 (Sn![[thin space (1/6-em)]](https://www.rsc.org/images/entities/char_2009.gif) :
:![[thin space (1/6-em)]](https://www.rsc.org/images/entities/char_2009.gif) Ch), resulted in the isolation of the same crystalline products 11 and 12, but in higher yields (11;65%, 12;68%).
Ch), resulted in the isolation of the same crystalline products 11 and 12, but in higher yields (11;65%, 12;68%).
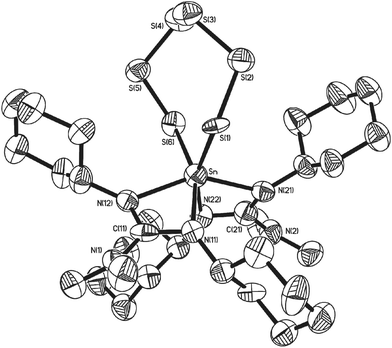
During the course of our investigations, co-crystals of the tetrathia complex 11 and the previously unreported 1,2,3,4,5,6,7-hexathiastannolane complex 13, in which the tin bears a [S62−] hexathia ligand, were also isolated and structurally characterised. Fig. 5 shows the major component, 13 (65%), of the asymmetric unit cell as determined by single crystal X-ray diffraction. The minor component, 11 (35%), has been omitted for clarity. Structural parameters such as the general environment about the {Sn-guanidinate} fragment are identical to those observed in 11. While there is no significant difference within the Sn–S distances [Sn(1)–S(1) = 2.457(11) Å; Sn(1)–S(6) = 2.571(15) Å] of complex 13, cf. 11, there is a significant difference in the S–Sn–S bite angle [S(1)–Sn(1)–S(6) = 107.1(3)°], a value which is consistent with the only other structurally characterised example of a hexathio ligand, [S62−], coordinated to a group 14 metal i.e. [(Dmp)(Dep)Ge(S6)] (Dmp = 2,6-dimesitylphenyl; Dep = 2,6,diethylyphenyl).41
Examination of the 1H NMR spectra showed no discernable difference between complexes 11 and 13 within the mixed sample, with a coincidental overlapping of resonances, perhaps not surprising given the close geometric similarities. However, inspection of both the 13C NMR and 119Sn NMR spectra shows the presence of two sets of resonances, a major and minor set: the 119Sn{1H} NMR spectra showed resonances at −383 ppm (minor) and −393.5 ppm (major), the latter of which we attribute to the hexathiastannolane complex, 13.
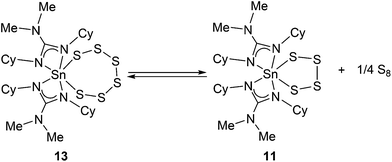
On standing, an NMR sample (CD2Cl2) of crystals of the co-crystallised 11 and 13 resulted in the slow release of elemental sulfur, i.e. S8 (identified by single crystal X-ray diffraction), suggesting that a thermodynamic equilibrium exists between 11 and 13, as shown in Scheme 5.
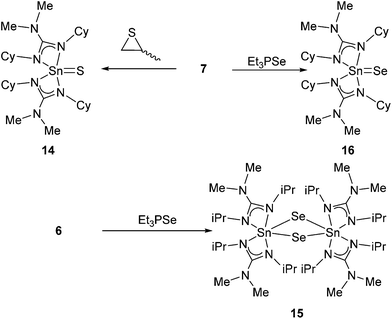
In an attempt to synthesise the mono thio- and seleno-systems {Sn![[double bond, length as m-dash]](https://www.rsc.org/images/entities/char_e001.gif) Ch}, complex 7 (and 6) were independently reacted with the single atom transfer reagents propylene sulfide and triethylphosphine selenide respectively (Scheme 6). Reaction of complex 6 with propylene sulfide results in the formation, and isolation, of yellow crystal of S8 (identified by single crystal X-ray diffraction). The precise mechanism by which S8 is formed is unclear, however, 1H, 13C and 119Sn NMR spectroscopy of the resulting reaction mixture all suggest decomposition of the complex.
Ch}, complex 7 (and 6) were independently reacted with the single atom transfer reagents propylene sulfide and triethylphosphine selenide respectively (Scheme 6). Reaction of complex 6 with propylene sulfide results in the formation, and isolation, of yellow crystal of S8 (identified by single crystal X-ray diffraction). The precise mechanism by which S8 is formed is unclear, however, 1H, 13C and 119Sn NMR spectroscopy of the resulting reaction mixture all suggest decomposition of the complex.
In contrast, reaction of 7 with propylene sulfide in THF under reflux conditions, followed by selective recrystallisation, away from unreacted starting material, results in the formation of a yellow microcrystalline powder (yield 75%). 119Sn NMR shows the presence of a single resonance at δ = −248 ppm, consistent with related species in the literature.33 Analysis (1H 13C 119Sn and elemental analysis) suggests this product, 14, to be a complex commensurate with the desired S![[thin space (1/6-em)]](https://www.rsc.org/images/entities/char_2009.gif) :
:![[thin space (1/6-em)]](https://www.rsc.org/images/entities/char_2009.gif) Sn ratio, with an empirical formula of [{Me2NC(NCy)2}2Sn
Sn ratio, with an empirical formula of [{Me2NC(NCy)2}2Sn![[double bond, length as m-dash]](https://www.rsc.org/images/entities/char_e001.gif) S]. A comparable reaction of 6 with propylene sulphide showed no evidence of formation of the mono-sulfide complex. Instead, reaction at elevated temperatures resulted in decomposition of 6.
S]. A comparable reaction of 6 with propylene sulphide showed no evidence of formation of the mono-sulfide complex. Instead, reaction at elevated temperatures resulted in decomposition of 6.
Reaction of complexes 6 and 7 respectively with the selenium transfer reagent, Et3P![[double bond, length as m-dash]](https://www.rsc.org/images/entities/char_e001.gif) Se, results in an obvious color change from yellow to orange, which on work up provides orange/yellow crystals in 72% (15) and 89% (16) yield. The 1H (and 13C) NMR spectra for complexes 15 and 16 are consistent with the related complex already discussed, showing the presence of asymmetry in the guanidinate ligands, as indicated by the presence of two {CH} resonances, in the 1H NMR spectra. The 77Se NMR spectra contain single resonance peaks from each system, with a greater downfield shift observed for the selenium centre in 15 [77Se δ = +787 ppm], compared to 16 [77Se δ = +476 ppm], and are comparable to those observed elsewhere.37 The 119Sn{1H} spectra show sharp singlet resonances for 15 [δ = −779 ppm (1J119Sn–77Se = 1329 Hz)] and 16 [δ = −566 ppm].34,43,44 In the latter case, it was not possible to detect 77Se–119Sn coupling.
Se, results in an obvious color change from yellow to orange, which on work up provides orange/yellow crystals in 72% (15) and 89% (16) yield. The 1H (and 13C) NMR spectra for complexes 15 and 16 are consistent with the related complex already discussed, showing the presence of asymmetry in the guanidinate ligands, as indicated by the presence of two {CH} resonances, in the 1H NMR spectra. The 77Se NMR spectra contain single resonance peaks from each system, with a greater downfield shift observed for the selenium centre in 15 [77Se δ = +787 ppm], compared to 16 [77Se δ = +476 ppm], and are comparable to those observed elsewhere.37 The 119Sn{1H} spectra show sharp singlet resonances for 15 [δ = −779 ppm (1J119Sn–77Se = 1329 Hz)] and 16 [δ = −566 ppm].34,43,44 In the latter case, it was not possible to detect 77Se–119Sn coupling.
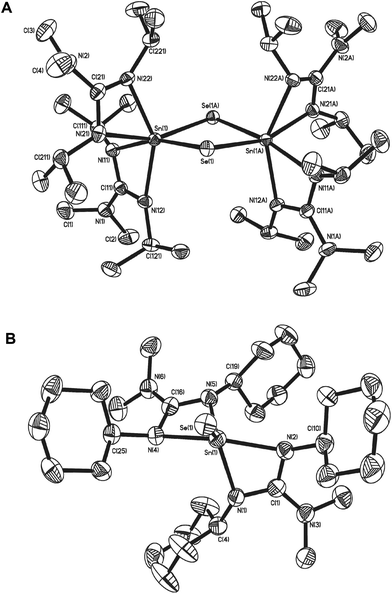
Fig. 6 shows the molecular structure of the two seleno-derivatives 15 and 16: complex 15 crystallises in the monoclinic space group C2/c with only half of the dimer present in the asymmetric unit cell. The second half of the dimer is generated by symmetry operators. Complex 16, crystallises in the monoclinic space group P21/a with one whole molecule in the asymmetric unit cell. Selected bond lengths and angles pertinent to the discussion of these complexes are shown in Table 3. From Fig. 6 it is clear that the most outstanding feature of complex 15 is its dimeric nature with a C2 axis perpendicular to the {Sn2Se2} ring. Both Sn atoms possess pseudo octahedral coordination geometries, with two slightly asymmetric Sn–Se distances [Sn(1)–Se(1) = 2.5796(3) Å; Sn(1)–Se(1A) = 2.5982(3) Å]. While similar to related Sn(IV)−μ-Se guanidinate complexes,42 these bonds are slightly longer than those found in [{(Me3Si)2N}2Sn(μ-Se)]2.31 Unlike [{(Me3Si)2N}2Sn(μ-Se)]2 the {Sn2Se2} ring in 15 is not planar, with saddle like geometry such that the Se atoms are raised out of the plane of the Sn atoms by approx. 0.255 Å, resulting in an obvious folding of the {Sn2Se2} ring at the {Se⋯Se} hinge [163.97°]. With this folding, the Sn–Se–Sn bond angle [88.636(9)°] widens, as the Se–Sn–Se [90.253(9)°] bond angles decrease compared to the corresponding angles in [{(Me3Si)2N}2Sn(μ-Se)]2 [i.e. 88.64(1)° and 95.10(1)° respectively]. In contrast, reaction of the cyclohexyl-derivative 7 with Et3P![[double bond, length as m-dash]](https://www.rsc.org/images/entities/char_e001.gif) Se results in the formation of the monomeric complex 16.
Se results in the formation of the monomeric complex 16.
| 15 | 16 | ||
|---|---|---|---|
| Bond lengths | |||
| Sn(1)–Se(1) | 2.5796(3) | Sn(1)–Se(1) | 2.4016(1) |
| Sn(1)–Se(1A) | 2.5982(3) | ||
| Sn(1)–N(11) | 2.209(2) | Sn(1)–N(1) | 2.168(4) |
| Sn(1)–N(12) | 2.242(2) | Sn(1)–N(2) | 2.212(4) |
| Sn(1)–N(21) | 2.265(2) | Sn(1)–N(3) | 2.230(4) |
| Sn(1)–N(22) | 2.183(2) | Sn(1)–N(5) | 2.139(4) |
| Bond angles | |||
| Sn(1)–Se(1)–Sn(1A) | 88.636(9) | ||
| Se(1)–Sn(1)–Se(1A) | 90.253(9) | ||
| N(11)–Sn(1)–N(12) | 59.87(7) | N(1)–Sn(1)–N(2) | 61.54(14) |
| N(21)–Sn(1)–N(22) | 60.21(8) | N(4)–Sn(1)–N(5) | 61.33(14) |
| N(11)–Sn(1)–N(21) | 89.29(8) | N(1)–Sn(1)–N(5) | 107.31(16) |
| N(12)–Sn(1)–N(22) | 146.87(8) | N(2)–Sn(1)–N(4) | 144.83(14) |
The molecular structure of 16 (Fig. 6), clearly displays a five coordinate tin centre, in which the coordination environment is provided by the two guanidinate ligands and the selenium atom. With a τ value of 0.63, the geometry about the central Sn atom is probably best described as distorted trigonal bipyramidal. The Sn–Se bond distance in 16 [2.4016(1) Å], lies between the values of 2.394(1) Å and 2.148(1) Å observed in the penta-coordinate Sn(IV) systems [(η4-Me8taa)Sn![[double bond, length as m-dash]](https://www.rsc.org/images/entities/char_e001.gif) Se]43 and [{C5H4NCH(SiMe3)}2SnSe]45 respectively; this is suggestive of a bond order which lies between the formal resonance structures [L2Sn
Se]43 and [{C5H4NCH(SiMe3)}2SnSe]45 respectively; this is suggestive of a bond order which lies between the formal resonance structures [L2Sn![[double bond, length as m-dash]](https://www.rsc.org/images/entities/char_e001.gif) Se] and [L2Sn+–Se−] the calculated values for which are 2.37 Å and 2.57 Å respectively.37
Se] and [L2Sn+–Se−] the calculated values for which are 2.37 Å and 2.57 Å respectively.37
While the bite angles for the {Me2NC(NCy)2} ligands in 16 [61.54(14)° and 61.33(14)°] are not significantly changed compared to related complexes reported here, the slightly smaller bite angles observed in 15 for the {Me2NC(NiPr)2} ligands [59.87(7)° and 60.21(8)°] are most probably due to the difference in coordination geometry about the central Sn atom, rather than any significant electronic effect.
As with previous complexes in this series, the nitrogen atoms within the guanidinate ligands experience some degree of pyramidalisation: in the case of complex 16 it is the axial nitrogen atoms N(2) and N(4) of the trigonal bipyramidal complex, which experience the most significant pyramidalisation [∑N(1) = 354.41°; ∑N(2) = 342.62°; ∑N(3) = 355.18°; ∑N(4) = 342.74°]. For the pseudo octahedral complex 15 it is the equatorial nitrogen atoms and N(22) [∑N(22) = 342.26°] and N(11) [∑N(11) = 354. 41°] which experience the highest degree of pyramidalisation.
Reaction of both 6 and 7, separately, with elemental Te in THF over 3 days at 70 °C, followed by filtration and recrystallisation, results in the formation of large cubic red crystals in yields of 72% and 86% respectively. Analysis of the isolated materials by 1H, 13C, 119Sn NMR spectroscopy and elemental analysis indicate the formation of mono-telluro complexes, [{Me2NC(NR)2}2Sn![[double bond, length as m-dash]](https://www.rsc.org/images/entities/char_e001.gif) Te] (R = iPr, 17 or Cy, 18). 1H and 13C NMR spectroscopy shows only relatively small changes in the chemical shifts upon reaction, with resonances associated with the {NMe2} moieties changing from δ = 2.54 ppm and 2.61 ppm in 6 and 7, to δ = 2.29 ppm and δ = 2.38 ppm in both 17 and 18 respectively. More significantly, the 119Sn{1H} spectra show changes in the chemical shift on reaction of 6 and 7 with tellurium from δ = −382 ppm (6) to −918 ppm (17) and δ = −381 ppm (7) to −925 ppm (18) respectively, with no discernable 125Te coupling observed. Interestingly, complexes 17 and 18 respectively, show only one resonance in the 1H NMR spectra associated with the {CH} moieties in the guanidinate ligands. Unfortunately, intensive investigation of the compounds using 125Te NMR spectroscopy failed to reveal the anticipated Te resonances, which may be found over very large chemical shift range.38,46
Te] (R = iPr, 17 or Cy, 18). 1H and 13C NMR spectroscopy shows only relatively small changes in the chemical shifts upon reaction, with resonances associated with the {NMe2} moieties changing from δ = 2.54 ppm and 2.61 ppm in 6 and 7, to δ = 2.29 ppm and δ = 2.38 ppm in both 17 and 18 respectively. More significantly, the 119Sn{1H} spectra show changes in the chemical shift on reaction of 6 and 7 with tellurium from δ = −382 ppm (6) to −918 ppm (17) and δ = −381 ppm (7) to −925 ppm (18) respectively, with no discernable 125Te coupling observed. Interestingly, complexes 17 and 18 respectively, show only one resonance in the 1H NMR spectra associated with the {CH} moieties in the guanidinate ligands. Unfortunately, intensive investigation of the compounds using 125Te NMR spectroscopy failed to reveal the anticipated Te resonances, which may be found over very large chemical shift range.38,46
Single crystal X-ray diffraction studies confirm the exclusive formation of the five coordinate systems 17 and 18, which crystallise from toluene in the monoclinic space groups P21/a and P21/n respectively. The molecular structures of 17 and 18, shown in Fig. 7, are very similar and clearly display five coordinate Sn centres, which are closer to trigonal bi-pyramidal than square based pyramidal (17: τ = 0.54, 18: τ = 0.61). Selected bond lengths and angles for complexes 17 and 18 are shown in Table 4. The Sn–Te bond distances of 2.6169(3) (17) and 2.6163(4) (18) are both smaller than the sum of the covalent radii of Sn (1.40 Å) and Te (1.37 Å), and, as with the terminal SnSe bond in 16, the SnTe bonds in 17 and 18 can be identified as having bond orders which lie between the formal resonance structures [L2Sn![[double bond, length as m-dash]](https://www.rsc.org/images/entities/char_e001.gif) Te] and [L2Sn+–Te−].37 The decrease in Sn–N distances (Table 4) in 17 and 18, compared to the starting materials 6 and 7 (Table 1) are a direct consequence of the change in oxidation state of the Sn centres from Sn(II) to Sn(IV).
Te] and [L2Sn+–Te−].37 The decrease in Sn–N distances (Table 4) in 17 and 18, compared to the starting materials 6 and 7 (Table 1) are a direct consequence of the change in oxidation state of the Sn centres from Sn(II) to Sn(IV).
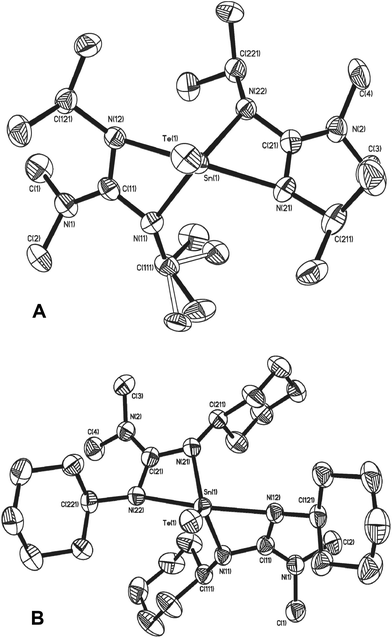 | ||
| Fig. 7 Molecular structures of complex 17 (A) and 18 (B). Solvent of crystallisation (toluene in 18) and hydrogen atoms have been omitted for clarity. | ||
| 17 | 18 | ||
|---|---|---|---|
| Bond lengths | |||
| Sn(1)–Te(1) | 2.6169(3) | Sn(1)–Te(1) | 2.6163(4) |
| Sn(1)–N(11) | 2.150(3) | Sn(1)–N(11) | 2.162(3) |
| Sn(1)–N(12) | 2.231(3) | Sn(1)–N(12) | 2.226(3) |
| Sn(1)–N(21) | 2.207(3) | Sn(1)–N(21) | 2.150(3) |
| Sn(1)–N(22) | 2.166(3) | Sn(1)–N(22) | 2.232(3) |
| Bond angles | |||
| N(11)–Sn(1)–N(22) | 111.10(10) | N(11)–Sn(1)–N(21) | 106.63(13) |
| N(12)–Sn(1)–N(21) | 142.58(10) | N(12)–Sn(1)–N(22) | 143.35(14) |
| N(11)–Sn(1)–N(12) | 61.24(10) | N(11)–Sn(1)–N(12) | 61.28(11) |
| N(21)–Sn(1)–N(22) | 61.42(10) | N(21)–Sn(1)–N(22) | 61.52(12) |
As with previous complexes in this series, the nitrogen atoms again occupy the axial positions about the Sn(VI) centre of the trigonal bipyramidal complexes, which experience the most significant pyramidisation [17: ∑N(12) = 341.40°, ∑N(22) = 343.39°; 18: ∑N(12) = 341.40°; ∑N(21) = 345.97°].
Thermal profile of complexes
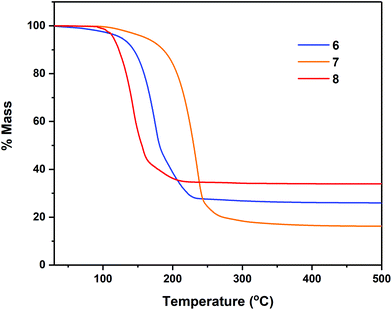
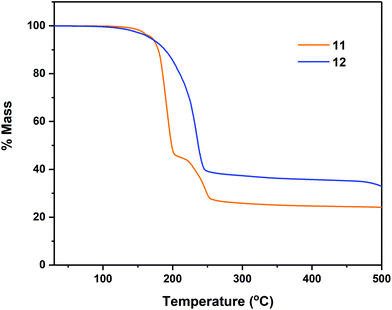
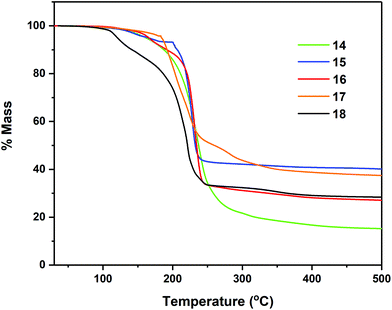
Thermogravimetric analyses (TGA) of complexes 7–8, 11–12 and 14–18 were performed in order to gain insight into relative volatilities and thermal stabilities of the compounds (Fig. 8, 9 and 10 respectively). Table 5 gathers germane data, relating to %-mass residues, expected %-mass residues, onset temperatures and melting points for these complexes.| Precursor | Expected % for residue (residue) | % Non-volatile residue (Temp.) | Onset Temp.a | Melting point |
|---|---|---|---|---|
| a The temperature at which 1% mass loss has occurred. | ||||
| 6 | 25.9 (Sn) | 25.9 (228 °C) | 115 °C | 57.5 °C |
| 7 | 19.2 (Sn) | 16.4 (205 °C) | 161 °C | 113 °C |
| 8 | 32.9 (Sn) | 34.0 (161 °C) | 92 °C | 32 °C |
| 11 | 20.1 (SnS) | 26.1 (289 °C) | 143 °C | 118 °C |
| 12 | 21.1 (SnSe) | 37.5 (295 °C) | 124 °C | 125 °C |
| 14 | 23.1 (SnS) | 18.6 (349 °C) | 121 °C | 149 °C |
| 15 | 41.9 (SnSe) | 40.7 (248 °C) | 210 °C | 124 °C |
| 16 | 28.3 (SnSe) | 27.6 (248 °C) | 201 °C | 115 °C |
| 17 | 36.7 (SnTe) | 38.1 (247 °C) | 180 °C | 61 °C |
| 18 | 33.2 (SnTe) | 28.3 (248 °C) | 150 °C | 101 °C |
Analyses were carried out with an instrument housed in a nitrogen filled purge-box in order to minimise reaction with atmospheric moisture/air. Compounds 6–7 (Fig. 8) were found to undergo mass loss to yield stable residues of between 34.0–16.4% over the temperature range 92–228 °C. In each case the % mass of the non-volatile residue is close to that expected for the formation of Sn metal. In the case of complex 7, a mass residue of 16.4% (vs. a calculated 19.2% for Sn formation) is suggestive of a small degree of volatility (Table 5).
In the case of the tetrachalcogenastannolane systems 11 and 12 (Fig. 9) we can clearly see where the tetrathiastannone complex 11 undergoes a well-defined multistep decomposition. In contrast the tetraselenastannolane 12, undergoes a single step decomposition process.
The multi-step decomposition process for 11 involves an initial mass loss of ∼3.5% between 128.1–164.7 °C. This initial reduction in mass is most likely loss of residual solvent of crystallisation (hexane) trapped in the microcrystalline powder used in the experiment. A second mass loss of ∼51.5% occurs between 164.7–216 °C, followed by a third mass loss of ∼18.3% (216.5–278.5 °C) to produce a residue of ∼26.1%. While the identity of the volatile fragments are unknown, a residual mass of 26.1% of the original mass is slightly higher than the value of 20.1% anticipated in the event of “SnS” formation. In contrast complex 12, which also contains solvent of crystallisation in the solid state (1 THF per asymmetric unit cell) shows only a single mass loss event of ∼61.4% between 124.4–295.0 °C, leaving a non-volatile residue of 37.5% of the original mass, a value significantly higher than the expected value of ∼21%, suggestive of “SnSe” formation. The cyclohexyl-derivatives 14, 16 and 18 all show multi-step decomposition pathways over differing temperature ranges. However, in all three cases the final mass residue is found to be less than that expected, for the formation “SnS”, “SnSe” or “SnTe” respectively, indicating a small degree of volatility. For the corresponding Se and Te isopropyl-derivatives (15 and 17), which show a much reduced stability, decomposing at room temperature over time, TGA similarly indicates multi-step decomposition pathways. In the case of 15, a % non-volatile mass residue of 40.7% is only slightly less than the expected value of 41.9% for “SnSe” formation. Contrastingly, 17 provides a % non-volatile mass residue (38.1%) higher than that expected for “SnTe” formation (36.7%).
On the basis of these data, complexes 7, 14, 16 and 18 have been investigated for application in the AA-CVD of phase pure Sn(0), Sn(II)S, Sn(II)Se and Sn(II)Te thin films respectively, rather than low pressure or atmospheric pressure CVD.
Thin film deposition and analysis
While AA-CVD has been used by others previously in attempts to produce phase pure SnS with only limited success,47–50 work specific to our laboratory has highlighted the utility of iso-thioureide Sn(II) complexes as low temperature AA-CVD precursors for the production of pure Sn(II) sulfide thin films.10 In an attempt to apply this approach to other precursors and the production of metallic tin and tin chalcogenide thin films, the stannous guanidinate complex, 6 and 7, and the chalcogenide derived stannic guanidinate complexes 14, 16 and 18 have been investigated.Thin films were initially deposited by AA-CVD on crystalline silicon substrates, under hot wall conditions with a TSI 3076 Constant Output Atomiser apparatus, as previously described, using argon at 20 psi to generate the Aerosol and to act as a carrier gas.10,12,51 Utilising a 0.033 M toluene solution, deposition was carried out at 300 °C and 400 °C, over 90 minutes, to provide a range of thin films. In the case of precursors 6 and 7 thin films with a metallic grey lustre were formed on both glass and c-Si at 300 °C and 400 °C. Over a period of 2 weeks and exposure to air these shiny metallic coatings tarnished, forming a yellow patina. Storage under an oxygen free atmosphere prevented this yellowing. For precursors 14, 16 and 18 deposition onto glass resulted in an obvious colouration of the surface.
Scanning electron microscope (SEM) images of the thin films produced from precursors 7, 14, 16 and 18 and deposited onto c-Si at 300 °C and 400 °C and glass at 400 °C, show non-continuous surface coverage at both 300 °C and 400 °C. However, coverage is increased at higher temperatures (Fig. S1: ESI‡). It was for this reason that only the thin films deposited at 400 °C were further interrogated by energy dispersive X-ray spectroscopy (EDS).
For the thin films produced from precursor 7, EDS analysis of the films deposited onto c-Si (Table S1: ESI‡) shows that the film consists of tin (97.35%) consistent with the formation of tin metal. For precursors 14, 16 and 18, the ratio of Sn![[thin space (1/6-em)]](https://www.rsc.org/images/entities/char_2009.gif) :
:![[thin space (1/6-em)]](https://www.rsc.org/images/entities/char_2009.gif) Ch was consistent with the formation of a potential 1
Ch was consistent with the formation of a potential 1![[thin space (1/6-em)]](https://www.rsc.org/images/entities/char_2009.gif) :
:![[thin space (1/6-em)]](https://www.rsc.org/images/entities/char_2009.gif) 1 product (albeit Sn rich in the case of both SnS and SnSe, and Te rich for SnTe; see Table S1, ESI‡). Despite low surface coverage pXRD was able to confirm Sn, SnS, SnSe and SnTe, respectively, as the only crystalline materials present in the thin films (Fig. S2: ESI‡).
1 product (albeit Sn rich in the case of both SnS and SnSe, and Te rich for SnTe; see Table S1, ESI‡). Despite low surface coverage pXRD was able to confirm Sn, SnS, SnSe and SnTe, respectively, as the only crystalline materials present in the thin films (Fig. S2: ESI‡).
In an attempt to reduce deposition time and increase surface coverage, the molarity of the toluene precursor solution was increased to 0.08 M and materials deposited at deposition temperatures of 300 and 400 °C for precursors 6, 7, 14, 16 (only 400 °C) and 18.
For the stannous guanidinate complexes 6 and 7, thin films with a metallic grey lustre were formed when deposited onto silicon substrates. SEM micrographs of the as deposited thin films reveal superior, and significantly greater coverage, and more densely packed surfaces from precursor 7cf. 6 (Fig. 11). pXRD analysis of the as-deposited thin films clearly show the presence of tetragonal metallic tin (JCPDS No. 89-2958), as indicated by the presence of peaks associated with the [200], [101], [220] and [211] Miller planes for metallic-Sn respectively (Fig. 12).52
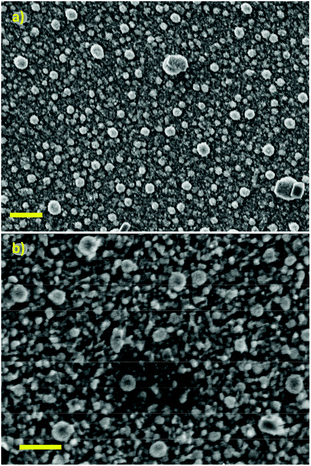 | ||
| Fig. 11 SEM micrographs of Sn films deposited onto silicon substrates at 400 °C using precursors 6 (a) or 7 (b) respectively. Scale bar = 1 μm. | ||
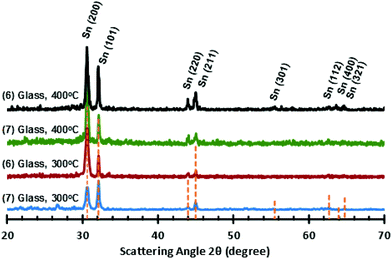 | ||
| Fig. 12 PXRD patterns for Sn films deposited onto glass at both 300 °C and 400 °C, from precursors (6) and (7), respectively. | ||
Energy dispersive X-ray spectroscopy (EDS) of the thin films deposited onto c-Si from precursor 7 at 400 °C, shows that the film consists mostly of tin (Sn: 89.36 At%; Si: 10.64 At%) although underlying Si-substrate can also be detected. Interestingly, for the thin film deposited from precursor 6 onto glass substrates at 400 °C, EDS shows a significant At% of oxygen (Sn: 40.77 At%; Si: 4.62 At%; O: 54.61 At%). The pXRD pattern also shows the presence of peaks associated with SnO formation.12
This observation was confirmed by Raman spectroscopy, with the spectra clearly showing peaks associated with SnO: B1g and A1g stretching modes at 105 cm−1 and 203 cm−1 respectively. It is presumed that the higher reaction temperature promotes SnO formation. It should be noted that while crystalline Sn metal should not generate a Raman signal, when samples are excited with a 532 nm laser at powers greater than 1%, the Raman spectra of the thin films begin to show the presence of distinct signals, attributed to SnO (B1g and A1g stretching modes), which becomes more intense with time (ESI: Fig. S4‡), presumably a result of laser induced reaction between atmospheric O2 and the tin metal.53
For complexes 14, 16 and 18, AA-CVD afforded a range of thin films: for complex 14 deposition at both 300 °C and 400 °C, results in thin films with non-continuous crystalline material deposited over the substrates. SEM images (see Fig. S4: ESI‡) of the thin film deposited at 300 °C clearly show randomly orientated needles. Contrastingly, at 400 °C the formation of more triangular block-like structures, from which needle like structures periodically emanate. EDS analysis of both films are consistent with a Sn![[thin space (1/6-em)]](https://www.rsc.org/images/entities/char_2009.gif) :
:![[thin space (1/6-em)]](https://www.rsc.org/images/entities/char_2009.gif) S ratio close to 1
S ratio close to 1![[thin space (1/6-em)]](https://www.rsc.org/images/entities/char_2009.gif) :
:![[thin space (1/6-em)]](https://www.rsc.org/images/entities/char_2009.gif) 1 (albeit Sn rich, Fig. S5/Table S2: ESI‡). pXRD analysis (Fig. S6: ESI‡) was unable to detect strong SnS peaks deposited onto the substrate at 300 °C.
1 (albeit Sn rich, Fig. S5/Table S2: ESI‡). pXRD analysis (Fig. S6: ESI‡) was unable to detect strong SnS peaks deposited onto the substrate at 300 °C.
However, analysis of the thin films deposited at 400 °C shows the presence of peaks associated with the deposition of orthorhombic α-SnS.10
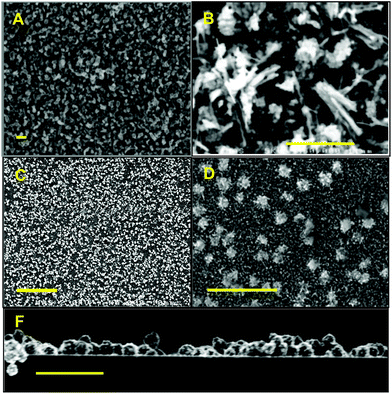
For complex 16, AA-CVD of a 0.08 M toluene solution onto a silicon substrate at 400 °C produced a reflective thin film with a visible jet-blue colour. At 300 °C, there was no discernible deposition, which was confirmed by SEM analysis. Interestingly, attempts to produce thin films on glass substrate at 300 °C also failed. Deposition at 400 °C, on glass, provided a non-uniform thin film with a non-reflective matt orange/amber colour. SEM images of the thin films grown on c-Si and glass substrate are shown in Fig. 13. Films grown onto c-Si substrates appear flat and generate a complete and uniform film coverage (Fig. 12A). Subsequently it was not possible to determine the crystallite size within the films deposited onto silicon from either SEM or AFM analysis since the samples consist of highly smooth surfaces (Rms = 1.94 nm) (Fig. S8: ESI‡) and no observable grain boundaries.
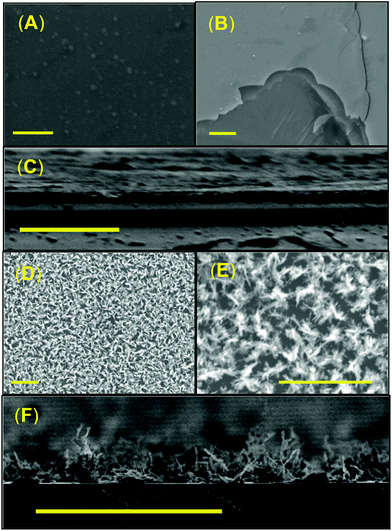 | ||
| Fig. 13 SEM micrographs of α-SnSe thin films deposited onto (A–C) silicon and glass (D–F) at 400 °C using precursor 12. Scale bars = 0.5 μm. | ||
At first sight it appeared that deposition was unsuccessful, however EDS measurements (ESI‡) confirmed the presence of tin and selenium across the sample surface in an approximate 1![[thin space (1/6-em)]](https://www.rsc.org/images/entities/char_2009.gif) :
:![[thin space (1/6-em)]](https://www.rsc.org/images/entities/char_2009.gif) 1 stoichiometry. Furthermore, closer examination of the substrate edge (Fig. 12B) presents morphological features such as cracks, delamination, and fractures, which makes it possible to clearly visualise the deposited film and measure its thickness. Cross section SEM analysis of the thin film interface shows that the films to be approximately ∼70 nm thick. Inspection of the micrographs of the thin films deposited onto glass (D–F) in Fig. 12, reveal a very different morphology and much rougher surface (Rms = 11.3 nm). SEM images show the presence of dispersed nano-crystalline structures. (Fig. 12D–F): crystallites are ∼1–2 nm by ∼4–5 nm, with a protruding length of up to ∼100 nm. EDS analysis show these crystallites consist of tin and selenium in an approximate 1
1 stoichiometry. Furthermore, closer examination of the substrate edge (Fig. 12B) presents morphological features such as cracks, delamination, and fractures, which makes it possible to clearly visualise the deposited film and measure its thickness. Cross section SEM analysis of the thin film interface shows that the films to be approximately ∼70 nm thick. Inspection of the micrographs of the thin films deposited onto glass (D–F) in Fig. 12, reveal a very different morphology and much rougher surface (Rms = 11.3 nm). SEM images show the presence of dispersed nano-crystalline structures. (Fig. 12D–F): crystallites are ∼1–2 nm by ∼4–5 nm, with a protruding length of up to ∼100 nm. EDS analysis show these crystallites consist of tin and selenium in an approximate 1![[thin space (1/6-em)]](https://www.rsc.org/images/entities/char_2009.gif) :
:![[thin space (1/6-em)]](https://www.rsc.org/images/entities/char_2009.gif) 1 stoichiometry, as expected for SnSe deposition.
1 stoichiometry, as expected for SnSe deposition.
These observations rationalise the optical appearances of the two samples: for uniform “flat” films deposited onto silicon a reflective ‘jet-blue’ coating is observed. Films grown onto glass are non-reflective, uniform with an orange/amber matt appearance. The unambiguous differences of “SnSe” film growth mechanism on c-Si and SiO2 are attributed to differing surface/precursor interactions and subsequent growth mechanisms. For both thin films Raman spectroscopy and pXRD analysis confirm the production of SnSe (Fig. 14), specifically the phase pure orthorhombic (Pnma) α-SnSe phase (JCPDS: 48-1224).54 The Raman spectra of the films grown at 400 °C do show the presence of a very weak and broad peak at 187 cm−1 which could correspond to the A1g mode of SnSe2.55 However, associated peaks are not observed in the pXRD analysis (Fig. 14).
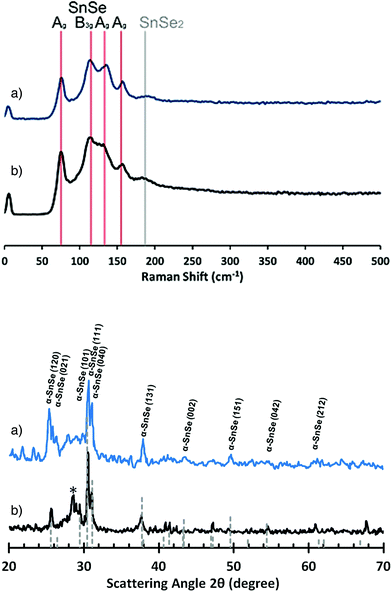 | ||
| Fig. 14 Raman spectra (top) and PXRD patterns (bottom) for SnSe films deposited from (16) onto glass (a) or silicon (b) at 400 °C. *Unknown peak. | ||
For precursor 18, thin films grown on glass (300 °C and 400 °C) are reflective with an orange/amber appearance. For thin films grown on silicon (300 °C and 400 °C) the films are visibly less uniform with a matt like orange appearance to the eye. SEM images of thin films deposited onto glass and silicon at both 300 °C and 400 °C, are shown in Fig. 15. For thin films deposited onto glass at 300 °C and 400 °C and silicon at 300 °C, the thin films are non-continuous and appear to consist of small crystallites. In the case of the thin film deposited onto silicon at 400 °C, however, the film is composed of compacted crystalline spherulites (∼0.1 μm in diameter). These observations are consistent with AFM analysis of the films which show RMS values between from 40 to 6 nm across all the “SnTe” samples (see ESI‡) (Fig. 16).
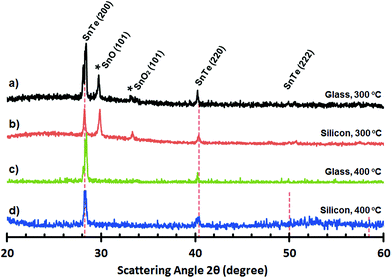 | ||
| Fig. 16 PXRD plots of “SnTe” deposited from (18) onto glass (a and c) and silicon (b and d) at 300 °C and 400 °C, respectively. | ||
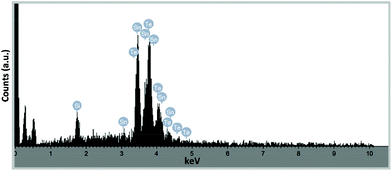
Analysis by pXRD of all four films (300 and 400 °C on glass and Si) show the presence of reflections arising from the [200] and [220] Miller planes associated with cubic-Fm3m SnTe (JCPDS: 48-1224).56 However, in the case of the thin film deposited onto glass at both 300 °C and 400 °C and onto silicon at 300 °C the pXRD plot also shown reflections which can be attributed to the presence of trigonal SnO and SnO2.57 EDS analysis of the pure “SnTe” thin film (glass/400 °C) confirms the presence of Sn and Te in close to stoichiometric amounts [Sn = 45.85 at% (48.67 ± 1.71 wt%); Te = 42.40 at% (48.38 ± 1.71 wt%)], with only underlying silicon observable in the elemental analysis [Si = 11.75 at% (2.95 ± 0.43 wt%)] (Fig. 17).
To the best of our knowledge similar spherulite production for either SnS, SnSe or SnTe has not previously been noted. What we believe is remarkable here is the regularity in size of the SnTe spherulites. Our working hypothesis with respect to spherulite formation is that the precursor 18 decomposes in a gas phase process, rather than a surface-up growth process. Spherulites thus form in the gas phase, where their nucleation and growth time is limited by mass transport. Furthermore as a certain mass point is approached the spherulites are deposited onto the substrate surface. We are currently further investigating this process for the production of SnTe nano-spheres.
Conclusions
Four homoleptic tin(II) guanidinates were prepared by reactions of the appropriate carbodiimides with the stannylene [Sn(NMe2)2] with high yields under very mild conditions. In the case of the bis-tbutyl-carbodiimide only the mono insertion product is isolated. The structures of three of these Sn(II) guanidinate complexes (7, 8 and 10) were determined by X-ray diffraction methods. Reaction of the Sn(II) guanidinate complexes 6 and 7, with the elemental chalcogenides S, Se and Te, and the atom transfer reagents SC3H6 and Se![[double bond, length as m-dash]](https://www.rsc.org/images/entities/char_e001.gif) PEt3 respectively (oxidising the metal from the +2 to +4 oxidation state) result in the formation of the cyclic tetrasulphido Sn(IV) complex, 11, the cyclic tetraselenido Sn(IV) complex, 13, the μ-seleno tin(IV) complex bearing a four membered {Sn2Se2} ring, 15, and the Sn(IV) mono-chalcogenide {Sn
PEt3 respectively (oxidising the metal from the +2 to +4 oxidation state) result in the formation of the cyclic tetrasulphido Sn(IV) complex, 11, the cyclic tetraselenido Sn(IV) complex, 13, the μ-seleno tin(IV) complex bearing a four membered {Sn2Se2} ring, 15, and the Sn(IV) mono-chalcogenide {Sn![[double bond, length as m-dash]](https://www.rsc.org/images/entities/char_e001.gif) Ch} complexes, 16, 17 and 18. Based on the results of thermogravimetric analysis, selected complexes i.e.6–7 and 14, 16 and 18, have been utilised in the growth of thin films by AA-CVD. These latter studies provided film growth at temperatures 300 and 400 °C. The films have been analysed by pXRD, Raman spectroscopy, AFM, and SEM and are shown to comprise primarily of Sn metal (precursors 6 and 7), orthorhombic (Herzenbergite) phase of SnS (14) and SnSe (16), and the cubic phase of SnTe (18). What is remarkable is the observation that the Sn(II) guanidinate complexes (6 and 7) form Sn metal in a two-electron reduction. Similarly the Sn(IV) {Sn
Ch} complexes, 16, 17 and 18. Based on the results of thermogravimetric analysis, selected complexes i.e.6–7 and 14, 16 and 18, have been utilised in the growth of thin films by AA-CVD. These latter studies provided film growth at temperatures 300 and 400 °C. The films have been analysed by pXRD, Raman spectroscopy, AFM, and SEM and are shown to comprise primarily of Sn metal (precursors 6 and 7), orthorhombic (Herzenbergite) phase of SnS (14) and SnSe (16), and the cubic phase of SnTe (18). What is remarkable is the observation that the Sn(II) guanidinate complexes (6 and 7) form Sn metal in a two-electron reduction. Similarly the Sn(IV) {Sn![[double bond, length as m-dash]](https://www.rsc.org/images/entities/char_e001.gif) Ch} containing complexes, 14, 16 and 18, also undergo a two-electron reduction to form SnS, SnSe and SnTe, respectively with no observable trace of higher oxidation state Sn(IV) containing materials, in the thin films (Scheme 7).
Ch} containing complexes, 14, 16 and 18, also undergo a two-electron reduction to form SnS, SnSe and SnTe, respectively with no observable trace of higher oxidation state Sn(IV) containing materials, in the thin films (Scheme 7).
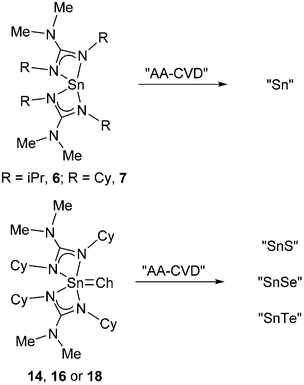 | ||
| Scheme 7 Oxidative controlled two-electron reduction of Sn(II) and Sn(IV) guanidinate complexes 6–7, 14, 16 and 18. | ||
Single guanidinate ligands, and the related acetamidimide ligands, are already know to facilitate the one-electron reduction of Cu(I) to Cu(0) in the CVD and ALD of metallic copper films.58–61 On the basis of our observations, it would appear that the reductive behaviour of these ligands is part of a more extensive and general thermal chemistry. Armed with these results we are further investigating the potential of such simple carbodiimide derivatives to act as single source precursors to a wider range of useful metal and metal chalcogenide thin film materials. We are also currently investigating the utility of complexes 14, 16 and 18 in the solvo-thermal synthesis of nanoparticles, which will be reported elsewhere.62
Experimental section
General information
All reactions were carried out using standard Schlenk line and glovebox techniques under an inert atmosphere of argon and nitrogen, respectively. Tetrahydrofuran (THF) was dried over potassium before isolating via distillation. Hexanes and toluene solvents were dried using a commercially available solvent purification system (Innovative Technology Inc., Amesbury, MA, USA) and all solvents were degassed under argon prior to use. Deuterated benzene (C6D6) and deuterated THF (THF-d8) NMR solvent were purchased from Fluorochem, Hadfield, U.K., and dried over potassium before isolating via vacuum distillation. All dry solvents were stored under argon in Young's ampules over 4 Å molecular sieves. All reagents were purchased from Sigma-Aldrich and used as supplied. The starting materials, di-isopropylcarbodiimide, di-cyclohexylcarbodiimide, di-tert-butylcarbodiimide, di-tolylcarbodiimide, bis (2,6-diisopropylphenyl)carbodiimide, propylene sulphide, elemental sulphur, selenium and tellurium were purchased from commercial sources and used as received. Tetrakis(dimethylamido)ditin(II) and triethylphosphine selenide were synthesised according to literature procedures.NMR experiments were conducted in Youngs’ tap NMR tubes, prepared and sealed in a glovebox with an argon atmosphere. For all experiments THF-d8 was used as the NMR solvent. NMR data were collected at 25 °C either using a Bruker AV-300 spectrometer operating at 300.22 MHz (1H), 75.49 MHz (13C) or a Bruker AV-500 spectrometer at 186.36 MHz (119Sn), 95.34 MHz (77Se) and 157.98 MHz (125Te) MHz MHz. Chemical shifts were given in parts per million and referenced internally to residual non-deuterated solvent resonances. Melting Points were determined using a Stuart SMP10 melting point apparatus. Elemental analyses were performed externally by London Metropolitan University Elemental Analysis Service, U.K.
Synthesies
![[M with combining low line]](https://www.rsc.org/images/entities/char_004d_0332.gif)
![[e with combining low line]](https://www.rsc.org/images/entities/char_0065_0332.gif) 2, 3JHH 6.3 Hz), 2.54 (s, 12H, N
2, 3JHH 6.3 Hz), 2.54 (s, 12H, N![[M with combining low line]](https://www.rsc.org/images/entities/char_004d_0332.gif)
![[e with combining low line]](https://www.rsc.org/images/entities/char_0065_0332.gif) 2), 3.83 (sept, 4H,
2), 3.83 (sept, 4H, ![[C with combining low line]](https://www.rsc.org/images/entities/char_0043_0332.gif) HMe2, 3JHH 6.3 Hz). 13C{1H} NMR (75.5 MHz, C6D6) δ 25.9 (CH
HMe2, 3JHH 6.3 Hz). 13C{1H} NMR (75.5 MHz, C6D6) δ 25.9 (CH![[M with combining low line]](https://www.rsc.org/images/entities/char_004d_0332.gif)
![[e with combining low line]](https://www.rsc.org/images/entities/char_0065_0332.gif) 2), 40.1 (
2), 40.1 (![[C with combining low line]](https://www.rsc.org/images/entities/char_0043_0332.gif)
![[H with combining low line]](https://www.rsc.org/images/entities/char_0048_0332.gif) Me2), 47.7(N
Me2), 47.7(N![[M with combining low line]](https://www.rsc.org/images/entities/char_004d_0332.gif)
![[e with combining low line]](https://www.rsc.org/images/entities/char_0065_0332.gif) 2) 165.9 (N–
2) 165.9 (N–![[C with combining low line]](https://www.rsc.org/images/entities/char_0043_0332.gif) –N); 119Sn{1H} NMR (186.36 MHz, C6D6): δSn −382.5.
–N); 119Sn{1H} NMR (186.36 MHz, C6D6): δSn −382.5.
![[M with combining low line]](https://www.rsc.org/images/entities/char_004d_0332.gif)
![[e with combining low line]](https://www.rsc.org/images/entities/char_0065_0332.gif) 2), 3.43 (m, 2H, NC
2), 3.43 (m, 2H, NC![[H with combining low line]](https://www.rsc.org/images/entities/char_0048_0332.gif) C5H10). 13C{1H} NMR (75.5 MHz, C6D6): δC 26.5 (Cy-
C5H10). 13C{1H} NMR (75.5 MHz, C6D6): δC 26.5 (Cy-![[C with combining low line]](https://www.rsc.org/images/entities/char_0043_0332.gif) H), 27.1 (Cy-
H), 27.1 (Cy-![[C with combining low line]](https://www.rsc.org/images/entities/char_0043_0332.gif) H), 36.5 (Cy-
H), 36.5 (Cy-![[C with combining low line]](https://www.rsc.org/images/entities/char_0043_0332.gif) H), 40.4 (NMe2), 56.6 (N-
H), 40.4 (NMe2), 56.6 (N-![[C with combining low line]](https://www.rsc.org/images/entities/char_0043_0332.gif) HC5H10), 165.8 (N–
HC5H10), 165.8 (N–![[C with combining low line]](https://www.rsc.org/images/entities/char_0043_0332.gif) –N); 119Sn{1H} NMR (186.36 MHz, C6D6): δSn −380.9.
–N); 119Sn{1H} NMR (186.36 MHz, C6D6): δSn −380.9.
![[M with combining low line]](https://www.rsc.org/images/entities/char_004d_0332.gif)
![[e with combining low line]](https://www.rsc.org/images/entities/char_0065_0332.gif) 3), 2.34 (s, 6H, N
3), 2.34 (s, 6H, N![[M with combining low line]](https://www.rsc.org/images/entities/char_004d_0332.gif)
![[e with combining low line]](https://www.rsc.org/images/entities/char_0065_0332.gif) 2), 3.18 (s, 6H, MN
2), 3.18 (s, 6H, MN![[M with combining low line]](https://www.rsc.org/images/entities/char_004d_0332.gif)
![[e with combining low line]](https://www.rsc.org/images/entities/char_0065_0332.gif) 2). 13C{1H} NMR (75.5 MHz, C6D6): δc 31.7 (C
2). 13C{1H} NMR (75.5 MHz, C6D6): δc 31.7 (C![[M with combining low line]](https://www.rsc.org/images/entities/char_004d_0332.gif)
![[e with combining low line]](https://www.rsc.org/images/entities/char_0065_0332.gif) 3), 42.7 (N
3), 42.7 (N![[M with combining low line]](https://www.rsc.org/images/entities/char_004d_0332.gif)
![[e with combining low line]](https://www.rsc.org/images/entities/char_0065_0332.gif) 2), 51.8 (
2), 51.8 (![[C with combining low line]](https://www.rsc.org/images/entities/char_0043_0332.gif) Me3), 54.5 (NN
Me3), 54.5 (NN![[M with combining low line]](https://www.rsc.org/images/entities/char_004d_0332.gif)
![[e with combining low line]](https://www.rsc.org/images/entities/char_0065_0332.gif) 2), 166.7 (N–
2), 166.7 (N–![[C with combining low line]](https://www.rsc.org/images/entities/char_0043_0332.gif) –N); 119Sn{1H} NMR (186.36 MHz, C6D6): δSn −121.0.
–N); 119Sn{1H} NMR (186.36 MHz, C6D6): δSn −121.0.
![[M with combining low line]](https://www.rsc.org/images/entities/char_004d_0332.gif)
![[e with combining low line]](https://www.rsc.org/images/entities/char_0065_0332.gif) ), 2.22 (s, 12H, N
), 2.22 (s, 12H, N![[M with combining low line]](https://www.rsc.org/images/entities/char_004d_0332.gif)
![[e with combining low line]](https://www.rsc.org/images/entities/char_0065_0332.gif) 2), 6.91 (d, 8H, Aryl-C
2), 6.91 (d, 8H, Aryl-C![[H with combining low line]](https://www.rsc.org/images/entities/char_0048_0332.gif) , 3JHH 8.2 Hz), 7.04 (d, 8H, Aryl-C
, 3JHH 8.2 Hz), 7.04 (d, 8H, Aryl-C![[H with combining low line]](https://www.rsc.org/images/entities/char_0048_0332.gif) , 3JHH 7.93 Hz). 13C {1H} NMR- (75.5 MHz, C6D6) δ 19.6 (Aryl-
, 3JHH 7.93 Hz). 13C {1H} NMR- (75.5 MHz, C6D6) δ 19.6 (Aryl-![[M with combining low line]](https://www.rsc.org/images/entities/char_004d_0332.gif)
![[e with combining low line]](https://www.rsc.org/images/entities/char_0065_0332.gif) ), 37.8 (N
), 37.8 (N![[M with combining low line]](https://www.rsc.org/images/entities/char_004d_0332.gif)
![[e with combining low line]](https://www.rsc.org/images/entities/char_0065_0332.gif) 2), 122.9 (Aryl-
2), 122.9 (Aryl-![[C with combining low line]](https://www.rsc.org/images/entities/char_0043_0332.gif) ), 128.0 (Aryl-
), 128.0 (Aryl-![[C with combining low line]](https://www.rsc.org/images/entities/char_0043_0332.gif) ), 129.2 (Aryl-
), 129.2 (Aryl-![[C with combining low line]](https://www.rsc.org/images/entities/char_0043_0332.gif) ), 144.4 (Aryl-
), 144.4 (Aryl-![[C with combining low line]](https://www.rsc.org/images/entities/char_0043_0332.gif) ), 161.9 (s, 1 C, N–
), 161.9 (s, 1 C, N–![[C with combining low line]](https://www.rsc.org/images/entities/char_0043_0332.gif) –N); 119Sn{1H} NMR (186.36 MHz, C6H6) δSn −350.5.
–N); 119Sn{1H} NMR (186.36 MHz, C6H6) δSn −350.5.
![[M with combining low line]](https://www.rsc.org/images/entities/char_004d_0332.gif)
![[e with combining low line]](https://www.rsc.org/images/entities/char_0065_0332.gif) 2, 3JHH 9 Hz), 1.25 (d, 12 H, CH
2, 3JHH 9 Hz), 1.25 (d, 12 H, CH![[M with combining low line]](https://www.rsc.org/images/entities/char_004d_0332.gif)
![[e with combining low line]](https://www.rsc.org/images/entities/char_0065_0332.gif) 2, 3JHH 9 Hz), 3.11 (m, 4H,
2, 3JHH 9 Hz), 3.11 (m, 4H, ![[C with combining low line]](https://www.rsc.org/images/entities/char_0043_0332.gif)
![[H with combining low line]](https://www.rsc.org/images/entities/char_0048_0332.gif) Me2), 3.73 (s, 6H, N
Me2), 3.73 (s, 6H, N![[M with combining low line]](https://www.rsc.org/images/entities/char_004d_0332.gif)
![[e with combining low line]](https://www.rsc.org/images/entities/char_0065_0332.gif) 2), 7.13 (m, 2H, C–H aryl).7.26 (m, 4H, C–H aryl) 13C {1H} NMR- (75.5 MHz, d8-THF) δ 22.2 (CH
2), 7.13 (m, 2H, C–H aryl).7.26 (m, 4H, C–H aryl) 13C {1H} NMR- (75.5 MHz, d8-THF) δ 22.2 (CH![[M with combining low line]](https://www.rsc.org/images/entities/char_004d_0332.gif)
![[e with combining low line]](https://www.rsc.org/images/entities/char_0065_0332.gif) 2), 24.1 (CH
2), 24.1 (CH![[M with combining low line]](https://www.rsc.org/images/entities/char_004d_0332.gif)
![[e with combining low line]](https://www.rsc.org/images/entities/char_0065_0332.gif) 2), 28.5 (
2), 28.5 (![[C with combining low line]](https://www.rsc.org/images/entities/char_0043_0332.gif) HMe2) 38.7 (N
HMe2) 38.7 (N![[M with combining low line]](https://www.rsc.org/images/entities/char_004d_0332.gif)
![[e with combining low line]](https://www.rsc.org/images/entities/char_0065_0332.gif) 2), 122.6 (Aryl-
2), 122.6 (Aryl-![[C with combining low line]](https://www.rsc.org/images/entities/char_0043_0332.gif) ), 124.4 (Aryl-
), 124.4 (Aryl-![[C with combining low line]](https://www.rsc.org/images/entities/char_0043_0332.gif) ), 132.5 (Aryl-
), 132.5 (Aryl-![[C with combining low line]](https://www.rsc.org/images/entities/char_0043_0332.gif) ) and 141.9 (Aryl-
) and 141.9 (Aryl-![[C with combining low line]](https://www.rsc.org/images/entities/char_0043_0332.gif) ), 160.4 (N–
), 160.4 (N–![[C with combining low line]](https://www.rsc.org/images/entities/char_0043_0332.gif) –N); 119Sn{1H} NMR (186.36 MHz, d8-THF) δSn −351.4.
–N); 119Sn{1H} NMR (186.36 MHz, d8-THF) δSn −351.4.
![[M with combining low line]](https://www.rsc.org/images/entities/char_004d_0332.gif)
![[e with combining low line]](https://www.rsc.org/images/entities/char_0065_0332.gif) 2), 3.15 (m, 2H, NC
2), 3.15 (m, 2H, NC![[H with combining low line]](https://www.rsc.org/images/entities/char_0048_0332.gif) C5H10), 3.29 (m, 2H, NC
C5H10), 3.29 (m, 2H, NC![[H with combining low line]](https://www.rsc.org/images/entities/char_0048_0332.gif) C5H10);13C{1H} NMR (75.5 MHz, C6D6): δ 26.17 (Cy-
C5H10);13C{1H} NMR (75.5 MHz, C6D6): δ 26.17 (Cy-![[C with combining low line]](https://www.rsc.org/images/entities/char_0043_0332.gif) H), 26.25 (Cy-
H), 26.25 (Cy-![[C with combining low line]](https://www.rsc.org/images/entities/char_0043_0332.gif) H), 26.44 (Cy-
H), 26.44 (Cy-![[C with combining low line]](https://www.rsc.org/images/entities/char_0043_0332.gif) H), 26.78 (Cy-
H), 26.78 (Cy-![[C with combining low line]](https://www.rsc.org/images/entities/char_0043_0332.gif) H), 26.95 (Cy-
H), 26.95 (Cy-![[C with combining low line]](https://www.rsc.org/images/entities/char_0043_0332.gif) H), 27.30 (Cy-
H), 27.30 (Cy-![[C with combining low line]](https://www.rsc.org/images/entities/char_0043_0332.gif) H), 33.90 (Cy-
H), 33.90 (Cy-![[C with combining low line]](https://www.rsc.org/images/entities/char_0043_0332.gif) H), 34.07 (Cy-
H), 34.07 (Cy-![[C with combining low line]](https://www.rsc.org/images/entities/char_0043_0332.gif) H), 35.74 (Cy-
H), 35.74 (Cy-![[C with combining low line]](https://www.rsc.org/images/entities/char_0043_0332.gif) H), 38.08 (Cy-
H), 38.08 (Cy-![[C with combining low line]](https://www.rsc.org/images/entities/char_0043_0332.gif) H), 40.19 (N{
H), 40.19 (N{![[C with combining low line]](https://www.rsc.org/images/entities/char_0043_0332.gif) H3}2), 55.81 (N-
H3}2), 55.81 (N-![[C with combining low line]](https://www.rsc.org/images/entities/char_0043_0332.gif) H), 57.52 (N-
H), 57.52 (N-![[C with combining low line]](https://www.rsc.org/images/entities/char_0043_0332.gif) H), 167.54 (N–C–N); 119Sn{1H} NMR (186.36 MHz, C6D6): δSn −383.0.
H), 167.54 (N–C–N); 119Sn{1H} NMR (186.36 MHz, C6D6): δSn −383.0.
![[M with combining low line]](https://www.rsc.org/images/entities/char_004d_0332.gif)
![[e with combining low line]](https://www.rsc.org/images/entities/char_0065_0332.gif) 2), 3.13 (m, 2H, NC
2), 3.13 (m, 2H, NC![[H with combining low line]](https://www.rsc.org/images/entities/char_0048_0332.gif) C5H10), 3.25 (m, 2H, NC
C5H10), 3.25 (m, 2H, NC![[H with combining low line]](https://www.rsc.org/images/entities/char_0048_0332.gif) C5H10); 13C{1H} NMR (75.5 MHz, C6D6): δc 23.45 (Cy-
C5H10); 13C{1H} NMR (75.5 MHz, C6D6): δc 23.45 (Cy-![[C with combining low line]](https://www.rsc.org/images/entities/char_0043_0332.gif) H), 24.13 (Cy-
H), 24.13 (Cy-![[C with combining low line]](https://www.rsc.org/images/entities/char_0043_0332.gif) H), 24.37 (br, 2C, Cy-
H), 24.37 (br, 2C, Cy-![[C with combining low line]](https://www.rsc.org/images/entities/char_0043_0332.gif) H), 24.52 (Cy-
H), 24.52 (Cy-![[C with combining low line]](https://www.rsc.org/images/entities/char_0043_0332.gif) H), 25.17 (Cy-
H), 25.17 (Cy-![[C with combining low line]](https://www.rsc.org/images/entities/char_0043_0332.gif) H), 33.50 (Cy-
H), 33.50 (Cy-![[C with combining low line]](https://www.rsc.org/images/entities/char_0043_0332.gif) H), 33.97 (br, 2C, Cy-
H), 33.97 (br, 2C, Cy-![[C with combining low line]](https://www.rsc.org/images/entities/char_0043_0332.gif) H), 34.72 (Cy-
H), 34.72 (Cy-![[C with combining low line]](https://www.rsc.org/images/entities/char_0043_0332.gif) H), 38.50 (N{
H), 38.50 (N{![[C with combining low line]](https://www.rsc.org/images/entities/char_0043_0332.gif) H3}2), 42.71 (N-
H3}2), 42.71 (N-![[C with combining low line]](https://www.rsc.org/images/entities/char_0043_0332.gif) H), 54.31(N-
H), 54.31(N-![[C with combining low line]](https://www.rsc.org/images/entities/char_0043_0332.gif) H), 166.05 (N–
H), 166.05 (N–![[C with combining low line]](https://www.rsc.org/images/entities/char_0043_0332.gif) –N). 119Sn{1H} NMR (186.36 MHz, C6D6): δSn −490.1; 77Se{1H} NMR (95.34 MHz, C6D6): δSe 131.8 (s), 567.7 (s).
–N). 119Sn{1H} NMR (186.36 MHz, C6D6): δSn −490.1; 77Se{1H} NMR (95.34 MHz, C6D6): δSe 131.8 (s), 567.7 (s).
![[M with combining low line]](https://www.rsc.org/images/entities/char_004d_0332.gif)
![[e with combining low line]](https://www.rsc.org/images/entities/char_0065_0332.gif) 2), 3.44 (m, 2H, NC
2), 3.44 (m, 2H, NC![[H with combining low line]](https://www.rsc.org/images/entities/char_0048_0332.gif) C5H10), 3.57 (m, 2H, NC
C5H10), 3.57 (m, 2H, NC![[H with combining low line]](https://www.rsc.org/images/entities/char_0048_0332.gif) C5H10). 13C{1H} NMR- (C6D6) 24.87 (Cy-
C5H10). 13C{1H} NMR- (C6D6) 24.87 (Cy-![[C with combining low line]](https://www.rsc.org/images/entities/char_0043_0332.gif) H) 25.58 (Cy-
H) 25.58 (Cy-![[C with combining low line]](https://www.rsc.org/images/entities/char_0043_0332.gif) H), 25.78 (Cy-
H), 25.78 (Cy-![[C with combining low line]](https://www.rsc.org/images/entities/char_0043_0332.gif) H), 25.85 (Cy-
H), 25.85 (Cy-![[C with combining low line]](https://www.rsc.org/images/entities/char_0043_0332.gif) H), 25.98 (Cy-
H), 25.98 (Cy-![[C with combining low line]](https://www.rsc.org/images/entities/char_0043_0332.gif) H), 26.61 (Cy-
H), 26.61 (Cy-![[C with combining low line]](https://www.rsc.org/images/entities/char_0043_0332.gif) H), 34.93 (Cy-
H), 34.93 (Cy-![[C with combining low line]](https://www.rsc.org/images/entities/char_0043_0332.gif) H), 35.42 (Cy-
H), 35.42 (Cy-![[C with combining low line]](https://www.rsc.org/images/entities/char_0043_0332.gif) H), 36.12 (Cy-
H), 36.12 (Cy-![[C with combining low line]](https://www.rsc.org/images/entities/char_0043_0332.gif) H), 36.60 (Cy-
H), 36.60 (Cy-![[C with combining low line]](https://www.rsc.org/images/entities/char_0043_0332.gif) H), 39.88 (N{
H), 39.88 (N{![[C with combining low line]](https://www.rsc.org/images/entities/char_0043_0332.gif) H3}2), 53.65 (N-
H3}2), 53.65 (N-![[C with combining low line]](https://www.rsc.org/images/entities/char_0043_0332.gif) H), 55.74 (N-
H), 55.74 (N-![[C with combining low line]](https://www.rsc.org/images/entities/char_0043_0332.gif) H), 165.39 (N–
H), 165.39 (N–![[C with combining low line]](https://www.rsc.org/images/entities/char_0043_0332.gif) –N). 119Sn{1H} NMR (186.36 MHz, C6D6) δSn −248.0
–N). 119Sn{1H} NMR (186.36 MHz, C6D6) δSn −248.0
![[M with combining low line]](https://www.rsc.org/images/entities/char_004d_0332.gif)
![[e with combining low line]](https://www.rsc.org/images/entities/char_0065_0332.gif) 2), 1.41 (br, m, 12 H, CH
2), 1.41 (br, m, 12 H, CH![[M with combining low line]](https://www.rsc.org/images/entities/char_004d_0332.gif)
![[e with combining low line]](https://www.rsc.org/images/entities/char_0065_0332.gif) 2) 2.93 (s, 12H, N
2) 2.93 (s, 12H, N![[M with combining low line]](https://www.rsc.org/images/entities/char_004d_0332.gif)
![[e with combining low line]](https://www.rsc.org/images/entities/char_0065_0332.gif) 2), 3.88 (br, m, 4H, C
2), 3.88 (br, m, 4H, C![[H with combining low line]](https://www.rsc.org/images/entities/char_0048_0332.gif) Me2). 13C {1H} NMR (75.5 MHz, CD2Cl2): δc 23.69 (CH
Me2). 13C {1H} NMR (75.5 MHz, CD2Cl2): δc 23.69 (CH![[M with combining low line]](https://www.rsc.org/images/entities/char_004d_0332.gif)
![[e with combining low line]](https://www.rsc.org/images/entities/char_0065_0332.gif) 2), 23.78 (CH
2), 23.78 (CH![[M with combining low line]](https://www.rsc.org/images/entities/char_004d_0332.gif)
![[e with combining low line]](https://www.rsc.org/images/entities/char_0065_0332.gif) 2), 24.80 (CH
2), 24.80 (CH![[M with combining low line]](https://www.rsc.org/images/entities/char_004d_0332.gif)
![[e with combining low line]](https://www.rsc.org/images/entities/char_0065_0332.gif) 2), 25.16 (CH
2), 25.16 (CH![[M with combining low line]](https://www.rsc.org/images/entities/char_004d_0332.gif)
![[e with combining low line]](https://www.rsc.org/images/entities/char_0065_0332.gif) 2), 25.16 (CH
2), 25.16 (CH![[M with combining low line]](https://www.rsc.org/images/entities/char_004d_0332.gif)
![[e with combining low line]](https://www.rsc.org/images/entities/char_0065_0332.gif) 2), 40.62 (N
2), 40.62 (N![[M with combining low line]](https://www.rsc.org/images/entities/char_004d_0332.gif)
![[e with combining low line]](https://www.rsc.org/images/entities/char_0065_0332.gif) 2), 47.51 (
2), 47.51 (![[C with combining low line]](https://www.rsc.org/images/entities/char_0043_0332.gif) HMe2), 48.93 (
HMe2), 48.93 (![[C with combining low line]](https://www.rsc.org/images/entities/char_0043_0332.gif) HMe2) 166.30 (N–C–N). 119Sn{1H} NMR (186.36 MHz, CD2Cl2): δSn −779.0 (1J119Sn–77Se = 1329 Hz); 77Se{1H} NMR (95.34 MHz, CDCl3): δSe −787.
HMe2) 166.30 (N–C–N). 119Sn{1H} NMR (186.36 MHz, CD2Cl2): δSn −779.0 (1J119Sn–77Se = 1329 Hz); 77Se{1H} NMR (95.34 MHz, CDCl3): δSe −787.
![[M with combining low line]](https://www.rsc.org/images/entities/char_004d_0332.gif)
![[e with combining low line]](https://www.rsc.org/images/entities/char_0065_0332.gif) 2), 3.14 (m, 2H, NC
2), 3.14 (m, 2H, NC![[H with combining low line]](https://www.rsc.org/images/entities/char_0048_0332.gif) C5H10), 3.36 (m, 2H, NC
C5H10), 3.36 (m, 2H, NC![[H with combining low line]](https://www.rsc.org/images/entities/char_0048_0332.gif) C5H10); 13C{1H} NMR (75.5 MHz, C6D6): δc 24.41 (Cy-
C5H10); 13C{1H} NMR (75.5 MHz, C6D6): δc 24.41 (Cy-![[C with combining low line]](https://www.rsc.org/images/entities/char_0043_0332.gif) H), 24.91 (Cy-
H), 24.91 (Cy-![[C with combining low line]](https://www.rsc.org/images/entities/char_0043_0332.gif) H), 25.00, (Cy-
H), 25.00, (Cy-![[C with combining low line]](https://www.rsc.org/images/entities/char_0043_0332.gif) H), 25.45, (Cy-
H), 25.45, (Cy-![[C with combining low line]](https://www.rsc.org/images/entities/char_0043_0332.gif) H), 25.55 (Cy-
H), 25.55 (Cy-![[C with combining low line]](https://www.rsc.org/images/entities/char_0043_0332.gif) H), 25.92 (Cy-
H), 25.92 (Cy-![[C with combining low line]](https://www.rsc.org/images/entities/char_0043_0332.gif) H), 32.24 (Cy-
H), 32.24 (Cy-![[C with combining low line]](https://www.rsc.org/images/entities/char_0043_0332.gif) H), 32.78 (Cy-
H), 32.78 (Cy-![[C with combining low line]](https://www.rsc.org/images/entities/char_0043_0332.gif) H), 34.77 (Cy-
H), 34.77 (Cy-![[C with combining low line]](https://www.rsc.org/images/entities/char_0043_0332.gif) H), 36.81 (Cy-
H), 36.81 (Cy-![[C with combining low line]](https://www.rsc.org/images/entities/char_0043_0332.gif) H), 38.80 (N(
H), 38.80 (N(![[C with combining low line]](https://www.rsc.org/images/entities/char_0043_0332.gif) H3)2), 54.46 (N-
H3)2), 54.46 (N-![[C with combining low line]](https://www.rsc.org/images/entities/char_0043_0332.gif) H), 56.22 (N-
H), 56.22 (N-![[C with combining low line]](https://www.rsc.org/images/entities/char_0043_0332.gif) H), 167.7 (N–
H), 167.7 (N–![[C with combining low line]](https://www.rsc.org/images/entities/char_0043_0332.gif) –N). 119Sn{1H} NMR (186.36 MHz, C6D6): δSn −566.3 77Se{1H} NMR (95.34 MHz, C6D6): δSe −476.01
–N). 119Sn{1H} NMR (186.36 MHz, C6D6): δSn −566.3 77Se{1H} NMR (95.34 MHz, C6D6): δSe −476.01
![[M with combining low line]](https://www.rsc.org/images/entities/char_004d_0332.gif)
![[e with combining low line]](https://www.rsc.org/images/entities/char_0065_0332.gif) 2), 2.29 (s, 12H, N
2), 2.29 (s, 12H, N![[M with combining low line]](https://www.rsc.org/images/entities/char_004d_0332.gif)
![[e with combining low line]](https://www.rsc.org/images/entities/char_0065_0332.gif) 2), 3.80 (m, 4H, C
2), 3.80 (m, 4H, C![[H with combining low line]](https://www.rsc.org/images/entities/char_0048_0332.gif) Me2). 13C {1H} NMR (75.5 MHz, d8-THF): δc 24.23 (br, CH
Me2). 13C {1H} NMR (75.5 MHz, d8-THF): δc 24.23 (br, CH![[M with combining low line]](https://www.rsc.org/images/entities/char_004d_0332.gif)
![[e with combining low line]](https://www.rsc.org/images/entities/char_0065_0332.gif) 2), 39.61 (N
2), 39.61 (N![[M with combining low line]](https://www.rsc.org/images/entities/char_004d_0332.gif)
![[e with combining low line]](https://www.rsc.org/images/entities/char_0065_0332.gif) 2), 48.1 (
2), 48.1 (![[C with combining low line]](https://www.rsc.org/images/entities/char_0043_0332.gif)
![[H with combining low line]](https://www.rsc.org/images/entities/char_0048_0332.gif) Me2) 167.50 (N–
Me2) 167.50 (N–![[C with combining low line]](https://www.rsc.org/images/entities/char_0043_0332.gif) –N). 119Sn {1H} NMR (186.36 MHz, d8-THF): δSn −919.7, 125Te{1H} NMR (157.98 MHz, C6D6): δTe −792 ppm (1J125Te–119Sn = 7773 Hz).
–N). 119Sn {1H} NMR (186.36 MHz, d8-THF): δSn −919.7, 125Te{1H} NMR (157.98 MHz, C6D6): δTe −792 ppm (1J125Te–119Sn = 7773 Hz).
![[M with combining low line]](https://www.rsc.org/images/entities/char_004d_0332.gif)
![[e with combining low line]](https://www.rsc.org/images/entities/char_0065_0332.gif) 2), 3.52 (m, 4H, NC
2), 3.52 (m, 4H, NC![[H with combining low line]](https://www.rsc.org/images/entities/char_0048_0332.gif) C5H10). 13C {1H} NMR (75.5 MHz, C6D6): δc 26.14 (Cy-
C5H10). 13C {1H} NMR (75.5 MHz, C6D6): δc 26.14 (Cy-![[C with combining low line]](https://www.rsc.org/images/entities/char_0043_0332.gif) H), 26.95 (Cy-
H), 26.95 (Cy-![[C with combining low line]](https://www.rsc.org/images/entities/char_0043_0332.gif) H), 30.2 (Cy-
H), 30.2 (Cy-![[C with combining low line]](https://www.rsc.org/images/entities/char_0043_0332.gif) H), 39.9 (N(
H), 39.9 (N(![[C with combining low line]](https://www.rsc.org/images/entities/char_0043_0332.gif) H3)2), 56.87 (N–C(H)), 167.33 (N–C–N). 119Sn {1H} NMR (186.36 MHz, C6D6): δSn −818 ppm (s); 125Te{1H} NMR (157.98 MHz, C6D6): δTe −1259 ppm.
H3)2), 56.87 (N–C(H)), 167.33 (N–C–N). 119Sn {1H} NMR (186.36 MHz, C6D6): δSn −818 ppm (s); 125Te{1H} NMR (157.98 MHz, C6D6): δTe −1259 ppm.
Single crystal X-ray diffraction studies
Experimental details relating to the single-crystal X-ray crystallographic studies for compounds 7, 8, 10, 11, 12, 13, 15, 16, 17 and 18 are summarised in Tables S6 and S7 (ESI‡). Single Crystal X-ray crystallography data were collected at 150 K on Nonius Kappa CCD diffractometers equipped with low temperature devices, using graphite monochromated Mo Kα radiation (λ = 0.71073 Å). The data collected by the diffractometers were processed using the Nonius Software. Structure solution, followed by full matrix least-squares refinement, was performed using either the WinGX-170 suite of programs or the program suite X-SEED. Crystals were isolated from argon filled Schlenk flask and immersed under oil before being mounted onto the diffractometer.Aerosol assisted chemical vapour deposition (AA-CVD) procedure
The precursor solution is prepared within a glove box under an atmosphere of argon and all solvents are dried and degassed prior to preparation. The precursor holder is kept under an atmosphere of argon, sealed and attached onto to the AA-CVD apparatus. Once all substrates were prepared and mounted into the deposition chamber, argon gas is allowed to flow through the system, bi-passing the precursor holder, for 20 minutes in order to purge the system with argon. Then with continuing gas flow the hot-wall furnace is switched on and allowed to reach the target deposition temperature and equilibrate for 20 minutes. Once this is achieved the gas flow is diverted to flow via the precursor solution which draws the solution into the TSI 3076 Constant Output Atomiser and out into the deposition chamber where the deposition commences and the timer is started. Gas flow is monitored via bubbler and gas pressure fixed 10 bar until it reaches the atomiser. A diagram of the AA-CVD apparatus is included in the ESI.‡Thermogravimetric analysis (TGA)
TGA was collected using a TGA 4000 PerkinElmer system. Samples were prepared air sensitively using a crimped aluminium sample pan. TGA's were performed under a flow of N2 at 20 ml min−1 and heated from 30 °C to 600 °C at a ramp rate of 5 °C min−1.Powder X-ray diffractometry (pXRD)
pXRD data was collected on a BRUKER D8-Advance. The X-ray diffraction spectra were collected for the thin films using the flat plate mode from 5 to 70 2θ at 2° per minute. X-rays were generated from a Cu source at wave lengths of 1.54 Å.Scanning electron microscopy (SEM)
SEM was performed to visualise the morphology of the films both as cross sections (using a Field Emission Scanning Electron Microscope 6301F) and top down (JEOL 6480 Low Vacuum large stage SEM platform) images. The films were prepared by mounting onto steel SEM mounts with conductive carbon tape attached to the bottom and top surface of the films, to maximise conductivity of electrons and prevent charge accumulation. Samples were desiccated at 35 °C for 24 hours prior to analysis.Atomic force microscopy (AFM)
AFM analysis was performed using a Digital Instruments Nanoscope IIIa, with BRUKER SNL-10 Silicon on Nitride Lever contact tips (tip radius < 10 nm, f0: 50–80 kHz, k: 0.350 N m−1 and T: 600 nm), in contact mode. Images processed using the open access Gwyddion SPM data analyser.Energy dispersive X-ray spectroscopy (EDS)
EDS was performed using Oxford Instruments Scanning Electron Microscope 6480 LV and processed on INCA Wave software. All spectra were standardised and calibrated against a standard silicon wafer sample. The magnification, working distance and beam energy (10 keV) were kept consistent between spectral analyses.Raman spectroscopy
Raman spectra were collected using a Renishaw inVia Raman Microscope fitted with a 532 nm laser at a 10% spot size, 3 s exposure time and 1% energy intensity. The data was processed using a Renishaw WiRE software package.Conflicts of interest
There are no conflicts to declare.Acknowledgements
The authors thank EPSRC for funding (EP/L0163541 and EP/G03768X/1) and the Doctoral Training Centre in Sustainable Chemical Technologies for a PhD studentship (I. Y. A).References
- M. Zhou, G. J. Snyder, L. Li and L.-D. Zhao, Inorg. Chem. Front., 2016, 3, 1449–1463 RSC.
- Z. Wang, P. K. Nayak, J. A. Caraveo-Frescas and H. N. Alshareef, Adv. Mater., 2016, 28, 3831–3892 CrossRef CAS PubMed.
- D. J. Lewis, P. Kevin, O. Bakr, C. A. Muryn, M. A. Malik and P. O'Brien, Inorg. Chem. Front., 2014, 1, 577 RSC.
- O. Madelung, Semiconductors: Data Handbook, Springer, Berlin, London, 2004 Search PubMed.
- A. de Kergommeaux, J. Faure-Vincent, A. Pron, R. de Bettignies, B. Malaman and P. Reiss, J. Am. Chem. Soc., 2012, 134, 11659–11666 CrossRef CAS PubMed.
- Y. Yin and A. P. Alivisatos, Nature, 2005, 437, 664–670 CrossRef CAS PubMed.
- M. Yarema, R. Caputo and M. V. Kovalenko, Nanoscale, 2013, 5, 8398 RSC.
- D. V. Talapin, J.-S. Lee, M. V. Kovalenko and E. V. Shevchenko, Chem. Rev., 2010, 110, 389–458 CrossRef CAS PubMed.
- P. Marchand and C. J. Carmalt, Coord. Chem. Rev., 2013, 257, 3202–3221 CrossRef CAS.
- I. Y. Ahmet, M. S. Hill, A. L. Johnson and L. M. Peter, Chem. Mater., 2015, 27, 7680–7688 CrossRef CAS.
- I. Barbul, A. L. Johnson, G. Kociok-Kohn, K. C. Molloy, C. Silvestru and A. L. Sudlow, ChemPlusChem, 2013, 78, 866–874 CrossRef CAS.
- T. Wildsmith, M. S. Hill, A. L. Johnson, A. J. Kingsley and K. C. Molloy, Chem. Commun., 2013, 49, 8773–8775 RSC.
- A. L. Catherall, S. Harris, M. S. Hill, A. L. Johnson and M. F. Mahon, Cryst. Growth Des., 2017, 17, 5544–5551 CAS.
- C. A. Stewart, D. A. Dickie, Y. Tang and R. A. Kemp, Inorg. Chim. Acta, 2011, 376, 73–79 CrossRef CAS.
- L. R. Sita, J. R. Babcock and R. Xi, J. Am. Chem. Soc., 1996, 118, 10912–10913 CrossRef CAS.
- C. A. Stewart, D. A. Dickie, M. V. Parkes, J. A. Saria and R. A. Kemp, Inorg. Chem., 2010, 49, 11133–11141 CrossRef CAS PubMed.
- W. J. Baumgardner, J. J. Choi, Y.-F. Lim and T. Hanrath, J. Am. Chem. Soc., 2010, 132, 9519–9521 CrossRef CAS PubMed.
- S. R. Foley, G. P. A. Yap and D. S. Richeson, Polyhedron, 2002, 21, 619–627 CrossRef CAS.
- M. Brym, M. D. Francis, G. X. Jin, C. Jones, D. P. Mills and A. Stasch, Organometallics, 2006, 25, 4799–4807 CrossRef CAS.
- S. P. Green, C. Jones, K. A. Lippert, D. P. Mills and A. Stasch, Inorg. Chem., 2006, 45, 7242–7251 CrossRef CAS PubMed.
- T. Chlupaty, Z. Padelkova, F. DeProft, R. Willem and A. Ruzicka, Organometallics, 2012, 31, 2203–2211 CrossRef CAS.
- T. Chlupaty, Z. Padelkova and A. Ruzicka, Main Group Met. Chem., 2014, 37, 49–52 CrossRef CAS.
- M. K. Barman, A. Baishya, T. Peddarao and S. Nembenna, J. Organomet. Chem., 2014, 772, 265–270 CrossRef.
- T. Chlupaty, Z. Ruzickova, M. Horacek, J. Merna, M. Alonso, F. De Proft and A. Ruzicka, Organometallics, 2015, 34, 2202–2211 CrossRef CAS.
- T. Chlupatý, Z. Padělková, F. DeProft, R. Willem and A. Růžička, Organometallics, 2012, 31, 2203–2211 CrossRef.
- R. E. Abutbul, E. Segev, S. Samuha, L. Zeiri, V. Ezersky, G. Makov and Y. Golan, CrystEngComm, 2016, 18, 1918–1923 RSC.
- H.-X. Yeong, H.-W. Xi, Y. Li, S. B. Kunnappilly, B. Chen, K.-C. Lau, H. Hirao, K. H. Lim and C.-W. So, Chem. – Eur. J., 2013, 19, 14726–14731 CrossRef CAS PubMed.
- N. Nimitsiriwat, V. C. Gibson, E. L. Marshall, A. J. P. White, S. H. Dale and M. R. J. Elsegood, Dalton Trans., 2007, 4464 RSC.
- K. Phomphrai, C. Pongchan-o, W. Thumrongpatanaraks, P. Sangtrirutnugul, P. Kongsaeree and M. Pohmakotr, Dalton Trans., 2011, 40, 2157–2159 RSC.
- M. M. Olmstead and P. P. Power, Inorg. Chem., 1984, 23, 413–415 CrossRef CAS.
- N. Tokitoh, T. Matsumoto and R. Okazaki, Tetrahedron Lett., 1992, 33, 2531–2534 CrossRef CAS.
- Y. Matsuhashi, N. Tokitoh, R. Okazaki, M. Goto and S. Nagase, Organometallics, 1993, 12, 1351–1358 CrossRef CAS.
- Y. L. Zhou and D. S. Richeson, J. Am. Chem. Soc., 1996, 118, 10850–10852 CrossRef CAS.
- R. Okazaki, M. Saito and N. Tokitoh, Phosphorus, Sulfur Silicon Relat. Elem., 1997, 124, 363–370 Search PubMed.
- M. Saito, N. Tokitoh and R. Okazaki, J. Am. Chem. Soc., 1997, 119, 11124–11125 CrossRef CAS.
- S. R. Foley, G. P. A. Yap and D. S. Richeson, Organometallics, 1999, 18, 4700–4705 CrossRef CAS.
- L. Pauling, The Nature of the Chemical Bond and the Structure of Molecules and Crystals : An Introduction to Modern Structural Chemistry, Cornell University Press, New York, 1960 Search PubMed.
- T. Tajima, N. Takeda, T. Sasamori and N. Tokitoh, Organometallics, 2006, 25, 3552–3553 CrossRef CAS.
- N. Tokitoh, H. Suzuki, T. Matsumoto, Y. Matsuhashi, R. Okazaki and M. Goto, J. Am. Chem. Soc., 1991, 113, 7047–7049 CrossRef CAS.
- M. K. Barman and S. Nembenna, RSC Adv., 2016, 6, 338–345 RSC.
- T. Matsumoto, Y. Matsui, Y. Nakaya and K. Tatsumi, Chem. Lett., 2001, 60–61 CrossRef CAS.
- M. K. Barman and S. Nembenna, RSC Adv., 2016, 6, 338–345 RSC.
- M. C. Kuchta and G. Parkin, J. Am. Chem. Soc., 1994, 116, 8372–8373 CrossRef CAS.
- W.-P. Leung, W.-H. Kwok, L. T. C. Law, Z.-Y. Zhou and T. C. W. Mak, Chem. Commun., 1996, 505–506 RSC.
- W.-P. Leung, W.-H. Kwok, Z.-Y. Zhou and T. C. W. Mak, Organometallics, 2000, 19, 296–303 CrossRef CAS.
- B. Mairychová, L. Dostál, A. Růžička, M. Fulem, K. Růžička, A. Lyčka and R. Jambor, Organometallics, 2011, 30, 5904–5910 CrossRef.
- L. S. Price, I. P. Parkin, T. G. Hibbert and K. C. Molloy, Chem. Vap. Deposition, 1998, 4, 222–225 CAS.
- I. P. Parkin, L. S. Price, T. G. Hibbert and K. C. Molloy, J. Mater. Chem., 2001, 11, 1486–1490 RSC.
- B. P. Bade, S. S. Garje, Y. S. Niwate, M. Afzaal and P. O'Brien, Chem. Vap. Deposition, 2008, 14, 292–295 CrossRef CAS.
- P. Kevin, D. J. Lewis, J. Raftery, M. Azad Malik and P. O'Brien, J. Cryst. Growth, 2015, 415, 93–99 CrossRef CAS.
- M. A. Buckingham, A. L. Catherall, M. S. Hill, A. L. Johnson and J. D. Parish, Crys. Growth Des., 2017, 17, 907–912 CrossRef CAS.
- J. Liu, P. Kopold, C. Wu, P. A. van Aken, J. Maier and Y. Yu, Energy Environ. Sci., 2015, 8, 3531–3538 CAS.
- A. K. Sinha, A. Sil, A. K. Sasmal, M. Pradhan and T. Pal, New J. Chem., 2015, 39, 1685–1690 RSC.
- D.-H. Lee and C.-M. Park, ACS Appl. Mater. Interfaces, 2017, 9, 15439–15448 CAS.
- J. Wu, Z. Hu, Z. Jin, S. Lei, H. Guo, K. Chatterjee, J. Zhang, Y. Yang, B. Li, Y. Liu, J. Lai, R. Vajtai, B. Yakobson, M. Tang, J. Lou and P. M. Ajayan, Adv. Mater. Interfaces, 2016, 3, 1600383 CrossRef.
- H. S. Im, Y. Myung, Y. J. Cho, C. H. Kim, H. S. Kim, S. H. Back, C. S. Jung, D. M. Jang, Y. R. Lim, J. Park and J.-P. Ahn, RSC Adv., 2013, 3, 10349 RSC.
- F. Izumi, J. Solid State Chem., 1981, 38, 381–385 CrossRef CAS.
- J. P. Coyle, P. A. Johnson, G. A. DiLabio, S. T. Barry and J. Müller, Inorg. Chem., 2010, 49, 2844–2850 CrossRef CAS PubMed.
- J. P. Coyle, W. H. Monillas, G. P. A. Yap and S. T. Barry, Inorg. Chem., 2008, 47, 683–689 CrossRef CAS PubMed.
- T. Kim, Y. Yao, J. P. Coyle, S. T. Barry and F. Zaera, Chem. Mater., 2013, 25, 3630–3639 CrossRef CAS.
- Q. Ma, H. Guo, R. G. Gordon and F. Zaera, Chem. Mater., 2011, 23, 3325–3334 CrossRef CAS.
- I. Y. Ahmet, J. R. Thompson, M. S. Hill, G. Kociok-Köhn and A. L. Johnson, Eur. J. Inorg. Chem., 2017 DOI:10.1002/ejic.201800071.
Footnotes |
| † Dedicated to Prof. Paul R. Raithby, an outstanding scientist and exceptional friend and colleague, on the occasion of his retirement. |
| ‡ Electronic supplementary information (ESI) available. CCDC 1814512–1814521. For ESI and crystallographic data in CIF or other electronic format see DOI: 10.1039/c8dt00773j |
| This journal is © The Royal Society of Chemistry 2018 |

