DOI:
10.1039/C7DT03035E
(Paper)
Dalton Trans., 2018,
47, 1972-1980
Preparation of Eu(III) acetylacetonate-doped well-defined titania particles with efficient photoluminescence properties†
Received
16th August 2017
, Accepted 4th January 2018
First published on 18th January 2018
Abstract
The aggregation/dispersion of luminescent species is a critical factor that determines their luminescence properties. In this study, europium(III) acetylacetonate (Eu(acac)3) was doped into a titania matrix to form Eu(acac)3-doped titania particles with well-defined size and shape through a microreactor-based sol–gel approach. The morphology and structure of the as-synthesized products were characterized by Fourier transform infrared spectroscopy, scanning electron microscopy, transmission electron microscopy, scanning transmission electron microscopy and X-ray diffraction measurements. The Eu/Ti value of the products varied in the range from 0.125 to 5.0 and the resulting luminescence properties were examined. It should be noted that there was an optimum Eu/Ti value that exhibited the strongest luminescence. A possible reason for this phenomenon can be explained on the basis of a balance between the inter-molecular distance of Eu(acac)3 and its doped amount. The effects of the crystal phase of the titania matrix on luminescence behavior were also investigated. As a result, Eu(acac)3-doped amorphous titania demonstrated more efficient luminescence than that after calcined at 550 °C for 6 h to convert amorphous to anatase probably because of the aggregation of Eu species on the crystallite surface. The stability of the present Eu(acac)3-doped titania was confirmed by preparing thin films on a glass substrate and by applying UV/ozone treatment. As compared to bare Eu(acac)3, degradation in luminescence was suppressed in the case of Eu(acac)3-doped titania. Thus, the present titania-based hybrid with controlled Eu(acac)3 doping is useful as a stable, luminescent material for optical, biological and environmental applications.
Introduction
Titania-based materials with luminescence properties have been extensively investigated because of their applicability to a variety of applications in such fields as optics, biology, medicine and catalysis.1–6 There are several approaches to prepare luminescent titania; luminescent dyes or quantum dots are commonly utilized to functionalize titania. According to numerous studies reported previously, the titania-based hybrid materials with luminescent dyes or quantum dots demonstrated strong luminescence in a wide wavelength range. On the other hand, the luminescent species have a few significant drawbacks. More specifically, many of the luminescent dyes are easily degraded under light irradiation. Quantum dots contain heavy metals in their structure, and thus, undesired effects that are known as (cyto)toxicity are induced by the heavy metal ions especially in biological and medical applications. To overcome these problems, doping of rare earth ions in the titania matrix would be an alternative approach. The doped rare earth ions are not degraded by external stimuli and are not easily eluted as long as the titania matrix is stable. In addition, the rare earth ions are known to show much sharper luminescence due to f–f transition.7 Owing to these characteristic features, rare earth-doped titania is considered to be a good candidate for many applications.
Taking into account that titania has been utilized for various applications depending on the type of crystal phase, the doping of rare earth ions into titania with a controlled crystal phase is a significant challenge to extend the applicability of titania to wider purposes. Rare earth-doped anatase and rutile have been prepared by post-treatments of amorphous titania that is generally synthesized by a sol–gel approach. The crystal phase transition can be induced by simple calcination, and thus, there are a variety of reports on the effects of calcination temperature on the crystal phase and the resulting luminescence properties.8–15 It should be noted that calcination results in an atomic rearrangement when crystal growth happens. The doped rare earth ions are then pushed out from the titania matrix to the surface of crystallites, causing aggregation and decreasing luminescence intensity. Simultaneous design of the size of the crystallites and inter-distance between doped rare earth ions are technically difficult, indicating that alternative approaches are required to be developed for optimized luminescence properties.
In the present study, we report the synthesis and luminescence properties of rare earth-doped well-defined amorphous titania particles. The europium(III) ion (Eu3+) was selected as a model rare earth ion. To optimize the luminescence intensity of the hybrid, the doped Eu3+ has to be dispersed in the titania matrix. For this purpose, utilizing an amorphous structure is an efficient way because of its flexibility that can accept hetero-elements with controlled inter-distance, while the number of research studies based on this viewpoint is limited.16–19 Europium(III) acetylacetonate (Eu(acac)3) was utilized as a precursor for the present synthesis. As reported previously, acetylacetonate quantitatively interacts with the surface of titania to form unique structures.20,21 Taking advantage of Eu(acac)3, a homogeneous mixture of titania and Eu(acac)3 should be obtained. Furthermore, a microreactor-based approach was used to synthesize well-defined products in terms of their shape and size.22,23 Therefore, the Eu(acac)3-doped well-defined amorphous titania particles with different Eu/Ti values were prepared to precisely investigate the structure–luminescence property relationship in the present system toward optimized luminescence behavior.
Experimental
Chemicals
Titanium tetraisopropoxide (TTIP: Tokyo Chemical Industry Co., Ltd, Scheme 1), europium(III) acetylacetonate (Eu(acac)3: Tokyo Chemical Industry Co., Ltd, Scheme 1), isopropyl alcohol (IPA: Wako Pure Chemical Industries, Ltd) and octadecylamine (ODA: Aldrich, Inc., Scheme 1) were utilized in the present study. All the chemicals were used as received.
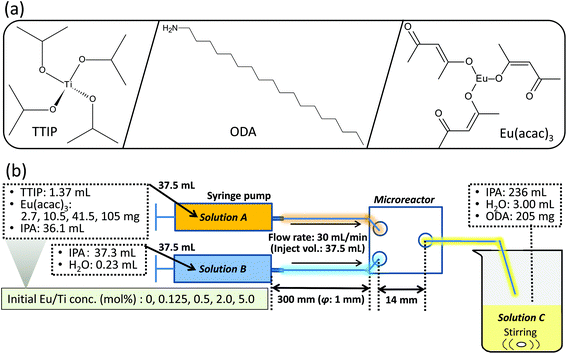 |
| | Scheme 1 (a) Chemical structures of the reagents used in this study and (b) an illustration of the experimental setup for the present microfluidic synthesis. | |
Synthesis
For the synthesis of Eu(acac)3-doped titania particles, three starting solutions (solutions A, B and C) were prepared. Detailed composition of each solution is summarized in Scheme 1. The Eu/Ti ratio (mol%) was set at 0 (control), 0.125 0.5, 2.0 and 5.0. The solutions A and B were individually pumped in perfluoroalkoxyalkane (PFA: 1.0 mm inner diameter, 1/16 inch outer diameter, product of YMC Co., Ltd) tubes with a syringe pump (CXN1070, product of ISIS, Co., Ltd) at 30 mL min−1. Then, the two solutions were mixed in a polytetrafluoroethylene (PTFE) fluidic channel with a Y shape junction (the channel cross section of approx. 1 mm2, KeyChem mixer, product of YMC Co., Ltd). The mixture was allowed to flow through a PFA tube of 70 cm in length and was added into solution C under magnetic stirring at 1500 rpm. The final reaction solution was aged at room temperature for 24 h. After the aging, the solid products were collected by centrifugation (10![[thin space (1/6-em)]](https://www.rsc.org/images/entities/char_2009.gif) 000g, 4 °C, 20 min), washed with ethanol twice, and then dried at 40 °C for 12 h. The samples are denoted as x-Eu/Ti, where x represents the Eu/Ti ratio in the starting solution. 0.5-Eu/Ti was calcined at 550 °C in air for 6 h and the resulting sample was denoted as 0.5-Eu/Ti-cal.
000g, 4 °C, 20 min), washed with ethanol twice, and then dried at 40 °C for 12 h. The samples are denoted as x-Eu/Ti, where x represents the Eu/Ti ratio in the starting solution. 0.5-Eu/Ti was calcined at 550 °C in air for 6 h and the resulting sample was denoted as 0.5-Eu/Ti-cal.
Characterization
Fourier transform infrared (FT-IR) spectra were obtained using a Fourier transform infrared spectrometer (FT/IR-4100, JASCO, Japan). FT-IR spectra were recorded with a KBr pellet containing a small amount of sample powder. The weight ratio between the sample powder and KBr was 1:10. All the spectra were recorded after subtracting a background spectrum of pristine KBr. The measurement range, sampling time and resolution were 4000–500 cm−1, 100 and 2.0 cm−1, respectively. X-ray diffraction (XRD) patterns were recorded with a powder X-ray diffractometer (Smart Lab, Rigaku, Japan). XRD patterns were recorded under the following conditions: X-ray source of CuKα line (λ: 0.15418 nm), voltage/current of 40 kV/30 mA, scan speed of 5.0° min−1 and sampling width of 0.01°. The samples were characterized by X-ray fluorescence analysis (XRF: ZSX Primus II, Rigaku, Japan). XRF analysis was performed using a sample pellet which was made by pressurizing the sample powder without diluting it. The fundamental parameter method by the software (EZ scan program, Rigaku) was carried out for semi-quantitative analysis. All the measurements and data analysis were conducted using an optional software (EZ scan program, Rigaku, Japan). The averaged chemical composition values between five different batch samples were calculated. All the samples were observed using a field emission scanning electron microscope (FE-SEM: SU8000, Hitachi High-Technologies, Japan). FE-SEM observation was performed at an accelerating voltage of 5 kV and current of 10 μA. Prior to the observation, the suspension was drop-cast onto a silicon substrate and the substrate was stored in an oven until it was dried. Then, the samples were coated with a few nanometers of platinum. The average particle size (D) and coefficient of variation (CV) values were calculated by counting 300 particles. Transmission electron microscopy (TEM) was performed using JEOL JEM-100CX and JEM-2100F transmission electron microscopes. Scanning transmission electron microscopy high-angle annular dark-field (STEM HAADF) images and elemental mapping images were recorded using JEM-2100F and JED-2300 instruments (JEOL Ltd) at an accelerating voltage of 200 kV. The Eu(acac)3-doped titania suspension was dropped onto a Cu grid (high resolution carbon substrate on STEM100Cu and STEM Cu150P grids, Okenshoji Co., Ltd) and the grids were dried under vacuum (2.0 × 10⁻⁵ Pa) for a few days before each measurement. For the fluorescence measurements, a fluorescence spectrometer (FP-8500, JASCO, Japan) was utilized. Excitation and fluorescence spectra were recorded under the following conditions: bandwidth of 10 nm (excitation/fluorescence), scan speed of 200 nm min−1, data acquisition interval of 0.1 nm, response time of 1 s and PMT voltage of 350 V. Excitation and luminescence wavelengths were set at 465 nm and 614 nm, respectively. The powder sample was measured using a sample holder with a quartz window. A fluorescence microscope (CKX41-FL, OLYMPUS, Japan) through the emission source (U-RFLT50, OLYMPUS, Japan) was also used for observing the samples. All the fluorescence microscopy images were recorded under the following conditions: excitation wavelength: 420–480 nm, dichroic mirror wavelength: >500 nm, emission wavelength: >520 nm, sensitivity: ISO 400, exposure time of 100 ms and sensitivity of ISO 400. Prior to the measurement, the sample powder was homogeneously mounted on carbon tape. The U-RFLT50 (OLYMPUS, Japan) was used as a light source. The integrated luminescence intensities centered at the peak tops of 5D0–7F2 transition between 600–637 nm by the excitation wavelengths of 394 and 464 nm were calculated, and the integrated luminescence intensity per 1 mol of the hybridized Eu(acac)3 was calculated using the resulting Eu(acac)3 molar concentration from the XRF results. Here, the intensity of 0-Eu/Ti was fixed to be 0. The internal quantum efficiency (ηint) was measured using an integrating sphere (ISF-834; internal diameter: φ 60 mm). The excitation and luminescence spectra were recorded by using the above-mentioned spectrophotometer at the same wavelengths. The scattering light by the excitation was measured by setting a standard white board inside the integrating sphere. The incident, scattering, and luminescence light intensities, which were respectively abbreviated as I0, I1, and I2, were measured and ηint was calculated by using eqn (1).| | | ηint = I2/(I0 − I1) × 100 | (1) |
Here, the measurement wavelength range was from 350 to 750 nm. The integrated intensities of I0 and I1 were calculated in the wavelength range between 380–409 nm and 450–479 nm for the excitation wavelengths of 394 and 464 nm, respectively, and that of I2 were 409–750 nm and 479–750 nm for the excitation wavelengths of 394 and 464 nm, respectively.
Film preparation and UV/ozone treatment
All the Eu(acac)3-doped titania particles with different Eu/Ti ratios were individually dispersed in ethanol at a concentration of 0.5 wt% and the suspensions were spin-coated on a glass substrate (3000 rpm, 10 s). The spin-coated films were dried at 40 °C for 12 h. Eu(acac)3 was also spin-coated under the same conditions to have a film as a control. In order to investigate the degradation behavior of fluorescein, UV-ozone treatment was performed on exposure to 185 and 254 nm (ASM401N, Azumi GIGKEN Limited, Japan) for 15 min, and the distance between the low-pressure mercury lamp and film surface was fixed at 5 cm.
Results and discussion
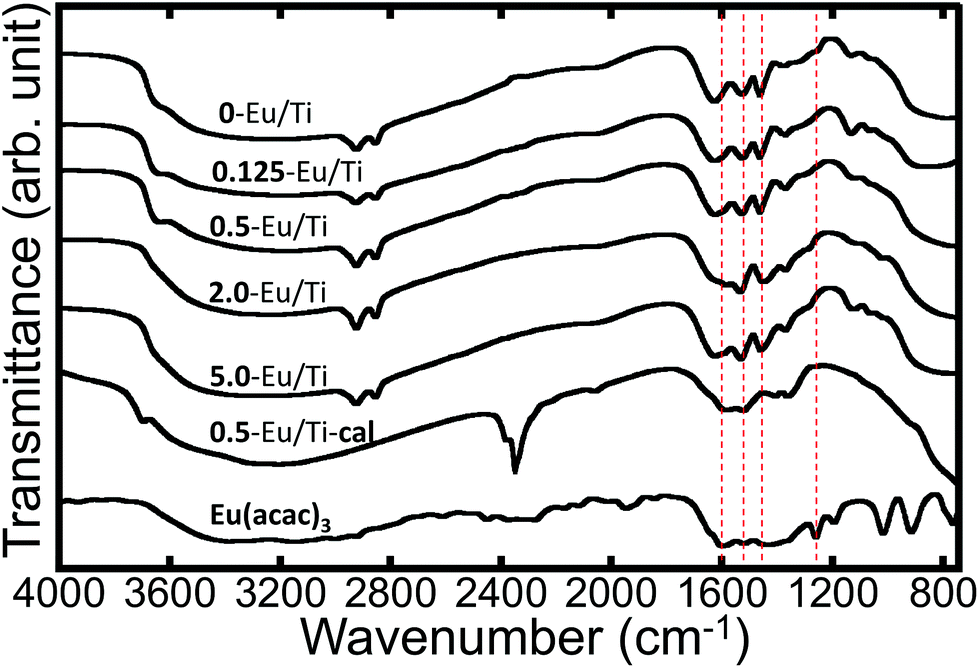
After the whole synthetic process, white powder was obtained in the case of all five samples with different Eu/Ti ratios. To characterize the structure and composition of the products, FT-IR spectroscopy was performed. The FT-IR spectra of all the samples are shown in Fig. 1. According to the literature, a few absorption bands which are characteristic of Eu(acac)3 are seen at around 1600–1200 cm−1.24 More specifically, three bands with very strong absorption are known to appear at 1600 cm−1, 1515 cm−1 and 1450 cm−1 that can be attributed to C![[double bond, length as m-dash]](https://www.rsc.org/images/entities/char_e001.gif) C stretching, CO stretching and the combination of C–H bending and CO stretching, respectively. Another strong absorption should appear at around 1258 cm−1, being ascribed to the combination of C–CH3 stretching and CC stretching. All these bands are recognized in the present spectra, indicating that the as-synthesized samples definitely contained Eu(acac)3. According to the previous studies, the interaction between coordinated acetylacetonate and Ti was suggested, and the details are discussed later. No diffractions that can be attributed to crystalline titania and/or Eu(acac)3 were observed in the XRD patterns (Fig. S1†), revealing that all the as-synthesized samples were amorphous. The composition of all the samples was determined by XRF and the results are summarized in Table 1. Based on the measured Eu/Ti values, it would be reasonable to say that most of the added Eu(acac)3 were consumed to form the final products, while that for 0.125-Eu/Ti was larger than expected. The effective Eu(acac)3 inclusion inside the particles for 0.125-Eu/Ti (Eu/Ti: 0.164 ± 0.046) would affect the lower Ti content in the resulting compound. In any case, it was indicated that Eu(acac)3 interacted with the titania matrix to form co-precipitates in the presence of ODA with sufficient synthetic reproducibility.
C stretching, CO stretching and the combination of C–H bending and CO stretching, respectively. Another strong absorption should appear at around 1258 cm−1, being ascribed to the combination of C–CH3 stretching and CC stretching. All these bands are recognized in the present spectra, indicating that the as-synthesized samples definitely contained Eu(acac)3. According to the previous studies, the interaction between coordinated acetylacetonate and Ti was suggested, and the details are discussed later. No diffractions that can be attributed to crystalline titania and/or Eu(acac)3 were observed in the XRD patterns (Fig. S1†), revealing that all the as-synthesized samples were amorphous. The composition of all the samples was determined by XRF and the results are summarized in Table 1. Based on the measured Eu/Ti values, it would be reasonable to say that most of the added Eu(acac)3 were consumed to form the final products, while that for 0.125-Eu/Ti was larger than expected. The effective Eu(acac)3 inclusion inside the particles for 0.125-Eu/Ti (Eu/Ti: 0.164 ± 0.046) would affect the lower Ti content in the resulting compound. In any case, it was indicated that Eu(acac)3 interacted with the titania matrix to form co-precipitates in the presence of ODA with sufficient synthetic reproducibility.
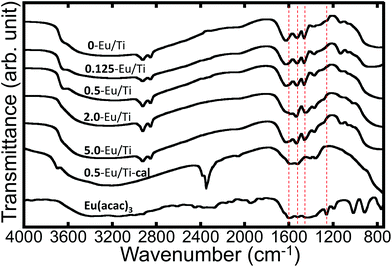 |
| | Fig. 1 FT-IR spectra of Eu(acac)3 and Eu(acac)3-doped titania particles with different Eu/Ti ratios. The characteristic absorption bands for Eu(acac)3 are indicated with red dashed lines. | |
Table 1 Experimentally determined chemical compositions of Eu(acac)3-doped titania particles measured by XRF
| Sample |
Ti (mol%) |
O (mol%) |
Eu (mol%) |
C (mol%) |
Eu/Ti (mol%) |
O/Ti |
| 0-Eu/Ti |
17.4 |
38.4 |
0.00 |
44.1 |
0 |
2.22 |
| 0.125-Eu/Ti |
15.9 |
37.9 |
0.026 |
46.3 |
0.164 |
2.39 |
| 0.5-Eu/Ti |
16.3 |
40.7 |
0.068 |
42.9 |
0.416 |
2.50 |
| 2.0-Eu/Ti |
16.6 |
41.9 |
0.312 |
41.3 |
1.89 |
2.53 |
| 5.0-Eu/Ti |
15.6 |
42.7 |
0.762 |
40.9 |
4.88 |
2.73 |
| 0.5-Eu/Ti-cal |
18.7 |
60.1 |
0.075 |
20.1 |
0.402 |
3.26 |
| Eu(acac)3 |
— |
32.5 |
9.37 |
58.1 |
— |
— |
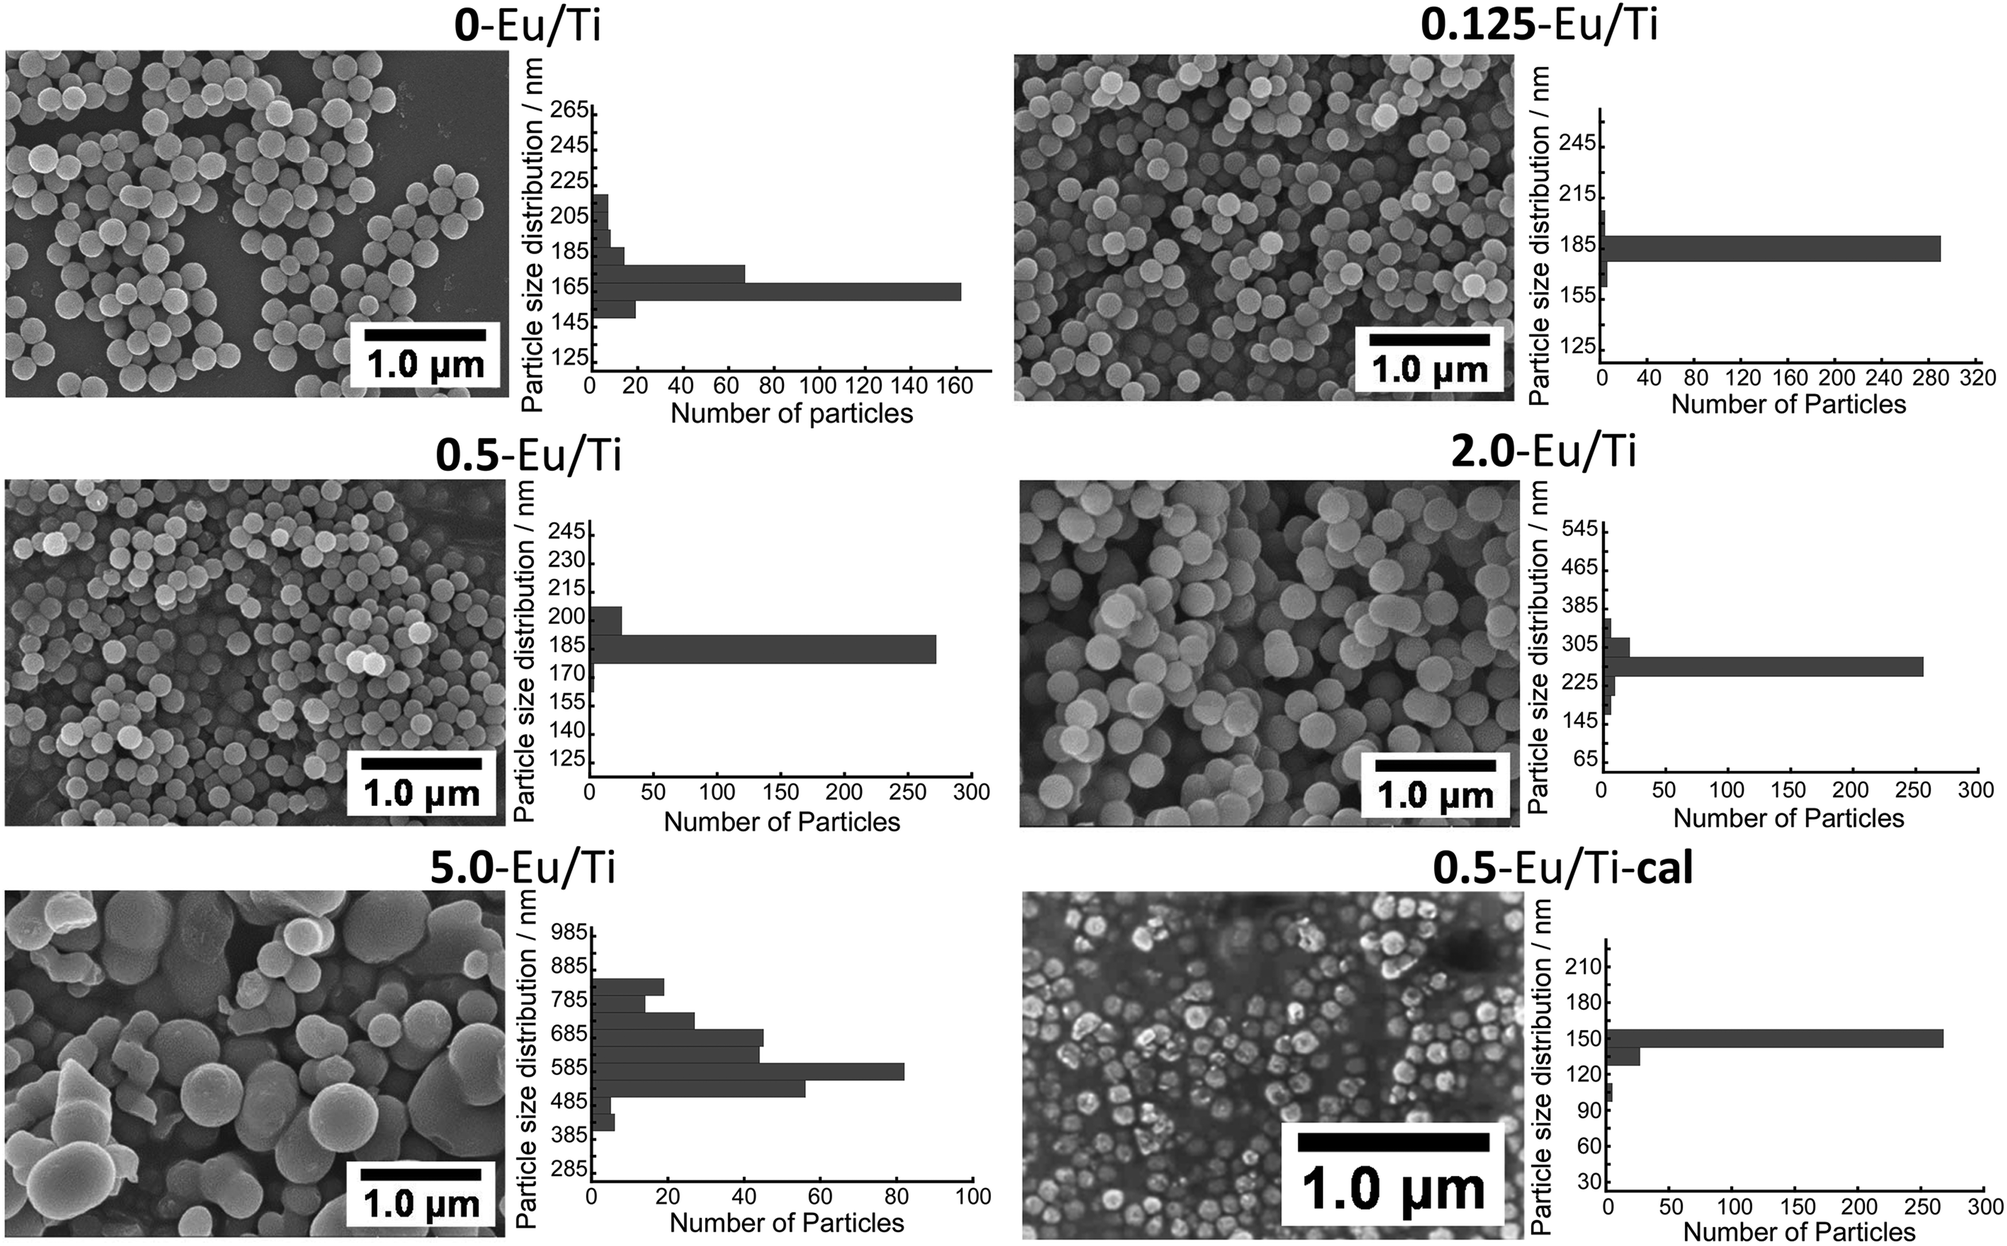
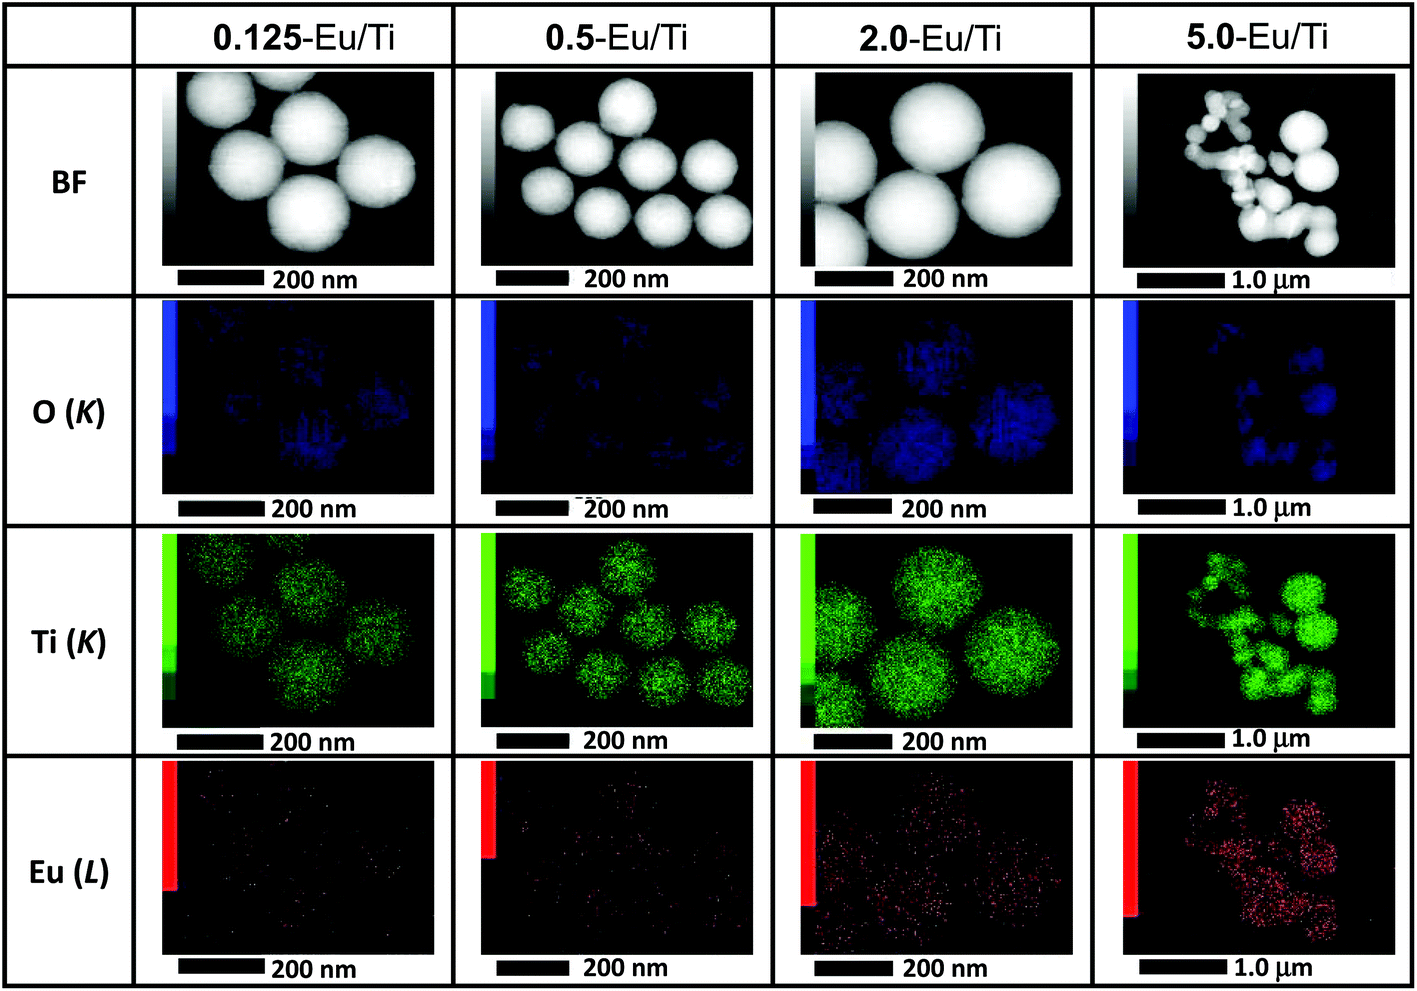
As the structural/compositional information was derived from bulk samples, more local characteristics were then examined. The SEM images of all the samples and corresponding particle size distributions are shown in Fig. 2. These values are summarized in Table 2. As demonstrated, 0.125-Eu/Ti and 0.5-Eu/Ti have well-defined spherical shapes with a narrow particle size distribution. The average particle size of 0-Eu/Ti was 166 nm, while those of 0.125-Eu/Ti and 0.5-Eu/Ti were 185 nm and 187 nm, respectively, suggesting the effect of the doping of Eu(acac)3 into the titania matrix. A further increase in Eu/Ti resulted in the formation of larger sized particles; 264 nm for 2.0-Eu/Ti. It should be noted here that there were some particles merged together to form dimer-like particles. 5.0-Eu/Ti displayed a broad particle size distribution and aggregated shape. All the samples were also observed by TEM and demonstrated that they were amorphous without having any defined structures (Fig. S2†). STEM-EDX analyses revealed that all the samples were composed of O, Ti and Eu (Fig. 3). More importantly, Eu seems to be dispersed homogeneously in each particle even in the case of 5.0-Eu/Ti, i.e. polydispersed one. Thus, no Eu(acac)3 that recrystallizes through the synthesis should be present.
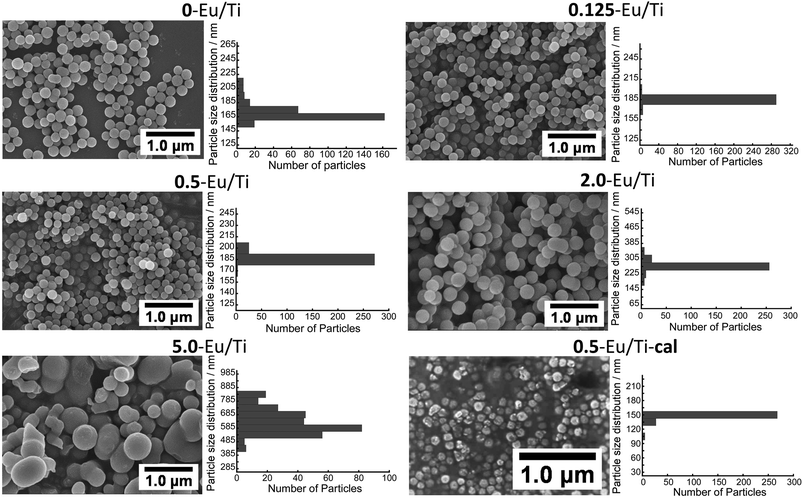 |
| | Fig. 2 FE-SEM images and the particle size distributions of Eu(acac)3-doped titania particles with different Eu/Ti ratios. The D and CV values of the hybrids are summarized in Table 2. | |
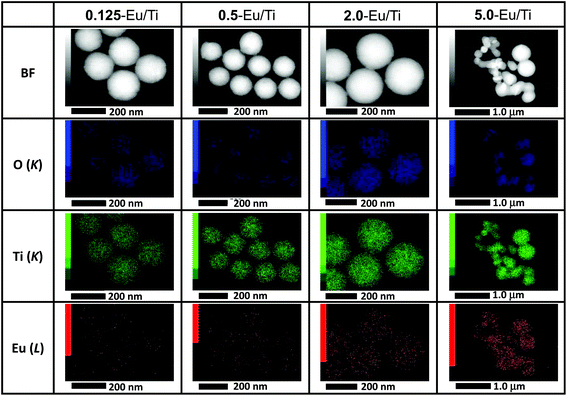 |
| | Fig. 3 STEM and EDX elemental mapping images of O, Ti and Eu atoms of Eu(acac)3-doped titania particles with different Eu/Ti ratios. STEM observation and elemental mapping were conducted at the same position. | |
Table 2 Average diameter (D) and coefficient of variation (CV) of Eu(acac)3-doped titania particles
| |
D (nm) |
CV (%) |
| 0-Eu/Ti |
166 |
5.9 |
| 0.125-Eu/Ti |
185 |
3.1 |
| 0.5-Eu/Ti |
187 |
2.9 |
| 2.0-Eu/Ti |
264 |
7.4 |
| 5.0-Eu/Ti |
636 |
14 |
| 0.5-Eu/Ti-cal |
146 |
4.6 |
According to the bulk characterization and local analyses described above, all the samples synthesized in the present study were homogeneous in terms of their composition; almost no compositional deviation was recognized. Furthermore, 0.125-Eu/Ti and 0.5-Eu/Ti exhibited the well-defined shape and narrow particle size distribution as well. To explain a possible reason for such a successful synthesis, the synthetic procedure should be focused on. In this study, a microfluidic reaction scheme was applied to obtain well-defined products.22,23 A proposed formation mechanism is illustrated in Scheme 2. As reported, the homogeneous solution containing TTIP and Eu(acac)3 was mixed with aqueous IPA to initiate the nucleation of Eu(acac)3-doped titania with a few nm in size. According to previous studies, Fe(acac)3 specifically interacts with the surface of titania to form stable hybrid nuclei25,26 and hybrid nuclei similarly form between titania and Eu(acac)3. These nuclei were then added to another solution containing ODA, H2O and IPA. The nuclei interacted with ODA and subsequently self-assembled to form well-defined particles. On the other hand, the larger amount of Eu(acac)3 present in the reaction solution enhances the interaction between the particles, inducing the merged particle formation (SEM images of 2.0-Eu/Ti and 5.0-Eu/Ti as shown in Fig. 2). It was reported that acetylacetone interacts with titanium alkoxide.20,21 Specifically, oxygen atoms in the acetylacetone structure interact with a central Ti atom in the alkoxide structure to form a stable chelating compound. Considering these points, the merged particle formation was accelerated by the presence of Eu(acac)3, meaning that Eu(acac)3 plays a role as a bridge between alkoxides and/or alkoxy groups on the titania surface.
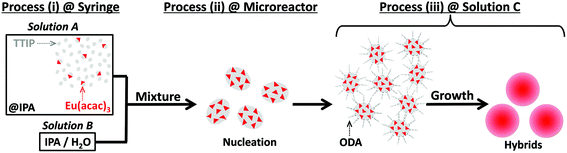 |
| | Scheme 2 Illustration for the proposed formation mechanism of Eu(acac)3-doped titania particles. | |
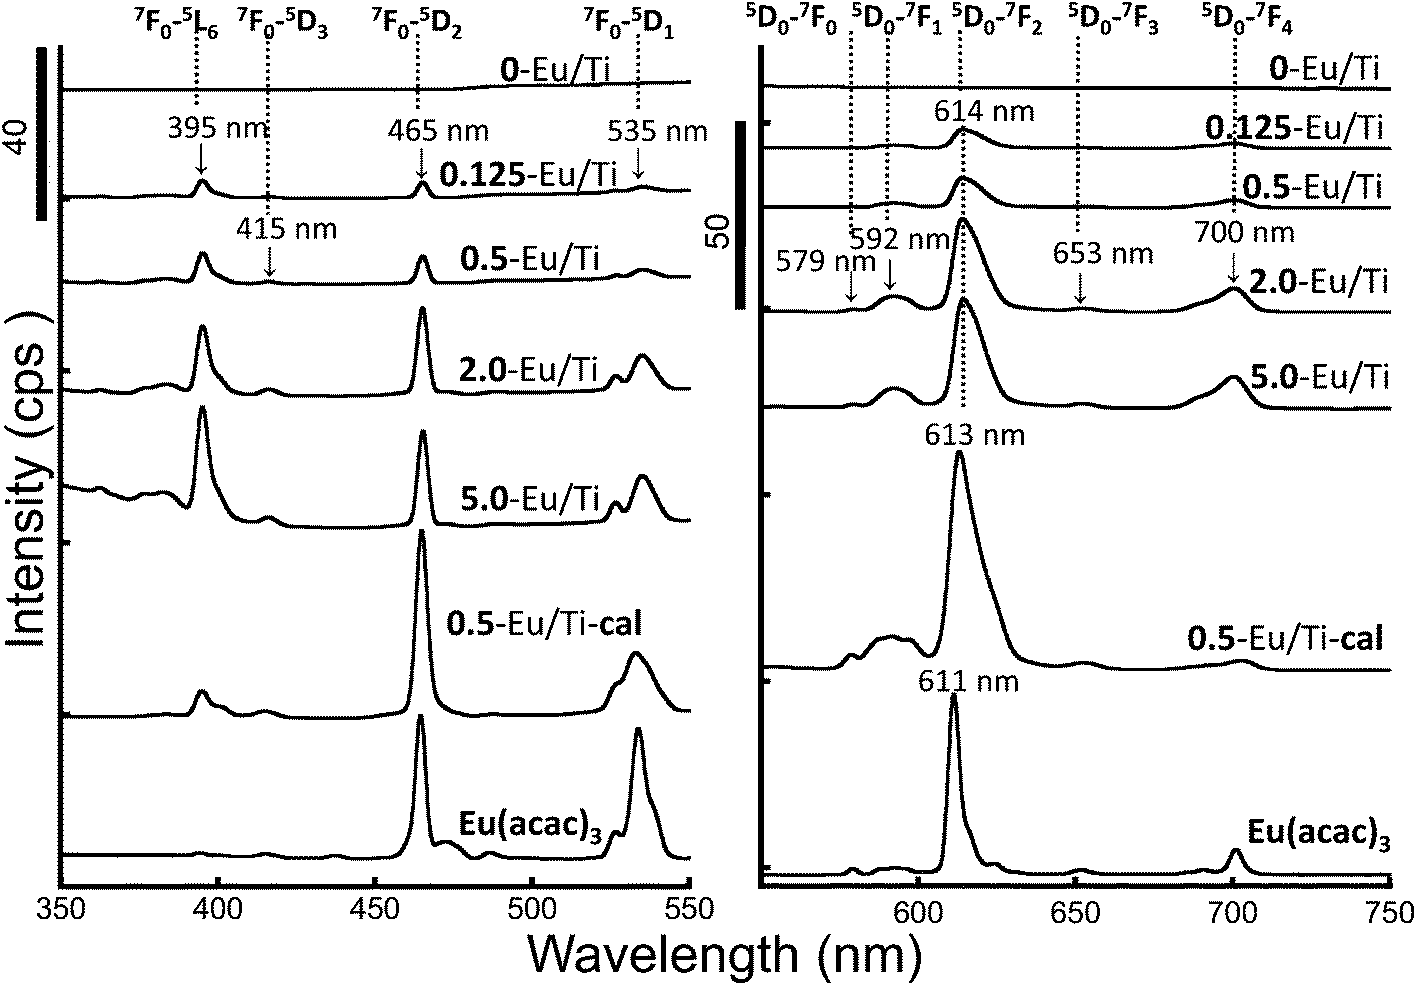
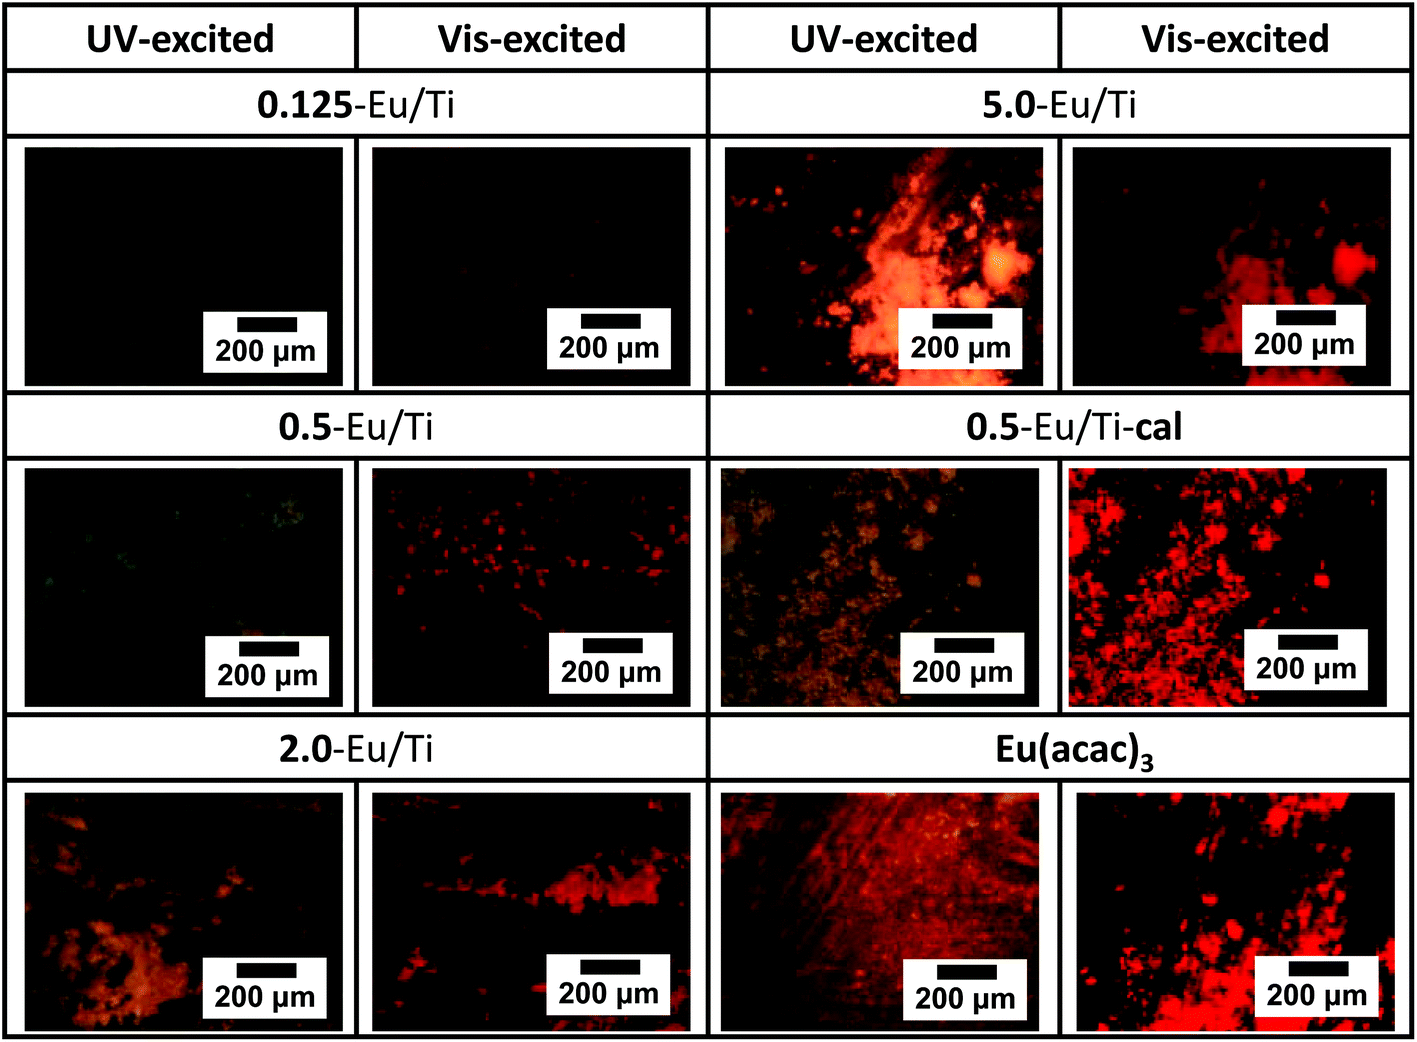
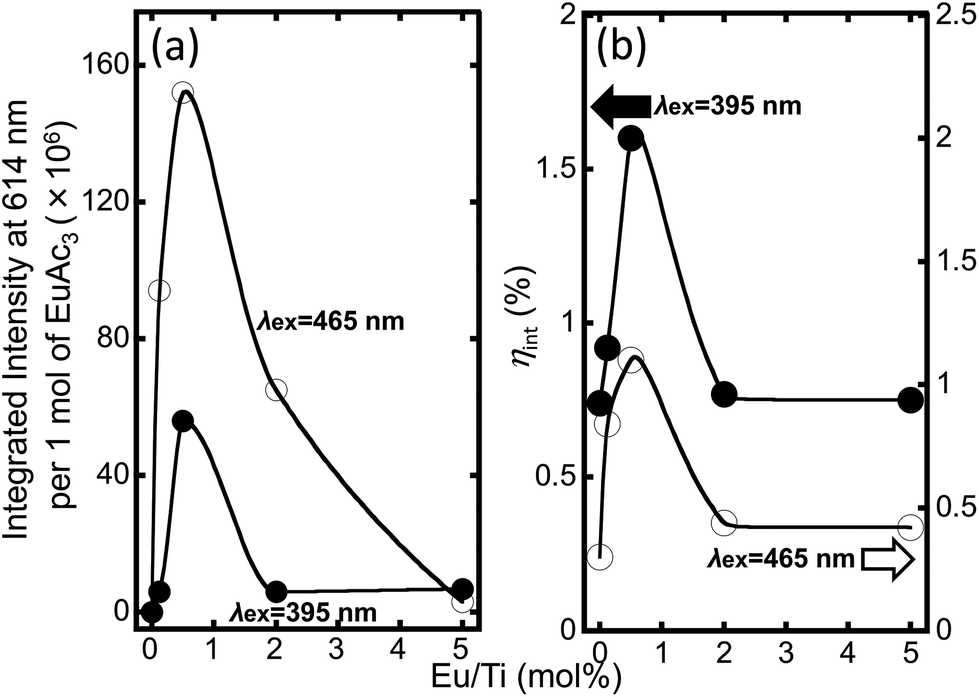
Since the Eu(acac)3-doped titania particles with different Eu/Ti ratios were synthesized, the luminescence properties of the hybrids and their composition dependency were investigated. Fluorescence microscopy images demonstrate that all the samples exhibited luminescence with the excitation wavelengths of 395 nm and 465 nm (Fig. 4). It seems that the sample powder uniformly luminesced, implying that the doped Eu(acac)3 is homogeneously distributed in the hybrid as discussed. Excitation and luminescence spectra were recorded with a detected luminescence wavelength of 614 nm and an excited wavelength of 465 nm, respectively, as shown in Fig. 5. All the observed lines in the luminescence spectra correspond to the transitions from the metastable orbital singlet state 5D0 to spin–orbital states of 7FJ (J = 0, 1, 2, 3, and 4) of Eu3+,7 being seen at 579 nm, 592 nm, 614 nm, 653 nm and 700 nm for 5D0–7F0, 5D0–7F1, 5D0–7F2, 5D0–7F3 and 5D0–7F4, respectively. In the excitation spectra, several lines that can be attributed to typical intra-configurational f–f transitions of the Eu3+ ion were observed as follows: 7F0–5L6 (395 nm), 7F0–5D3 (415 nm), 7F0–5D2 (465 nm) and 7F0–5D1 (535 nm). To compare luminescence behavior among all the samples, we focused on the strongest line centered at 614 nm and the integrated intensity was normalized by the amount (mole) of Eu(acac)3 in each sample (Fig. 6). Interestingly, there is an optimum value; the most efficient luminescence was realized by 0.5-Eu/Ti with an excitation wavelength of 465 nm. The quantum efficiency was estimated to be approx. 1.1%. The luminescence lifetime of all the samples was in the range between 1.7 ms and 2.0 ms, while that of Eu(acac)3 was 0.8 ms, suggesting that fast recombination was suppressed by a proper inter-molecular distance which is explained in the next paragraph.
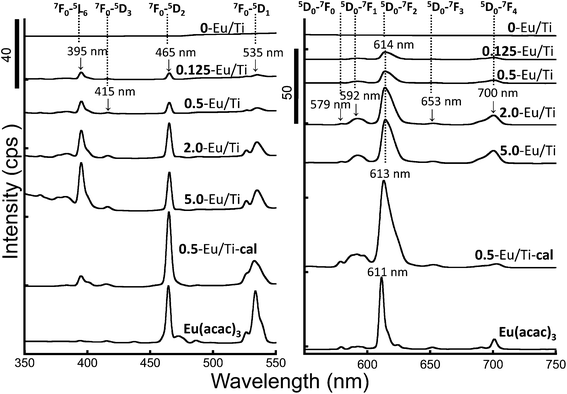 |
| | Fig. 4 (a) Excitation and (b) luminescence spectra of Eu(acac)3 and Eu(acac)3-doped titania particles with different Eu/Ti ratios. The excitation spectra were recorded under the detected luminescence wavelength at 614 nm for 0-Eu/Ti, 0.125-Eu/Ti, 0.5-Eu/Ti and 2.0-Eu/Ti, at 613 nm for 0.5-Eu/Ti-cal and at 611 nm for EuAc3, respectively. The luminescence spectra were obtained under an excited wavelength at 465 nm. | |
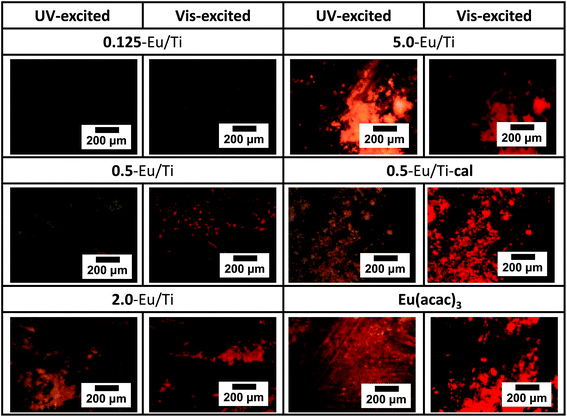 |
| | Fig. 5 Fluorescent microscopy images of Eu(acac)3 and Eu(acac)3-doped titania particles with different Eu/Ti ratios (UV-excited systems; excited filter (BP420-480, OLYMPUS): 360–370 nm/dichroic mirror (DM500, OLYMPUS): ≥400 nm/emitting filter (BA520IF, OLYMPUS) ≥420 nm, Vis-excited systems; excited filter (FF01-377/50-25, Semrock): 480–550 nm/dichroic mirror (BA460IF, OLYMPUS): ≥570 nm/emitting filter (FF409-Di03-25×36, Semrock): ≥590 nm). | |
 |
| | Fig. 6 (a) Integrated intensity at 614 nm per 1 mol of Eu(acac)3 and (b) quantum efficiency at 615 nm (hint) of Eu(acac)3-doped titania particles with different Eu/Ti ratios under the excitation wavelengths at 395 nm and 465 nm, which were measured using the integrating sphere. The intensities of 0.5-Eu/Ti-cal and Eu(acac)3 were 64 and 0.62 under the excitation wavelength 395 nm and 83 and 57 under 465 nm, respectively. The hint of 0.5-Eu/Ti-cal and Eu(acac)3 were 0.83 and 0.35 under the excitation wavelength 395 nm and 1.7 and 8.7 under 465 nm, respectively. | |
To discuss the present result where an optimum luminescence was observed, the inter-molecular distance of Eu(acac)3 in the hybrid was calculated. The details are summarized in Table 3 and Fig. S3.† Consequently, the estimated distance decreases from approx. 23 nm to 0.10 nm as Eu/Ti increases from 0.125 to 5.0. The composition dependent optimum luminescence behavior was reported previously in the Y2O3:Eu3+ system.27 It was pointed out that the optimum luminescence was due to the following two competitive effects: an increase of luminescence center numbers and resulting radiative recombination, and an increase of the cross-relaxation probability which enhances the efficiency of the non-radiative processes. In the case of 0.5-Eu/Ti, the inter-molecular distance was estimated to be 5.6 nm while that for 2.0-Eu/Ti was 1.0 nm. Thus, the luminescence efficiency should be enhanced with Eu/Ti in-between 0.5 and 2.0 because of the increasing number of luminescence centers. A further increase of Eu/Ti results in lower luminescence efficiency owing to cross-relaxation that occurs frequently as the inter-molecular distance becomes closer to 1 nm.28 The estimated inter-molecular distance of 5.0-Eu/Ti was 0.10 nm, inducing a significant decrease of luminescence efficiency.
Table 3 The estimated inter-molecular distance of Eu(acac)3 in a single particle. The detailed estimation process is summarized in Fig. S3
| |
Average inter-molecular distance of Eu(acac)3 (nm) |
| 0-Eu/Ti |
N/A |
| 0.125-Eu/Ti |
23.36 |
| 0.5-Eu/Ti |
5.60 |
| 2.0-Eu/Ti |
1.03 |
| 5.0-Eu/Ti |
0.10 |
| 0.5-Eu/Ti-cal |
— |
As described, 0.5-Eu/Ti exhibited optimum luminescence behavior. The present hybrid particles are amorphous as revealed by XRD (Fig. S1†) and they have a large amount of hydroxyl groups that can work as a quenching center. Thus, 0.5-Eu/Ti was calcined at 550 °C for 6 h to remove such components and the luminescence properties were examined. The excitation and luminescence spectra are shown in Fig. 5. Judging from the excitation spectrum, the environment around Eu3+ became different from that before calcination. We have already reported the water desorption and subsequent organic compound decomposition temperatures determined by TG-DTA.28,29 Based on the reports, the present calcination led to the complete removal of water molecules and the residue of organic molecules, being confirmed by XRF (Table 1) and TG-DTA. In addition to the evaporation of the structural water, the calcination led to crystal phase transition from amorphous to anatase. Such a phase transition partially occurred in the samples upon calcination as shown in the XRD patterns of Fig. S1,† suggesting the presence of mixed amorphous–anatase phases for 0.5-Eu/Ti-cal. As the phase transition proceeds, the uniformly doped Eu(acac)3 was pushed out from the amorphous matrix to remain on the surface of anatase crystallites with possible aggregation.30 For the luminescence spectra, it is known that the 5D0–7F1 and 5D0–7F2 transitions are assigned to the magnetic dipole and electric dipole transitions, respectively.31 The electric-dipole is sensitive to the local structures surrounding the Eu3+ ions, and the magnetic-dipole shows very little variation in the crystal field strength acting on the Eu3+ ions. In this study, the luminescence spectra (Fig. 4) indicated that the relative intensity at 613 nm to that at 590 nm was influenced by the calcination. This phenomenon is attributed to the environmental changes for the centered Eu ions of Eu(acac)3. In detail, the spectral shape of 5D–7F2 transition (Stark splitting state) was clearly different between 0.5-Eu/Ti and 0.5-Eu/Ti-cal samples, suggesting that the interactions between the Eu(acac)3 and titania skeletons significantly affected the spatial symmetry of the centered Eu ions of Eu(acac)3. Therefore, the coordination environment of the centered Eu3+ ions of Eu(acac)3 was controlled by the calcination process, while the environment should be affected by the particle states (e.g., chemical compositions, crystalline phases, etc.). Regarding the luminescence intensity, the integrated intensity of 0.5-Eu/Ti-cal normalized by the amount of Eu was almost half of 0.5-Eu/Ti. Consequently, the amorphous sample can be utilized as a more efficient luminescent material although the effect of the Eu/Ti ratio and crystallite size on the luminescence properties should be investigated in more detail in future studies.
Besides preventing significant aggregation, the doping of Eu(acac)3 into the amorphous titania matrix would reduce damage induced by various external stimuli. To verify this hypothesis, the present hybrid particles were coated on a glass substrate to form a thin film and the film was exposed to irradiation from a mercury/xenon lamp. As a result, no change in luminescence spectra was recognized for all the samples including the Eu(acac)3 coated one. Thus, a harsher condition was applied by UV/ozone treatment. The luminescence spectra and photographs of the films after the treatment are displayed in Fig. S4 and S5.† As shown in Fig. 7, the luminescence intensity of the Eu(acac)3 coated film decreased to almost 50% of the initial value after 15 min of the treatment, while most of the Eu(acac)3-doped titania samples maintained the luminescence intensity of around 70%. These results indicate that the doped Eu(acac)3 was protected from such external stimuli.
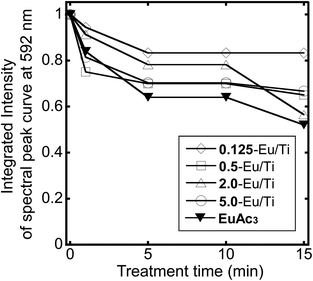 |
| | Fig. 7 Changes in the integrated intensity of the spectral peak curve at 592 nm of Eu(acac)3 and Eu(acac)3-doped titania particles with different Eu/Ti ratios under the UV/ozone treatment for 15 min. | |
Conclusions
Europium(III) acetylacetonate (Eu(acac)3)-doped well-defined amorphous titania particles were synthesized by a sol–gel reaction of titanium tetraisopropoxide in the presence of Eu(acac)3. A microreactor with a Y-shape junction was used to control the nucleation and growth of the doped particles. The Eu(acac)3-doped particles with different molar Eu/Ti ratios (0.125, 0.5, 2.0 and 5.0) were prepared and the relationship between Eu/Ti and luminescence behavior was investigated. It was found that there was an optimum Eu/Ti value (0.5) that exhibited the strongest luminescence. The Eu(acac)3-doped particles with the optimum Eu/Ti was calcined at 550 °C for 6 h to remove physically/chemically bound water that usually works as a quenching factor. However, the calcined sample showed lower luminescence efficiency probably because of crystal phase transition that could accompany the aggregation of Eu species on the crystallite surface, resulting in quenching. The present Eu(acac)3-doped particles were coated on a glass substrate and the effects of external stimuli such as light irradiation from a mercury/xenon lamp and UV/ozone treatment were examined. Consequently, the film composed of the Eu(acac)3-doped particles demonstrated luminescence without significant deterioration compared to that from bare Eu(acac)3. The present results will help in the design of efficient luminescent materials for industrial applications that require long term stability under environmental conditions.
Conflicts of interest
There are no conflicts to declare.
Acknowledgements
This research was supported by the World Premier International Research Center Initiative on Materials Nanoarchitectonics (WPI-MANA), and was also supported by a grant from the Japan Society for the Promotion of Science (JSPS) KAKENHI (Grant-in-Aid for Young Scientists (A), Grant No. 17H04954).
Notes and references
- D. H. Chen and R. A. Caruso, Adv. Funct. Mater., 2013, 23, 1356–1374 CrossRef CAS.
- G. Chen, H. Agren, T. Y. Ohulchanskyy and P. N. Prasad, Chem. Soc. Rev., 2015, 44, 1680–1713 RSC.
- W. Zheng, P. Huang, D. Tu, E. Ma, H. Zhu and X. Chen, Chem. Soc. Rev., 2015, 44, 1379–1415 RSC.
- H. Dong, S.-R. Du, X.-Y. Zheng, G.-M. Lyu, L.-D. Sun, L.-D. Li, P.-Z. Zhang, C. Zhang and C.-H. Yan, Chem. Rev., 2015, 115, 10725–10815 CrossRef CAS PubMed.
- P. Escribano, B. Julian-Lopez, J. Planelles-Arago, E. Cordoncillo, B. Viana and C. Sanchez, J. Mater. Chem., 2008, 18, 23–40 RSC.
- B. Zhou, B. Shi, D. Jin and X. Liu, Nat. Nanotechnol., 2015, 10, 924–936 CrossRef CAS PubMed.
- K. Binnemans, Coord. Chem. Rev., 2015, 295, 1–45 CrossRef CAS.
- L. Li, C. K. Tsung, Z. Yang, G. D. Stucky, L. D. Sun, J. F. Wang and C. H. Yan, Adv. Mater., 2008, 20, 903–908 CrossRef CAS.
- R. S. Ningthoujam, V. Sudarsan, R. K. Vatsa, R. M. Kadam, Jagannath and A. Gupta, J. Alloys Compd., 2009, 486, 864–870 CrossRef CAS.
- Z. L. Xu, Q. J. Yang, C. Xie, W. J. Yan, Y. G. Du, Z. M. Gao and J. H. Zhang, J. Mater. Sci., 2005, 40, 1539–1541 CrossRef CAS.
- C. Leostean, M. Stefan, O. Pana, A. I. Cadis, R. C. Suciu, T. D. Silipas and E. Gautron, J. Alloys Compd., 2013, 575, 29–39 CrossRef CAS.
- M. Pal, U. Pal, J. Jimenez and F. Perez-Rodriguez, Nanoscale Res. Lett., 2012, 7, 1–12 CrossRef PubMed.
- M. Luo, K. Cheng, W. J. Weng, C. L. Song, P. Y. Du, G. Shen, G. Xu and G. R. Han, Nanoscale Res. Lett., 2009, 4, 809–813 CrossRef CAS PubMed.
- H. K. Yu, G. R. Yi, J. H. Kang, Y. S. Cho, V. N. Manoharan, D. J. Pine and S. M. Yang, Chem. Mater., 2008, 20, 2704–2710 CrossRef CAS.
- M. Yan, H. F. Zou, H. Zhao, Y. H. Song, K. Y. Zheng, Y. Sheng, G. J. Wang and Q. S. Huo, CrystEngComm, 2014, 16, 9216–9223 RSC.
- J. Ovenstone, P. J. Titler, R. Withnall and J. Silver, J. Phys. Chem. B, 2001, 105, 7170–7177 CrossRef CAS.
- J. Ovenstone, P. J. Titler, R. Withnall and J. Silver, J. Mater. Res., 2002, 17, 2524–2531 CrossRef CAS.
- J. Yin, L. Xiang and X. Zhao, Appl. Phys. Lett., 2007, 90, 113112 CrossRef.
- M. Q. Tan, G. L. Wang, Z. Q. Ye and J. L. Yuan, J. Lumin., 2006, 117, 20–28 CrossRef CAS.
- A. Yamamoto and S. Kambara, J. Am. Chem. Soc., 1957, 79, 4344–4348 CrossRef CAS.
- A. Yamamoto and S. Kambara, J. Am. Chem. Soc., 1959, 81, 2663–2667 CrossRef CAS.
- K. Shiba and M. Ogawa, Chem. Commun., 2009, 6851–6853 RSC.
- K. Shiba, K. Onaka and M. Ogawa, RSC Adv., 2012, 2, 1343–1349 RSC.
- C. Y. Liang, E. J. Schimitschek, D. H. Stephens and J. A. Trias, J. Chem. Phys., 1967, 46, 1588–1593 CrossRef CAS.
- S. Tieng, R. Azouani, K. Chhor and A. Kanaev, J. Phys. Chem. C, 2011, 115, 5244–5250 CAS.
- K. Shiba, T. Kataoka, M. Okuda, S. Blanco-Canosa and M. Tagaya, RSC Adv., 2016, 6, 55750–55754 RSC.
- I. E. Kolesnikov, A. V. Povolotskiy, D. V. Mamonova, E. Lahderanta, A. A. Manshina and M. D. Mikhailov, RSC Adv., 2016, 6, 76533–76541 RSC.
- K. Shiba, T. Kataoka, M. Okuda, S. Blanco-Canosa and M. Tagaya, RSC Adv., 2016, 6, 55750–55754 RSC.
- K. Shiba, M. Tagaya and N. Hanagata, ACS Appl. Mater. Interfaces, 2014, 6, 6825–6834 CAS.
- X. Qin, Y. Ju, S. Bernhard and N. Yao, J. Mater. Res., 2011, 20, 2960–2968 CrossRef.
- J. Wang, H. Song, X. Kong, H. Peng, B. Sun, B. Chen, J. Zhang, W. Xu and H. Xia, J. Appl. Phys., 2003, 93, 1482–1486 CrossRef CAS.
Footnote |
| † Electronic supplementary information (ESI) available: XRD patterns (Fig. S1) and TEM images (Fig. S2) of Eu(acac)3 and titania/Eu(acac)3 hybrids with different Eu/Ti ratios, estimation of Eu(acac)3 molecular distance in the hybrids based on a geometrical calculation (Fig. S3), photographs (Fig. S4) and luminescence spectral changes (Fig. S5) of Eu(acac)3 and titania/Eu(acac)3 hybrid films with different Eu/Ti ratios. See DOI: 10.1039/c7dt03035e |
|
| This journal is © The Royal Society of Chemistry 2018 |
Click here to see how this site uses Cookies. View our privacy policy here. 
 Open Access Article
 This Open Access Article is licensed under a
  *a,
Takuya
Kataoka
b and
Motohiro
Tagaya
*a,
Takuya
Kataoka
b and
Motohiro
Tagaya