 Open Access Article
Creative Commons Attribution 3.0 Unported Licence
Correction: High-temperature X-ray diffraction and thermal expansion of nanocrystalline and coarse-crystalline acanthite α-Ag2S and argentite β-Ag2S
S. I.
Sadovnikov
a,
A. I.
Gusev
*a,
A. V.
Chukin
b and
A. A.
Rempel
a
aInstitute of Solid State Chemistry, Ural Branch of the Russian Academy of Sciences, Ekaterinburg 620990, Russia. E-mail: gusev@ihim.uran.ru
bUral Federal University named after the First President of Russia B.N. Yeltsin, Ekaterinburg, 620002, Russia
First published on 24th January 2018
Abstract
Correction for ‘High-temperature X-ray diffraction and thermal expansion of nanocrystalline and coarse-crystalline acanthite α-Ag2S and argentite β-Ag2S’ by S. I. Sadovnikov et al., Phys. Chem. Chem. Phys., 2016, 18, 4617–4626.
The authors wish to draw the readers' attention to their previous related study, published in Physics of the Solid State,1 which should have been cited in this Physical Chemistry Chemical Physics paper.
The study published in this Physical Chemistry Chemical Physics paper contains new experimental X-ray diffraction data, differential thermal and thermogravimetric analysis (DTA-DTG) results and data on the acanthite–argentite phase transformation enthalpy. This Physical Chemistry Chemical Physics paper was accepted before the publication of ref. 1 but published after ref. 1. Therefore ref. 1 should have been cited in this Physical Chemistry Chemical Physics paper.
The authors regret not giving the correct attribution for Fig. 4, 6, 7, 8 and 9 in the paper, which were reproduced for the readers' information. The figures are reproduced below with the correct copyright permission text.
 | ||
Fig. 4 The effect of temperature T on the unit cell parameters a, b, c, β, and volume V, and on the volumetric thermal expansion coefficient βV of coarse- and nanocrystalline acanthite. The approximation of the experimental data by the solid line and the closed symbols (●), (▲), (▼), (×), (■), and (♦) corresponds to coarse-crystalline acanthite and the approximation by the dotted line and the open symbols ( ), ( ), ( ), ( ), ( ), ( ), ( ), ( ), ( ), and ( ), and ( ) corresponds to nanocrystalline acanthite. Reproduced from ref. 1 with permission from Springer. ) corresponds to nanocrystalline acanthite. Reproduced from ref. 1 with permission from Springer. | ||
 | ||
| Fig. 6 Evolution of XRD patterns of coarse-crystalline argentite β-Ag2S in the temperature range of 446–623 K. The inset shows a systematic displacement of the (200) diffraction reflection of bcc argentite with increase of measuring temperature. Reproduced from ref. 1 with permission from Springer. | ||
 | ||
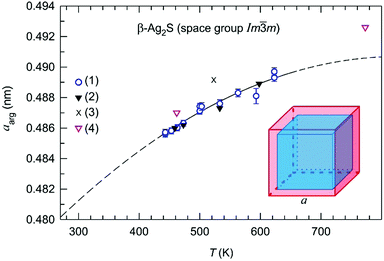
| Fig. 7 Dependence of the lattice constant aarg of argentite β-Ag2S on the temperature T: (1) data of present work; (2), (3), and (4) data,22,24,27 respectively. The approximations of measured lattice constant aarg by the function (10) in the temperature range of 440–660 K is shown by solid lines. Reproduced with some changes from ref. 1 with permission from Springer. | ||
 | ||
| Fig. 8 Temperature dependence of linear thermal expansion coefficient αarg of argentite β-Ag2S and its approximation by the function (12). Reproduced from ref. 1 with permission from Springer. | ||
 | ||
Fig. 9 The temperature dependencies of reduced volume Vun.cell/z (a) and isotropic linear thermal expansion coefficient α (b) of silver sulfide in the of range 300–623 K. At ∼440 K, there take place jumps of the reduced volume and the thermal expansion coefficient α attributed to the first-order acanthite–argentite phase transformation. Isotropic linear thermal expansion coefficient αac-nano![[thin space (1/6-em)]](https://www.rsc.org/images/entities/char_2009.gif) isotr of nanocrystalline acanthite α-Ag2S is larger than αac isotr of nanocrystalline acanthite α-Ag2S is larger than αac![[thin space (1/6-em)]](https://www.rsc.org/images/entities/char_2009.gif) isotr of coarse-crystalline acanthite. Reproduced with changes from ref. 1 with permission from Springer. isotr of coarse-crystalline acanthite. Reproduced with changes from ref. 1 with permission from Springer. | ||
The Royal Society of Chemistry apologises for these errors and any consequent inconvenience to authors and readers.
References
- A. I. Gusev, S. I. Sadovnikov, A. V. Chukin and A. A. Rempel, Phys. Solid State, 2016, 58, 251–257 CrossRef CAS.
| This journal is © the Owner Societies 2018 |
