
 Open Access Article
 This Open Access Article is licensed under a Creative Commons Attribution-Non Commercial 3.0 Unported Licence
Ab initio electronic structure calculations of entire blue copper azurins†
Carlos
Romero-Muñiz
 *a,
María
Ortega
a,
J. G.
Vilhena
ab,
I.
Díez-Pérez
cd,
Juan Carlos
Cuevas
ae,
Rubén
Pérez
*ae and
Linda A.
Zotti
*ae
*a,
María
Ortega
a,
J. G.
Vilhena
ab,
I.
Díez-Pérez
cd,
Juan Carlos
Cuevas
ae,
Rubén
Pérez
*ae and
Linda A.
Zotti
*ae
aDepartamento de Física Teórica de la Materia Condensada, Universidad Autónoma de Madrid, E-28049 Madrid, Spain. E-mail: carlos.romero@uam.es; ruben.perez@uam.es; linda.zotti@uam.es
bDepartment of Physics, University of Basel, Klingelbergstrasse 82, CH-4056 Basel, Switzerland
cDepartment of Materials Science and Physical Chemistry & Institute of Theoretical and Computational Chemistry (IQTCUB), University of Barcelona, Martí i Franquès, 1, Barcelona 08028, Spain
dDepartment of Chemistry, Faculty of Natural & Mathematical Sciences, King's College London, Britannia House, 7 Trinity Street, London SE1 1DB, UK
eCondensed Matter Physics Center (IFIMAC), Universidad Autónoma de Madrid, E-28049 Madrid, Spain
First published on 22nd November 2018
Abstract
We present a theoretical study of the blue-copper azurin extracted from Pseudomonas aeruginosa and several of its single amino acid mutants. For the first time, we consider the whole structure of this kind of protein rather than limiting our analysis to the copper complex only. This is accomplished by combining fully ab initio calculations based on density functional theory with atomic-scale molecular dynamics simulations. Beyond the main features arising from the copper complex, our study reveals the role played by the peripheral parts of the proteins. In particular, we find that oxygen atoms belonging to carboxyl groups which are distributed all over the protein contribute to electronic states near the HOMO. The contribution of the outer regions to the electronic structure of azurins had so far been overlooked. Our results highlight the need to investigate them thoroughly; this is especially important in prospect of understanding complex processes such as the electronic transport through metal–metalloprotein–metal junctions.
Introduction
Despite the low concentration of metallic ions in living beings, they are involved in most of the primary biological chemical processes responsible for life. A remarkable number of proteins – commonly referred to as metalloproteins – contain a metal ion cofactor which is essential for their biological functions to be carried out properly. These include, for instance, the fixation of atmospheric nitrogen carried out by some bacteria, the oxidative phosphorylation performed by cytochromes, the photosynthesis thanks to the electronic structure of the chlorophyll, O2/CO2 transport through the bloodstream by iron centers of hemoglobin and myoglobin, and many other reactions of extreme importance.1 Since few organic molecules can act as oxidizing or reducing agents, these metallic centers are often involved in redox processes. Metal ions present in metalloproteins are usually coordinated by different amino acid residues of the proteins or other external ligands. The most frequently observed ligands are nitrogen, oxygen or sulfur atoms located in the side-chains of the amino acid residues of the protein. Some examples of these donor groups can be found in the imidazole rings of histidine, the thiolate substituents of cysteine residues, carbonyl and carboxylate groups, and others.2Among the metalloproteins present in nature, azurins have been the subject of numerous studies. Azurin is a type I blue copper protein with a molecular mass of 14 kDa (∼2000 atoms), found in Pseudomonas, Bordetella, or Alcaligenes bacteria. Its oxidation–reduction between Cu(I) and Cu(II) is related to the denitrification processes in bacteria, transferring single electrons between enzymes associated with the cytochrome chain.1
Blue copper azurins have been extensively characterized by means of multiple techniques which include X-ray diffraction,3,4 electron paramagnetic resonance5,6 or nuclear magnetic resonance.7,8 The pioneering work of E. I. Solomon's group was particularly successful in unveiling the electronic structure of Cu sites in various copper proteins by using a combination of spectroscopic techniques and quantum calculations.9–14 Initially, these seminal works mostly aimed at understanding the main spectroscopic features, especially the investigation of the excited d-states, which are responsible for the peculiar absorption spectra of copper proteins, giving rise, in most cases, to their characteristic intense blue coloration. Subsequent studies,15–21 based mainly on spectroscopy-directed first-principles calculations, shed new light in this regard.
Azurin mutants have also been investigated in depth. A highly tunable variability of the protein redox potential, which spans over a 700 mV range, was found, depending on the specific mutant and without significantly altering the redox-active site.22,23 Moreover, it was demonstrated that not only can its value be affected by the replacement of the nearest residues but also by outer-sphere residues. For this purpose, several theoretical approaches are currently available to estimate the redox potential of different mutants.24–26 However, this complex behavior, which determines the changes in the reduction potential upon mutation, is still unclear and a deep understanding of what governs them is to date still missing.
Unfortunately, due to computational limitations, most studies either made use of isolated partial fragments of the protein15–19 or employed quantum mechanics/molecular mechanics methods20,21 (i.e. which are not fully ab initio). As for the use of fragments, although it succeeded in describing the chemical bonds, their excited states and some spectroscopic features of the Cu-complex (e.g. g-tensor or hyperfine coupling constants), it cannot fully address other relevant aspects like the charge description, the energy position of all electronic levels or the spatial distribution of the most relevant molecular orbitals, which are impossible to determine without considering the whole protein.16,17 Interesting studies showed that the electron density of proteins can be described quite accurately by means of partitioning schemes such as MFCC (molecular fractionation with conjugated caps).27,28 The clear advantage of these techniques is the possibility of describing each fragment by high-quality basis sets and functionals. However, the low-coupling between fragments on which the decomposition is based may not necessarily ensure a correct description of the charge delocalization, especially if this takes place across the whole system. Other techniques based on decomposition and which present the same drawback have also been used in the past.29 This might hinder the study of the electron transport properties and, consequently, methods which avoid system decompositions are needed for this purpose.
More recently, electron transport through redox copper proteins has also attracted a lot of attention.30–33 In particular, the unique interplay between optical and vibronic properties with electron transfer,34–38 together with biorecognition capabilities, makes azurin proteins very promising candidates for molecular bioelectronic applications.39,40 Moreover, the possibility of tuning the transport properties via single amino acid mutations makes this proposal even more attractive.41,42 However, a proper description of transport mechanisms is extremely complicated, not only because of the complex nature of the proteins but also because of a number of various factors which, to date, remains unclear: the interaction with the electrodes,38 the orientation of the protein relative to them,43 the oxidation state of the metallic center and its environment,34,44 and the conformational state of the protein,43 that might be relevant even in small globular proteins like azurins. There is no general agreement about the quantitative influence of these factors and there are still many unanswered questions but it is well known that protein–electrode coupling plays a major role in the electron transport,38 similarly to what it is observed in small organic molecules.45,46 In this sense, gaining knowledge about the more external part of the protein, which is what would be connected to the electrodes in a bioelectronic interface, is absolutely necessary; in fact, information about possible coupling scenarios between the metal leads and the protein cannot be provided by restricting analyses to the central complex only.
Therefore, the aim of this work is to move one step forward in this direction by unveiling the complete electronic structure of the whole copper azurin and some of its variants carrying point-site mutations at the protein surface. The first calculation of a whole protein was based on a fully semi-empirical treatment.47 Later on, a fully ab initio study was applied to a whole metallothionein.48 This inspiring study indicated to us the way to pursue for even much larger proteins such as azurins. In this work, we will focus on a single-Cu protein, namely the azurin extracted from Pseudomonas aeruginosa, which is a prototypical example of electron-transfer metalloprotein (see the structure in Fig. 1). We use classical molecular dynamics (MD) simulations to study the evolution of the tertiary structure of the proteins in water at pH 4.5 as a function of time. This allows us to get access to the structures available at room temperature. Subsequently, we probe some of the equilibrium geometries of the protein extracted at different times (without the surrounding water) with a fully quantum approach based on density functional theory (DFT). Taking advantage of the latest computational progress implemented in a highly efficient localized orbital code, we are able to describe the whole protein at different frames of the MD throughout the total time trajectories. In this way, we obtain information about the electronic properties of the system following a statistical approach which takes into account the thermal fluctuations of the systems. We also study how it is affected by the substitution of single amino acids.
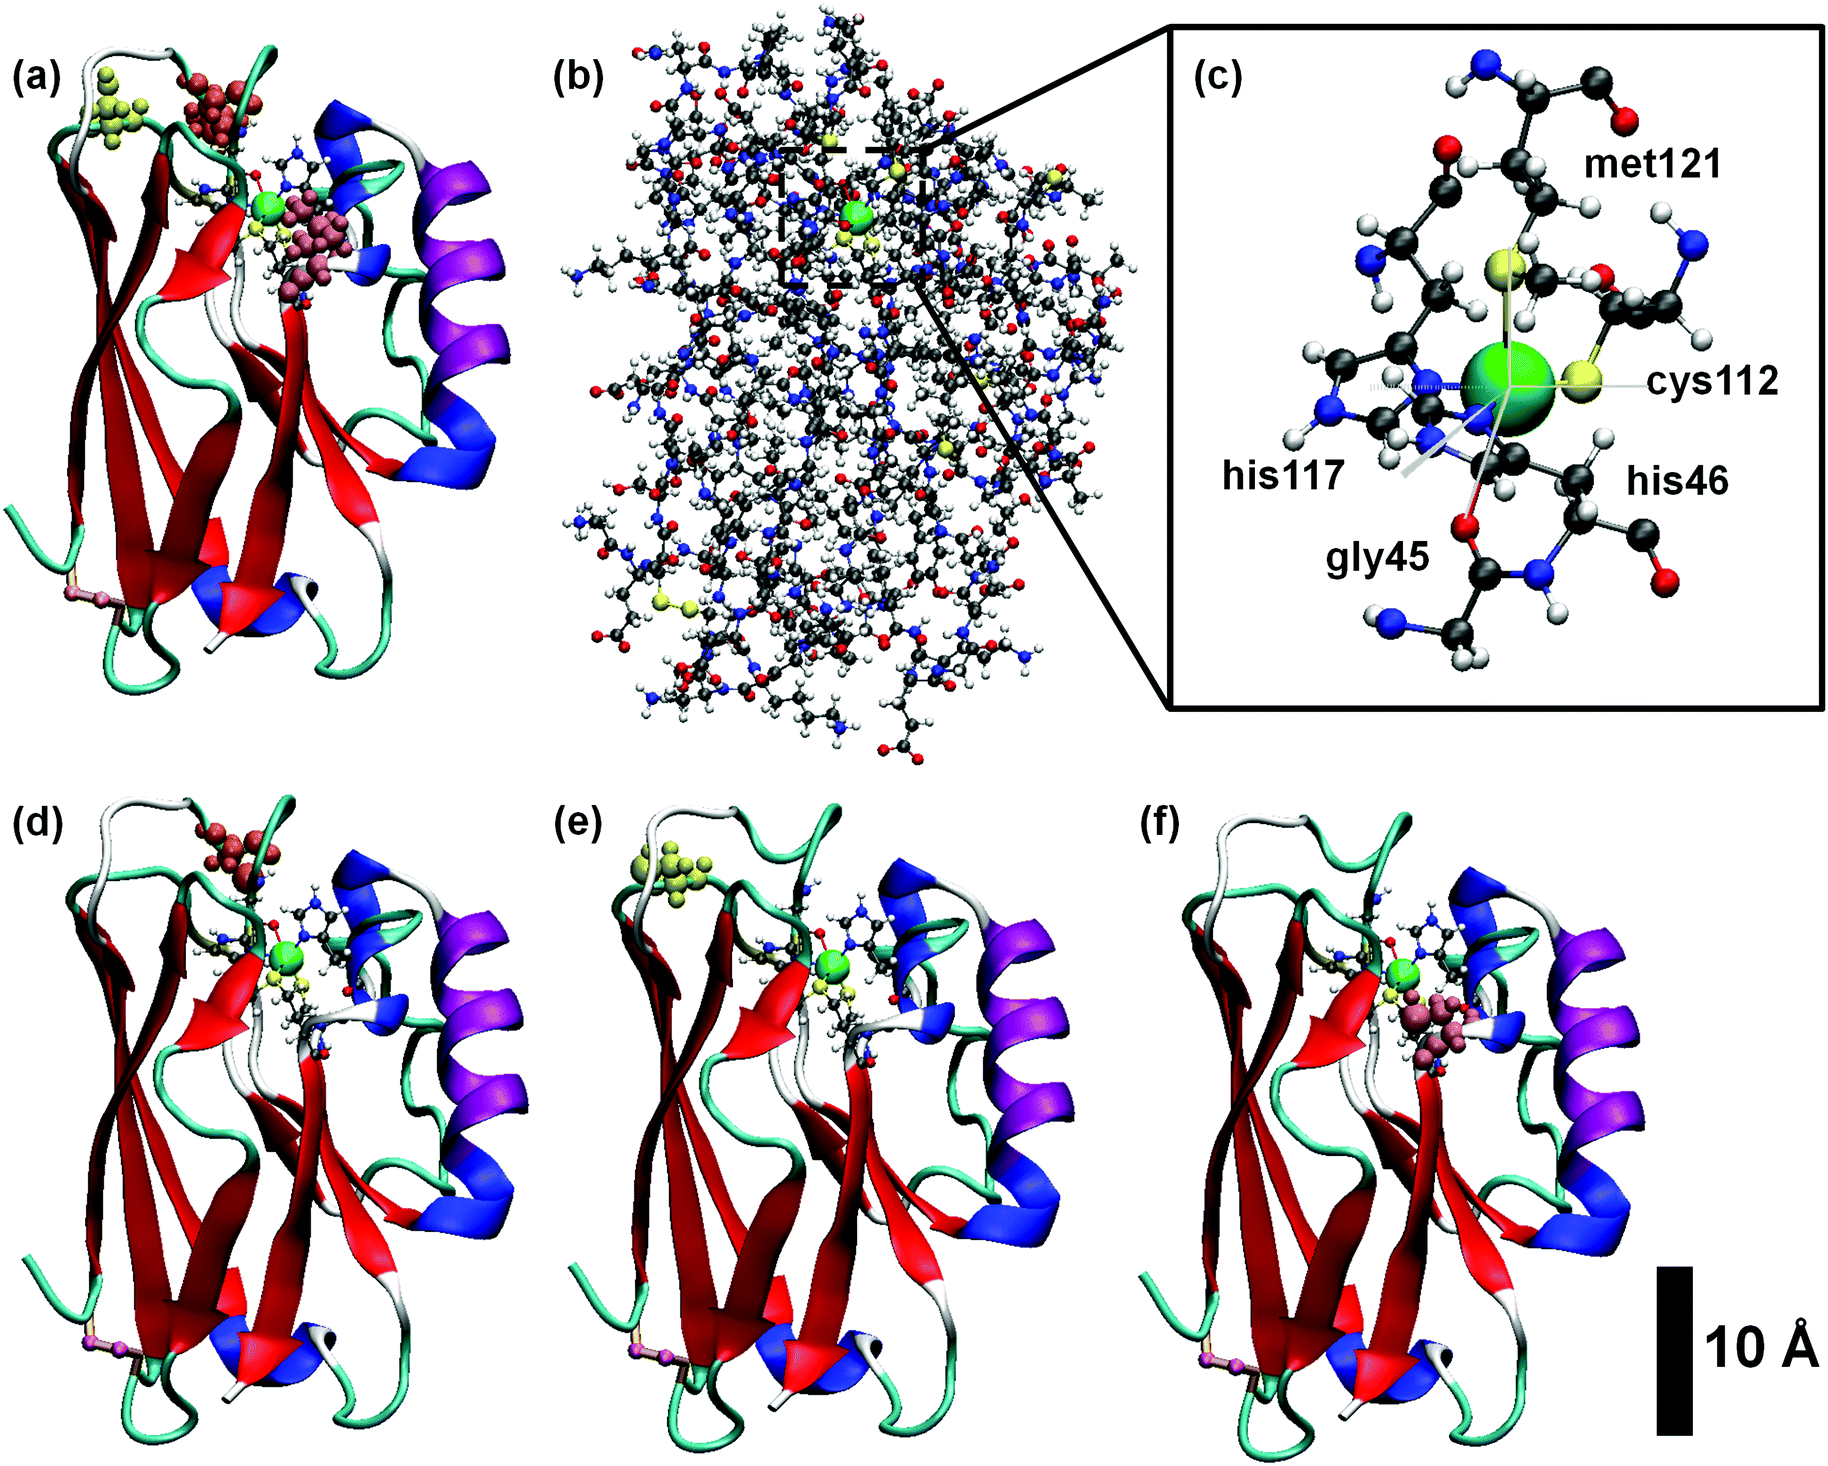 | ||
| Fig. 1 Structure of the blue copper azurin of Pseudomonas aeruginosa used in this work and some of its single amino acid mutants. (a) Ribbon representation of the tertiary structure of the protein, showing the amino acids of the first coordination sphere of the Cu center. (b) Ball-and-stick model of the whole protein. (c) Detailed view of the Cu complex of the protein displaying the five residues of the first coordination sphere with its typical geometry of distorted trigonal bipyramid. Ribbon representations of the mutants of the azurin considered in this work: K41C (d), S89C (e) and L120C (f). Notice that in all cases the Cu center is represented by a green sphere and the amino acids involved in the mutations are highlighted in different colors. | ||
We conclude that a complete description of the whole protein is essential to properly address some key aspects of this system. For example, our analysis reveals that a significant number of occupied states, which appear close to the HOMO, comes from the oxygen atoms belonging to the carboxyl groups of acidic amino acids. They are spatially localized all over the protein but line up at very close energies from each other. We also show that, for all proteins here considered, the HOMO always stems from the Cu–S bonding, in agreement with previous literature. Finally, we observe that the way the state spin degeneracy is broken plays a major role in the profile of the total density of states. Overall, our findings illustrate the complexity of the electronic landscape of this biomolecular system. To the best of our knowledge, this is the first ab initio study of the entire structure of a blue copper azurin.
Results and discussion
Traditionally, copper sites have been classified into three different types according to their spectroscopic features, which reflect the geometric and electronic structure of the active site:2,49 type I (T1Cu) or blue copper, with trigonal (bi)pyramidal geometry, type II (T2Cu) or normal copper, which exhibit a square planar coordination, and type III (T3Cu) or coupled binuclear copper centers. More recently, other kinds of centers were added to the list.50,51 All type I copper centers are characterized by a single Cu ion coordinated by two histidine residues and a cysteine residue in a trigonal planar structure, and one or two variable axial ligands. In proteins like amicyanin, plastocyanin and pseudoazurin, the fourth axial ligand usually consists of the sulfur atom of a methionine residue, although a different amino acid like glutamine can also be found. Azurins, however, besides the methionine ligand, contain an extra axial ligand, namely a carbonyl group of a glycine residue. Consequently, the Cu complex embedded in the azurin protein displays a distorted five-coordinated trigonal bipyramidal structure,4,6 as depicted in Fig. 1c. It is worth noting that, unlike other proteins, Cu-azurins display minimal structural differences between the reduced Cu(I) and oxidized Cu(II) states.14In order to obtain the thermal equilibrium configurations of the azurin proteins studied in this work, we have carried out MD simulations at room temperature and pH 4.5 (see Section S3 of ESI† for a detailed description of the protonation state). Then, we analyze the free dynamics up to 500 ns (see the Methods section for more details). Besides the azurin extracted from Pseudomonas aeruginosa, which will hereafter be simply called holo, we also considered the apo (lack of Cu) variant. In addition, we have simulated the free dynamics of three mutants, i.e. K41C, L120C and S89C (where three different amino acids, lysine, leucine and serine, respectively, are replaced by a cysteine); the mutations are located at different distances from the Cu center and in all cases beyond the first coordination sphere, as shown in Fig. 1d–f (see Fig. S1 for more details, ESI†). The choice of cysteine as replacing residue is related to anchoring purposes in transport experiments underway. Our detailed analysis of the evolution of several azurin structural magnitudes (root-mean-square deviation, radius of gyration, secondary structure content, see Fig. S1–S5 of the ESI†) reveals that no remarkable structural changes (smaller than 1 Å) are produced in the overall structure by the presence of mutations.
We will first focus on the native or wild-type azurin (named holo in this text). As mentioned above, in this work we study, for the first time, the electronic properties of the whole azurin proteins. We start analyzing the properties revealed by these calculations for the Cu center, which has been previously studied in detail and which has been claimed to play an important role in charge-transfer processes. In Fig. 2, we present the spin-resolved projected density of states (PDOS) of the copper atom as well as selected atoms in surrounding residues of the first coordination sphere: S-met121, S-cys112, N-his117 and N-his46. We have not included the fifth ligand, O-gly45, because the corresponding electronic states show up at lower energies with respect to the chemical potential. We remark that the chemical potential is defined as the energy of the last occupied state, determined by integrating the charge density up to the total number of electrons in the system. We observe that the PDOS profiles of these atoms are very similar for different frames along the MD simulation or between different mutants. In the particular case of the Cu ion, five peaks, corresponding to the five d orbitals of the transition metal, appear below the chemical potential in all cases. Conversely, s orbitals appear as empty states well above the chemical potential. Notice that, for this atom, the spin degeneracy is broken in most cases and that the highest d-peak is always very close to the chemical potential and represents the major contribution to the SOMO level. This is in agreement with what was found in previous literature.14 As it is deduced from Fig. 2, this electronic level has also a remarkable contribution from the S atom of the cys112 and minor contributions from N atoms of his117 and his46. This result reflects the covalent bonding of the Cu-center with the surrounding ligands, in good agreement with previous reports.15,16,19 The bonding stems from the strong π overlap between the 3d-Cu orbitals and the out-of-(Cu–S–Cβ)-plane 3p-S orbital of cys112 residue. This electronic level constitutes the redox-active molecular orbital, which extends over both the Cu and the thiolate ligand with minor contributions of the histidines. Our statistical analysis reveals that this electronic structure remains unaltered for all mutants during the evolution of the MD (see Fig. S9–S12 in the ESI† for an overview of all frames and Section S2 (ESI†) for a detailed discussion of how the frames considered were selected).
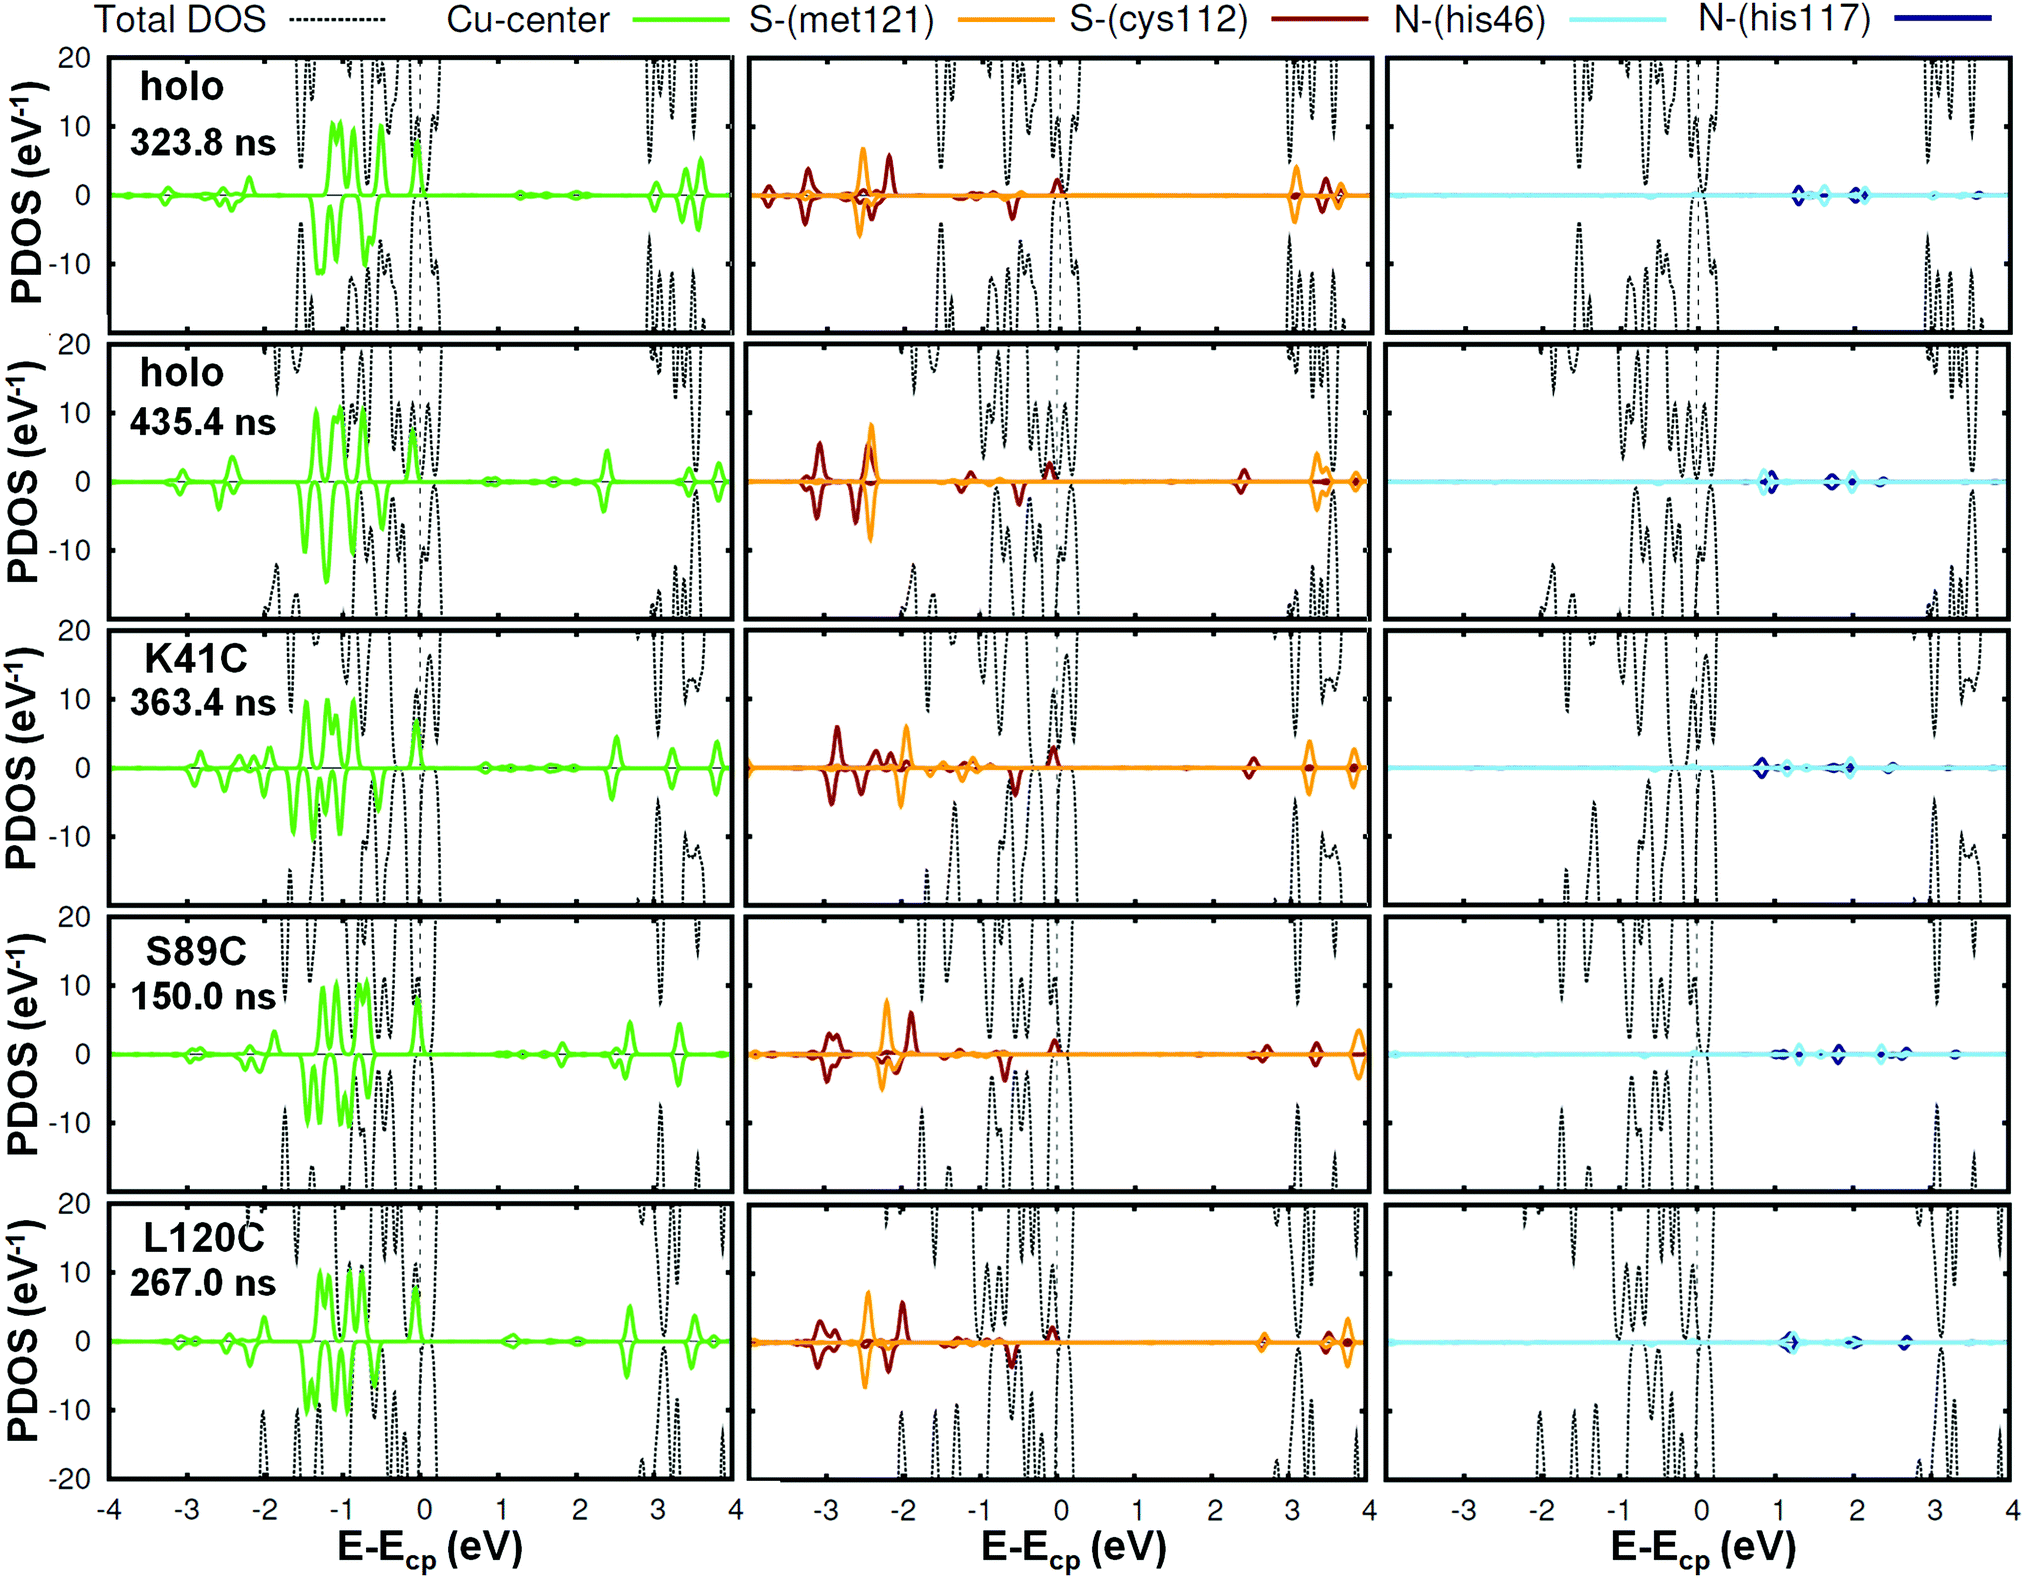 | ||
| Fig. 2 Spin resolved projected density of states of the Cu center (left panel) and other atoms involved in the coordination bonds: S-met121, S-cys112, (middle panel) N-his46 and N-his117 (right panel) for different cases. Positive and negative values correspond to spin up and spin down curves, respectively. The total-DOS curves have been truncated (see Fig. 4 for a full representation). We have selected two frames in the holo case, and one more for each mutant. The corresponding curves for all the other frames are reported in the ESI† (Fig. S9–S12). Notice that a peak which is positioned slightly below the chemical potential Ecp and arises from the Cu bonding appears in all cases. | ||
To get further insight into the behavior of the Cu-complex during the MD simulations we analyzed the evolution of the Cu Mulliken charge, the Cu magnetic moment μ and the energetic position of the SOMO. In Table 1, we report the values of these quantities for different frames of the MD trajectories as well as their corresponding average values and standard deviations. These parameters remain constant in time, with slight variations due to the thermal fluctuations throughout the MD simulation. The charge of the Cu ion was found to keep very close to +1e state of copper. Note that this charge value is the same in all mutants and its variations are less than ∼10%, highlighting the robustness of our calculations. The same applies to the magnetic moment of the Cu ion, which is about 0.27–0.29 μB. Conversely, a greater dispersion is observed in the SOMO energy position, which is evaluated as the center of the highest PDOS occupied peak; it is approximately located at ∼–3 eV in all cases with slight fluctuations among the mutants. The dispersion observed prevents us from making further statements about this point.
| Protein (atoms) | Time (ns) | ΔE (meV at.−1) | Cu-q (e) | μ(Cu) (μB) | SOMO (eV) | μ(tot) (μB) |
|---|---|---|---|---|---|---|
| Holo (1929) | Crystal | −8.06 | 1.011 | −0.230 | −2.855 | 0.283 |
| 57.0 | 4.09 | 1.128 | −0.329 | −2.995 | −0.445 | |
| 78.0 | 1.30 | 0.954 | −0.298 | −2.946 | 1.476 | |
| 104.0 | 3.08 | 0.932 | −0.330 | −2.965 | 0.908 | |
| 323.8 | 5.80 | 0.934 | −0.310 | −2.871 | −0.402 | |
| 372.6 | 5.15 | 0.899 | −0.218 | −3.148 | 1.599 | |
| 386.2 | 2.83 | 0.998 | −0.294 | −3.040 | 1.366 | |
| 426.6 | 4.62 | 0.904 | −0.235 | −3.121 | 1.152 | |
| 435.4 | 0.00 | 0.936 | −0.205 | −3.124 | 1.601 | |
| 472.2 | 5.80 | 0.965 | −0.364 | −2.929 | 0.182 | |
| Avg. | — | 0.961 | −0.287 | −3.015 | — | |
| σ | — | 0.067 | 0.055 | 0.098 | — | |
| K41C (1918) | Crystal | −8.55 | 1.013 | −0.235 | −2.671 | 0.508 |
| 64.0 | 2.85 | 0.976 | −0.311 | −2.909 | 0.570 | |
| 90.0 | 7.60 | 1.019 | −0.291 | −3.063 | 1.603 | |
| 105.0 | 0.00 | 0.979 | −0.330 | −2.745 | −0.527 | |
| 345.2 | 0.76 | 0.914 | −0.311 | −2.891 | −0.414 | |
| 363.4 | 0.11 | 1.025 | −0.259 | −2.897 | 2.090 | |
| 387.8 | 7.06 | 1.148 | −0.357 | −2.847 | −0.493 | |
| 398.6 | 5.71 | 0.907 | −0.273 | −2.967 | −0.377 | |
| 408.2 | 7.59 | 0.970 | −0.207 | −2.894 | 1.385 | |
| 466.8 | 9.29 | 0.865 | −0.280 | −2.766 | −0.365 | |
| 485.4 | 3.84 | 0.935 | −0.316 | −2.895 | −0.001 | |
| Avg. | — | 0.974 | −0.293 | −2.887 | — | |
| σ | — | 0.079 | 0.042 | 0.091 | — | |
| S89C (1929) | 117.0 | 0.00 | 1.114 | −0.362 | −2.997 | −0.507 |
| 150.0 | 8.28 | 0.895 | −0.325 | −3.012 | −0.412 | |
| 200.0 | 5.97 | 1.038 | −0.244 | −3.125 | 1.803 | |
| 267.0 | 2.55 | 1.009 | −0.256 | −2.991 | 0.871 | |
| 285.0 | 1.73 | 1.042 | −0.235 | −3.021 | 1.818 | |
| Avg. | — | 1.019 | −0.284 | −3.029 | — | |
| σ | — | 0.080 | 0.056 | 0.055 | — | |
| L120C (1921) | 117.0 | 2.81 | 1.043 | −0.315 | −3.003 | −0.417 |
| 150.0 | 2.67 | 1.000 | −0.199 | −3.059 | 1.062 | |
| 200.0 | 0.00 | 0.866 | −0.319 | −2.980 | −0.455 | |
| 267.0 | 2.57 | 1.037 | −0.271 | −2.911 | 1.572 | |
| 285.0 | 3.24 | 1.001 | −0.241 | −3.050 | 1.702 | |
| Avg. | — | 0.990 | −0.269 | −3.001 | — | |
| σ | — | 0.072 | 0.051 | 0.060 | — | |
As mentioned above, we carried out large-scale calculations on the whole protein rather than restricting our analysis to the Cu-complex only. We thus now turn our attention to the analysis of features regarding the rest of the protein. Concerning the general dynamics, we have compared the total energies per atom in order to check the reliability of the results, more precisely to ascertain that the analyzed geometries are not too far from equilibrium. To this aim, we have set, for each protein, the lowest energy among all MD frames to zero and calculated the deviation ΔE from this value for the rest of the frames. We have observed that these differences are less than ∼8 meV at.−1, which are fully consistent with the values obtained in the MD simulations (see Fig. S2a of the ESI†). These small variations in the frame energies reveal that the input geometries provided by MD are rather close to equilibrium configurations, without remarkable variations. On the other hand, we have also analyzed the crystal structures for holo and K41C mutant. In the latter case, the term “crystal” refers to the holo structure with a CYS residue replacing the LYS41 residue. In both cases, the crystalline structures were found to be more energetically favorable (by ∼8 meV at.−1) than those extracted from the MD frames. This is not surprising, due to the absence of thermal fluctuations in the crystal structures.
In Table 1 we also report the energetic position of the SOMO orbital, which presents some fluctuations along the simulation time lapses. In this case, we find differences between the values of different mutants, especially between the holo protein (−3.0 ± 0.1 eV) and the K41C azurin (−2.89 ± 0.09 eV). However, it is not ensured that this difference lies beyond the statistical uncertainties, since the dispersion for each value is comparable to the difference between the two values. It is also worth noting that the fluctuations found for the position of SOMO level in each protein are large enough to be relevant when studying biological electron-transfer reactions. Indeed, in the case of DNA, it was pointed out that a transient degeneracy, or flickering electronic resonance among states, leads to coherent charge transfer, as a result of thermal fluctuations.52
Lastly, the total magnetic moments of the proteins ranges from ∼−0.4 μB to ∼2.0 μB. In the low magnetic moment solutions (∼−0.4 μB) the spin density arises from the Cu ion almost entirely. Conversely, the solutions with higher magnetic moments are due to the anti-parallel coupling of certain oxygen atoms, specifically 30 O atoms belonging to carboxyl groups of 15 acidic amino acids and 2 more O atoms belonging to an extra terminal residue. A variable number of these atoms are able to display up to ∼0.1 μB per atom, leading to a great variability of resulting total magnetic moment within the mentioned range.
In Fig. 3 we show the spatial distribution of HOMO (SOMO), HOMO−1 and LUMO. As we can see in the central panel, the HOMO orbital is always localized on the Cu center and surrounding atoms, as we have discussed in the PDOS analysis. This is a common feature for all mutants and it is preserved during the whole MD time interval. Thus, this result indicates a great stability of the Cu center, which remains unaltered under any circumstance upon insertion of mutations. On the other hand, the HOMO−1 level and several lower orbitals below the chemical potential are localized exclusively on O atoms belonging to carboxyl groups of acidic amino acids; these atoms are distributed all over the peripheral regions. The corresponding orbitals are very close in energy and minimal structural variations lead to a change in their order. Thus, the spatial distribution of the HOMO−1 level is different for different MD frames but is always located in one of the carboxyl groups (see left panel of Fig. 3). In Fig. S14 of the ESI,† we show up to fifteen molecular orbitals with their corresponding energies for the crystal structure of the holo protein. It is possible to observe that all orbitals comprised between HOMO and HOMO−14 (both localized on the Cu complex) are localized on O atoms. Note that this result can only be obtained by analyzing the entire protein, since these O atoms are located in the outer part of the protein. We now turn our attention to the molecular orbitals above the chemical potential (Fig. 3). As opposed to the occupied orbitals, they are more delocalized and involve different atomic species. Again, due to the short distance in energy between the large number of available levels, the order changes between different mutants and times (meaning that what appears as LUMO in one protein appears, for instance, as LUMO+1 in another one); we will not investigate this further as it goes beyond the scope of this work. Overall, our findings suggest that, in the vicinity of the chemical potential, the electronic structure of these proteins is rather complex, involving regions of the protein that are farther away from the Cu center. Intriguingly, this could have implications for the electronic transport through metal–protein–metal junctions. Orbitals localized on the outer parts of the protein and in resonance with levels localized on the Cu ion (which is claimed to play a major role in charge transfer through these systems) could potentially play a role in the conductance by affecting the coupling between the protein and the metal leads. This, however, needs further verification and proper transport calculations would be needed to clarify this issue. Our results are based on use of the PBE functional, which is known to be affected by self-interaction errors.53–55 The impact of this problem in our case remains to be seen. For that purpose, a systematic comparison with other functionals should be performed, which was not done in the present work for computational reasons. For instance, it would be important to perform such a comparison with long-range corrected hybrid functionals since they were claimed to be crucial for calculating the electron distribution in proteins containing both anionic and cationic sites.53 However, the use of these kinds of functionals is computationally more demanding and as such was not applied to this study. Having said that, it is worth mentioning that test calculations performed on peptide chains with charged –NH3+ and –COO− terminal groups (with PBE and CAM-B3LYP functionals, not reported here) did not show major changes in the spatial localization of the charge density. In fact, although charges on individual atoms showed differences of up to 0.05 between the two functionals, the overall spatial extension of the frontier orbitals was found to be qualitatively the same for both calculations. In future work, the effect of including dispersion corrections should be also analyzed in order to verify how they affect total energies and charge properties.
 | ||
| Fig. 3 Spatial distribution of HOMO−1, (left panel), HOMO (middle panel) and LUMO (right panel) orbitals for the same protein structures as in Fig. 2. An isosurface value of ±0.02 was adopted. Notice that the HOMO is always localized on the Cu-center, in agreement with what was observed in the Cu PDOS. HOMO−1 and lower levels are localized on O atoms belonging to carboxyl groups while LUMO level appears to be more delocalized across the protein. The corresponding all-atom representation is reported in Fig. S13 of ESI.† | ||
To further investigate the differences between the studied proteins, we compared their total DOS. In Fig. 4, we show it for the holo azurin, three of its single amino acid mutants and the apo protein. In each graph, the curves corresponding to all analyzed frames are plotted. Notice that, in spite of the thermal fluctuations, the same essential features are unequivocally present in each case. For instance, the first peak below the chemical potential corresponds to the d-orbitals of Cu, previously discussed for the PDOS analysis, as well as the peaks arising from the O atoms also appear (indicated by an arrow in the figure). On the other hand, the total DOS rapidly grows above the chemical potential. In the cases of holo and K41C, the total DOS in their crystalline form have been also included (green thicker lines). In both cases the electronic levels of crystalline structures are more confined than those calculated for different frames of MD simulations. We can hence conclude that the main features of the DOS profiles are rather similar across all mutants. Moreover, these profiles are rather similar to that of the dI/dV curves which were recently obtained experimentally by J. A. Fereiro et al.38 However, a close-up inspection reveals slight differences between the mutants, as expected from the observed variations of the redox potentials.23,25 See Fig. S15 of the ESI,† where some graphical pairwise comparisons have been carried out. Finally, the DOS profile of the apo protein is indeed rather different from all others: a gap of ∼0.5 eV appears, due to the absence of the Cu levels. As expected, the removal of the Cu-center has drastic implications in the electronic properties of the protein, which may provide a natural explanation for the reduction of the conductance observed in molecular junctions based on apo azurin, as compared to holo-azurin junctions.38
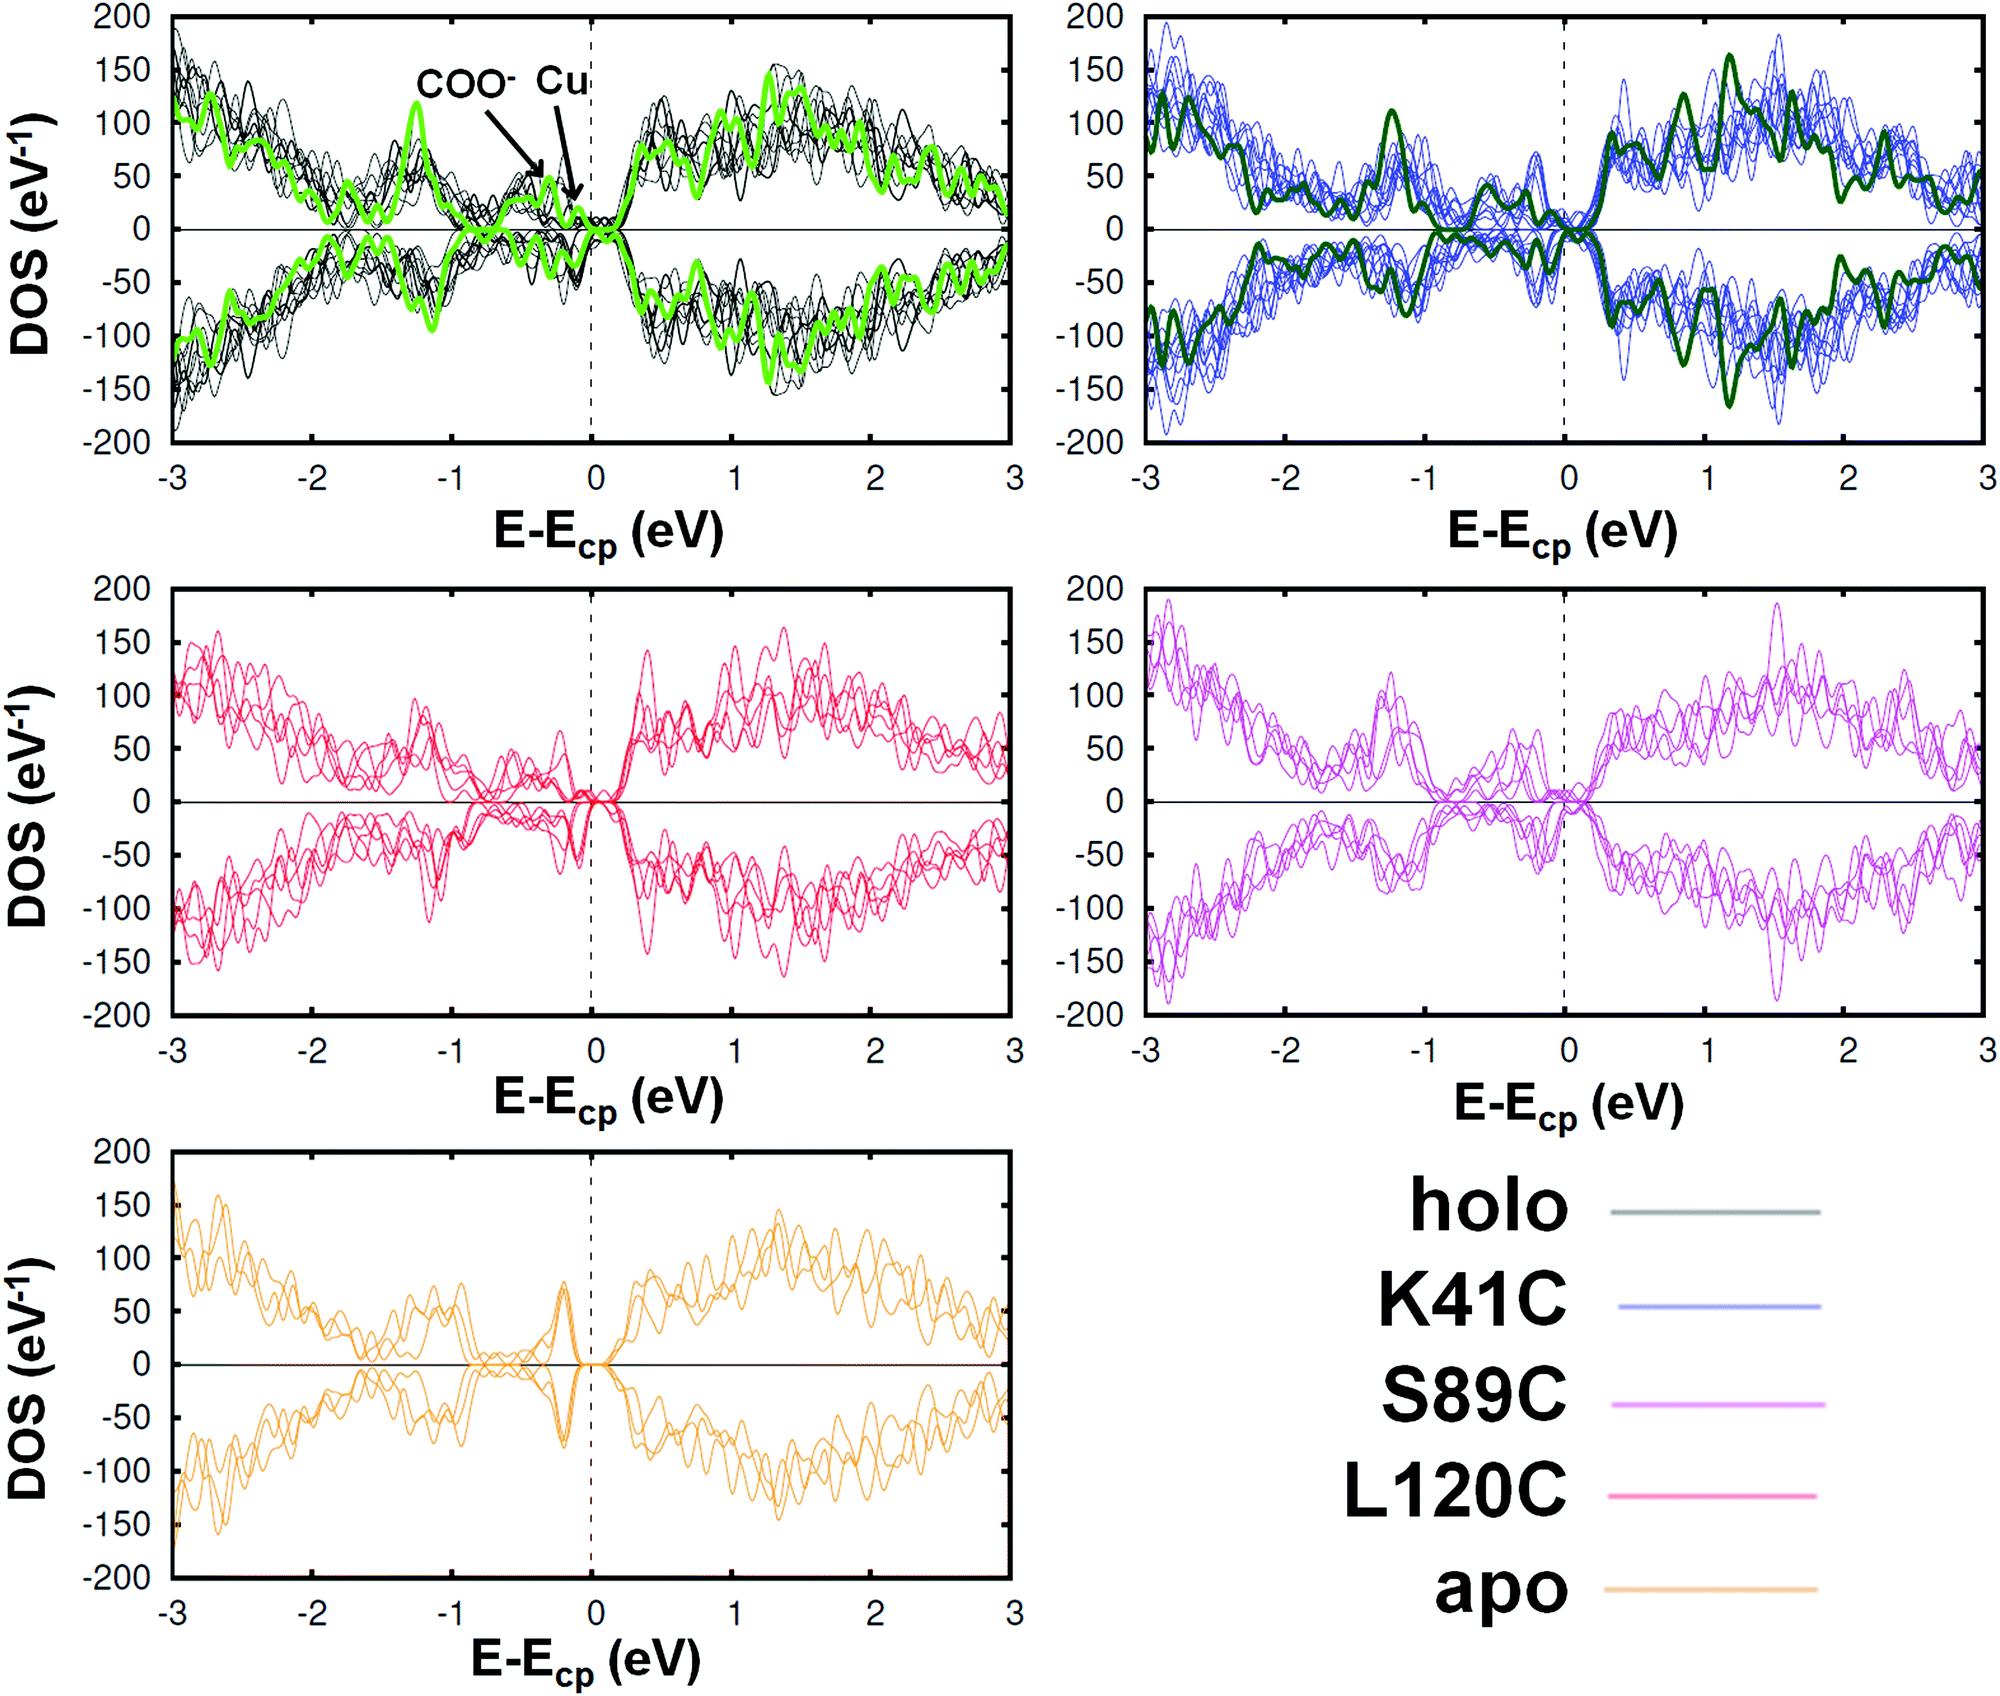 | ||
| Fig. 4 Spin resolved total density of the states of the azurin protein, three mutants (K41C, L120C and S89C) and the apo azurin. Each graph contains the curves corresponding to various analyzed frames; the green lines represent the total DOS of the proteins with the geometry of its crystalline state. Despite the thermal fluctuations, in all cases the same essential features can be observed, giving rise to similar profiles (except in the case of apo azurin, for which the DOS profile is clearly different around the chemical potential Ecp; see Fig. S15 of the ESI† for a more detailed comparison). However, some distinctive features can be detected in a detailed comparison, especially between the holo and the other proteins. | ||
Conclusions
In summary, we have carried out a comprehensive study of the electronic structure of a blue copper azurin protein – and selected mutants – at a fully ab initio level. We have demonstrated how it is currently possible to perform this analysis considering the complete atomic structure. In this way, we reveal intimate details of the Cu center, in agreement with previous results, as well as a complete electronic level structure. In addition, we have analyzed the contribution of the protein outer regions in the electronic properties. Contrary to common wisdom, our results reveal that the O atoms of the carboxyl group in acidic amino acids which are spatially distributed all over the proteins generate a series of almost continuous levels below the chemical potential. Finally, the approach presented in this work opens the door to further studies in which the description of the whole structure of the protein is necessary.Methods
Molecular dynamics
All the simulations were performed using the AMBER14 software suite56 with NVIDIA GPU acceleration.57–59 The ff14SB force field60 was used to describe all standard amino-acids present in the Azurin. The inter-atomic potentials of the copper atom and its corresponding 5 ligands were described using a quantum mechanically derived force field.61 This force-field includes both bonded and non-bonded terms between the Cu atom and its 5 ligands and has been widely used to model the blue-copper Azurin protein.24,42,62–64 In particular, recent experiments63 have shown how early stages of mechanical unfolding of this protein are well described by this force-field. The X-ray crystallographic structure of Azurin was obtained from the protein data bank65 with the PDB code 4AZU.4 Protons were added to the protein structure according to the calculated ionization states66 of its titratable groups at a pH of 4.5, which corresponds to the one used in the experiments of ref. 42. The resulting structure net charge was zero for the Holo, L120C and S89C structures, and −1 for the K41C and apo structures. We have added 1 Na+ ion to neutralize the net charge of the system in the last two cases (K41C mutant and apo structures). In all our simulations the system is fully embedded in a water medium. The water is described using explicit TIP3P model,67 while Joung/Cheatham parameters were used to describe the sodium counter-ions.68,69 We have used periodic boundary conditions with a rectangular box (∼72 Å × 66 Å × 70 Å) and Particle Mesh Ewald to account for long-range electrostatic interactions. van der Waals contacts were truncated at the real space cutoff of 10 Å for all the simulations also. SHAKE algorithm was used to constrain bonds containing hydrogen, thus allowing us to use an integration step of 2 fs. Coordinates were saved every 1000 steps. For all the simulations the protocol consists of three stages: (1) structures were energy minimized to avoid steric clashes using a combination of steepest descent and conjugate gradient methods; (2) then, given that all the simulations are performed in a liquid medium, we perform a 2 ns simulation in the NPT ensemble, i.e. keeping the pressure constant at 1 atm and the temperature constant at 300 K; (3) at last, given the stabilization of the pressure to 1 atm in the simulation box, and the higher computational cost associated to the NPT simulations with respect to the NVT simulations (number of atoms, volume and temperature are fixed), the production MD runs were performed in the NVT ensemble. We perform 500 ns of MD simulation for the Holo, Apo and K41C mutant azurin structures and 300 ns for the L120C and S89C mutant structures.Density functional theory
Density functional theory (DFT) calculations were run on geometries extracted from the MD simulations by using the OpenMX code (in vacuum, upon removal of the water molecules surrounding the proteins). This approach is based on highly optimized pseudoatomic orbitals (PAOs)70,71 to represent the one-particle Kohn–Sham wave functions. The core Coulomb potential is replaced in OpenMX by the tractable norm-conserving pseudopotential proposed by I. Morrison, D. M. Bylander, and L. Kleinman,72 which is a norm-conserving version of the Vanderbilt's ultrasoft pseudopotential.73 Additionally, we have used the Perdew–Burke–Ernzerhof (PBE) functional74 to describe the exchange and correlation interaction between electrons. We have used a single-ζ basis set for all species involved in the calculations except for the Cu metallic center and selected oxygen atoms, for which we adopted a double-ζ basis set. Following the OpenMX notation, we define the basis sets by combinations of lx sets, l being the orbital and x being the number of primitive orbitals used for the construction. Specifically, we used s1 for H, s1p1 for C, N, O and S, s2p2 from the O atoms belonging to the carboxyl groups and s2p2d2 for Cu. The chosen basis set is sufficiently good to describe this protein system. A comparison of selected results with those obtained by using a fully double-ζ basis set can be found in Fig. S8 of ESI.† Changes in the peak alignment up to 0.1 eV can be observed, which are negligible compared to the energy shifts the same peaks could undergo upon a change, for example, in the binding geometry of the protein. The use of higher-quality basis sets was not tested for computational reasons. However, it does not always imply a better description of the system because of problems related with overcompleteness. Furthermore, in electron-transport calculations, it was found to be responsible for unphysical charge oscillations75 or ghost transmission.76 Note that the cutoff radii of the PAOs have been carefully selected in order to obtain reliable and reproducible results; in particular, we chose a cutoff radius of 8 Bohr for Cu, 7 Bohr for S and 5 Bohr for C, N and H. In the case of O, we used a cutoff radius of 5 Bohr for all atoms except those belonging to the carboxyl groups of acidic amino acids, for which a larger radius of 6 Bohr was employed. A proper selection of PAOs radii have proved to be of extreme importance, especially when describing electronic transport phenomena.75 In the present study, for instance, we found that the use of smaller cutoff radii for the Cu ion leaded to false minima in the self-consistent procedure (see below for further details), dramatically affecting the final properties.In OpenMX, convergence can be achieved by four different mixing schemes. In this work, the electronic self-consistency was achieved thanks to a Pulay mixing scheme based on the residual minimization method in the direct inversion iterative subspace (RMM-DIIS)77 with a Kerker metric,78 using an energy cutoff of 10−8 Ha as convergence criterion. It is worth noting that a careful selection of convergence parameter was needed to ensure a proper convergence. Moreover, we found that it is important to allow a large number of iterations (∼500) based on the simple RMM-DIIS algorithm before turning on the Pulay scheme. Otherwise, numerical instabilities can arise which could, in turn, affect the final result. The possibility of reproducibility problems might sound suspicious at first, since a univocal relationship should in principle exist between initial input and final output. However, the presence of extraordinarily numerous low-lying states in these kinds of systems, combined with the accumulation of tiny numerical errors which can arise in algebraic operations performed on exceptionally very large matrices, can lead to scf convergence not always following exactly the same path in the Pulay mixing. It is thus very important to take care of all technical details very carefully in order to avoid such a problem.
To help the system find its optimal spin configuration, we assigned different initial up and down occupations for the Cu ion. The electronic temperature was set to 1200 K to facilitate convergence. We found that using lower electronic temperatures (300 K and 600 K) from the very beginning led to instabilities and to different final solutions depending on the initial Cu occupation. However, we also observed that running the calculations at low temperature by starting from a solution previously obtained at 1200 K gave fully consistent results with the latter.
With the setup described above, we have thus performed DFT calculations for the native azurin protein, three of its single amino acid mutants and the apo azurin. As mentioned above, the geometries were extracted from the trajectories of the molecular dynamics simulations by carefully selecting those relative to several frames along the time line. In this way, we were able to unveil the electronic properties of the proteins based on a statistical approach which prevents the appearance of spurious effects deriving from choosing an isolated out-of-equilibrium configuration.
Conflicts of interest
The authors declare no competing financial interest.Acknowledgements
We thank the financial support from the Spanish MINECO (MAT2014-58982-JIN, FIS2017-84057-P, MDM-2014-0377 and MAT2017-83273-R). J. G. V. acknowledges funding from a Marie Sklodowska-Curie Fellowship within the Horizons 2020 framework (grant number DLV-795286). The authors thankfully acknowledge the computer resources, technical expertise, and assistance provided by the Red Española de Supercomputación (RES) at the Minotauro and Marenostrum supercomputers (BSC, Barcelona). We acknowledge PRACE for awarding us access to Curie as part of PRACE Preparatory Access Type A during May–July 2017. We thank Spiros S. Skourtis for fruitful discussions.References
- J. E. Huheey, E. A. Keiter and R. L. Keiter, Inorganic Chemistry: Principles of Structure and Reactivity, HarperCollins College Publishers, 4th edn, 1993 Search PubMed.
- R. H. Holm, P. Kennepohl and E. I. Solomon, Chem. Rev., 1996, 96, 2239–2314 CrossRef CAS PubMed.
- E. N. Baker, J. Mol. Biol., 1988, 203, 1071–1095 CrossRef CAS PubMed.
- H. Nar, A. Messerschmidt, R. Huber, M. van de Kamp and G. W. Canters, J. Mol. Biol., 1991, 221, 765–772 CrossRef CAS PubMed.
- C. M. Groeneveld, G. W. Canters, R. Aasa and B. Reinhammar, J. Inorg. Biochem., 1987, 31, 143–154 CrossRef CAS PubMed.
- L. M. Murphy, R. W. Strange, B. G. Karlsson, L. G. Lundberg, T. Pascher, B. Reinhammar and S. S. Hasnain, Biochemistry, 1993, 32, 1965–1975 CrossRef CAS PubMed.
- M. Fittipaldi, G. C. M. Warmerdam, E. C. de Waal, G. W. Canters, D. Cavazzini, G. L. Rossi, M. Huber and E. J. J. Groenen, ChemPhysChem, 2006, 7, 1286–1293 CrossRef CAS PubMed.
- A. S. Lipton, R. W. Heck, W. A. de Jong, A. R. Gao, X. Wu, A. Roehrich, G. S. Harbison and P. D. Ellis, J. Am. Chem. Soc., 2009, 131, 13992–13999 CrossRef CAS PubMed.
- K. W. Penfield, A. A. Gewirth and E. I. Solomon, J. Am. Chem. Soc., 1985, 107, 4519–4529 CrossRef CAS.
- A. A. Gewirth and E. I. Solomon, J. Am. Chem. Soc., 1988, 110, 3811–3819 CrossRef CAS.
- J. A. Guckert, M. D. Lowery and E. I. Solomon, J. Am. Chem. Soc., 1995, 117, 2817–2844 CrossRef CAS.
- L. B. LaCroix, S. E. Shadle, Y. Wang, B. A. Averill, B. Hedman, K. O. Hodgson and E. I. Solomon, J. Am. Chem. Soc., 1996, 118, 7755–7768 CrossRef CAS.
- E. I. Solomon, K. W. Penfield, A. A. Gewirth, M. D. Lowery, S. E. Shadle, J. A. Guckert and L. B. LaCroix, Inorg. Chim. Acta, 1996, 243, 67–78 CrossRef CAS.
- E. I. Solomon, R. K. Szilagyi, S. DeBeer George and L. Basumallick, Chem. Rev., 2004, 104, 419–458 CrossRef CAS PubMed.
- K. Pierloot, J. O. A. De Kerpel, U. Ryde, M. H. M. Olsson and B. O. Roos, J. Am. Chem. Soc., 1998, 120, 13156–13166 CrossRef CAS.
- M. van Gastel, J. W. A. Coremans, H. Sommerdijk, M. C. van Hemert and E. J. J. Groenen, J. Am. Chem. Soc., 2002, 124, 2035–2041 CrossRef CAS PubMed.
- S. Corni, F. D. Rienzo, R. D. Felice and E. Molinari, Int. J. Quantum Chem., 2005, 102, 328–342 CrossRef CAS.
- R. Sarangi, S. I. Gorelsky, L. Basumallick, H. J. Hwang, R. C. Pratt, T. D. P. Stack, Y. Lu, K. O. Hodgson, B. Hedman and E. I. Solomon, J. Am. Chem. Soc., 2008, 130, 3866–3877 CrossRef CAS PubMed.
- R. G. Hadt, N. Sun, N. M. Marshall, K. O. Hodgson, B. Hedman, Y. Lu and E. I. Solomon, J. Am. Chem. Soc., 2012, 134, 16701–16716 CrossRef CAS PubMed.
- K. M. Lancaster, M.-E. Zaballa, S. Sproules, M. Sundararajan, S. DeBeer, J. H. Richards, A. J. Vila, F. Neese and H. B. Gray, J. Am. Chem. Soc., 2012, 134, 8241–8253 CrossRef CAS PubMed.
- C. Bernini, T. Andruniów, M. Olivucci, R. Pogni, R. Basosi and A. Sinicropi, J. Am. Chem. Soc., 2013, 135, 4822–4833 CrossRef CAS PubMed.
- D. K. Garner, M. D. Vaughan, H. J. Hwang, M. G. Savelieff, S. M. Berry, J. F. Honek and Y. Lu, J. Am. Chem. Soc., 2006, 128, 15608–15617 CrossRef CAS PubMed.
- N. M. Marshall, D. K. Garner, T. D. Wilson, Y.-G. Gao, H. Robinson, M. J. Nilges and Y. Lu, Nature, 2009, 462, 113 CrossRef CAS PubMed.
- L. Zanetti-Polzi, C. A. Bortolotti, I. Daidone, M. Aschi, A. Amadei and S. Corni, Org. Biomol. Chem., 2015, 13, 11003–11013 RSC.
- N. J. Fowler, C. F. Blanford, J. Warwicker and S. P. de Visser, Chem. – Eur. J., 2017, 23, 15436–15445 CrossRef CAS PubMed.
- A. Sinicropi, Inorg. Chim. Acta, 2018, 470, 360–364 CrossRef CAS.
- Y. Mei, D. W. Zhang and J. Zhang, J. Phys. Chem. A, 2005, 109, 2–5 CrossRef CAS PubMed.
- J. Antony and S. Grimme, J. Comput. Chem., 2012, 33, 1730–1739 CrossRef CAS PubMed.
- F. Sato, T. Yoshihiro, M. Era and H. Kashiwagi, Chem. Phys. Lett., 2001, 341, 645–651 CrossRef CAS.
- I. Ron, L. Sepunaru, S. Itzhakov, T. Belenkova, N. Friedman, I. Pecht, M. Sheves and D. Cahen, J. Am. Chem. Soc., 2010, 132, 4131–4140 CrossRef CAS PubMed.
- J. M. Artés, I. Díez-Pérez, F. Sanz and P. Gorostiza, ACS Nano, 2011, 5, 2060–2066 CrossRef PubMed.
- J. M. Artés, I. Díez-Pérez and P. Gorostiza, Nano Lett., 2012, 12, 2679–2684 CrossRef PubMed.
- N. Amdursky, D. Marchak, L. Sepunaru, I. Pecht, M. Sheves and D. Cahen, Adv. Mater., 2014, 26, 7142–7161 CrossRef CAS PubMed.
- J. M. Artés, M. López-Martínez, I. Díez-Pérez, F. Sanz and P. Gorostiza, Small, 2014, 10, 2537–2541 CrossRef PubMed.
- C. Baldacchini, V. Kumar, A. R. Bizzarri and S. Cannistraro, Appl. Phys. Lett., 2015, 106, 183701 CrossRef.
- X. Yu, R. Lovrincic, L. Sepunaru, W. Li, A. Vilan, I. Pecht, M. Sheves and D. Cahen, ACS Nano, 2015, 9, 9955–9963 CrossRef CAS PubMed.
- S. Kradolfer, E. Lipiec, C. Baldacchini, A. R. Bizzarri, S. Cannistraro and R. Zenobi, ACS Nano, 2017, 11, 12824–12831 CrossRef CAS PubMed.
- J. A. Fereiro, X. Yu, I. Pecht, M. Sheves, J. C. Cuevas and D. Cahen, Proc. Natl. Acad. Sci. U. S. A., 2018, 115, E4577 CrossRef CAS PubMed.
- C. Baldacchini, A. R. Bizzarri and S. Cannistraro, Eur. Polym. J., 2016, 83, 407–427 CrossRef CAS.
- A. Alessandrini and P. Facci, Eur. Polym. J., 2016, 83, 450–466 CrossRef CAS.
- M.-L. Tsai, R. G. Hadt, N. M. Marshall, T. D. Wilson, Y. Lu and E. I. Solomon, Proc. Natl. Acad. Sci. U. S. A., 2013, 110, 14658–14663 CrossRef CAS PubMed.
- M. P. Ruiz, A. C. Aragonès, N. Camarero, J. G. Vilhena, M. Ortega, L. A. Zotti, R. Pérez, J. C. Cuevas, P. Gorostiza and I. Díez-Pérez, J. Am. Chem. Soc., 2017, 139, 15337–15346 CrossRef CAS PubMed.
- A. S. Venkat, S. Corni and R. D. Felice, Small, 2007, 3, 1431–1437 CrossRef CAS PubMed.
- J. S. Kretchmer, N. Boekelheide, J. J. Warren, J. R. Winkler, H. B. Gray and T. F. Miller III, Proc. Natl. Acad. Sci. U. S. A., 2018, 115, 6129–6134 CrossRef CAS PubMed.
- J. C. Cuevas and E. Scheer, Molecular electronics: An introduction to theory and experiment, World Scientific, 2nd edn, 2017 Search PubMed.
- L. A. Zotti and J. C. Cuevas, ACS Omega, 2018, 3, 3778–3785 CrossRef CAS.
- H. Liu, M. Elstner, E. Kaxiras, T. Frauenheim, J. Hermans and W. Yang, Proteins: Struct., Funct., Bioinf., 2001, 44, 484–489 CrossRef CAS PubMed.
- K. P. Kepp, J. Inorg. Biochem., 2012, 107, 15–24 CrossRef CAS PubMed.
- E. I. Solomon, U. M. Sundaram and T. E. Machonkin, Chem. Rev., 1996, 96, 2563–2606 CrossRef CAS PubMed.
- T. Tsukihara, H. Aoyama, E. Yamashita, T. Tomizaki, H. Yamaguchi, K. Shinzawa-Itoh, R. Nakashima, R. Yaono and S. Yoshikawa, Science, 1995, 269, 1069–1074 CrossRef CAS PubMed.
- T. Rasmussen, B. C. Berks, J. Sanders-Loehr, D. M. Dooley, W. G. Zumft and A. J. Thomson, Biochemistry, 2000, 39, 12753–12756 CrossRef CAS PubMed.
- Y. Zhang, C. Liu, A. Balaeff, S. S. Skourtis and D. N. Beratan, Proc. Natl. Acad. Sci. U. S. A., 2014, 111, 10049–10054 CrossRef CAS PubMed.
- S. Jakobsen, K. Kristensen and F. Jensen, J. Chem. Theory Comput., 2013, 9, 3978–3985 CrossRef CAS PubMed.
- Q. Zhao and H. J. Kulik, J. Chem. Theory Comput., 2018, 14, 670–683 CrossRef CAS PubMed.
- J. L. Bao, L. Gagliardi and D. G. Truhlar, J. Phys. Chem. Lett., 2018, 9, 2353–2358 CrossRef CAS PubMed.
- AMBER14, 2014, http://ambermd.org/.
- R. Salomon-Ferrer, A. W. Götz, D. Poole, S. Le Grand and R. C. Walker, J. Chem. Theory Comput., 2013, 9, 3878–3888 CrossRef CAS PubMed.
- A. W. Götz, M. J. Williamson, D. Xu, D. Poole, S. Le Grand and R. C. Walker, J. Chem. Theory Comput., 2012, 8, 1542–1555 CrossRef PubMed.
- S. L. Grand, A. W. Götz and R. C. Walker, Comput. Phys. Commun., 2013, 184, 374–380 CrossRef.
- J. A. Maier, C. Martinez, K. Kasavajhala, L. Wickstrom, K. E. Hauser and C. Simmerling, J. Chem. Theory Comput., 2015, 11, 3696–3713 CrossRef CAS PubMed.
- M. van den Bosch, M. Swart, J. G. Snijders, H. J. C. Berendsen, A. E. Mark, C. Oostenbrink, W. F. van Gunsteren and G. W. Canters, ChemBioChem, 2005, 6, 738–746 CrossRef CAS PubMed.
- L. Paltrinieri, M. Borsari, A. Ranieri, G. Battistuzzi, S. Corni and C. A. Bortolotti, J. Phys. Chem. Lett., 2013, 4, 710–715 CrossRef CAS PubMed.
- A. E. M. Beedle, A. Lezamiz, G. Stirnemann and S. Garcia-Manyes, Nat. Commun., 2015, 6, 7894 CrossRef CAS PubMed.
- L. Zanetti-Polzi, S. Corni, I. Daidone and A. Amadei, Phys. Chem. Chem. Phys., 2016, 18, 18450–18459 RSC.
- H. M. Berman, J. Westbrook, Z. Feng, G. Gilliland, T. N. Bhat, H. Weissig, I. N. Shindyalov and P. E. Bourne, Nucleic Acids Res., 2000, 28, 235–242 CrossRef CAS PubMed.
- J. C. Gordon, J. B. Myers, T. Folta, V. Shoja, L. S. Heath and A. Onufriev, Nucleic Acids Res., 2005, 33, W368–W371 CrossRef CAS PubMed.
- W. L. Jorgensen, J. Chandrasekhar, J. D. Madura, R. W. Impey and M. L. Klein, J. Chem. Phys., 1983, 79, 926–935 CrossRef CAS.
- I. S. Joung and T. E. Cheatham, J. Phys. Chem. B, 2009, 113, 13279–13290 CrossRef CAS PubMed.
- P. Li, B. P. Roberts, D. K. Chakravorty and K. M. Merz, J. Chem. Theory Comput., 2013, 9, 2733–2748 CrossRef CAS PubMed.
- T. Ozaki, Phys. Rev. B: Condens. Matter Mater. Phys., 2003, 67, 155108 CrossRef.
- T. Ozaki and H. Kino, Phys. Rev. B: Condens. Matter Mater. Phys., 2004, 69, 195113 CrossRef.
- I. Morrison, D. M. Bylander and L. Kleinman, Phys. Rev. B: Condens. Matter Mater. Phys., 1993, 47, 6728 CrossRef CAS.
- D. Vanderbilt, Phys. Rev. B: Condens. Matter Mater. Phys., 1990, 41, 7892 CrossRef.
- J. P. Perdew, K. Burke and M. Ernzerhof, Phys. Rev. Lett., 1996, 77, 3865 CrossRef CAS PubMed.
- L. A. Zotti and R. Pérez, Phys. Rev. B: Condens. Matter Mater. Phys., 2017, 95, 125438 CrossRef.
- C. Herrmann, G. C. Solomon, J. E. Subotnik, V. Mujica and M. A. Ratner, J. Chem. Phys., 2010, 132, 024103 CrossRef PubMed.
- G. Kresse and J. Furthmüller, Phys. Rev. B: Condens. Matter Mater. Phys., 1996, 54, 11169–11186 CrossRef CAS.
- G. P. Kerker, Phys. Rev. B: Condens. Matter Mater. Phys., 1981, 23, 3082–3084 CrossRef CAS.
Footnote |
| † Electronic supplementary information (ESI) available: Analysis of MD simulations (S1); MD frame selection criteria (S2); protein protonation state (S3); additional information on DFT results (S4). See DOI: 10.1039/c8cp06862c |
| This journal is © the Owner Societies 2018 |