 Open Access Article
Predicting the afterglow duration in persistent phosphors: a validated approach to derive trap depth distributions
Olivier Q.
De Clercq
 ab,
Jiaren
Du
 ab,
Philippe F.
Smet
 ab,
Jonas J.
Joos
 ab and
Dirk
Poelman
 *ab
*ab
aLumiLab, Department of Solid State Sciences, Ghent University, Ghent, Belgium. E-mail: dirk.poelman@ugent.be
bCenter for Nano- and Biophotonics (NB-Photonics), Ghent University, Ghent, Belgium
First published on 3rd December 2018
Abstract
Persistent phosphors are increasingly investigated due to their potential applications in various fields, such as safety signage, dosimetry and in vivo imaging. These materials act as optical batteries that store and gradually release energy supplied during optical charging. As the energy is stored, or ‘trapped’, at specific defect sites in the host lattice, a clear understanding of the defects and trapping mechanisms in these materials is important for systematic improvement of their properties. Here, the thermoluminescence and afterglow properties of the near-infrared (NIR) emitting persistent phosphor LiGa5O8:Cr3+ (LGO:Cr) are studied. This phosphor is used as a model system for illustrating a more general approach to reliably derive trap depth distributions in persistent luminescent and storage materials. The combination of the Tstop–Tmax method with initial rise analysis is used to experimentally determine the presence of a broad distribution of trapping states. Computerized glow curve fitting is subsequently used to extract the relevant trapping parameters of the system in a rigorous, consistent manner, by fitting all the experimentally recorded data simultaneously. The resulting, single set of model parameters is able to describe all measured thermoluminescence and afterglow data and hence can be used to predict afterglow and storage properties of the phosphor under various conditions. The methods to analyze and describe the trap structure of the persistent phosphor LGO:Cr are straightforwardly applicable for other persistent and storage phosphors and result in a reliable determination of the relevant trapping parameters of a given material.
Introduction
Persistent phosphors are light-emitting materials that keep emitting light minutes to hours after excitation has ended.2,3 Aside from specific activator dopants in the crystalline host, which provide luminescence upon excitation, persistent phosphors also contain additional defects which can ‘trap’ charge carriers that are released from an excited state of the activator ion. These trapping defects can be deliberately added to the phosphor, or be intrinsically present. After being trapped at a crystal defect, the charge carriers can be released over the course of seconds to days, depending on the nature of the defects that are involved and the ambient temperature.Divalent europium (Eu2+) is a popular activator ion for luminescent materials in general and persistent luminescent materials in particular.4 Its emission color can be tuned from the near-UV, across the visible spectral range up to red emission. In Eu-based systems, persistent luminescence is often induced or intensified by co-doping with a trivalent lanthanide ion, such as Nd3+ or Dy3+. A well-known example is SrAl2O4:Eu,Dy,5 which shows a characteristic green “glow-in-the-dark” emission that is used in various applications, ranging from toys and watch dials, to safety signage and road markings.4,6
Despite the high tunability of the Eu2+ ion, there is only a limited choice of host compounds that result in a deep red or near infrared (NIR) emission for Eu2+.7–9 This is unfortunate as red and near-infrared (NIR) emitting persistent phosphors have gained in interest and importance in recent years, due to their promise for bio-imaging applications.10–12 The use of afterglow in in vivo imaging avoids a number of negative effects, such as damage to and autofluorescence from biological tissue, that are induced by the use of a continuous excitation source in traditional fluorescence imaging.13,14
The inability to use Eu2+ for this long-wavelength application has encouraged research and development into NIR persistent luminescent materials that are based on alternative activator ions,15 leading to the recent revival of Cr3+ based luminescent materials, such as ZnGa2O4:Cr3+![[thin space (1/6-em)]](https://www.rsc.org/images/entities/char_2009.gif) 16–20 or LiGa5O8:Cr3+
16–20 or LiGa5O8:Cr3+![[thin space (1/6-em)]](https://www.rsc.org/images/entities/char_2009.gif) 21–23 in scientific literature.
21–23 in scientific literature.
Currently, the limited storage capacity of many persistent phosphors remains a significant drawback for their applicability in various fields.24 Understanding the trap structure of persistent phosphors and modifying it deliberately can lead to a large increase of the amount of energy that can be stored and subsequently be accessed ‘on demand’ by e.g. photostimulation,25 and hence, of the performance of these materials. The most widely used method for modifying the trap structure is codoping a phosphor with suitable elements that increase the amount of existing intrinsic defects or directly introduce additional trapping levels. Lanthanides are especially popular for this purpose, as their impurity level locations are fairly predictable, allowing to straightforwardly engineer materials with suitable trap depths.26–29 Alternatively, exploring variations in host composition can lead to the appropriate trap depth variation as well.30–34
Usually, and especially with e.g. transition metals or main group ns2 ions, these modifications are still done via a rather inefficient trial-and-error approach, as the studies for these elements provide empirical rules with more limited applicability, due to substantial uncertainties caused by their much stronger crystal field interactions and larger number of possible valence states, although recently considerable progress was made.35–37
Therefore, by performing more in-depth studies rather than routine photoluminescence and afterglow experiments, one can obtain insight in the trap depth distribution of these persistent phosphors, which can be linked to the underlying defects and the relevant (de)trapping mechanisms. Then, more targeted optimization of the desired properties is possible. The resulting experimental values and quantities can help to support more fundamental theoretical studies as well.18
The technique that is commonly used to extract information about traps in persistent phosphors is thermoluminescence (TL).2 Here, after a charging step – typically with UV-vis light or ionizing radiation – the light output from a persistent phosphor is recorded while heating the sample with a (linear) heating rate. The resulting so-called glow curve can then be analyzed to see if there are various kinds of traps present in the phosphor and to extract trap depth energies for these different traps. One has to keep in mind that TL only provides indirect information about the traps and how they relate to the activator ions. Furthermore, although the theory behind TL is firmly established,38 the quantities that describe the TL properties of a given material, such as the trap depth energy and the escape frequency, are highly correlated, and one can thus not gain a complete understanding of the trap (depth) structure from only a single experiment.2 Especially when the TL glow curve is not characterized by a single, relatively narrow peak, one possibly deals with multiple trap depths, with a trap depth distribution or with higher-order kinetics of the detrapping process. This immediately leads to a large increase in the number of parameters for describing a single measured TL glow curve, which reduces the trustworthiness of derived parameter values, both via experimental techniques and computerized curve fitting. Great care and a combination of multiple techniques and experiments needs to be taken in order to avoid obtaining physically non-acceptable values.29,39
In this work, we investigate the step-wise-annealed thermoluminescence and afterglow properties of the NIR-emitting persistent phosphor LiGa5O8:Cr3+ (LGO:Cr).21–23 We show the presence of a broad distribution of trapping states, in contrast to the often assumed presence of discrete trapping states, and model the experimental data by a triple Gaussian distribution. All thermoluminescence and afterglow data can be simultaneously described by this model, using a single set of fitting parameters. We further use the model to predict afterglow properties at elevated temperatures, as relevant for instance in the case of in vivo imaging, and confirm the stability of the deep-lying traps for storage or for read-out by means of optical stimulation.23,40,41
Materials & methods
Phosphor powder samples of LiGa5O8:Cr were made according to a solid state synthesis procedure, described in previous work.21,22 The Cr concentration was 1% of the Ga content. The samples had excellent phase-purity.TL measurements were performed with the home-built setup described in Botterman et al.42 The detection system was modified by using a Thorlabs FDS1010 silicon photodiode connected to a Hamamatsu C9329 photosensor amplifier. Samples were excited for 10 min prior to each TL measurement, by use of the 254 nm emission line of a 3 W germicidal Hg-lamp (AquaEl). The employed heating rate was 0.25 K s−1 for each measurement.
In previous work, thermal quenching (TQ) effects have been shown to have limited effect on the TL behavior of this type of Cr-doped persistent phosphors.22 There was a measured drop of the order of only 5% from the total initial luminescence at 200 °C. Therefore, no corrections for TQ have been applied in this work.
Fig. 1 shows the measurement procedure that was used to obtain the step-wise annealed TL data as a function of trap filling. The measurements were performed according to the McKeever Tstop–Tmax method,1 in which the charging step occurred at either −10 °C or −60 °C, followed by a thermal cleaning step up to an elevated temperature Tstop (remaining there for 5 s), rapid cooldown (initial rate of 0.5 K s−1) and subsequent TL measurement.
 | ||
| Fig. 1 Experimental procedure for the TL measurements according to the McKeever Tstop–Tmax method:1 charging occurs at −10 °C or −60 °C, after which the sample is preheated to a varying, elevated temperature Tstop. After this pre-heating step, the sample is cooled down again, followed by TL readout. | ||
Afterglow decay profiles were measured with a Centronic OSD100-5T silicon photodiode, calibrated in absolute radiometric units and connected to a Hamamatsu C9329 photosensor amplifier. Prior to afterglow measurements, the samples were excited for 5 min by 1000 lx light of an unfiltered Xenon arc lamp. This is the standard measurement procedure from industry to assess the performance of a given persistent phosphor.2
The temperature in the room during the afterglow recording was monitored and there was little variation in temperature values over the duration of the measurement (24.6 ± 1 °C). No real influence of this variation was found during simulations, so a constant temperature of 24.6 °C was used in the simulations.
Results & discussion
T stop–Tmax method and initial rise analysis
Measured TL glow curves for various, increasing values of Tstop, starting at −50 °C and up to 130 °C, are shown in Fig. 2(a). Two main peaks, around 0 °C and 70 °C can be distinguished. There remains a non-zero TL signal above 220 °C as well. The high, continuous signal over the temperature range between −60 and 220 °C, combined with the gradual decrease in TL intensity and shift in temperature with increasing Tstop, shows that it is very unlikely that the thermoluminescence is originating from well-defined, discrete trapping levels in the LGO phosphor, as is generally assumed.2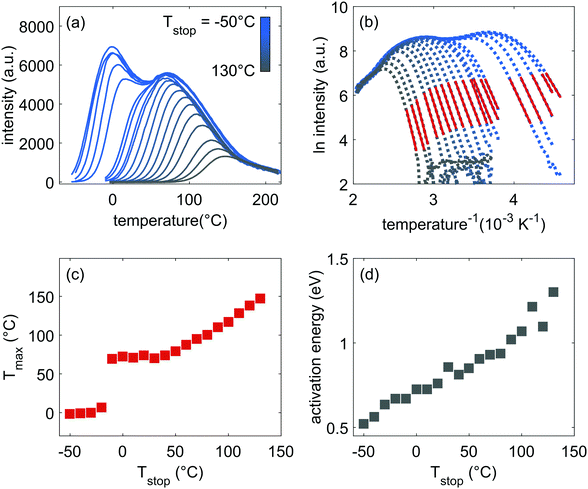 | ||
| Fig. 2 (a) Measured thermoluminescence glow peaks for increasing values of Tstop between −50 °C and 130 °C in steps of 10 °C. (b) Initial rise analysis of the data shown in Fig. 2(a) with the red part indicating the fitted part. (c) Tmax plotted vs. Tstop. (d) Obtained values for the initial rise energy, calculated from the data in Fig. 2(b). | ||
Plotting the maximum of each glow peak (Tmax) against Tstop, gives rise to Fig. 2(c). According to McKeever,1,43 in the case of discrete trapping states in the host, a staircase-like Tstop–Tmax plot should occur, with each plateau in the plot corresponding to a single trapping state. In contrast, a continuous set of close-lying states results in a linear relation between Tstop and Tmax. In Fig. 2(c), both effects are observed: there is a discrete jump in the Tstop–Tmax plot at −10 °C, when the first peak in the glow curve is annealed. From 40 °C onwards, the plateau around 70 °C Tmax evolves into a stronger linear increase in Tmax, pinpointing the presence of close-lying energy levels.
If the trap levels arise from localized defects, variations in the local symmetry or coordination of these defects – e.g. due to the presence of activator ions or other defects in the first few coordination shells – can cause a distribution of a trap energy level around a mean value. The two peaks in Fig. 2(a) indicate that in the case of LGO:Cr, at least two types of trap levels could be expected, possibly with a distribution in each of their energies.
A first estimate of the range of activation energies corresponding to the trap depth distribution in LGO:Cr can be provided by performing an initial rise analysis (IRA) on the TL data in Fig. 2(a).44 IRA is a popular technique to extract the activation energy from an experimentally recorded glow curve, because the errors on the obtained values are usually small and the analysis does not depend on the (de)trapping kinetics or the value of the ‘attempt-to-escape’ frequency factor.38,45
IRA assumes that on the low-temperature side, the TL intensity can be approximated by:
 | (1) |
By plotting the TL data in an Arrhenius plot, we can then extract the activation energy EA from the slope of the linear part of the curves. This is done in Fig. 2(b), which shows that the fits of eqn (1) (in red) describe the data well. The resulting activation energies are plotted against Tstop in Fig. 2(d), and are listed in Table 2. The obtained energies range from ∼0.55 eV to ∼1.3 eV. It is worth noting that IRA in the case of trap depth distributions always gives the activation energy of the shallowest still-filled traps in the distribution under study.44,46 In contrast with the sudden jump in Fig. 2(c), the activation energies in Fig. 2(d) increase more gradually with Tstop. This indicates strong overlap between the different components of the total trap depth distribution.
A theoretical model for the trap depth distribution
The experimental data in Fig. 2 indicate the presence of a very broad range of traps that are distributed around two mean energy values, corresponding to peak temperatures of 0 °C and 70 °C. An additional experiment to check the dose-dependence of the TL glow curves (charging for 1 to 10 min), did not show a prominent shift in the location of the maxima (not shown). Thus, we can assume the detrapping follows first order kinetics, meaning that retrapping of charge carriers after escape from a particular trap level is negligible.38We can describe the TL data and extract the relevant parameters by utilizing the following model. The expression for TL intensity in the presence of a continuous distribution of trapping states and first order kinetics is used:38,44,47
 | (2) |
• s is the frequency factor. We assume that s is equal for all individual trap sub-distributions (see below).
• β is the employed linear heating rate of 0.25 K s−1.
• N(E) is the (continuous) density of trapping states as a function of energy. We assume N(E) to be a broad distribution, which consists of three Gaussian functions with mean energies EG,i and widths of σG,i (i = 1, 2, 3). Fig. 3 shows such a trap depth distribution.
 | (3) |
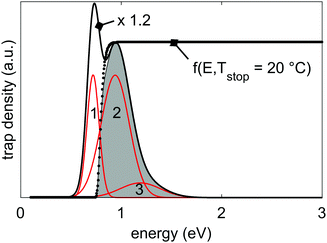 | ||
| Fig. 3 Representation of the 3-Gaussian trap depth distribution that is responsible for the thermoluminescence and persistent luminescence in LGO:Cr. The individual Gaussian functions are shown in red, and the resulting total trap depth distribution in black. The total distribution is scaled by a factor 1.2 for visual clarity. The parameters that were used to calculate the distribution are given in Table 3. Also shown is the filling factor f0(E,Tstop) (eqn (5), with Tstop = 20 °C; dotted line), and the filled portion of the trap depth distribution at 20 °C, shaded in grey. | ||
Gaussian distributions are a reasonable assumption when one expects a random incorporation of (multiple) defects. Other possible shapes for trap depth distributions that were already investigated in literature are uniform,47,48 exponential49,50 or binomial distributions33 – among others.
• It has been shown that the integral over T′ in eqn (2) can be approximated by a series expansion, of which only the first two terms are retained:45,47,51,52
 | (4) |
• f0 (E,Tstop) is the filling factor of the distribution. This factor determines the fraction of trap levels that remain filled after the pre-heating step to Tstop. At higher values of Tstop charge carriers that are trapped in shallow traps will have sufficient thermal energy to escape immediately.
There is no generally accepted expression available in literature for f0. One possible way to take this into account is by calculating the fraction of trapped carriers that are released during the pre-heating step to Tstop, assuming saturated filling of the distribution during charging.53 The number of depleted carriers is then straightforwardly determined by taking the integral in eqn (4) up to Tstop:
 | (5) |
The effect of f0 on the filling of the trap depth distribution is shown in Fig. 3.
• In the integration over the energy (eqn (2)), the limits of integration can be narrowed to the interval where traps are present. Here, 0.1 eV and 4.0 eV are chosen for E1 and E2 respectively.
• In order to get the best agreement between model and data, it was necessary to introduce a correction to the nominal, experimental temperature Tstop for each experiment, as a correction factor ΔT. This is due to the fact that the quenching rate for the cooldown step following the preheating to Tstop is not infinite. In other words, the TL signal will deplete naturally between the cooldown and the recording of the final TL glow curve, effectively introducing an offset between the experimental value for Tstop and what is obtained from the data. It was found that a single ΔT is able to account for this complication for all experiments, adding an additional parameter to the model:  .
.
This leads to the final expression for our TL model:
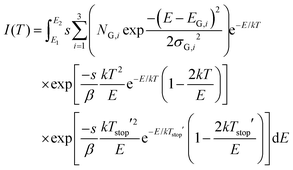 | (6) |
We can numerically integrate eqn (6) and subsequently fit it to the experimental data. This is done by minimizing the sum over the ‘Figure-of-Merit’ (FOM) values for each of the experimental curves:54,55
 | (7) |
As the TL profiles are normalized, one of the pre-factors, NG,2 (eqn (3)), can also be eliminated from the fit, keeping only two ratios R1 and R3:
| R1 = NG,1/NG,2 |
| R3 = NG,3/NG,2, |
It is an important aspect of the fitting process that all TL glow curves, measured for the different Tstop values, are fitted simultaneously with a unique set of parameters, not only restricting the number of used parameters to 9 – in addition to the choice of frequency factor s (see below) – but also improving the credibility of the TL model. Ultimately, we end up with a single set of trapping parameters that describe all 19 experimental TL glow curves. The results are shown in Fig. 4 for selected TL glow curves. The obtained fitting parameters are given in Table 1.
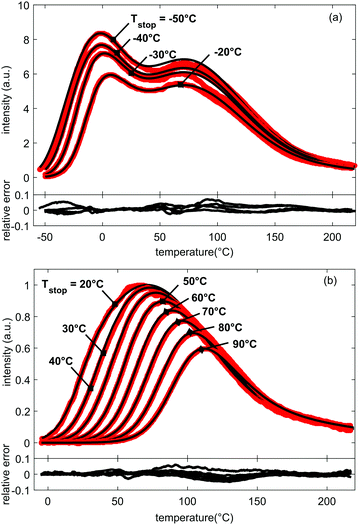 | ||
| Fig. 4 Measured (in red) and fitted (in black) glow curves for LGO:Cr and increasing values for Tstop. Below the plotted glow curves, the relative errors between experiment and fit are shown. All relative errors between the fits and data are below 10% and no large systematic discrepancies occur. The FOM-values for all fitted curves are below 4% (Table 2), corresponding to a good fit of the prominent features of the glow curves. For clarity, presentation of simulation results was split between (a) glow curves with Tstop ranging from −50 °C to −20 °C, and (b) glow curves with Tstop ranging from 20 °C to 90 °C. | ||
| E G,1 (eV) | σ G,1 (eV) | R 1 | E G,2 (eV) | σ G,2 (eV) | E G,3 (eV) | σ G,3 (eV) | R 3 | ΔT (°C) |
|---|---|---|---|---|---|---|---|---|
| 0.72 | 0.06 | 1.08 | 0.94 | 0.13 | 1.19 | 0.20 | 0.13 | 4.83 |
Fig. 4 shows good agreement between data and model, with FOM values below 4% for most fits (see Table 2) and the plotted relative errors between experiment and fit all below 10%, without showing large systematic errors. All prominent features of the data set are well-described.
| T stop (°C) | FOM (%) | Initial rise energy EA (eV) | Simulated energy EA–S (eV) |
|---|---|---|---|
| −50 | 3.0 | 0.52 | 0.55 |
| −40 | 1.5 | 0.56 | 0.60 |
| −30 | 3.7 | 0.64 | 0.64 |
| −20 | 2.5 | 0.67 | 0.67 |
| −10 | 3.5 | 0.67 | 0.69 |
| 0 | 4.0 | 0.72 | 0.71 |
| 10 | 3.1 | 0.72 | 0.73 |
| 20 | 2.2 | 0.76 | 0.76 |
| 30 | 1.8 | 0.86 | 0.79 |
| 40 | 1.7 | 0.81 | 0.82 |
| 50 | 2.4 | 0.85 | 0.85 |
| 60 | 3.5 | 0.90 | 0.88 |
| 70 | 3.4 | 0.93 | 0.91 |
| 80 | 3.1 | 0.94 | 0.94 |
| 90 | 1.8 | 1.02 | 0.96 |
| 100 | 2.8 | 1.07 | 0.99 |
| 110 | 3.3 | 1.11 | 1.02 |
| 120 | 2.5 | 1.21 | 1.04 |
| 130 | 7.0 | 1.10 | 1.07 |
Our model uses three Gaussian sub-distributions. The good agreement between data and model indicates that LGO:Cr has a rich structure of defects, centered around three mean energies of 0.72 eV, 0.94 eV and 1.19 eV. The defects that result in the second sub-distribution (centered around 0.94 eV) are the main cause of the persistent luminescence properties of LGO:Cr at room temperature, as is also shown in Fig. 7 and 8.
The obtained mean energies for the Gaussian sub-distributions, EG,i, are close to the experimental initial rise energies, but lie consistently higher than those, up to Tstop > 80 °C (Table 2). This is expected as the obtained EA should give the energy corresponding to the shallowest filled traps in the distribution.44
We used our simulated data set of glow curves to additionally perform IRA on them, in order to compare obtained ‘simulated initial rise energies EA–S′ with the experimental values (Table 2). The Arrhenius plot and Tstop–EA–S plots are shown in Fig. 5.
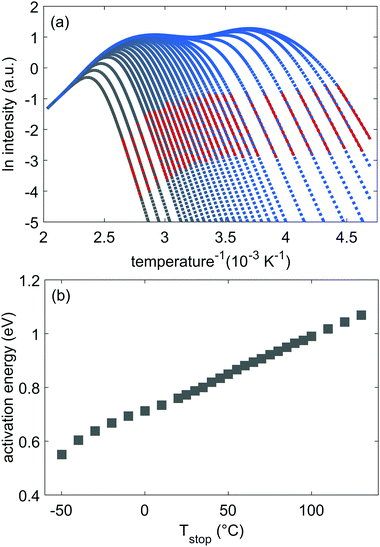 | ||
| Fig. 5 (a) IRA of the simulated TL glow curves based on our developed model. (b) Obtained values for the simulated initial rise energy EA–S, calculated from the Arrhenius plot. | ||
Note that the value for the frequency factor s scales the other values for the energy parameters in the model,39 showing a positive correlation coefficient of at least 0.67 between s and each of the individual mean energy parameters EG,i. The resulting EG,i for each value of s after running the fit procedure again, are given in Table 3.
| s (s−1) | E G,1 (eV) | E G,2 (eV) | E G,3 (eV) |
|---|---|---|---|
| 1.0 × 10¹⁰ | 0.60 | 0.82 | 1.04 |
| 1.0 × 10¹¹ | 0.66 | 0.88 | 1.06 |
| 1.0 × 10¹² | 0.72 | 0.94 | 1.19 |
| 1.0 × 10¹³ | 0.78 | 1.02 | 1.29 |
| 1.0 × 10¹⁴ | 0.87 | 1.16 | 1.32 |
| Correlation coefficient | 0.82 | 0.87 | 0.67 |
Additionally, we found a slight dependence of both the heating rate β and the frequency factor s on the simulated EA–S values. This can be explained by the effect of the filling factor f0(E,Tstop) in the expression for the TL intensity (eqn (6)) that was used to simulate the temperature-annealed set of glow curves, which depends both on β and s. The shift in values was less than 0.1 eV for each of the obtained EA–S for β between 0.08 and 1.0 K s−1, and for s between 1011 and 1013 s−1, when keeping the fit parameters as listed in Table 1. Within this error, the values for EA and EA–S largely correspond with each other.
Because of this large correlation and the influence of f0 on the EA–S, the frequency factor s was kept constant at a value of 1.0 × 10¹² s−1 during the final fitting procedure. This value ultimately resulted in the lowest FOM values for the fitted glow curves. Furthermore, the simulated EA–S for this value of s corresponded best with the experimentally derived energies. This value for s is physically sound and consistent with the frequencies of vibrational modes around 500 cm−1 (≈1.5 × 10¹³ Hz) that were measured for LGO.58
Modeling the afterglow data
To further verify the above results from the TL data, we use the obtained parameters for the trap depth distribution shown in Table 1 as input for a simulation of the afterglow profile of LGO, according to the following expression for expected afterglow in the presence of a trap depth distribution and occurrence of first order kinetics:47 | (8) |
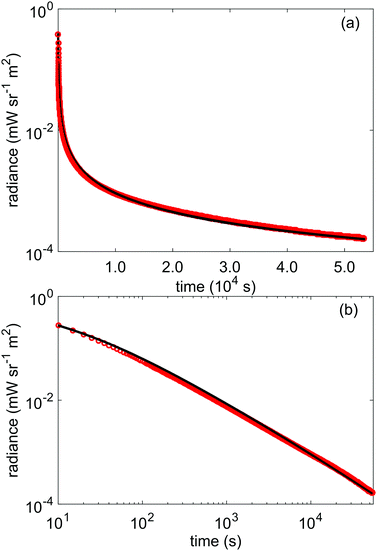 | ||
| Fig. 6 (a) lin-log and (b) log–log plots of the recorded afterglow of LGO:Cr in radiance units (red) compared with the expected afterglow (black) from the distribution model, according to eqn (8). | ||
Contribution of trap depth distribution to afterglow
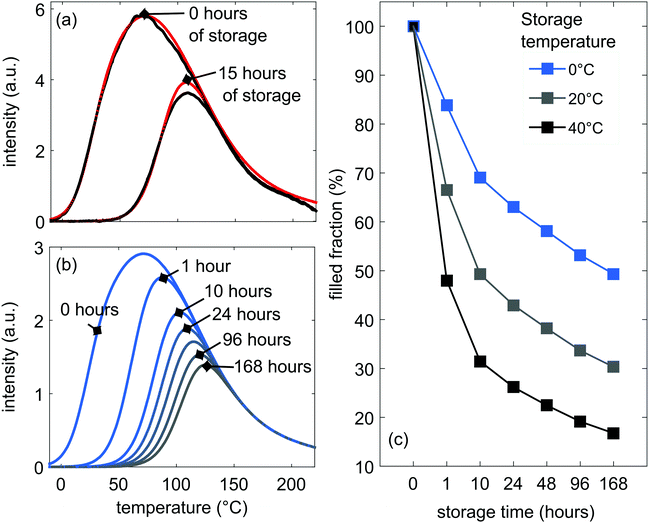
In order to assess which fraction of the trap depth distribution contributes to the room-temperature afterglow, we performed a TL experiment in which we kept a sample in the dark for several hours after charging. These data are given as the black curves in Fig. 7(a). This figure shows the loss of TL signal over a period of 15 h, after a 10 min charging step at 20 °C with 254 nm UV light. The loss in signal is about 47%, which can be due to afterglow, but also non-radiative decay and quenching.We checked if our model can describe this depletion of stored energy. In order to do this, we need to add an additional, time-dependent filling factor f0(E, tstorage, Tstorage) to eqn (6):
| f0(E, tstorage, Tstorage) = exp[−ststoragee−E/kTstorage] | (9) |
Our developed model can now be used to predict the remaining fraction of traps after longer storage times than measured. This is shown in Fig. 7(b). At room temperature, deep traps keep on depleting continuously, but the rate of depletion slows down after 20 h of storage in the dark, with 32% of the initially filled traps still remaining after 168 hours. A large fraction of the filled traps are thus not accessible at room temperature.
The influence of the storage temperature on the trap depletion is shown in Fig. 7(c), where the higher the storage temperature, the bigger the depletion of the filled TL glow curve. Still, even at 40 °C, 26% of traps remain filled after 24 h and 17% after 168 hours. This gives opportunities to use other techniques to empty these deeper traps, e.g. optically stimulated luminescence (OSL),23,24 in order to increase the light output of the LGO:Cr phosphor.
Conversely, the model shows that most of the stored energy is depleted by yielding afterglow. Since the afterglow at room temperature is accurately described by the model, we can estimate the actual afterglow intensity at higher temperatures by only varying the input temperature in eqn (8). The results are shown in Fig. 8. Here, we plot the afterglow curves when only the sub-distributions 2 and 3 are initially filled; a situation comparable to charging at 20 °C. The deeper traps become accessible at higher afterglow temperature, increasing the intensity twofold after 105 seconds of simulated afterglow time. The inset shows the depletion of the filled traps after 105 seconds. Of course at 40 °C, more traps are emptied faster, but an appreciable fraction of filled traps remains, helpful for access by OSL in in vivo experiments.20,40 These simulations immediately show the potential of the phosphor LGO:Cr in bio-imaging applications.
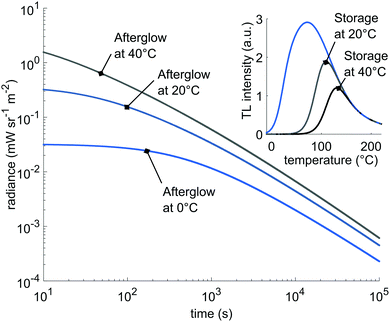 | ||
| Fig. 8 Expected afterglow for different temperatures. Inset: The expected depletion of the initially filled traps for different storage temperatures after 105 seconds. | ||
General discussion & perspectives
Several methods for retrieving the main trapping parameters of a measured glow curve exist in literature.60–64 All of these rely on assumptions and approximations, some of them well-founded, others more speculative. For this reason, it is not expected that only a single technique can give a full overview of the underlying electronic structure of the trapping defects, or the dynamics of the trapping and detrapping processes that are at play in a given TL material.65Furthermore, because of the high correlation between the different trapping parameters such as trap depth and escape frequency (see Table 3), one cannot expect to gain a complete understanding of the trapping structure of a given persistent phosphor from only a single TL measurement.
In this work, we used the combination of the initial rise technique and computerized glow curve fitting on a large set of step-wise annealed TL data, in order to obtain a reliable trap depth distribution in the case of the persistent phosphor LGO:Cr, enabling a more thorough understanding of how the presence of trapping defects alter its physical properties. Notably, the obtained trap distribution can be used to simulate the expected afterglow profile, which reproduces the experimental profile in an excellent way. This information about the trap depth distribution can immediately be used to estimate the performance of the phosphor in various conditions.
The initial rise method is a commonly used experimental TL technique because it is not very time-consuming, easily applied and gives a value for the activation energy in the case of a single trapping state to high accuracy.45 When there is a distribution of trap depths present, it provides the value of the lowest occupied trap levels in the filled part of the distribution,44 as was also shown here. Via the use of the Tstop–Tmax method, the initial rise analysis on a series of step-wise annealed TL curves does reveal whether or not there is a distribution present in the material.53 Information about the frequency factor is not obtainable via IRA, but the resulting energy values should be independent of the values of s. Therefore, the energy values obtained from IRA are good starting estimates, to compare with more intricate methods.
The experimental glow curves are analyzed further by using computerized curve fitting according to eqn (6) and (7), where the underlying assumptions are limited in comparison with other, more empirical techniques such as Hoogenstraaten or peak shape methods.60,62 However, overfitting experimental data by use of too many fitting parameters is an important concern and needs to be avoided.43 Therefore, a model should be able to describe multiple experiments at once, thereby putting more restrictions on the fitting procedure and giving more physically meaningful values as a result.66
In this sense, the fact that we can describe all TL data and that the results allow to accurately simulate the independently recorded afterglow data, shows that the model of a broad trap depth distribution (eqn (3)) is a valid one for the persistent phosphor LGO:Cr. This fitting procedure can be straightforwardly transferred to the analysis of TL and afterglow experiments on different materials, possibly clarifying the current ambiguity of empirical parameters used to describe the behaviour of persistent and storage phosphors.
In the case of LGO:Cr, the presence of traps over such a broad energy range, extending over more than 1 eV in width, shows that LGO can be used in different temperature conditions. For applications, charging will typically be performed around room temperature and higher, and it is expected that the shallow traps in the material, corresponding to the glow peak at 0 °C, do not influence the long-term persistent luminescence, as shown in Fig. 7 and 8. However, our model can be used to predict the afterglow properties of the material for higher temperature conditions as well – in particular normothermia (i.e. normal human body temperature) – and shows that LGO:Cr is useful for in vivo imaging applications (Fig. 8).
The nature of the traps responsible for the trapping in LGO:Cr remains elusive, although this work provides some new insights. Looking at the derived trap distribution with its multiple components, it is probable that multiple defects, rather than a single well-defined trapping center can act as traps. It is believed that chromium ions are responsible for self-trapping.21,67 The measured double banded TL signal in Fig. 2(a) which extends over a broad temperature range was also observed in other, similar NIR persistent phosphors such as LaAlO3:Mn4+ or Gd3Al5−xGaxO12:Cr3+,34,68 which have different host structures than the inverse spinel LiGa5O8. Therefore, the similar shape of the TL glow curves in different hosts could indicate that the recorded signal is partially due to the chromium activator itself. However, separating the contribution of Cr ions from other defect contributions is not straightforward, as variation in Cr content necessarily leads to a variation in luminescence output and quenching effects, and possibly a change in the intrinsic defect concentration.18 To identify the nature of the traps, it is likely that highly accurate theoretical techniques are required to complement the experimental data.18 To aid the comparison between both, reliable analysis techniques with a minimum of parameters and a straightforward physical interpretation are desirable, as was demonstrated here for the NIR persistent phosphor LGO:Cr3+.
Conclusions
In this work, the thermoluminescence and afterglow properties of the NIR-emitting persistent phosphor LiGa5O8:Cr3+ (LGO:Cr) were studied. A combination of McKeever's Tstop–Tmax method with initial rise analysis showed the presence of a broad distribution of trapping states in LGO:Cr between 0.55 and 1.3 eV. Of these, the states with energies between 0.85 eV and 1.02 eV are mainly accessible when charging the phosphor at room temperature.We modelled the trap structure of the LGO persistent phosphor in a rigorous manner by limiting the number of fitting parameters and increasing the experimental data set used for the fit procedure. The traps in the phosphor can be described in terms of a total trap depth distribution that consists of three Gaussian sub-distributions. Both experimental TL and afterglow decay data are well-described by the model. The results show that the afterglow at room temperature is arising from a broad trap sub-distribution with a trapping energy around 0.94 eV. We use the model to simulated expected afterglow behaviour at elevated temperatures to show the potential of using LGO:Cr for long term in vivo imaging.
The model can be used to predict the stability of the deeper-lying traps over longer periods of storage and at other storage temperatures than room temperature. We found that 32% of traps remain filled after storage for 168 hours at 20 °C and 17% at 40 °C. This large fraction of stable traps opens up possibilities for applications at elevated temperatures, dosimetry or use of optical stimulation to deplete the remaining trapping states on demand.
The methods to analyze and describe the trapping structure of the persistent phosphor LGO:Cr are straightforwardly applicable to other persistent and storage phosphors. With this approach, it is expected that the relevant trapping parameters of a given material can be determined more accurately, thus leading to better prediction and evaluation of the performance under various conditions.
Conflicts of interest
The authors declare no conflicts of interest.Acknowledgements
O.Q. De Clercq and J. J. Joos acknowledge the financial support of the Ghent University's Special Research Fund (grant numbers BOF-01IO2014 and BOF-002101). J. Du acknowledges the China Scholarship Council (grant number 201606170077). P. F. Smet acknowledges the ENCLOSE project at Ghent University (grant number BOF15-GOA-007). The authors also thank the colleagues of Lumilab for their valuable insights and fruitful discussions.Notes and references
- S. W. McKeever, Phys. Status Solidi A, 1980, 62, 331–340 CrossRef CAS.
- P. F. Smet, K. Van den Eeckhout, O. Q. De Clercq and D. Poelman, in Handbook on the Physics and Chemistry of Rare Earths, ed. B. Jean-Claude and K. P. Vitalij, Elsevier, 2015, vol. 48 Search PubMed.
- Y. Li, M. Gecevicius and J. Qiu, Chem. Soc. Rev., 2016, 45, 2090–2136 RSC.
- K. Van den Eeckhout, P. F. Smet and D. Poelman, Materials, 2010, 3, 2536–2566 CrossRef CAS.
- T. Matsuzawa, Y. Aoki, N. Takeuchi and Y. Murayama, J. Electrochem. Soc., 1996, 143, 2670–2673 CrossRef CAS.
- J. Botterman and P. F. Smet, Opt. Express, 2015, 23, A868–A881 CrossRef CAS PubMed.
- M. Müller, M.-F. Volhard and T. Jüstel, RSC Adv., 2016, 6, 8483–8488 RSC.
- D. C. Rodríguez Burbano, S. K. Sharma, P. Dorenbos, B. Viana and J. A. Capobianco, Adv. Opt. Mater., 2015, 3, 551–557 CrossRef.
- P. Smet, N. Avci and D. Poelman, J. Electrochem. Soc., 2009, 156, H243–H248 CrossRef CAS.
- Q. le Masne de Chermont, C. Chaneac, J. Seguin, F. Pelle, S. Maitrejean, J. P. Jolivet, D. Gourier, M. Bessodes and D. Scherman, Proc. Natl. Acad. Sci. U. S. A., 2007, 104, 9266–9271 CrossRef CAS PubMed.
- J. Frangioni, Curr. Opin. Chem. Biol., 2003, 7, 626–634 CrossRef CAS.
- Z. Pan, Y. Y. Lu and F. Liu, Nat. Mater., 2011, 11, 58–63 CrossRef PubMed.
- B. Del Rosal, D. H. Ortgies, N. Fernandez, F. Sanz-Rodriguez, D. Jaque and E. M. Rodriguez, Adv. Mater., 2016, 28, 10188–10193 CrossRef CAS.
- P. Haro-Gonzalez, W. T. Ramsay, L. Martinez Maestro, B. del Rosal, K. Santacruz-Gomez, C. Iglesias-dela Cruz Mdel, F. Sanz-Rodriguez, J. Y. Chooi, P. Rodriguez Sevilla, M. Bettinelli, D. Choudhury, A. K. Kar, J. G. Sole, D. Jaque and L. Paterson, Small, 2013, 9, 2162–2170 CrossRef CAS.
- K. Van den Eeckhout, D. Poelman and P. F. Smet, Materials, 2013, 6, 2789–2818 CrossRef CAS.
- Y. Zhuang, Y. Katayama, J. Ueda and S. Tanabe, Opt. Mater., 2014, 36, 1907–1912 CrossRef CAS.
- A. Bessière, S. Jacquart, K. Priolkar, A. Lecointre, B. Viana and D. Gourier, Opt. Express, 2011, 19, 10131–10137 CrossRef PubMed.
- A. De Vos, K. Lejaeghere, D. E. P. Vanpoucke, J. J. Joos, P. F. Smet and K. Hemelsoet, Inorg. Chem., 2016, 55, 2402–2412 CrossRef CAS PubMed.
- D. Gourier, A. Bessière, S. K. Sharma, L. Binet, B. Viana, N. Basavaraju and K. R. Priolkar, J. Phys. Chem. Solids, 2014, 75, 826–837 CrossRef CAS.
- B. Viana, S. K. Sharma, D. Gourier, T. Maldiney, E. Teston, D. Scherman and C. Richard, J. Lumin., 2016, 170, 879–887 CrossRef CAS.
- O. Q. De Clercq, L. I. D. J. Martin, K. Korthout, J. Kusakovskij, H. Vrielinck and D. Poelman, J. Mater. Chem. C, 2017, 5, 10861–10868 RSC.
- O. Q. De Clercq and D. Poelman, ECS J. Solid State Sci. Technol., 2017, 7, R3171–R3175 CrossRef.
- F. Liu, W. Yan, Y. J. Chuang, Z. Zhen, J. Xie and Z. Pan, Sci. Rep., 2013, 3, 1554 CrossRef PubMed.
- D. Van der Heggen, J. J. Joos, D. C. Rodríguez Burbano, J. A. Capobianco and P. F. Smet, Materials, 2017, 10, 867 CrossRef PubMed.
- E. G. Yukihara and S. W. McKeever, Optically stimulated luminescence: fundamentals and applications, John Wiley & Sons, 2011 Search PubMed.
- P. Dorenbos, Phys. Rev. B: Condens. Matter Mater. Phys., 2013, 87, 035118 CrossRef.
- P. Dorenbos, ECS J. Solid State Sci. Technol., 2013, 2, R3001–R3011 CrossRef CAS.
- P. Dorenbos and E. G. Rogers, ECS J. Solid State Sci. Technol., 2014, 3, R150–R158 CrossRef CAS.
- J. J. Joos, D. Poelman and P. F. Smet, Phys. Chem. Chem. Phys., 2015, 17, 19058–19078 RSC.
- J. Botterman, K. Van den Eeckhout, A. J. J. Bos, P. Dorenbos and P. F. Smet, Opt. Mater. Express, 2012, 2, 341–349 CrossRef CAS.
- K. Van den Eeckhout, P. F. Smet and D. Poelman, Materials, 2011, 4, 980 CrossRef CAS.
- N. Basavaraju, K. R. Priolkar, A. Bessiere, S. K. Sharma, D. Gourier, L. Binet, B. Viana and S. Emura, Phys. Chem. Chem. Phys., 2017, 19, 1369–1377 RSC.
- J. Ueda, P. Dorenbos, A. J. J. Bos, K. Kuroishi and S. Tanabe, J. Mater. Chem. C, 2015, 3, 5642–5651 RSC.
- J. Xu, J. Ueda and S. Tanabe, Opt. Mater. Express, 2015, 5, 963 CrossRef.
- E. G. Rogers and P. Dorenbos, J. Lumin., 2014, 155, 135–140 CrossRef CAS.
- P. Boutinaud, Inorg. Chem., 2013, 52, 6028–6038 CrossRef CAS PubMed.
- E. G. Rogers and P. Dorenbos, J. Lumin., 2014, 153, 40–45 CrossRef CAS.
- R. Chen and S. W. McKeever, Theory of thermoluminescence and related phenomena, World Scientific, 1997 Search PubMed.
- R. Chen, V. Pagonis and J. L. Lawless, Radiat. Meas., 2016, 91, 21–27 CrossRef CAS.
- X. Fu, C. Liu, J. Shi, H. Man, J. Xu and H. Zhang, Opt. Mater., 2014, 36, 1792–1797 CrossRef CAS.
- S. W. S. McKeever, Radiat. Meas., 2011, 46, 1336–1341 CrossRef CAS.
- J. Botterman, J. J. Joos and P. F. Smet, Phys. Rev. B: Condens. Matter Mater. Phys., 2014, 90, 085147 CrossRef.
- K. Brylew, W. Drozdowski, A. J. Wojtowicz, K. Kamada and A. Yoshikawa, J. Lumin., 2014, 154, 452–457 CrossRef CAS.
- K. Van den Eeckhout, A. J. J. Bos, D. Poelman and P. F. Smet, Phys. Rev. B: Condens. Matter Mater. Phys., 2013, 87, 045126 CrossRef.
- V. Pagonis, G. Kitis and C. Furetta, Numerical and practical exercises in thermoluminescence, Springer Science & Business Media, 2006 Search PubMed.
- V. Pagonis, P. Morthekai and G. Kitis, Geochronometria, 2014, 41, 168–177 CAS.
- W. F. Hornyak and R. Chen, J. Lumin., 1989, 44, 73–81 CrossRef CAS.
- G. Rudlof, J. Becherer and H. Glaefeke, Phys. Status Solidi A, 1978, 49, K121–K124 CrossRef CAS.
- W. L. Paterson, J. Comput. Phys., 1971, 7, 187–190 CrossRef.
- T. Sakurai, K. Shoji, K. Itoh and R. K. Gartia, J. Appl. Phys., 2001, 89, 2208–2212 CrossRef CAS.
- G. Kitis and J. Gomez-Ros, Nucl. Instrum. Methods Phys. Res., Sect. A, 2000, 440, 224–231 CrossRef CAS.
- G. Kitis, J. Gomez-Ros and J. Tuyn, J. Phys. D: Appl. Phys., 1998, 31, 2636 CrossRef CAS.
- A. C. Coleman and E. G. Yukihara, Radiat. Meas., 2018, 117, 70–79 CrossRef CAS.
- H. G. Balian and N. W. Eddy, Nucl. Instrum. Methods, 1977, 145, 389–395 CrossRef CAS.
- A. J. J. Bos, T. M. Piters, J. M. Gomez Ros and A. Delgado, Radiat. Prot. Dosim., 1994, 51, 257–264 CAS.
- J. Lagarias, J. Reeds, M. Wright and P. Wright, SIAM J Optim., 1998, 9, 112–147 CrossRef.
- J. A. Nelder and R. Mead, Comput. J., 1965, 7, 308–313 CrossRef.
- V. G. Keramidas, B. A. Deangelis and W. B. White, J. Solid State Chem., 1975, 15, 233–245 CrossRef CAS.
- P. Avouris and T. N. Morgan, J. Chem. Phys., 1981, 74, 4347–4355 CrossRef CAS.
- R. Chen, J. Appl. Phys., 1969, 40, 570–585 CrossRef CAS.
- R. Chen and S. Winer, J. Appl. Phys., 1970, 41, 5227–5232 CrossRef CAS.
- W. Hoogenstraaten, Philips Res. Rep., 1958, 13, 515–693 CAS.
- A. Halperin, A. Braner, A. Ben-Zvi and N. Kristianpoller, Phys. Rev., 1960, 117, 416 CrossRef CAS.
- H. Gobrecht and D. Hofmann, J. Phys. Chem. Solids, 1966, 27, 509–522 CrossRef CAS.
- A. J. J. Bos, P. Dorenbos, A. Bessière and B. Viana, Radiat. Meas., 2008, 43, 222–226 CrossRef CAS.
- K. W. Meert, J. J. Joos, D. Poelman and P. F. Smet, J. Lumin., 2016, 173, 263–273 CrossRef CAS.
- J. Xu, J. Ueda, Y. Zhuang, B. Viana and S. Tanabe, Appl. Phys. Express, 2015, 8, 042602 CrossRef.
- J. Du, O. Q. De Clercq, K. Korthout and D. Poelman, Materials, 2017, 10, 1422 CrossRef PubMed.
| This journal is © the Owner Societies 2018 |

