
 Open Access Article
 This Open Access Article is licensed under a
 Creative Commons Attribution 3.0 Unported Licence
Intermolecular interactions upon carbon dioxide capture in deep-eutectic solvents†
Shashi Kant
Shukla
 *a and
Jyri-Pekka
Mikkola
*ab
*a and
Jyri-Pekka
Mikkola
*ab
aTechnical Chemistry, Department of Chemistry, Chemical-Biological Centre, Umeå University, SE-90187 Umeå, Sweden. E-mail: shashi.kant.shukla@umu.se; jyri-pekka.mikkola@umu.se
bIndustrial Chemistry & Reaction Engineering, Department of Chemical Engineering, Johan Gadolin Process Chemistry Centre, Åbo Akademi University, FI-20500 Åbo-Turku, Finland
First published on 10th September 2018
Abstract
Herein we report the CO2 uptake in potential deep-eutectic solvents (DESs) formed between hydrogen bond acceptors (HBAs) such as monoethanolammonium chloride ([MEA·Cl]), 1-methylimidazolium chloride ([HMIM·Cl]) and tetra-n-butylammonium bromide ([TBAB]) and hydrogen bond donors (HBDs) like ethylenediamine ([EDA]), diethylenetriamine ([DETA]), tetraethylenepentamine ([TEPA]), pentaethylenehexamine ([PEHA]), 3-amino-1-propanol ([AP]) and aminomethoxypropanol ([AMP]) and analyzed the outcome in terms of the specific polarity parameters. Among various combinations of HBAs and HBDs, [MEA·Cl][EDA]-, [MEA·Cl][AP]-, [HMIM·Cl][EDA]- and [HMIM·Cl][AP] showed excellent CO2 uptake which was further improved upon increasing the mole ratio of HBA![[thin space (1/6-em)]](https://www.rsc.org/images/entities/char_2009.gif) :HBD from 1:1 to 1:4. The lowest CO2 uptake in [MEA·Cl][PEHA] (12.7 wt%) and [HMIM·Cl][PEHA] (8.4 wt%) despite the highest basicity of [PEHA] infers that the basicity is not the sole criteria for guiding the CO2 uptake but, in reality, CO2 capture in a DES relies on the interplay of H-bonding interactions between each HBA and HBD. The role of HBAs in guiding CO2 uptake was more prominent with weak HBDs such as [TEPA] and [PEHA]. The speciation of absorbed CO2 into carbamate, carbonate, and bicarbonate was favorable in DES characterized by comparable hydrogen bond donor acidity (α) and hydrogen bond acceptor basicity (β) values, whereas the conversion of carbamate to carbonate/bicarbonate was observed to depend on α. The addition of water in DES resulted in lower CO2 uptake due to the decreased basicity (β).
:HBD from 1:1 to 1:4. The lowest CO2 uptake in [MEA·Cl][PEHA] (12.7 wt%) and [HMIM·Cl][PEHA] (8.4 wt%) despite the highest basicity of [PEHA] infers that the basicity is not the sole criteria for guiding the CO2 uptake but, in reality, CO2 capture in a DES relies on the interplay of H-bonding interactions between each HBA and HBD. The role of HBAs in guiding CO2 uptake was more prominent with weak HBDs such as [TEPA] and [PEHA]. The speciation of absorbed CO2 into carbamate, carbonate, and bicarbonate was favorable in DES characterized by comparable hydrogen bond donor acidity (α) and hydrogen bond acceptor basicity (β) values, whereas the conversion of carbamate to carbonate/bicarbonate was observed to depend on α. The addition of water in DES resulted in lower CO2 uptake due to the decreased basicity (β).
Introduction
Carbon dioxide (CO2) emissions due to anthropogenic activities have been constantly increasing over the past century and gaining worldwide attention due to the deleterious action of this notorious greenhouse gas. Subsequently, to develop materials that selectively, efficiently and inexpensively capture CO2 is of great importance.1–3 Among various methods proposed to reduce anthropogenic CO2 emissions, a carbon dioxide capture and sequestration (CCS) process that incorporates both physical and chemical adsorptions and absorption rely heavily on the concept of using alkanolamine-based solvents. Typical solutions involved include monoethanolamine (MEA) and methyldiethylamine (MDEA) and their aqueous solutions.4 Despite their wide acceptability, several disadvantages linger with MEA- and MDEA-based technologies such as their volatility, high cost, substantial energy consumption and corrosiveness. These shortcomings pose a potential threat to human health and critical mutilations to the environment.5 As a result, the design of alternative materials for CO2 capture is of high importance and has garnered much attention in the last decade.6Among the many possibilities, ionic liquids (ILs) have been extensively investigated as promising candidates because of their several advantageous properties to substitute the traditional scrubbing agents for reversible CO2 capture.7 In this regard, a variety of ILs containing pyridinium, imidazolium, guanidinium, amine-functionalized cation and inorganic/organic anion have been examined and the basicity of the anion has been identified to play a major role upon CO2 capture8–14 following semimolar or multi-molar mechanism.15,16 However, the multi-molar CO2 absorption in ILs became less attractive when converted to the gravimetric uptake values.13,16,17 For example, dual amino-functionalized cation-tethered IL, capable of absorbing an equimolar amount of CO2 exhibited only 18.5 wt% capacity on the gravimetric scale.18 Moreover, high viscosities, unfavorable energy consumption and the high cost of starting materials still hint that ILs are further inapt for large scale applications.19,20
In quest of the sustainable solvents, deep-eutectic solvents (DESs) has been extensively explored in the last decade. DESs are eutectic mixtures of Lewis or Brønsted acids also called as HBA and bases/HBDs and can contain a variety of anionic and/or cationic species and therefore exhibit properties similar to ILs.21 DES can be prepared by a single-step atom-economic reaction under solvent-free conditions and does not require further purification thereby simplifying the scale up for various processes.22 The hydrogen bonding strength via charge delocalization between the HBA and HBD component is responsible for the relative difference in the melting point of the eutectic mixture and thus, a variety of potential DES can be easily prepared by varying the strength and molar ratios of the HBD and HBA substituents.23,24
DES's efficacy in gas absorption was recognized after the pioneering work of Zhu et al., who employed choline chloride (ChCl) + urea as a heterogeneous sorbent and catalyst upon chemical fixation of CO2 to cyclic carbonates.25 Li et al. measured the CO2 solubility at various temperatures and pressures in ChCl + urea-based DESs, at different mole ratios.26 Later, different combinations of HBD (urea, lactic acid, glycerol etc.) and HBA (tetraalkylammonium/phosphonium halides, choline chloride etc.) components were tried to optimize the CO2 uptake capacity in DESs but the molar capability of all the tested DESs remained in the range of 0.02–0.14 mole per mole of DES with the highest value equivalent to 7 wt%.27–30 Mirza et al. measured CO2 solubility in three DESs reline, ethaline and malinine in the temperature range 309–329 K and at pressure up to 160 kPa.31 The modified Peng–Robinson equation of state was used to correlate the experimental data. The thermodynamic parameters derived from the equation suggested CO2 absorption as a nonspontaneous exothermic process.31 Very recently, Trivedi et al. reported 33.7 wt% of CO2 in [MEA·Cl][EDA] formed at 1:3 mole ratio, at 30 °C.32 The large CO2 uptake in [MEA·Cl][EDA]-based DESs was assumed to depend on the change in polarity and basicity, although a direct correlation between the actual polarity parameters and CO2 uptake was absent.32
To the best of our knowledge, so far no report discussing the role of intermolecular interactions on CO2 capture and speciation of absorbed CO2 in ILs and DESs can be found in open literature. The solvatochromic polarity parameters include electronic transition energy (ET(30)), hydrogen bond donor acidity (α), hydrogen bond acceptor basicity (β) and, dipolarity/polarizability (π*).33–36 The ET(30) measures various possible directional and non-directional solute–solvent interactions between Reichardt's dye (30) and solvent molecules and can be determined by using the absorption maxima of Reichardt's dye 30. The dipolarity/polarizability (π*) parameter denotes the electrolytic strength of the DES and relies on the interaction of probe molecule with its cybotactic environment and can be determined from the spectroscopic shift of N,N-diethyl-4-nitroaniline. The hydrogen bond acceptor tendency (β) exhibits the basicity of the hydrogen bond donor (HBD) component of DES and can be determined by using the spectroscopic shift of 4-nitroaniline with respect to N,N-diethyl-4-nitroaniline. The hydrogen bond donor acidity (α) denotes the donating ability of the hydrogen bond acceptor (HBA) component of DES and can be obtained by employing ET(30) and π*. The empirical equations to obtain various polarity parameters are given in Table 2. These polarity parameters (ET(30), α, β and π*) can be employed as a tool for accounting the influence of intermolecular solute–solvent interactions upon various physical and chemical changes.37
Recently, Shukla and Kumar have used solvatochromic polarity parameters during the Hammett acidity (H0) measurements to discuss the role of intermolecular interactions on the dissociation of aqueous carboxylic acids in protic ionic liquids.38 The acidity–polarity correlation was further supported by thermodynamic parameters (ΔH0 and ΔS0).38 Liu et al. discussed the role of intermolecular interaction upon CO2 capture (0.7551 mol CO2 per mol DES) in the 1,3-butanediol + 1,3-ethanediamine system in terms of excess molar volume (VEM), viscosity deviations (Δη) and apparent molar volumes (Vφ,1 and Vφ,2), from density and viscosity values measured at different temperatures and compositions.39 Contrary to the excess properties, polarity parameters have the advantage in terms of predicting the nature and specificity of the interactions.
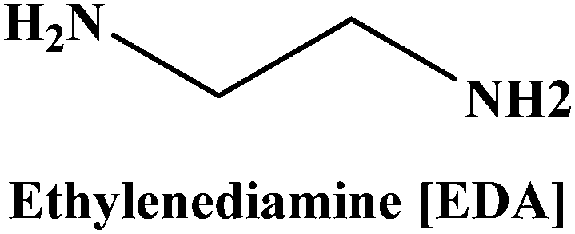
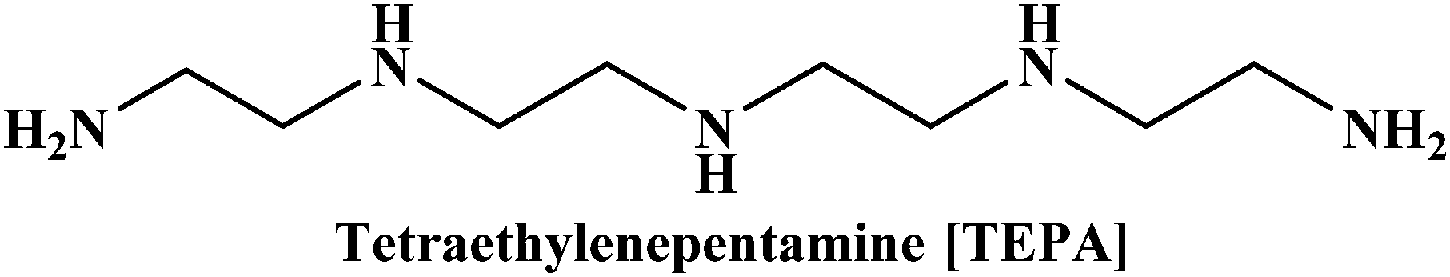
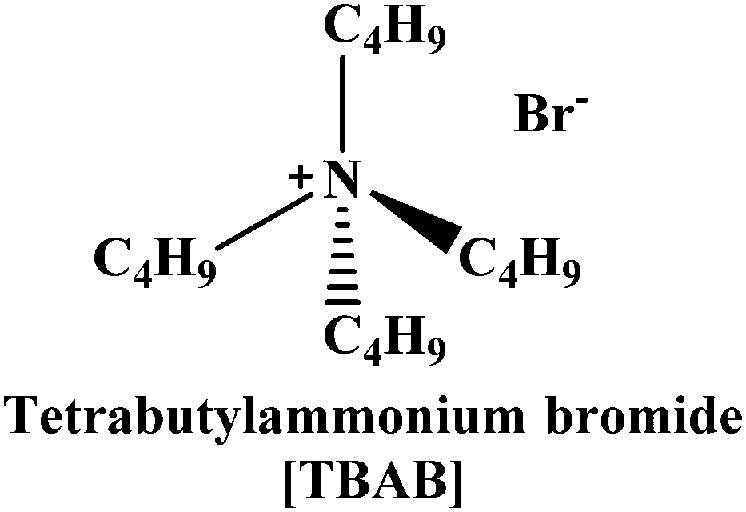
In the present work, we have attempted to investigate the role of intermolecular interactions on CO2 capture and its speciation into the carbamate, carbonate, and bicarbonate in potential DESs. For this purpose, the gravimetric CO2 uptakes in these DESs are analyzed in terms of the ET(30), α, β, and π* values. The adverse effect of viscosity on CO2 absorption is also taken into account while correlating the polarity parameters with CO2 wt%. The structure of HBD and HBA components of DESs are shown in Table 1. The structure of different solvatochromic dyes involved in the polarity determinations is shown in Fig. 1.
| Hydrogen bond acceptor | Hydrogen bond donor | |
|---|---|---|

|
|

|

|
|
|

|
||
|

|

|
 | ||
| Fig. 1 Structure of the solvatochromic probe molecules. | ||
Experimental section
Materials
The spectroscopic indicator dye 2,6-diphenyl-4-(2,4,6-triphenylpyridinium-1-yl)-phenolate (1), 4-nitroaniline (2), N,N-diethyl-4-nitroaniline (3) and monoethanolamine, 1-methylimidazole, tetrabutylammonium bromide, 3-amino-1-propanol, aminomethylpropanol, ethylenediamine, diethyltetramine, triethylenepentamine, and pentaethylhexamine were procured from Sigma-Aldrich and used without further purification. Hydrochloric acid was obtained from Merck.Synthesis of DESs
Monoethanolamine (MEA)- and 1-methylimidazole(MIM)-based DESs were synthesized by protonation–complexation processes. Protonation involved the drop-wise addition of aqueous hydrochloric acid into the MEA and MIM, maintained at 273 K under vigorous stirring. The resultant protic ionic liquids (PILs) were first placed under rotary-evaporator at 60 °C and later connected to the ultra-high vacuum pump operated at 70 °C to remove all traces of water and other volatile impurities. Complexation comprised addition of various HBDs in PILs at 80 °C for 1 h, to yield the desired DESs. The TBAB-based DESs were prepared by complexing the TBAB with different HBDs at 80 °C for 1 h. The pictorial representation of the DESs synthesis is shown in Scheme 1. All DESs and their precursors were characterized by 1H NMR- and 13C NMR-spectroscopy (see ESI†). | ||
| Scheme 1 Synthetic route to prepare a typical DES. | ||
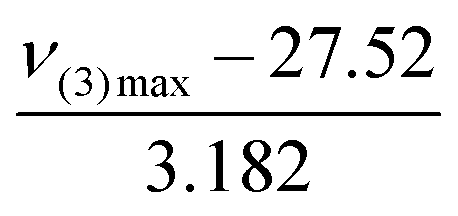
Determination of polarity parameters
All solvatochromic dyes were dissolved in methanol to prepare a stock solution (10−2 M) prior to the polarity measurements. The stock solution was taken in a glass vial first and methanol was removed by blowing nitrogen gas into the vial followed by the addition of 1 ml of DESs. Consequently, the resultant solution was transferred into a 1.3 ml quartz cuvette under nitrogen atmosphere and sealed with a septum. The wavelength of maximum absorption (λmax) was recorded at room temperature using a UV-visible spectrophotometer. Different polarity parameters were derived by employing the empirical equations given in Table 2.| Polarity parameters | Empirical equations |
|---|---|
| Electronic transition energy (ENT) |
E
T(30) (kcal mol−1) = hcνabsmax = 28591/λabsmax (nm) = 2.8591νabsmax where νabsmax is the maximum wavelength of lowest energy band of Reichardt's dye (1) |
| Polarity index (π*) = |
|
| Hydrogen bond donor acidity (α) = |

|
| Hydrogen bond acceptor basicity (β) = |
 where ν(2)max and ν(3)max are the maximum wave number of the 4-nitroaniline (probe 2) and N,N-diethyl-4-nitroaniline (probe 3), respectively in kK, where kK = 103 cm−1 where ν(2)max and ν(3)max are the maximum wave number of the 4-nitroaniline (probe 2) and N,N-diethyl-4-nitroaniline (probe 3), respectively in kK, where kK = 103 cm−1 |
Viscosity measurement
The viscosities (η) of different DES systems were measured at room temperature by using a Brookfield rotating viscometer (RVDV1) with a cone and plate arrangement. The viscosity (η) values of DESs were obtained according to the given equation:| η = (100/RPM)(TK)(torque)(SMC) |
CO2 absorption experiment
In the present study, CO2 absorption measurements were carried out by bubbling CO2 gas, with a flow rate of 50 ml min−1 into a vial containing ∼3 g of DESs. The vial was weighed at regular intervals to record the differential weight of absorbed CO2 and, consequently, the weight percent of absorbed CO2 in the respective DESs. The electronic balance used for weighing had an accuracy of ±0.1 mg. Desorption experiments were also performed under inert atmosphere by weighing the vial at regular time intervals. The water content in DESs as measured by the Karl-Fisher Coulometer was >30 ppm.Speciation of absorbed CO2 in carbamate, carbonate and bicarbonate
The 13C NMR spectroscopy was employed for the speciation of absorbed CO2 in DESs. Speciation of CO2 was based on the calibration of the 13C NMR spectra of CO2-treated samples with those of the reference spectrum of K2CO3 and KHCO3, as shown by Mani et al.40 The 13C NMR spectrum of 1 M K2CO3 and KHCO3 and the weighted mixture of two salts were prepared in D2O. The speciation results of absorbed CO2 into carbamate, carbonate and bicarbonate were obtained based on the linear relation between the change of chemical shifts in K2CO3, KHCO3 and their mixtures against the molar compositions as shown in Fig. S1 (ESI†).Results and discussion
For all DESs CO2 uptake experiments, viscosity and polarity measurements (ET(30), α, β and π*) were carried out at room temperature and values are presented in Table 3. The CO2 uptake values for [MEA·Cl][EDA]-based DESs were observed to be in close agreement with those reported by Trivedi et al.32 The small deviation between current and reported values in the CO2 uptake are owing to the difference in the experimental temperatures.32 All DESs exhibited the excellent CO2 uptake during the first hour whereas equilibrium was attained in 3–5 h, depending on affinity of the DESs towards CO2. For example, for [MEA·Cl][EDA] at 1:3 and 1:4 ratios, nearly 32.5 wt% and 34.1 wt% of CO2 was recorded in 1 h, respectively. At equilibrium, these values improved to 36.5 wt% and 39 wt% for 1:3 and 1:4 mole ratios, respectively. Therefore, for comparison, CO2 uptake measured during the first hour in DESs is used in all graphical representations whereas the equilibrium CO2 wt% are given in Table 3.
| DESs | Mol. wt | wt% CO2b | Mole CO2/mole DESs | E T30c/kcal mol−1 | π*c | α | β | η /cP |
|---|---|---|---|---|---|---|---|---|
| a Ref. 32. b Error associated with wt% CO2 is ≤±0.004. c Polarity values are reproducible within ±0.004. d Viscosity values are reproducible within precision of ±0.003. | ||||||||
| [MEA·Cl][EDA] (1:1) |
78.82 | 23.5 (20.5)a | 0.38 | 59.0 | 1.18 | 0.94 | 0.73 | 128.0 |
| [MEA·Cl][EDA] (1:2) |
72.58 | 30.9 (24.4)a | 0.47 | 55.8 | 1.17 | 0.76 | 0.80 | 17.3 |
| [MEA·Cl][EDA] (1:3) |
69.46 | 36.5 (31.5)a | 0.54 | 54.0 | 1.15 | 0.65 | 0.82 | 9.6 |
| [MEA·Cl][EDA] (1:4) |
67.59 | 39.0 (30.8)a | 0.57 | 52.7 | 1.13 | 0.57 | 0.86 | 7.0 |
| [MEA·Cl][DETA] (1:4) |
102.00 | 25.5 | 0.57 | 51.3 | 1.06 | 0.54 | 0.90 | 19.2 |
| [MEA·Cl][TEPA] (1:4) |
136.50 | 16.6 | 0.63 | 50.4 | 1.00 | 0.52 | 0.87 | 109.4 |
| [MEA·Cl][PEHA] (1:4) |
205.40 | 12.7 | 0.59 | 50.2 | 0.83 | 0.63 | 1.03 | 222.0 |
| [HMIM·Cl][EDA] (1:1) |
89.33 | 9.0 | 0.19 | — | — | — | — | 80.0 |
| [HMIM·Cl][EDA] (1:2) |
79.59 | 25.0 | 0.45 | 53.7 | 1.11 | 0.66 | 0.77 | 14.1 |
| [HMIM·Cl][EDA] (1:3) |
74.72 | 26.7 | 0.45 | 52.8 | 1.13 | 0.58 | 0.56 | 7.7 |
| [HMIM·Cl][EDA] (1:4) |
71.80 | 30.8 | 0.50 | 52.4 | 1.13 | 0.56 | 0.86 | 5.8 |
| [HMIM·Cl][DETA] (1:4) |
106.25 | 22.8 | 0.55 | 51.3 | 1.08 | 0.53 | 0.90 | 17.3 |
| [HMIM·Cl][TEPA] (1:4) |
175.15 | 9.9 | 0.39 | 50.3 | 0.98 | 0.53 | 0.92 | 100.5 |
| [HMIM·Cl][PEHA] (1:4) |
209.61 | 8.4 | 0.40 | 49.9 | 0.91 | 0.55 | 0.94 | 213.0 |
| [MEA·Cl][AP] (1:1) |
86.33 | 15.8 | 0.28 | 59.7 | 1.15 | 1.02 | 0.58 | 126.7 |
| [MEA·Cl][AP] (1:2) |
82.56 | 21.0 | 0.37 | 58.0 | 1.13 | 0.92 | 0.68 | 67.0 |
| [MEA·Cl][AP] (1:3) |
80.72 | 24.3 | 0.42 | 57.2 | 1.09 | 0.89 | 0.74 | 64.0 |
| [MEA·Cl][AP] (1:4) |
79.60 | 26.3 | 0.46 | 56.6 | 1.07 | 0.87 | 0.74 | 55.0 |
| [HMIM·Cl][AP] (1:1) |
96.84 | 2.0 | 0.04 | 59.2 | 1.11 | 1.01 | 0.65 | 130.6 |
| [HMIM·Cl][AP] (1:2) |
89.59 | 9.5 | 0.21 | 58.0 | 1.11 | 0.93 | 0.67 | 57.0 |
| [HMIM·Cl][AP] (1:3) |
85.97 | 13.9 | 0.30 | 57.2 | 1.11 | 0.88 | 0.76 | 49.9 |
| [HMIM·Cl][AP] (1:4) |
83.8 | 19.4 | 0.37 | 56.7 | 1.08 | 0.88 | 0.72 | 39.0 |
| [TBAB][AP] (1:2) |
157.53 | 11.1 | 0.43 | 47.3 | 1.08 | 0.27 | 0.88 | 243.0 |
| [TBAB][AP] (1:3) |
136.93 | 15.6 | 0.49 | 48.1 | 1.08 | 0.32 | 0.85 | 51.2 |
| [TBAB][AP] (1:4) |
124.56 | 18.1 | 0.51 | 48.5 | 1.02 | 0.39 | 0.90 | 38.4 |
| [TBAB][AMP] (1:3) |
147.45 | 10.5 | 0.35 | 48.9 | 0.99 | 0.43 | 0.94 | 199.7 |
| [TBAB][AMP] (1:4) |
135.79 | 12.2 | 0.38 | 49.2 | 0.98 | 0.46 | 0.89 | 252.2 |
CO2 capture in DESs can be improved (1) by optimization i.e. by varying the molar ratio of HBD component and (2) by altering the strength of HBD and HBA components. Optimization experiments are carried out for [MEA·Cl][EDA]-, [HMIM·Cl][EDA]-, [MEA·Cl][AP], [HMIM·Cl][AP], [TBAB][AP]- and [TBAB][AMP]-based DESs while the influence of various HBA and HBD components on CO2 uptake is examined for the DESs prepared by mixing [MEA·Cl] and [HMIM·Cl] with [EDA], [DETA], [TEPA] and [PEHA] at 1:4 mole ratio. Compared to [MEA·Cl]- (m.p. 72 °C) and [HMIM·Cl] (m.p. 75 °C) which formed DES even at 1:1 mole ratio with HBDs, [TBAB] (m.p. 103 °C) formed DES at higher mole ratio with [AP] (1:2) and [AMP] (1:3) due to high melting point.
Effect of molar ratio of HBD on CO2 capture
In case of [MEA·Cl][EDA]-, [HMIM·Cl][EDA]-, [MEA·Cl][AP]-, [HMIM·Cl][AP]-, [TBAB][AP]-, and [TBAB][AMP]-based DESs, CO2 uptake was observed to improve with the increasing mole ratio of HBD components (i.e. optimization) as shown in Table 3. The CO2 uptake in [MEA·Cl][EDA]-class of DESs was increased by ∼6% from 1:1 to 1:3, whereas only 3% increment was observed at 1:4 ratio (Fig. 2(a)). The lower increment in CO2 uptake at 1:4 indicates dissipation of the capability of the [MEA·Cl][EDA]-based DESs formed beyond 1:4 mole ratio. Therefore, CO2 uptake in DESs prepared beyond 1:4 was not considered. However, in case of [MEA·Cl][EDA], an increase in the CO2 uptake from 23.5 wt% to 39 wt% was less than two-folds despite increasing the [EDA] ratio by four-folds; this clearly indicates the role of intermolecular interactions upon CO2 absorption and reflects in terms of polarity parameters (α and β values).
 | ||
Fig. 2 CO2 uptake kinetics in (a) [MEA·Cl][EDA]-, (b) [HMIM·Cl][EDA]-, (c) [MEA·Cl][AP]-, and (d) [HMIM·Cl][AP]-based DESs at 1:1 (■), 1:2 ( ), 1:3 ( ), 1:3 ( ) and 1:4 ( ) and 1:4 ( ) molar ratios. ) molar ratios. | ||
Compared to the [MEA·Cl][EDA]-based DESs, [HMIM·Cl][EDA]-class of DESs exhibited lower CO2 uptake during optimization from 1:1 to 1:4 with identical HBD component (Fig. 2(b)). The lower CO2 uptake in [HMIM·Cl][EDA] than [MEA·Cl][EDA] can be attributed to the strong H-bonding interactions between former than later. [HMIM·Cl] contains more acidic protons than [MEA·Cl] and therefore coordinates strongly with [EDA] at all mole ratios and brings early dissipation upon CO2 uptake. In [MEA·Cl][AP]-based DESs CO2 uptake was found to increase with the mole ratio of [AP] from 1:1 to 1:2 but decreased beyond 1:2 (Fig. 2(c)). Surprisingly, in case of the [HMIM·Cl][AP]-based DESs, a significant improvement in the CO2 uptake was observed upon increasing [AP] at all mole ratios (Fig. 2(d)). The lower bonding aptitude of [MEA·Cl] towards HBDs makes it efficient HBA than [HMIM·Cl] and [TBAB]. The higher CO2 uptake in [MEA·Cl][AP] = 1:1 than [HMIM·Cl][EDA] = 1:1 despite the lower basicity of [AP] than [EDA] also confirms the potential of [MEA·Cl] in CO2 absorption. Beyond 1:1, [HMIM·Cl][EDA] surpassed [MEA·Cl][AP] in CO2 uptake because of the increased basicity.
The TBAB-based DESs demonstrated a significant improvement in the CO2 uptake upon optimization (Fig. S2(a), ESI†). Surprisingly, the CO2 absorption kinetics in case of [TBAB][AMP], at a molar ratio of 1:3, was faster than that at 1:4 in the initial phase but improved later and went through a crossover point (Fig. S2(b), ESI†). This abnormal change in the behavior of [TBAB][AMP]-based DESs might be caused by the changes in viscosity. The CO2 uptake kinetics in DESs at 1:4 mole ratios are following the order:
| [MEA·Cl][EDA] > [HMIM·Cl][EDA] > [MEA·Cl][AP] > [HMIM·Cl][AP] > [TBAB][AP] > [TBAB][AMP] |
In-depth analysis of the CO2 uptake values in DESs in terms of the change in intermolecular interactions is presented by employing the ET(30) and Kamlet–Taft parameters (α, β and π*). For [MEA·Cl][EDA]-based DESs an inverse relation (r2 = 0.99325) between ET(30) values and CO2 wt% was obtained (Fig. 3(a)) suggesting involvement of non-polar interactions during CO2 capture. The polarity index value π*, which reflects the electrolytic strength of a medium, was found decreasing during optimization in [MEA·Cl][EDA] (Fig. 3(b)). The polarity (ET(30)) of a medium depends on the relative magnitude of α and β. In general, the polarity of a medium decreases with the increasing value of β over α and vice versa.41 During the optimization of the [MEA·Cl][EDA] system, β successively increases over α as shown in Fig. 3(c). A positive β–α values for [MEA·Cl][EDA]-based DESs at 1:2, 1:3 and 1:4 indicate basic nature of DESs. Thus, CO2 capture in [MEA·Cl][EDA]-based DESs is guided by the screened basicity.
 | ||
Fig. 3 Effect of polarity (a) (ET(30)) and (b) π* on CO2 uptake and variation of (c) α ( ) and β (■) upon optimization of [MEA·Cl][EDA]-based DESs. ) and β (■) upon optimization of [MEA·Cl][EDA]-based DESs. | ||
The [HMIM·Cl][EDA]-based DESs also exhibited the inverse relation between ET(30) and CO2 uptake during optimization. Unfortunately, the polarity of the [HMIM·Cl][EDA] could not be measured at 1:1 as the DES turned solid upon addition of the dye. During optimization in [HMIM·Cl][EDA], β was noted to guide the course of CO2 capture as suggested by the relative β–α values from 1:2 to 1:4. A decrease in the ET(30) value is, however, not supported by a decrease in the π* as was the case with other classes of DESs. The opposite trend observed for ET(30) and π* might arise from the higher electrolytic dissociation of [HMIM·Cl][EDA] upon increasing mole ratios of [EDA].
The [MEA·Cl][AP]-based DESs possessed higher ET(30) than [MEA·Cl][EDA]-class of DESs because of the acidic proton (–OH) of [AP]. In spite of low basicity (β), the [MEA·Cl][AP]-based DESs showed high CO2 uptake capacity which indicates that the system acidity (α) plays a crucial role in CO2 capture. In [AP], the –OH group at α-position to the –NH2 seems stabilizing CO2 at the carbamic acid state and, thus facilitate CO2 absorption in DESs. A pictorial representation of the involvement of intermolecular interactions in the CO2 uptake is shown as Scheme 2. Similar behavior was observed in ILs where an acidic group (–OH, –COOH) in the close vicinity of the amine is attributed for the multi-molar CO2 absorption.42 In case of [MEA·Cl][AP], a decreasing trend in π* upon optimization was similar as in case of ET(30).
 | ||
| Scheme 2 Pictorial representation of involvement of intermolecular interaction in CO2 capture. | ||
Unlike [MEA·Cl][AP]-class of DESs, [HMIM·Cl][AP]-based DESs possess lower CO2 uptake capacity further hinting to the stronger interaction in the [HMIM·Cl][AP]. The inferior CO2 uptake in [HMIM·Cl][AP] in comparison to [MEA·Cl][AP] arises due to the high β values for comparable α values. It seems that higher β values results in the closer vicinity of HBD to HBA and thus lower polarity and decelerate CO2 uptake. Similar conclusions were drawn by Welton et al. during the kinetic study of Diels–Alder reaction in ILs.43 All [TBAB][AP]- and [TBAB][AMP]-based DESs are prepared from aprotic HBA ([TBAB]) thus possess lower ET(30) and consequently showed moderate CO2 uptake. Small increase in the CO2 uptake during optimization of the [TBAB][AP]- and [TBAB][AMP]-based DESs is thus due to the acidic-stabilization of CO2 as proposed in case of [MEA·Cl][AP]. This notion is further supported by increasing α value upon optimization.
Based on the above correlation it can be inferred that the CO2 uptake in DESs does not solely depend on the basicity of the HBD component but principally on the strength of the intermolecular H-bonding interactions between the HBD and HBA components as suggested by the equilibrium between α and β values. Higher CO2 uptake in all classes of DESs is also favored by a drop in the viscosity (η) during optimization. At lower viscosity, the CO2 molecules diffuse faster in the DES continuum and therefore, improves the probability of chemisorption. It is noted that a large difference in the α and β values results in multi-center bonding and hence, result in high viscosity whereas small differences counter-act such interactions and result in lower viscosity and high CO2 absorption.
Effect of HBD on CO2 uptake
To investigate the role of HBD components on the CO2 uptake [EDA], [DETA], [TEPA] and [PEHA] were complexed with potential HBAs like, [MEA·Cl] and [HMIM·Cl] at 1:4. As shown in Fig. 4, CO2 uptake in both [MEA·Cl]- and [HMIM·Cl]-based DESs was noted to decrease with the increasing number of imine (–NH) groups in the HBD components. The comparison demonstrated that among both classes, [MEA·Cl][EDA] and [HMIM·Cl][EDA] were the most efficient DES while [MEA·Cl][PEHA] and [HMIM·Cl][PEHA] had the lowest capacity in terms of the CO2 capture, despite the higher basicity of [PEHA] (β = 1.027) than [EDA] (β = 0.857). The drop in the CO2 uptake capacity of [PEHA]-containing DESs than [EDA]-based DESs might arise due to the higher viscosity of former than later. The high viscosity retards the diffusion of CO2 molecules towards the active sites and, consequently, impede the rapid CO2 uptake (Fig. S3, ESI†).
 | ||
Fig. 4 CO2 absorption kinetics in (a) [MEA·Cl]- and (b) [HMIM·Cl]-based DESs with hydrogen bond donor EDA (■), DETA ( ), TEPA ( ), TEPA ( ) and PEHA ( ) and PEHA ( ) at 1:4 mole ratio. ) at 1:4 mole ratio. | ||
Effect of HBA on CO2 capture
Similar to HBDs, the acidity of the HBA components also affects the CO2 uptake significantly. It is evident from Fig. 5 that [MEA·Cl] and [HMIM·Cl] impose strong control over the CO2 uptake process when complexed with [TEPA] and [PEHA] whereas, a small difference was observed with [EDA], [DETA] and [AP], at 1:4 mole ratio. However, in all cases [MEA·Cl]-based DESs showed higher potential in CO2 capture than the [HMIM·Cl]-based DESs. The higher aptitude of [MEA·Cl]-based DESs can be accounted to the nature of chemical environment which in turn depend on α–β values. The relative α–β difference is comparatively lower for [MEA·Cl]-based DESs than [HMIM·Cl]-class of DESs. Similar conclusions were drawn by Sharmad et al. and Yuan et al. during CO2 absorption in DESs and in aqueous piperazine/2-methylpiperazine, respectively.44,45 In general, if α has an edge over β, it gives acidic or polar characteristic to the active site, whereas in reverse scenario a stable chemical environment is formed for the CO2 capture due to the abundance of the apolar sites in the medium. Therefore, smaller differences in the α–β value indicate the prevalence of stable interacting sites in DES for CO2 stabilization. This view is further supported by the viscosity data as [MEA·Cl]-based DESs have higher CO2 uptake than [HMIM·Cl]-class of DESs despite their higher viscosities. Thus, the most proficient DES possess nearly similar α and β values. The equilibration between donor and acceptor sites lowers polarity and thereby increase non-directional forces in the CO2 capture.
 | ||
Fig. 5 CO2 absorption kinetics in [MEA·Cl]- ( ) and [HMIM·Cl]-based (■) DESs with (a) EDA, (b) AP (c) DETA, (d) TEPA and (e) PEHA at 1:4 mole ratio. ) and [HMIM·Cl]-based (■) DESs with (a) EDA, (b) AP (c) DETA, (d) TEPA and (e) PEHA at 1:4 mole ratio. | ||
Speciation of absorbed CO2 in DESs
CO2 absorption in different DESs was also monitored by recording the FT-IR and 1H- and 13C-NMR spectra before and after the experiments. FTIR spectra of DESs showed a broad peak at ∼2900 cm−1 due to N–H-mediated H-bonding (Fig. S4, ESI†). The presence of carbamate species was revealed by the absorption bands at ∼1559, 1293 and 851 cm−1, respectively, owing to the asymmetric, symmetric and bending vibrations. In [AP]-based DESs, the additional absorption band at ∼1350–1500 cm−1 indicates the presence of HCO3−/CO32−. The enhanced peaks at ∼1098 and 1190 cm−1 correspond to the stretching modes of C–N and C–O groups, respectively, and fortify CO2 absorption.CO2 uptake in solvent results in carbamate (NH2COO−), carbonate (CO32−) and bicarbonate (HCO3−) depending on the strength of basicity and acidity. Under the acidic condition, NH2COO− hydrolyzes to CO32−/HCO3−.46,47 The 1H NMR spectrum of CO2 treated DESs show carbamate peak at 3.13 ppm, along with the downfield shifting of other peaks due to the conversion of –NH2 to –NH (Fig. 6). On 13C NMR scale, NH2COO− appears at >164 ppm whereas CO32−/HCO3− resonate below 162 ppm as exhibited in Fig. 7. The fast equilibration of a proton between HCO3− and CO32− results in a single peak in 13C NMR whose chemical shifts depend on the relative concentration of the carbonate and bicarbonate species.
 | ||
| Fig. 6
1H NMR spectra of [HMIM·Cl][EDA] at 1:4 before (lower) and after (upper) CO2 uptake. | ||
 | ||
| Fig. 7
13C NMR spectra of [HMIM·Cl][EDA] (lower) and [HMIM·Cl][AP] (upper) at 1:4 after CO2 uptake. | ||
The 13C NMR spectrum of different CO2-absorbed DESs revealed the presence of NH2COO− and CO32−/HCO3−. Both [MEA·Cl][EDA]- and [HMIM·Cl][EDA]-based DESs showed only NH2COO− signal upon CO2 bubbling (Fig. S5, ESI†) because of high β which grows further upon optimization (Table 3). In [MEA·Cl][AP]- and [HMIM·Cl][AP]-classes of DESs, CO32−/HCO3− peak appeared at ∼160–161 ppm upon CO2 capture but with a different pattern of intensity change during optimization. For [MEA·Cl][AP]-class of DESs, CO32−/HCO3− peak was noticed only at 1:1 and 1:2, whereas, in [HMIM·Cl][AP]-based DESs, CO32−/HCO3− peak appeared at all mole ratios (1:1 to 1:4) as shown in Fig. 8. This unusual behavior of [MEA·Cl][AP]-class of DESs might arise because of the strong hydrogen bonding interaction between Cl− and –OH group in [AP] which strengthen upon optimization.
 | ||
Fig. 8
13C NMR spectrum of (a) [MEA·Cl][AP]- and [HMIM·Cl][AP]-based DESs at 1:1 ( ), 1:2 ( ), 1:2 ( ), 1:3 ( ), 1:3 ( ) and 1:4 ( ) and 1:4 ( ) mole ratios. ) mole ratios. | ||
In [HMIM·Cl][AP], Cl− is weakly coordinated with –OH because of the strong interaction with acidic hydrogens on [HMIM]+ cation. Further addition of [AP] acts as a “dilutant” for the interacting components [HMIM·Cl] and [AP] and therefore [AP] becomes more available in the super-crystalline lattice of DESs during optimization. This enables the –OH group of [AP] to participate in the hydrolysis of NH2COO− to CO32−/HCO3− upon optimization. The distribution of different carbon species in [HMIM·Cl][AP]-based DESs and their dependence on polarity are shown in Fig. 9(a). The speciation outcome of CO2 in different DESs are enlisted in Table 4.
 | ||
Fig. 9 (a) Speciation profiles of carbamate ( ), bicarbonate (●) and carbonate (▲) vs. ET(30) in HMIM·Cl AP (1:4) and (b) molar CO2 uptake in a typical DES at 1:4 mole ratio. ), bicarbonate (●) and carbonate (▲) vs. ET(30) in HMIM·Cl AP (1:4) and (b) molar CO2 uptake in a typical DES at 1:4 mole ratio. | ||
| DESs | Mol% carbamatea | Mol% bicarbonatea | Mol% carbonatea |
|---|---|---|---|
| a Error associated with mol% of different species are ≤± 0.003. | |||
| [HMIM·Cl][AP] (1:1) |
46.2 | 50.8 | 3.0 |
| [HMIM·Cl][AP] (1:2) |
64.7 | 31 | 4.3 |
| [HMIM·Cl][AP] (1:3) |
74.4 | 22.2 | 3.4 |
| [HMIM·Cl][AP] (1:4) |
76.9 | 20.1 | 3.0 |
| [MEA·Cl][AP] (1:1) |
75.8 | 20.2 | 4.0 |
| [MEA·Cl][AP] (1:2) |
78.9 | 16.9 | 4.2 |
| [TBAB][AP] (1:3) |
66.9 | 27.6 | 5.5 |
| [TBAB][AP] (1:4) |
72.7 | 23.6 | 3.7 |
[TBAB][AP]-based DESs forms carbamate, carbonate, and bicarbonate during CO2 uptake at 1:3 and 1:4 mole ratios as shown in their 13C NMR spectra (Fig. S6, ESI†) whereas, [TBAB][AMP]-class of DESs form only carbamate upon CO2 bubbling as indicated by their corresponding 13C NMR spectra (Fig. S7, ESI†).
The molar uptake plot (Fig. 9(b)) suggest semimolar mechanism, where two moles of DES interacts one mole of CO2 (2:1), was operative in all DESs as shown in Table 3. The semimolar CO2 uptake in DESs can be explained by the steps shown in Scheme 3.
 | ||
| Scheme 3 A suggested mechanism of CO2 capture in DES based on molar uptake plot. | ||
Effect of water
With the aim of simulating CO2 uptake under more realistic conditions, uptake kinetics was measured by mixing water in DESs at 1:4. The inferior uptake kinetics was noted with the increasing wt% of water in DES. These observations are in contradiction to the previous reports where improved CO2 uptake is reported due to the reduced intermolecular interactions in the presence of water.32 In contrast to the 39 wt% of CO2 by pure [MEA·Cl][EDA] at 1:4, 35.7 wt%, 35 wt% and 34.4 wt% of CO2 was obtained in [MEA·Cl][EDA] at 1:4 containing 10%, 20% and 30% of water, respectively (Fig. 10(a)). This deterioration in CO2 uptake entails that water competes with CO2 molecule for the active sites in DES. This contest increases with wt% of water and lowers CO2 uptake of aqueous DES. Goodrich et al. presented similar views during CO2 capture in an aqueous system.48 To comprehend the dependence of CO2 uptake on wt% of H2O in DESs more clearly, we measured the polarity parameters and viscosity for [MEA·Cl][EDA] at 1:4 with 10, 20 and 30 wt% of H2O and tabulated the results in Table 5. Addition of 10 wt% water in [MEA·Cl][EDA] at 1:4 (α = 0.573 and β = 0.857) causes an increase in α to 0.632 while β decreases to 0.815. Similarly, the addition of 20 wt% and 30 wt% water in DES further results in lower β values whereas α increase. The parallelism between CO2 wt% and β in aqueous [MEA·Cl][EDA] at 1:4 thus overrules control of viscosity on CO2 uptake during dilution. The decrease in viscosity of aqueous DES should facilitate the CO2 uptake due to the ease of diffusion; however, the inferior CO2 kinetics observed upon dilution confirms the importance of β in terms of CO2 capture in aqueous systems.
 | ||
Fig. 10 (a) CO2 absorption kinetics in [MEA·Cl][EDA] at 1:4 + 10 wt% (■), 20 wt% ( ) and 30 wt% ( ) and 30 wt% ( ) water and (b) consecutive absorption–desorption cycles of 30 wt% [MEA·Cl][EDA] (1:4) in ethylene glycol. The absorption and desorption experiments were performed at room temperature and 70 °C, respectively. ) water and (b) consecutive absorption–desorption cycles of 30 wt% [MEA·Cl][EDA] (1:4) in ethylene glycol. The absorption and desorption experiments were performed at room temperature and 70 °C, respectively. | ||
:4
| Aqueous DESs | E T(30)a/kcal mol−1 | π* | α | β | η /cP | wt% CO2 |
|---|---|---|---|---|---|---|
| a Polarity and viscosity values are reproducible within ±0.004 and ±0.003, respectively. | ||||||
| 10 wt% H2O + [MEA·Cl][EDA] (1:4) |
54.0 | 1.17 | 0.632 | 0.815 | 12.2 | 35.7 |
| 20 wt% H2O + [MEA·Cl][EDA] (1:4) |
55.4 | 1.22 | 0.688 | 0.731 | 9.6 | 35.0 |
| 30 wt% H2O + [MEA·Cl][EDA] (1:4) |
57.4 | 1.27 | 0.781 | 0.578 | 8.3 | 34.4 |
Recyclability experiment
The feasibility of recycling DESs was monitored by performing the sequential absorption–desorption cycles with [MEA·Cl][EDA] at 1:4 (Fig. 10(b)). A 30 wt% of ethylene glycol in [MEA·Cl][EDA] is taken as a reference solution for recyclability test and the cut-off limit was set around 18 wt%. CO2 desorption in each step was achieved by heating the solution at 70 °C for 2 h under inert environment until complete desorption.49,50 Contrary to the report where loss in mass of task-specific DES was noted, the initial mass of solvent was preserved after each desorption cycle in our study.30 The stability of the [MEA·Cl][EDA] post consecutive absorption–desorption cycles was verified by 13C NMR analysis (Fig. S8, ESI†). The recycling experiments are consistent with the other studies performed with ILs and DESs.51
Conclusions
In conclusion, CO2 uptake in potential DESs is observed to depend on the nature of HBD substituents and their mole ratio relative to the HBA. Both these changes reduce polarity and thereby affect the strength of intermolecular interactions and consequently regulate CO2 uptake. In the light of Kamlet–Taft parameters, it is observed that the CO2 uptake capacity of DESs does not depend solely on the basicity of the HBD but is rather controlled by the strength of the intermolecular interactions between the components. The strong H-bonds in DESs result in high viscosity because of the large difference between α and β value of constituents. In the most effective DESs, HBA and HBD were found least associated by the H-bonding as suggested by the equilibrating α and β values. The dominating role of HBAs in CO2 capture comes into play only with strongly basic HBDs such as, [TEPA] and [PEHA]. The speciation of absorbed CO2 into the carbamate, carbonate, and bicarbonate was observed only in [AP]- and [AMP]-based DESs and it favored in DES with α value. Rest other DESs absorbed CO2 as carbamate following semi-molar mechanism as suggested by their 13C NMR spectra. Addition of water decelerate CO2 uptake in DESs due to the increasing α and decreasing β. These observations are expected to open discussion about the enriched chemistry involved in establishing DESs as a strong and viable candidates for the CO2 capture.Conflicts of interest
There are no conflicts to declare.Acknowledgements
SKS is thankful to Dr Ajaikumar Samikannu for assisting in the instrumentation during CO2 measurement. We are thankful to the Wallenberg Wood Science Center (WWSC), Kempe Foundations, and Bio4energy programme. This work is also part of the activities of the Johan Gadolin Process Chemistry Centre at Åbo Akademi University.References
- G. T. Rochelle, Science, 2009, 325, 1652–1654 CrossRef PubMed.
- J. D. Figueroa, T. Fout, S. Plasynski, H. McIlvried and R. D. Srivastava, Int. J. Greenhouse Gas Control, 2008, 2, 9–20 CrossRef.
- C.-H. Yu, C.-H. Huang and C.-S. Tan, Aerosol Air Qual. Res., 2012, 12, 745–769 CrossRef.
- B. Thitakamol, A. Veawab and A. Aroonwilas, Int. J. Greenhouse Gas Control, 2007, 1, 318–342 CrossRef.
- R. Shao and A. Stangeland, Amines Used in CO2 Capture – Health and Environmental Impacts, The Bellona Foundation, Oslo, Norway, 2009 Search PubMed.
- S. Zeng, X. Zhang, L. Bai, X. Zhang, H. Wang, J. Wang, D. Bao, M. Li, X. Liu and S. Zhang, Chem. Rev., 2017, 117, 9625–9673 CrossRef PubMed.
- L. A. Blanchard, D. Hancu, E. J. Beckman and J. F. Brennecke, Nature, 1999, 399, 28–29 CrossRef.
- I. Niedermaier, M. Bahlmann, C. Papp, C. Kolbeck, W. Wei, S. K. Calderon, M. Grabau, P. S. Schulz, P. Wasserscheid, H. P. Steinruck and F. Maier, J. Am. Chem. Soc., 2014, 136, 436–441 CrossRef PubMed.
- B. F. Goodrich, J. C. de la Fuente, B. E. Gurkan, D. J. Zadigian, E. A. Price, Y. Huang and J. F. Brennecke, Ind. Eng. Chem. Res., 2011, 50, 111–118 CrossRef.
- B. E. Gurkan, J. C. de la Fuente, E. M. Mindrup, L. E. Ficke, B. F. Goodrich, E. A. Price, W. F. Schneider and J. F. Brennecke, J. Am. Chem. Soc., 2010, 132, 2116–2117 CrossRef PubMed.
- Y. Q. Zhang, S. J. Zhang, X. M. Lu, Q. Zhou, W. Fan and X. P. Zhang, Chem. – Eur. J., 2009, 15, 3003–3011 CrossRef PubMed.
- C. M. Wang, X. Y. Luo, H. M. Luo, D. E. Jiang, H. R. Li and S. Dai, Angew. Chem., Int. Ed., 2011, 50, 4918–4922 CrossRef PubMed.
- C. M. Wang, H. M. Luo, D. E. Jiang, H. R. Li and S. Dai, Angew. Chem., Int. Ed., 2010, 49, 5978–5981 CrossRef PubMed.
- C. M. Wang, H. M. Luo, X. Y. Luo, H. R. Li and S. Dai, Green Chem., 2010, 12, 2019–2023 RSC.
- X. Y. Luo, Y. Guo, F. Ding, H. Q. Zhao, G. K. Cui, H. R. Li and C. M. Wang, Angew. Chem., Int. Ed., 2014, 53, 7053–7057 CrossRef PubMed.
- E. D. Bates, R. D. Mayton, I. Ntai and J. H. Davis, J. Am. Chem. Soc., 2002, 124, 926–927 CrossRef PubMed.
- S. Saravanamurugan, A. J. Kunov-Kruse, R. Fehrmann and A. Riisager, ChemSusChem, 2014, 7, 897–902 CrossRef PubMed.
- J. Z. Zhang, C. Jia, H. F. Dong, J. Q. Wang, X. P. Zhang and S. J. Zhang, Ind. Eng. Chem. Res., 2013, 52, 5835–5841 CrossRef.
- X. M. Liu, G. H. Zhou, S. J. Zhang and X. Q. Yao, Fluid Phase Equilib., 2009, 284, 44–49 CrossRef.
- B. Gurkan, B. F. Goodrich, E. M. Mindrup, L. E. Ficke, M. Massel, S. Seo, T. P. Senftle, H. Wu, M. F. Glaser, J. K. Shah, E. J. Maginn, J. F. Brennecke and W. F. Schneider, J. Phys. Chem. Lett., 2010, 1, 3494–3499 CrossRef.
- A. P. Abbott, G. Capper, D. L. Davies, H. L. Munro, R. K. Rasheed and V. Tambyrajah, Chem. Commun., 2001, 2010–2011 RSC.
- A. P. Abbott, D. Boothby, G. Capper, D. L. Davies and R. K. Rasheed, J. Am. Chem. Soc., 2004, 126, 9142–9147 CrossRef PubMed.
- D. Carriazo, M. C. Serrano, M. C. Gutierrez, M. L. Ferrer and F. del Monte, Chem. Soc. Rev., 2012, 41, 4996–5014 RSC.
- Q. H. Zhang, K. D. Vigier, S. Royer and F. Jerome, Chem. Soc. Rev., 2012, 41, 7108–7146 RSC.
- A. Zhu, T. Jiang, B. Han, J. Zhang, Y. Xie and X. Ma, Green Chem., 2007, 9, 169–172 RSC.
- X. Li, M. Hou, B. Han, X. Wang and L. Zou, J. Chem. Eng. Data, 2008, 53, 548–550 CrossRef.
- R. B. Leron, A. Caparanga and M. H. Li, J. Taiwan Inst. Chem. Eng., 2013, 44, 879–885 CrossRef.
- R. B. Leron and M. H. Li, Thermochim. Acta, 2013, 551, 14–19 CrossRef.
- M. Francisco, A. van den Bruinhorst, L. F. Zubeir, C. J. Peters and M. C. Kroon, Fluid Phase Equilib., 2013, 340, 77–84 CrossRef.
- L. L. Sze, S. Pandey, S. Ravula, S. Pandey, H. Zhao, G. A. Baker and S. N. Baker, ACS Sustainable Chem. Eng., 2014, 2, 2117–2123 CrossRef.
- N. R. Mirza, N. J. Nicholas, Y. W. Kathryn, K. A. Mumford, S. E. Kentish and G. W. Stevens, J. Chem. Eng. Data, 2015, 60, 3246–3252 CrossRef.
- T. J. Trivedi, J. H. Lee, H. J. Lee, Y. K. Jeong and J. W. Choi, Green Chem., 2016, 18, 2834–2842 RSC.
- C. Reichardt, Chem. Rev., 1994, 94, 2319–2358 CrossRef.
- M. J. Kamlet, J. L. Abboud and R. W. Taft, J. Am. Chem. Soc., 1977, 99, 6027–6038 CrossRef.
- M. J. Kamlet and R. W. Taft, J. Am. Chem. Soc., 1976, 98, 377–383 CrossRef.
- R. W. Taft and M. J. Kamlet, J. Am. Chem. Soc., 1976, 98, 2886–2894 CrossRef.
- L. Crowhurst, P. R. Mawdsley, J. M. Perez-Arlandis, P. A. Salter and T. Welton, Phys. Chem. Chem. Phys., 2003, 5, 2790–2794 RSC.
- S. K. Shukla and A. Kumar, J. Phys. Chem. B, 2015, 119, 5537–5545 CrossRef PubMed.
- C. Liu, L. Ma, F. Sha, X. Qiao and J. Zhang, J. Mol. Liq., 2017, 232, 130–138 CrossRef.
- F. Mani, M. Peruzzini and P. Stoppioni, Green Chem., 2006, 8, 995–1000 RSC.
- S. K. Shukla and A. Kumar, Phys. Chem. Chem. Phys., 2012, 14, 2754–2761 RSC.
- F.-F. Chen, K. Huang, Y. Zhou, Z.-Q. Tian, X. Zhu, D.-J. Tao, D. Jiang and S. Dai, Angew. Chem., Int. Ed., 2016, 55, 7166–7170 CrossRef PubMed.
- A. Aggarwal, N. L. Lancaster, A. R. Sethi and T. Welton, Green Chem., 2002, 4, 517–520 RSC.
- S. Sarmad, Y. Xie, J.-P. Mikkola and X. Jia, New J. Chem., 2017, 41, 290–301 RSC.
- Y. Yuan, B. Sherman and G. T. Rochelle, Energy Procedia, 2017, 114, 2103–2120 CrossRef.
- J. Kothandaraman, A. Goeppert, M. Czaun, G. A. Olah and G. K. Surya Prakash, Green Chem., 2016, 18, 5831–5838 RSC.
- Y. Matsuzaki, H. Yamada, F. A. Chowdhury, T. Higashii, S. Kazama and M. Onoda, Energy Procedia, 2013, 37, 400–406 CrossRef.
- B. F. Goodrich, J. C. de la Fuente, B. E. Gurkan, Z. K. Lopez, E. A. Price, Y. Huang and J. F. Brennecke, J. Phys. Chem. B, 2011, 115, 9140–9150 CrossRef PubMed.
- F. Barzagli, M. Di Vaira, F. Mani and M. Peruzzini, ChemSusChem, 2012, 5, 1724–1731 CrossRef PubMed.
- F. Barzagli, S. Lai, F. Mani and P. Stoppioni, Energy Fuels, 2014, 63, 1795–1804 Search PubMed.
- X. Y. Luo, Y. Guo, F. Ding, H. Q. Zhao, G. K. Cui, H. R. Li and C. M. Wang, Angew. Chem., Int. Ed., 2014, 53, 7053–7057 CrossRef PubMed.
Footnote |
| † Electronic supplementary information (ESI) available. See DOI: 10.1039/c8cp03724h |
| This journal is © the Owner Societies 2018 |