
 Open Access Article
 This Open Access Article is licensed under a
 Creative Commons Attribution 3.0 Unported Licence
Ab initio molecular dynamics of atomic-scale surface reactions: insights into metal organic chemical vapor deposition of AlN on graphene
D. G.
Sangiovanni
 *ab,
G. K.
Gueorguiev
b and
A.
Kakanakova-Georgieva
b
*ab,
G. K.
Gueorguiev
b and
A.
Kakanakova-Georgieva
b
aAtomistic Modelling and Simulation ICAMS, Ruhr-Universität Bochum, 44780 Bochum, Germany. E-mail: davide.sangiovanni@rub.de
bDepartment of Physics, Chemistry and Biology (IFM), Linköping University, SE 581 83 Linköping, Sweden. E-mail: davide.sangiovanni@liu.se
First published on 12th June 2018
Abstract
Metal organic chemical vapor deposition (MOCVD) of group III nitrides on graphene heterostructures offers new opportunities for the development of flexible optoelectronic devices and for the stabilization of conceptually-new two-dimensional materials. However, the MOCVD of group III nitrides is regulated by an intricate interplay of gas-phase and surface reactions that are beyond the resolution of experimental techniques. We use density-functional ab initio molecular dynamics (AIMD) with van der Waals corrections to identify atomistic pathways and associated electronic mechanisms driving precursor/surface reactions during metal organic vapor phase epitaxy at elevated temperatures of aluminum nitride on graphene, considered here as model case study. The results presented provide plausible interpretations of atomistic and electronic processes responsible for delivery of Al, C adatoms, and C–Al, CHx, AlNH2 admolecules on pristine graphene via precursor/surface reactions. In addition, the simulations reveal C adatom permeation across defect-free graphene, as well as exchange of C monomers with graphene carbon atoms, for which we obtain rates of ∼0.3 THz at typical experimental temperatures (1500 K), and extract activation energies Eexca = 0.28 ± 0.13 eV and attempt frequencies Aexc = 2.1 (×1.7±1) THz via Arrhenius linear regression. The results demonstrate that AIMD simulations enable understanding complex precursor/surface reaction mechanisms, and thus propose AIMD to become an indispensable routine prediction-tool toward more effective exploitation of chemical precursors and better control of MOCVD processes during synthesis of functional materials.
Introduction
Metal organic chemical vapor deposition (MOCVD) is acknowledged as the prime rational and scalable deposition process for obtaining (ultra)thin films and heterostructures of semiconductor materials applied in main areas of established and emerging new technologies. MOCVD of heterostructures of group III nitrides (AlN, GaN, InN) with graphene offers new opportunities for the development of flexible optoelectronics (e.g. InGaN/GaN/graphene, ref. 1) and for the stabilization of conceptually-novel group III nitrides (see, e.g., synthesis of two-dimensional GaN via graphene encapsulation2). Recent ab initio investigations, motivated by the perspectives for high-impact applications such as room-temperature spintronics at the nanoscale,3 reported on the structural, vibrational, and electronic properties of single and few-layer graphitic-like AlN,4 including in heterostructures with graphene.5 The MOCVD of AlN on epitaxial graphene has also been attempted.6MOCVD processes are regulated by a complex interplay between precursor/precursor and precursor/surface reaction thermodynamics and kinetics.7 In this respect, the MOCVD of AlN represents the most challenging case among group III nitrides (including BN)8 and group III–V semiconductor materials (e.g., AlGaInAsP, see ref. 9) in general. MOCVD of high-quality AlN films requires elevated process temperatures, ∼1500–1700 K,10 considering the high Al–N bond energy of 66 kcal mol−1 (compared to, e.g., the Ga–N bond strength, 45 kcal mol−1)11 and the need for sufficiently rapid surface diffusion.12,13 The MOCVD of AlN is further complicated by the fact that typical precursors – trimethylaluminum, (CH3)3Al, and ammonia, NH3 – form highly-reactive (CH3)3Al:NH3 adducts, subsequently triggering intricate precursor/precursor and precursor/surface reactions.14
Atomistic reaction pathways are not readily determinable via MOCVD experiments.7 However, ab initio calculations have substantially contributed to the understanding of MOCVD processes8,9,14 by predicting the energetics of gas and surface reactions at 0 Kelvin.15–18 The effects of pressure and temperature on reaction rates can be estimated via thermodynamic and kinetic models19 or, whenever possible, combining ab initio calculations with classical molecular dynamics (CMD) based on empirical potentials.20,21 Nevertheless, static 0 K ab initio techniques such as density functional theory (DFT), or even more accurate first-principles electronic-structure-based methods,22,23 are inherently unable to resolve the intricate molecule/surface dynamics, especially when several degrees of freedom are involved. On another hand, efficient deterministic CMD simulations present disadvantages such as questionable reliability/transferability and require fitting a large set of potential-parameters for describing the large variety of atomic interactions.
Density-functional ab initio molecular dynamics (AIMD)24 yields reliable descriptions of the time-evolution of solid-state systems directly embedded in realistic environmental conditions.25,26 AIMD simulations often reveal non-intuitive reaction pathways27,28 and system configurations29 while providing corresponding kinetic rates at finite temperatures. Despite its known limitations for treating electron transfer during chemical reactions and/or the energetics of transition states for molecule splitting,30 AIMD is an excellent tradeoff between accuracy + reliability vs. computational cost for identifying chemical reaction pathways and estimating the relative occurrence of competing reactions. To this point, AIMD has been proven useful computational tool for investigating reactions of graphene with different functional groups including N-containing amino radicals.26
The purpose of this work is to identify reaction pathways relevant for MOCVD processes of AlN on graphene and interpret the reactions on the base of associated variations in electron densities. AlN on graphene serves as a model to rationalize atomistic and electronic mechanisms of importance to deposition of group III nitrides on graphene, in general. Our results demonstrate the great potential of AIMD simulations for revealing precursor/surface dynamics and for guiding experiments toward the realization of prototype group III nitrides heterostructures with graphene, already attempted by MOCVD.1,2
Results and discussion
The MOCVD of AlN implements trimethylaluminum, (CH3)3Al, and ammonia, NH3, as typical group III and group V precursors, respectively. It is known that a chain of gas-phase chemical reactions is opened by an easy dimerization of the adduct-derived species (CH3)2AlNH2 following the rapid methane (CH4) elimination from the adduct (CH3)3Al:NH3.14 AIMD simulations were carried out to reveal how each of the individual precursors – ammonia NH3, and trimethylaluminum (CH3)3Al – and the adduct-derived species (CH3)2AlNH2 with direct Al–N bonding, evolve/react with a graphene sheet. The interaction of each precursor with graphene is treated in separate sets of simulations. In order to observe different relevant and possibly competing reaction mechanisms, we also carry out two, or more, separate and independent AIMD runs for each of the investigated precursor/graphene reactions. The description of AIMD results is focused on reactions which we retain of primary relevance for understanding MOCVD of AlN on graphene. The equations describing chemical reactions are based on our empirical interpretation of events observed in AIMD videos and schematically represented in the way we believe these to be more likely to occur. Duration of precursor/graphene physisorption events and frequency of precursor/graphene collisions prior to molecule transformations allow for qualitatively comparing the reactivity of different precursors with the graphene sheet.Electron transfer maps are used to identify the variations in charge distribution associated with molecule/molecule and molecule/surface interactions, or any reaction of interest. These are calculated by subtracting the DFT self-consistent electron densities of individual molecules and/or the graphene sheet (by using the atomic positions generated during AIMD) from the DFT self-consistent charge density of the entire system.
Simulations of trimethylaluminum (CH3)3Al with graphene
![[double bond, length as m-dash]](https://www.rsc.org/images/entities/b_char_e001.gif) CH2 dissociation on graphene.
In this case, the system comprised by the (CH3)3Al molecule and the graphene sheet evolves by sequential collisions of the molecule with the carbon layer. In most cases, a collision leads to temporary physisorption timeframes (of duration ranging between ∼2 and ∼6 ps) with the (CH3)3Al molecule rolling and translating on the graphene surface. The fifth molecule/surface collision, at a simulation-time (tsim) of approximately 29 ps, excites scissoring/bending vibrational modes of Al–methyl intramolecular bonds. This assists proton transfer from one methyl group to the other [Fig. 1(a and b)] and leads to methane elimination from the trimethylaluminum (CH3)3Al molecule (eqn (1) and Fig. 1c). The products of this reaction is a methane molecule and a CH3–Al
CH2 dissociation on graphene.
In this case, the system comprised by the (CH3)3Al molecule and the graphene sheet evolves by sequential collisions of the molecule with the carbon layer. In most cases, a collision leads to temporary physisorption timeframes (of duration ranging between ∼2 and ∼6 ps) with the (CH3)3Al molecule rolling and translating on the graphene surface. The fifth molecule/surface collision, at a simulation-time (tsim) of approximately 29 ps, excites scissoring/bending vibrational modes of Al–methyl intramolecular bonds. This assists proton transfer from one methyl group to the other [Fig. 1(a and b)] and leads to methane elimination from the trimethylaluminum (CH3)3Al molecule (eqn (1) and Fig. 1c). The products of this reaction is a methane molecule and a CH3–Al![[double bond, length as m-dash]](https://www.rsc.org/images/entities/char_e001.gif) CH2 molecule:
CH2 molecule: | (1) |
 | ||
| Fig. 1 Trimethylaluminum/graphene reactions as observed in AIMD simulations. (a and b) Views from different perspectives of proton transfer between methyl groups in trimethylaluminum. (c) Methane elimination from the trimethylaluminum molecule. | ||
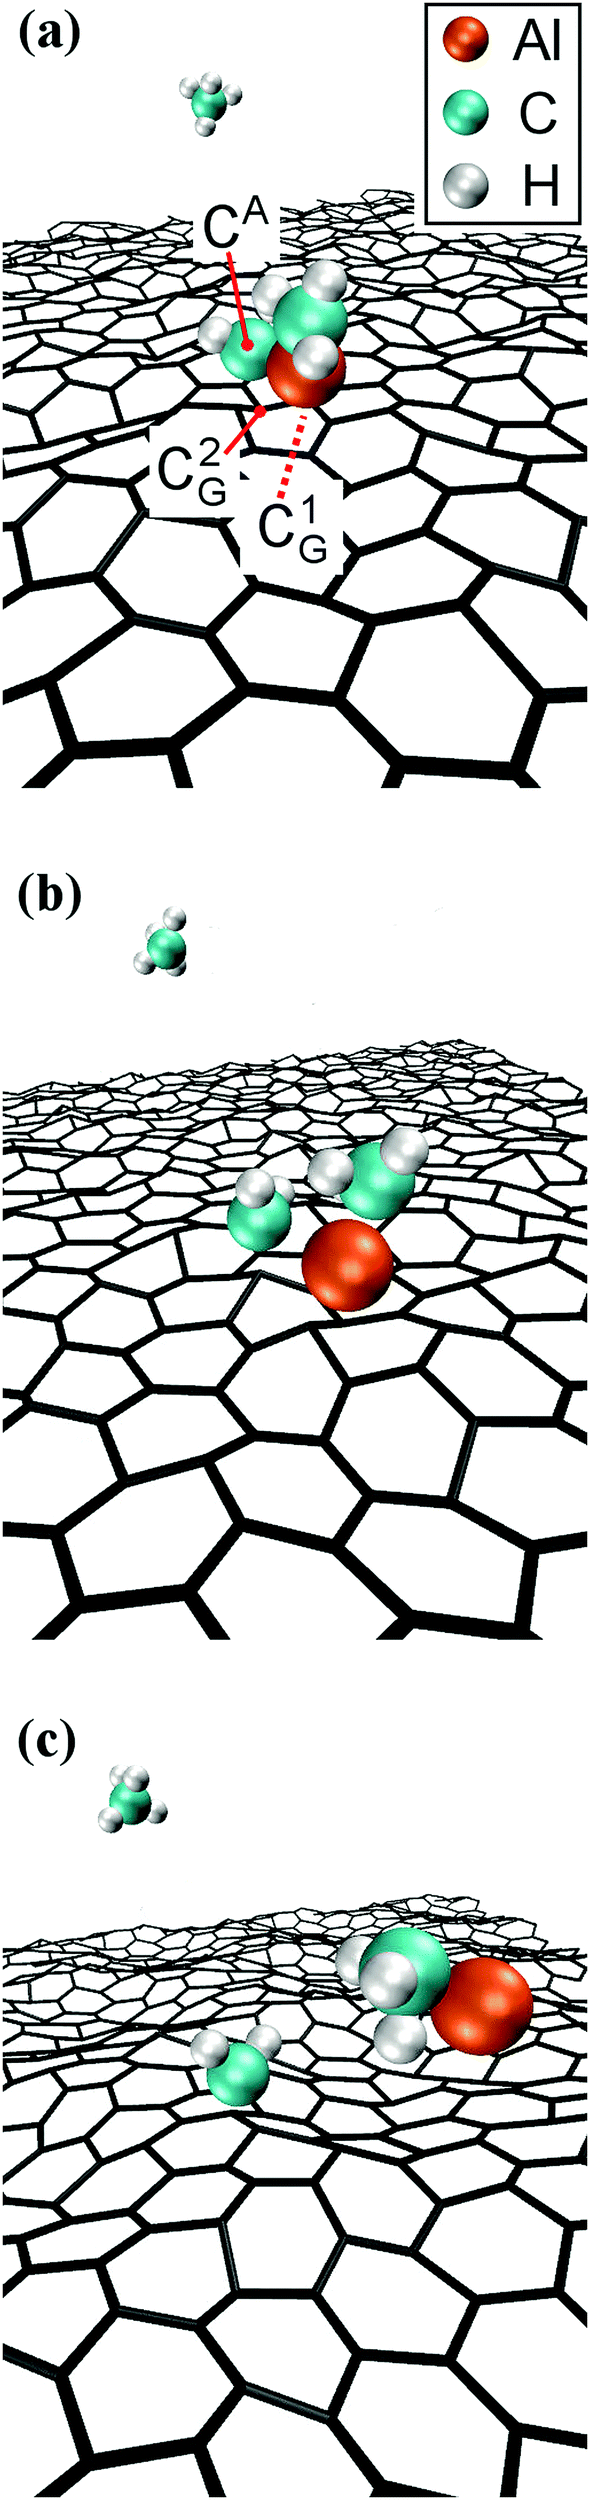
The formation of a CH3–AlCH2 molecule is followed by a rapid sequence of reactions. At tsim = 37 ps, the CH3–AlCH2 molecule collides for the sixth time with, and adsorbs onto, the graphene sheet by its Al-atom side (Fig. 2a). This can be explained by the fact that Al has an empty orbital of sp2-character (eqn (1)), which acts as electron acceptor from the π-cloud overlying the graphene sheet. The effect is evidenced by the electron accumulation generated between the Al atom with the two closest graphene C atoms (see electron-transfer density cut on the C1G–Al–C2G plane in Fig. 2b).
 | ||
| Fig. 2 CH3–Al–ĊH2 adsorption on graphene. (a) AIMD snapshot of the reaction. (b and c) Plots of DFT electron-density transfer during molecule/surface reactions, with color-scale expressed in e− Å−3. The electron-density variation along the color grid is described by a polynomial of third order, with negative (red/yellow) values that indicate electron depletion and positive (blue) values that indicate electron accumulation. White colors indicate vanishingly small electron transfer. C1,2G and CA,B label graphene and gas-molecule carbon atoms, respectively. The bond lengths in (c) are: Al–C1G = 2.07 Å, Al–C2G = 2.2 Å, Al–CA = 2.25 Å, Al–CB = 1.92 Å, and CA–CB = 3.21 Å. The atomic positions in (a) are a few fs antecedent to the atomic positions used for charge density plots. | ||
Remarkably, attachment to the graphene sheet rapidly leads to CH3–AlCH2 dissociation (at tsim = 39 ps) caused by an electrostatic repulsion between the graphene π-cloud and the electrons of intramolecular Al–methyl bonds (Fig. 2c). This repulsion induces CH3–AlCH2 bending, which brings the C atoms of the CH3 and CH2 groups closer to each other (see Fig. 3a and electron accumulation between CA and CB atoms in Fig. 3b). The subsequent rapid formation of a dehydrogenated ethane molecule CH3–ĊH2 leaves an Al adatom (Alad) on graphene (Fig. 3c).31 Finally, at tsim = 42 ps, Alad/CH3–ĊH2 recombination is observed. The delivering of Alad onto graphene is an insightful outcome of the first trimethylaluminum (CH3)3Al/graphene simulation run:
 | (2) |
 | ||
| Fig. 3 Attachment of an Al adatom on graphene consequent to CH3–Al–ĊH2 radical dissociation. (a and c) AIMD snapshots of the reaction. (b) Plot of electron density transfer with positions equivalent to (a). The color-scale is expressed in e− Å−3. | ||
It is noteworthy that this simulation run indicates a straightforward mechanism for supply of Al atoms to the graphene surface. The Al adatom remains physisorbed for as long as it does not interact with other gas species resulting from the (CH3)3Al/graphene reactions. Additional AIMD runs that we have carried out at temperatures ranging from 300 to 4300 K, each with duration of 0.1 ns, confirm that individual Al adatoms are stable species, unlikely to spontaneously desorb from graphene (see Appendix).
For Al adatom diffusivities on graphene, our simulations yield diffusion coefficient D(T) results that follow two distinct Arrhenius-like trends: D(T) = [5.6 × 10⁻⁴ cm2 s−1] × exp[−0.03 eV/(kBT)] (×3±1) for 300 K ≤ T ≤ 1200 K; D(T) = [1.1 × 10⁻² cm2 s−1] × exp[−0.34 eV/(kBT)] (×3±1) for 1200 K ≤ T ≤ 4300 K. The high lifetime and diffusivity of Al adatoms on graphene might be important for promoting AlN nucleation, with the Al adatom itself acting as initial seed, whereby high surface mobility is considered as a factor that improves growth efficiency.32 Alternatively, adsorbed Al atoms may intercalate at graphene/SiC interfaces; a mechanism analogous to that leading to formation of two-dimensional GaN via graphene encapsulation.2
Dissociative patterns for metal organic precursors at MOCVD conditions, as well as delivery of metal atoms to the growing surface – similarly to the reactions observed in this work – have been predicted via DFT and discussed for, e.g., trimethylgallium and trimethylindium on GaN and InN surfaces, respectively.18,19 However, although 0 K ab initio calculations provide reliable evaluation of reaction pathways and Gibbs free energies of reactants and products, they are unable to determine the intricate atomistic dynamics underlying MOCVD processes.
CH2 molecule directly after the eighth (CH3)3Al/graphene collision.
During a timeframe of 15 ps following the methane elimination, the CH3–AlCH2 molecule collides 6 times with the graphene sheet, with interposed physisorption periods lasting for approximately 2 ps each. Then, the CH3–AlCH2 molecule reacts with graphene as illustrated in Fig. 4. First, the CH3–AlCH2 molecule bonds with the graphene carbon atom C1Gvia its Al-atom side, while the C atom of the CH2 group (CA) attaches onto a graphene carbon atom (C2G) adjacent to C1G (Fig. 4a). After 0.2 ps, the CA/Al bond breaks, and the CH2 binds even more strongly to the underlying C2G atom (Fig. 4b). The average CA–C2G bond length of 1.45 Å is comparable with the nearest neighbor CG–CG distance in graphene. Approximately 0.1 ps later, the Al–CH3 molecule desorbs, while the CH2 group remains as admolecule on graphene (Fig. 4c). The CH2 admolecule adsorbs preferentially atop CG atoms and migrates among these sites, through bridge positions, above CG–CG bond centers, with a migration frequency of 4.3 (×1.4±1) THz at 4300 K. After ∼5.5 ps, we observe the formation of a C adatom consequent to dehydrogenation of the CH2 admolecule, as illustrated in the snapshot sequence of Fig. 5. The formation of C adatoms has been reported to significantly enhance the reactivity of graphene by forming localized states in the vicinity of the adspecies, similar to the effects induced by defects in the graphene sheet.33
 | ||
| Fig. 4 AIMD snapshots during a CH2Al–CH3 + graphene → CH2–graphene + Al–CH3 reaction. | ||
 | ||
| Fig. 5 AIMD snapshots of CH2 admolecule dehydrogenation and consequent attachment of a C adatom to the graphene sheet. | ||
In our simulations, the carbon adatom (Cad) diffuses among atop-CG sites via the center of CG–CG bonds with jump frequency of 10.0 (×1.5±1) THz. Carbon adatoms located above CG–CG bonds cause the temporary formation of C7 rings, with the adatom embedded between two CG atoms, and ripple the graphene sheet with a cusp in correspondence of the adatom position. Approximately 1 ps later, the Cad and the underlying CG atom undergo an exchange reaction, as shown in Fig. 6a and b. The C adatom (cyan sphere) moves inward the graphene layer pushing the underlying CG atom (gray sphere) to the other side of the sheet.
 | ||
| Fig. 6 AIMD snapshots of C adatom/CG exchange reaction and C–Al admolecule formation. (a) The C adatom (cyan) pushes a graphene atom (gray) on the opposite side of the graphene sheet. The newly formed adatom (former CG atom) is shown in dark gray. | ||
The exchange reaction occurs while the AlCH3 molecule (which had previously formed, see Fig. 4c) is approaching the graphene layer from the gas phase (Fig. 6c). The simulation reveals that the presence of a C adatom (originally a graphene carbon atom) slightly deflects the trajectory of the AlCH3 gas molecule due to Cad/Al attraction which leads to Al–Cad bond formation and elimination of the methyl group from the gas molecule (Fig. 6d).
The reaction leaves a C–Al admolecule anchored to graphene by its C atom. However, the C–Al admolecule rapidly splits, with the Al atom adsorbing on graphene and migrating away from the carbon adatom. Thus, in the second (CH3)3Al/graphene simulation, the formation of a free Al adatom is catalyzed by the presence of a C adatom on the graphene surface. This is an alternative atomistic mechanism for supplying graphene with Al adatoms. However, this pathway is considerably less likely to occur (entropically unfavored) than the direct attachment of CH3–AlCH2 molecules on graphene (see Run 1).
During the subsequent ∼13 ps of this simulation, frequent Cad/CG exchange reactions (eight events for 13 ps) as well as permeation of a C adatom through graphene (two events) are observed. This yields an overall rate of 0.75 (×1.5±1) THz for C atom transport across pristine graphene at 4300 K. The presence of a carbon adatom locally weakens CG–CG interatomic bonds and promotes bond stretching at elevated temperatures (note C2G–C4G bond length >2 Å in Fig. 7a and b), thus favoring C permeation across an in-plane threefold-coordinated position (Fig. 7c and d). The reaction ends with the C becoming an adatom on the opposite site of graphene sheet, Fig. 7(e–h). DFT modeling of C atom penetration though large aromatic CxHy planar molecules yields extremely high energy barriers (∼7 eV).34 AIMD simulations of this work describe C exchange (Fig. 6) and permeation (Fig. 7) phenomena in a more realistic way, providing global activation energies for C transport across pristine graphene of only 0.28 eV (see below).
 | ||
| Fig. 7 AIMD snapshots of C adatom permeation across pristine graphene. The C adatom (Cad) is shown in cyan. CG atoms are represented by gray spheres. Numbered CG atoms take part in the reaction. Panels on the left (right) are perspective (plan) views. The time elapsing between successive snapshots is also indicated. The C–C bonds shown in the figure have maximum lengths of 2 Å. C2G–C4G bonds are not depicted in (a and b), since the C2G–C4G distance is ∼2.15 Å. Missing C5G–C4G, Cad–C4G, and C2G–C1G bonds in (e) and (f) have lengths of 2.07, 2.16, and 2.34 Å, respectively. | ||
Carbon adatom dynamics on graphene: surface migration and exchange reactions
The observation of the phenomenon of carbon transport through defect-free graphene motivated additional AIMD simulations (270 ps in total) to investigate more in detail the dynamics of carbon adatoms on graphene at different temperatures. Previously, C adatom migration on graphene and on carbon nanotubes (both internally and externally) has been studied via ab initio and via Monte Carlo simulations.35–37 Our AIMD results show that both Cad/CG exchange and Cad migration events are extremely frequent (with respect to the timescales feasibly accessible to AIMD) at all investigated temperatures (between 1000 and 4100 K) and follow a fairly Arrhenius-like behavior. Adsorption of isolated carbon atoms on graphene can be imaged via conventional transmission electron microscopy.38 To our knowledge, however, theoretical investigations of Cad/CG exchange reactions had not been carried out.Simulations at relatively low temperatures (1000 and 1500 K), allow for easily identifying the transition state configuration for Cad/CG exchange (Fig. 8), with the two carbon atoms occupying specular positions with respect to the sheet. The dumbbell-like Cad/CG configuration entails that both the carbon adatom and its twin CG atom are bonded to each other (bond length of ≈1.7 Å) as well as to three neighboring graphene atoms with bond lengths of ≈1.5 Å; slightly larger than the calculated average CG–CG nearest neighbor distance (≈1.45 Å) at 1000 K.
 | ||
| Fig. 8 AIMD snapshot of stable dumbbell configuration of C adatom on graphene at 1000 K. The bond-length cutoff is 1.7 Å. | ||
Linear regression of Cad/graphene AIMD migration rates [ln(rate)] vs. 1/T yields attempt frequencies Amig = 24.4 (×1.3±1) THz and activation energies Emiga = 0.40 ± 0.09 eV, consistent with C adatom energy barriers (≈0.55 eV) computed via DFT at 0 K.35 For C transport across graphene, we obtain Eexca = 0.28 ± 0.13 eV and Aexc = 2.1 (×1.7±1) THz. It should be noted that, although carbon transport across graphene requires lower activation energies, the rate of these reactions is smaller than that for Cad surface migration at all investigated temperatures (Fig. 9) due to Aexc attempt frequencies being much smaller than Amig. Cad/CG exchange rates at typical experimental temperatures (1500 K)10 are ∼0.3 THz. This result indicates that formation of C adatoms during MOCVD may significantly affect reactivity and stability of defect-free graphene areas and consequently influence the deposition of AlN on graphene, here considered as case study. We note that exchange of C adatoms with graphene atoms is never observed to disrupt the honeycomb graphene structure during our AIMD simulations.
 | ||
| Fig. 9 Temperature-dependent rates of C adatom migration on graphene and of Cad/CG exchange reactions as determined via AIMD simulations. | ||
The presence of carbon adatoms and the occurrence of Cad/CG exchange reactions may contribute to weaken graphene C–C bonds vicinal to existing defects, e.g., Stone–Wales, pentagonal, and double pentagon defects, and assist formation of holes in the bonding network, as previously shown for graphene-like carbon-based systems.39 Consequently, the increased reactivity of unsaturated bonds in the carbon sheet would lead, favored by attachment of gas radical molecules, to partial or full disintegration of graphene.
Simulations of (CH3)2AlNH2 with graphene
As indicated, the general case of MOCVD of AlN could be considerably complicated and dominated by rapid (≪1 s) irreversible formation of (CH3)3Al:NH3 adducts, which nearly proceeds at gas-kinetic collision rates, with no activation energy upon mixing of the precursors trimethylaluminum (CH3)3Al and ammonia NH3 in the gas phase.40 This is followed by a rapid methane (CH4) elimination from the adduct (CH3)3Al:NH3, which in turn initiates the formation of adduct-derived species such as (CH3)2AlNH2 with direct Al–N bonding14 | (3) |
For sake of completeness, we present below (CH3)2AlNH2/graphene simulations (alternatively written as H2N:Al(CH3)2/graphene).
| H2N:Al(CH3)2 → H2N:ȦlCH3 + ĊH3 | (4) |
 | ||
| Fig. 10 AIMD snaphots of methyl-radical detachment from a H2N:Al–CH3 molecule followed by methyl adsorption on graphene. | ||
At a simulation time tsim = 24 ps, the gaseous AlNH2 species absorbs at the graphene surface by its Al side for 3 ps (figure not shown). This reaction supplies the graphene surface with an (already formed) Al–N bond. It should be noted that, also in the case of AlNH2 physisorption, graphene exhibits strong affinity for the Al atom of the adspecies.
 | (5) |
This differs from the observation of the first H2N:Al(CH3)2/graphene simulation, where a reactive CH3 methyl radical detaches from the adduct at the third H2N:Al(CH3)2/graphene collision. The H2N:AlCH2 species attaches to the graphene surface by its Al-atom side. Very few fs later, the NH2 and CH2 groups bond to each other, while breaking their bond with the Al atom, and the H2NCH2 species desorbs from the surface (the mechanism is analogous to the one illustrated in Fig. 3 for delivery of Al adatoms by (CH3)3Al/graphene reactions), while the Al atom remains physisorbed at the surface for the remaining simulation time (from tsim = 38 to 41 ps). As in the case of (CH3)3Al/graphene reactions, also this simulation suggests a different reaction of delivery of isolated Al adatoms on graphene:
| H2N:AlCH2 → H2NCH2 + Alad | (6) |
During the final 3 ps of the simulation, the H2NCH2 gas species undergoes several reactions of dehydrogenation and recombination with hydrogen. However, AIMD results indicate that HxN–CHy molecules are not likely (at least at elevated temperatures) to adsorb on graphene.
Simulations of ammonia NH3 with graphene
NH3 is a strongly-bonded molecule: the N–H bond energy calculated via DFT is ∼420 kcal mol−1, while the Al–N and Al–C bond energies in (CH3)3Al, the adduct, and their derivatives vary between 40 and 120 kcal mol−1.42 Thus, the decomposition of NH3 is expected to occur in the gas phase at very high temperatures (typically above 1800 K), or on the graphene surface in presence of other species or at defect sites.43 This is consistent with our AIMD results, as explained below.AIMD simulations show 64 NH3/graphene collisions during 100 ps (Fig. 11). Although ammonia exhibits physisorption periods on graphene (∼3 ps in total), no reaction is recorded in the gas phase or on the surface, despite the elevated temperature. This is in direct contrast to what observed (see above) for (CH3)3Al and H2N:Al(CH3)2 reactions, which occur after very few collisions with the graphene sheet (initial precursor reactions take place within 40 ps).
 | ||
| Fig. 11 AIMD snapshots of a NH3/graphene collision. | ||
Overall, AIMD results show a considerable greater affinity of Al-containing species as well as of methyl groups toward graphene in comparison with NH3. While Al has an empty orbital, prone to accept graphene π electrons, the N atom has a completely filled electronic shell that repels the graphene π-cloud and thus prevents ammonia attachment on graphene. Formation of Al and C adatoms consequent to (CH3)3Al/graphene and H2N:Al(CH3)2/graphene collisions provides surface sites of higher reactivity which can assist subsequent gas-molecule/graphene reactions.
Ammonia is known to functionalize graphene at defective sites at temperatures between 1000–1300 K.43 Molecular dynamics simulations performed using quantum-chemistry based force-fields showed that excess of nitrogen impurities and the presence of N–N bonds within the graphene layer undermine graphene stability.44 However, in the case of MOCVD of AlN on defect-free (high-quality) graphene, treatment of graphene with ammonia prior to initiating MOCVD is not expected to provide significant differences in surface reactivity. Nevertheless, Al–N bond splitting in H2N:Al(CH3)2 or ammonia/atomic-H reactions – H2 dissociation is relevant at the typical synthesis temperatures, ∼1700 K, used for growth of high-quality AlN thin films10 – would promote formation of ṄH2 radicals which are expected to exhibit considerably higher affinity toward graphene. The presence of an ammine group on defect-free regions of the graphene sheet was indicated to assist various reactions, including the possibility of nitrogen-atom delivery to the graphene surface.26
Conclusions
In summary, density-functional molecular dynamics simulations with van der Waals corrections have been employed for achieving deeper understanding at atomistic level of the rich chemistry of reactions occurring during MOCVD of AlN on graphene at elevated temperatures. Trimethylaluminum (CH3)3Al, ammonia NH3, and an adduct-derived species (CH3)2AlNH2 have been employed as chemical precursors. The simulations reveal atomistic pathways, with associated changes in electron densities, responsible for reactions in the gas phase (e.g. methane elimination, dehydrogenation) as well as for delivery of Al, C adatoms, and C–Al, CHx, Al–NH2 admolecules on defect-free graphene consequent to precursor/surface collisions. DFT charge-density results suggest that attachment and reactivity of Al-containing molecules on graphene is relatively rapidly activated owing to facile graphene π-electron transfer to empty Al orbitals. In contrast, NH3 precursors are never observed to react with the carbon layer, thus indicating that pre-treatment of defect-free graphene via exposure to ammonia does not significantly contribute to N-atom delivery or creation of reactive sites on the carbon sheet. The simulations show that individual Al adatoms exhibit considerable stability and high diffusivity on graphene, and might therefore contribute to increase surface reactivity, promote AlN nucleation, or may rapidly intercalate at grain boundaries. Irrespective of temperature, carbon adatoms undergo frequent exchange reactions with graphene carbon atoms, thus leading to C transfer across the sheet with rates Γ = 2.1 (×1.7±1) THz·exp[(−0.28 ± 0.13 eV)/(kBT)]. On the base of the results presented, we argue that density-functional molecular dynamics is an efficient method to unveil precursor/surface chemical reactions and thus to guide MOCVD experiments toward a more effective exploitation of gas precursors.Computational methods
Ab initio molecular dynamics simulations are carried out with the VASP code45 using the local density approximation (LDA) within the scheme of Ceperley–Alder,46 as parameterized by Perdew and Zunger,47 and the projector augmented wave48 method. The approximation proposed by Grimme49 is used to model the non-locality of electron correlation. At each AIMD time step (0.1 fs for modeling dynamics in all simulations involving hydrogen atoms and 1 fs for studying diffusion of isolated Al and C adatoms on graphene), the total energy is evaluated to an accuracy of 10−5 eV per atom employing a plane-wave energy cutoff of 300 eV and Γ-point sampling of the Brillouin zone. Electronic thermal excitations are accounted for by employing Gaussian smearing energies equal to kBT.The present AIMD simulations employ boxes with periodic boundary conditions in all directions. The supercells contain 27 Å-thick vacuum regions separating graphene-sheet replicas along the vertical direction. The graphene layer consists of 6 × 6 unit cells, for a total of 72 carbon atoms. The AIMD simulations are carried out at a temperature of T = 4300 K, which is below the melting point of graphene (∼4500 K).50 The use of a supercell with relatively small graphene surface area, (∼13.8 Å2), prevents populating long-wavelength (∼80 Å) phonons which cause formation of defects from T ≥ 3500 K.51 The choice of a simulation temperature (4300 K) well above the typical temperature implemented in the MOCVD of AlN (T ≈ 1500–1700 K),10 dictated by the fact that defect-free graphene exhibits extremely low reactivity at the timescales accessible to AIMD,43 significantly reduces the simulation times required to obtain qualitative understanding of surface reaction pathways. Chemical reactions occur considerably more rapidly at defective sites than on defect-free graphene regions.43 Nevertheless, the investigation of the inherent reactivity of pristine graphene is a necessary initial step for understanding MOCVD growth on its surface.
In all our simulations, the graphene lattice parameter a is maintained fixed to 2.465 Å. This value corresponds to that determined at 2400 K via atomistic Monte Carlo simulations52 based on reliable bond-order interatomic potentials for carbon.53,54 Considering that, for T ≥ 900 K, graphene has a positive thermal expansion coefficient,52 our choice of a causes a slight in-plane compression55 which, reducing the degree of vibrational anharmonicity, ensures structural stability of the graphene sheet at 4300 K.
The geometries of chemical precursors are optimized via 0 Kelvin DFT energy minimization. Then, random initial velocities (corresponding to a translational kinetic energy of ∼300 K) are assigned to each atom. Thus, microcanonical NVE dynamics is followed during 2 ps to ensure stability of the molecules. Coupling directly the internal degrees of freedom of the molecules with a thermostat would alter their dynamics, thus possibly causing artifacts such as sudden molecule splitting. The precursor internal atomic positions and velocities obtained via AIMD NVE sampling are used as input for subsequent precursor/graphene modeling.
The precursors are placed at random initial positions, approximately 13 Å above the graphene sheet, previously equilibrated in a separate AIMD simulation at a temperature T = 4300 K. Then, the molecule center of mass is gently pushed (during ∼1 fs) toward the surface using weak (<0.05 eV Å−1) bias forces.56 This is necessary to induce precursor/graphene collision since the molecule center of mass has no drift after NVE sampling. The temperature of graphene is controlled via coupling with an isokinetic thermostat (velocity rescaling at each time step for all carbon atoms), which mimics canonical NVT phase-space sampling, while the precursors rotational and vibrational degrees of freedom are equilibrated at T = 4300 K upon frequent collisions with the graphene layer. The combination of NVE (for precursors) and NVT (for graphene) sampling within the same AIMD simulation was recently implemented in an own version of VASP.56 AIMD snapshots are generated using the software Visual Molecular Dynamics.57
Conflicts of interest
There are no conflicts to declare.Appendix: Al adatom diffusion on graphene
The diffusion coefficients DAl(T) of Al adatoms on graphene are determined by directly tracing the adatom mean square displacement during AIMD runs at temperatures of 300, 1000, 2000, 3000, 3800, and 4300 K, with simulation times of ∼0.1 ns at each temperature, by exploiting the method described in the appendix of ref. 58. For these simulations, we use a time step of 1 fs and the Nose–Hoover thermostat to control the temperature of the graphene + adatom system. Average adatom migration energies and exponential prefactors, extracted via Arrhenius linear regression of DAl(T) vs. 1/T data, yield a two-regime Arrhenius-like diffusion behavior, with D(T) = [5.6 × 10⁻⁴ cm2 s−1] × exp[–0.03 eV/(kBT)] (×3±1) for 300 K ≤ T ≤ 1200 K and D(T) = [1.1 × 10⁻² cm2 s−1] × exp[−0.34 eV/(kBT)] (×3±1) for 1200 K ≤ T ≤ 4300 K. The factor 3±1 is the estimated uncertainty on diffusivities.At 300 K, an isolated Al adatom resides for most of the time in hollow sites at the center of graphene C6 rings. However, at all simulated temperatures, Al adatom migration primarily occurs in superdiffusive regime,59 that is, the mean square displacement varies with time t as tα (α > 1), and the adatom exhibits no preferential migration pathways. Importantly, the Al adatom is essentially constantly adsorbed on graphene for the entire duration of all runs (it desorbs from, and re-adsorbs on, the graphene sheet on only one occasion at 4300 K).
Acknowledgements
All simulations were carried out using the resources provided by the Swedish National Infrastructure for Computing (SNIC), on the Gamma and Triolith Clusters located at the National Supercomputer Centre (NSC) in Linköping, on the Beskow cluster located at the Center for High Performance Computing (PDC) in Stockholm, and on the Kebnekaise cluster located at the High Performance Computing Center North (HPC2N) in Umeå, Sweden. A. K.-G. and G. K. G. acknowledge support for this work by the Swedish Research Council (VR) through FLAG-ERA JTC 2015 project GRIFONE (VR 2015-06816) and VR 2017-04071. D. G. S. gratefully acknowledges financial support from the Olle Engkvist Foundation. Dr Viktor Ivady is gratefully acknowledged for useful discussions.References
- J. Kim, C. Bayram, H. Park, C. W. Cheng, C. Dimitrakopoulos, J. A. Ott, K. B. Reuter, S. W. Bedell and D. K. Sadana, Nat. Commun., 2014, 5, 4836 CrossRef PubMed.
- Z. Y. Al Balushi, K. Wang, R. K. Ghosh, R. A. Vila, S. M. Eichfeld, J. D. Caldwell, X. Y. Qin, Y. C. Lin, P. A. DeSario, G. Stone, S. Subramanian, D. F. Paul, R. M. Wallace, S. Datta, J. M. Redwing and J. A. Robinson, Nat. Mater., 2016, 15, 1166 CrossRef PubMed.
- S. S. Li, C. W. Zhang, R. W. Zhang, P. Li, F. Li, M. Yuan, M. J. Ren, W. X. Ji and P. J. Wang, RSC Adv., 2014, 4, 7500 RSC.
- C. Bacaksiz, H. Sahin, H. D. Ozaydin, S. Horzum, R. T. Senger and F. M. Peeters, Phys. Rev. B: Condens. Matter Mater. Phys., 2015, 91, 085430 CrossRef.
- R. B. dos Santos, F. D. Mota, R. Rivelino, A. Kakanakova-Georgieva and G. K. Gueorguiev, Nanotechnology, 2016, 27, 145601 CrossRef PubMed.
- Z. Y. Al Balushi, T. Miyagi, Y.-C. Lin, K. Wang, L. Calderin, G. Bhimanapati, J. M. Redwing and J. A. Robinson, Surf. Sci., 2015, 634, 81 CrossRef.
- G. B. Stringfellow, Mater. Sci. Eng., B, 2001, 87, 97 CrossRef.
- R. R. Q. Freitas, G. K. Gueorguiev, F. D. Mota, C. M. C. de Castilho, S. Stafström and A. Kakanakova-Georgieva, Chem. Phys. Lett., 2013, 583, 119 CrossRef.
- A. Y. Timoshkin and H. F. Schaefer, J. Phys. Chem. C, 2008, 112, 13816 CrossRef.
- D. Nilsson, E. Janzen and A. Kakanakova-Georgieva, J. Phys. D: Appl. Phys., 2016, 49, 175108 CrossRef.
- S. Keller, G. Parish, P. T. Fini, S. Heikman, C. H. Chen, N. Zhang, S. P. DenBaars, U. K. Mishra and Y. F. Wu, J. Appl. Phys., 1999, 86, 5850 CrossRef.
- J. Ma, Q. Zhuang, G. Chen, C. Huang, S. Li, H. Wang and J. Kang, J. Phys. Chem. A, 2010, 114, 9028 CrossRef PubMed.
- Z. Y. Fan, G. Rong, N. Newman and D. J. Smith, Appl. Phys. Lett., 2000, 76, 1839 CrossRef.
- T. G. Mihopoulos, V. Gupta and K. F. Jensen, J. Cryst. Growth, 1998, 195, 733 CrossRef.
- W. Walkosz, P. Zapol and G. B. Stephenson, J. Chem. Phys., 2012, 137, 054708 CrossRef PubMed.
- L. Tsetseris and S. T. Pantelides, Phys. Rev. B: Condens. Matter Mater. Phys., 2012, 85, 155446 CrossRef.
- O. Leenaerts, B. Partoens and F. M. Peeters, Phys. Rev. B: Condens. Matter Mater. Phys., 2008, 77, 125416 CrossRef.
- T. Akiyama, K. Nakamura and T. Ito, Appl. Phys. Lett., 2012, 100, 251601 CrossRef.
- B. H. Cardelino and C. A. Cardelino, J. Phys. Chem. C, 2011, 115, 9090 CrossRef.
- A. Chatterjee and D. G. Vlachos, J. Comput. – Aided Mater. Des., 2007, 14, 253 CrossRef.
- J. Petucci, C. LeBlond, M. Karimi and G. Vidali, J. Chem. Phys., 2013, 139, 044706 CrossRef PubMed.
- X. Ren, P. Rinke, C. Joas and M. Scheffler, J. Mater. Sci., 2012, 47, 7447 CrossRef.
- N. Yatom and M. C. Toroker, Catal. Lett., 2016, 146, 2009 CrossRef.
- R. Car and M. Parrinello, Phys. Rev. Lett., 1985, 55, 2471 CrossRef PubMed.
- S. Pratihar, X. Ma, Z. Homayoon, G. L. Barnes and W. L. Hase, J. Am. Chem. Soc., 2017, 139, 3570 CrossRef PubMed.
- V. V. Chaban and O. V. Prezhdo, J. Phys. Chem. Lett., 2015, 6, 4397 CrossRef PubMed.
- D. G. Sangiovanni, D. Edström, L. Hultman, I. Petrov, J. E. Greene and V. Chirita, Surf. Sci., 2014, 624, 25 CrossRef.
- D. G. Sangiovanni, A. B. Mei, L. Hultman, V. Chirita, I. Petrov and J. E. Greene, J. Phys. Chem. C, 2016, 120, 12503 CrossRef.
- D. G. Sangiovanni, B. Alling, P. Steneteg, L. Hultman and I. A. Abrikosov, Phys. Rev. B: Condens. Matter Mater. Phys., 2015, 91, 054301 CrossRef.
- A. J. Cohen, P. Mori-Sanchez and W. T. Yang, Science, 2008, 321, 792 CrossRef PubMed.
- DFT charge transfer results directly obtained during AIMD indicate that Al adatoms formed by radical dissociation are neutral species.
- Y. Zhang, X. Zhou, S. Xu, Z. Wang, Z. Chen, J. Zhang, J. Zhang and Y. Hao, AIP Adv., 2015, 5, 127102 CrossRef.
- H. Amara, S. Latil, V. Meunier, P. Lambin and J. C. Charlier, Phys. Rev. B: Condens. Matter Mater. Phys., 2007, 76, 115423 CrossRef.
- S. E. Huber, A. Mauracher and M. Probst, AIP Adv., 2013, 3, 122104 CrossRef.
- Z. Hou and K. Terakura, J. Phys. Chem. C, 2015, 119, 4922 CrossRef.
- A. V. Krasheninnikov, K. Nordlund, P. O. Lehtinen, A. S. Foster, A. Ayuela and R. M. Nieminen, Phys. Rev. B: Condens. Matter Mater. Phys., 2004, 69, 073402 CrossRef.
- Y. Gan, J. Kotakoski, A. V. Krasheninnikov, K. Nordlund and F. Banhart, New J. Phys., 2008, 10, 023022 CrossRef.
- J. C. Meyer, C. O. Girit, M. F. Crommie and A. Zettl, Nature, 2008, 454, 319 CrossRef PubMed.
- G. K. Gueorguiev, J. Neidhardt, S. Stafström and L. Hultman, Chem. Phys. Lett., 2005, 410, 228 CrossRef.
- M. E. Coltrin, J. R. Creighton and C. C. Mitchell, J. Cryst. Growth, 2006, 287, 566 CrossRef.
- R. B. dos Santos, R. Rivelino, F. de Brito Mota, A. Kakanakova-Georgieva and G. K. Gueorguiev, Dalton Trans., 2015, 44, 3356 RSC.
- R. B. dos Santos, R. Rivelino, F. de Brito Mota, G. K. Gueorguiev and A. Kakanakova-Georgieva, J. Phys. D: Appl. Phys., 2015, 48, 295104 CrossRef.
- X.-F. Li, K.-Y. Lian, L. Liu, Y. Wu, Q. Qiu, J. Jiang, M. Deng and Y. Luo, Sci. Rep., 2016, 6, 23495 CrossRef PubMed.
- V. V. Chaban and O. V. Prezhdo, J. Am. Chem. Soc., 2015, 137, 11688 CrossRef PubMed.
- G. Kresse and J. Hafner, Phys. Rev. B: Condens. Matter Mater. Phys., 1993, 47, 558 CrossRef.
- D. M. Ceperley and B. J. Alder, Phys. Rev. Lett., 1980, 45, 566 CrossRef.
- J. P. Perdew and A. Zunger, Phys. Rev. B: Condens. Matter Mater. Phys., 1981, 23, 5048 CrossRef.
- P. E. Blöchl, Phys. Rev. B: Condens. Matter Mater. Phys., 1994, 50, 17953 CrossRef.
- S. Grimme, J. Comput. Chem., 2006, 27, 1787 CrossRef PubMed.
- J. H. Los, K. V. Zakharchenko, M. I. Katsnelson and A. Fasolino, Phys. Rev. B: Condens. Matter Mater. Phys., 2015, 91, 045415 CrossRef.
- A. Fasolino, J. H. Los and M. I. Katsnelson, Nat. Mater., 2007, 6, 858 CrossRef PubMed.
- K. V. Zakharchenko, M. I. Katsnelson and A. Fasolino, Phys. Rev. Lett., 2009, 102, 046808 CrossRef PubMed.
- J. H. Los, L. M. Ghiringhelli, E. J. Meijer and A. Fasolino, Phys. Rev. B: Condens. Matter Mater. Phys., 2005, 72, 214102 CrossRef.
- J. H. Los, L. M. Ghiringhelli, E. J. Meijer and A. Fasolino, Phys. Rev. B: Condens. Matter Mater. Phys., 2006, 73, 229901 CrossRef.
- From the data presented in ref. [Phys. Rev. Lett., 2009, 102, 046808], for T ≥ 1000 K, graphene has a linear thermal expansion coefficient, ∼(6.5 ± 0.5) × 10−6 K−1, which yields a nominal lattice parameter at 4300 K of ∼2.508 Å. The lattice parameter (2.465 Å) used in the present AIMD simulations at 4300 K is approximately 2% smaller.
- D. G. Sangiovanni, O. Hellman, B. Alling and I. A. Abrikosov, Phys. Rev. B: Condens. Matter Mater. Phys., 2016, 93, 094305 CrossRef.
- W. Humphrey, A. Dalke and K. Schulten, J. Mol. Graphics Modell., 1996, 14, 33 CrossRef.
- M. J. Saxton, Biophys. J., 1997, 72, 1744 CrossRef PubMed.
- J. M. Sancho, A. M. Lacasta, K. Lindenberg, I. M. Sokolov and A. H. Romero, Phys. Rev. Lett., 2004, 92, 250601 CrossRef PubMed.
| This journal is © the Owner Societies 2018 |