
 Open Access Article
 This Open Access Article is licensed under a Creative Commons Attribution-Non Commercial 3.0 Unported Licence
Full elucidation of the transmembrane anion transport mechanism of squaramides using in silico investigations†
Igor
Marques
 a,
Pedro M. R.
Costa
a,
Margarida
Q. Miranda
a,
Nathalie
Busschaert‡
b,
Ethan N. W.
Howe
bc,
Harriet J.
Clarke
b,
Cally J. E.
Haynes§
b,
Isabelle L.
Kirby
b,
Ananda M.
Rodilla
d,
Ricardo
Pérez-Tomás
d,
Philip A.
Gale
*bc and
Vítor
Félix
*a
a,
Pedro M. R.
Costa
a,
Margarida
Q. Miranda
a,
Nathalie
Busschaert‡
b,
Ethan N. W.
Howe
bc,
Harriet J.
Clarke
b,
Cally J. E.
Haynes§
b,
Isabelle L.
Kirby
b,
Ananda M.
Rodilla
d,
Ricardo
Pérez-Tomás
d,
Philip A.
Gale
*bc and
Vítor
Félix
*a
aDepartment of Chemistry, CICECO – Aveiro Institute of Materials, University of Aveiro, 3810-193, Aveiro, Portugal. E-mail: vitor.felix@ua.pt
bChemistry, University of Southampton, Southampton, SO17 1BJ, UK
cSchool of Chemistry, The University of Sydney, NSW 2006, Australia. E-mail: philip.gale@sydney.edu.au
dUniversity of Barcelona, Faculty of Medicine, Dept. Pathology and Experimental Therapeutics, CCBRG, Barcelona, Spain
First published on 3rd July 2018
Abstract
A comprehensive experimental and theoretical investigation of the transmembrane chloride transport promoted by four series of squaramide derivatives, with different degrees of fluorination, number of convergent N–H binding units and conformational shapes, is reported. The experimental chloride binding and transport abilities of these small synthetic molecules in liposomes were rationalised with quantum descriptors and molecular dynamics simulations in POPC bilayers. The tripodal tren-based compounds, with three squaramide binding motifs, have high chloride affinity, isolating the anion from water molecules within the membrane model and preventing its release to the aqueous phase, in agreement with the absence of experimental transport activity. In contrast, the symmetrical mono-squaramides, with moderate chloride binding affinity, are able to bind and release chloride either in the aqueous phase or at the membrane interface level, in line with experimentally observed high transport activity. The PMF profiles associated with the diffusion of these free transporters and their chloride complexes across phospholipid bilayers show that the assisted chloride translocation is thermodynamically favoured.
Introduction
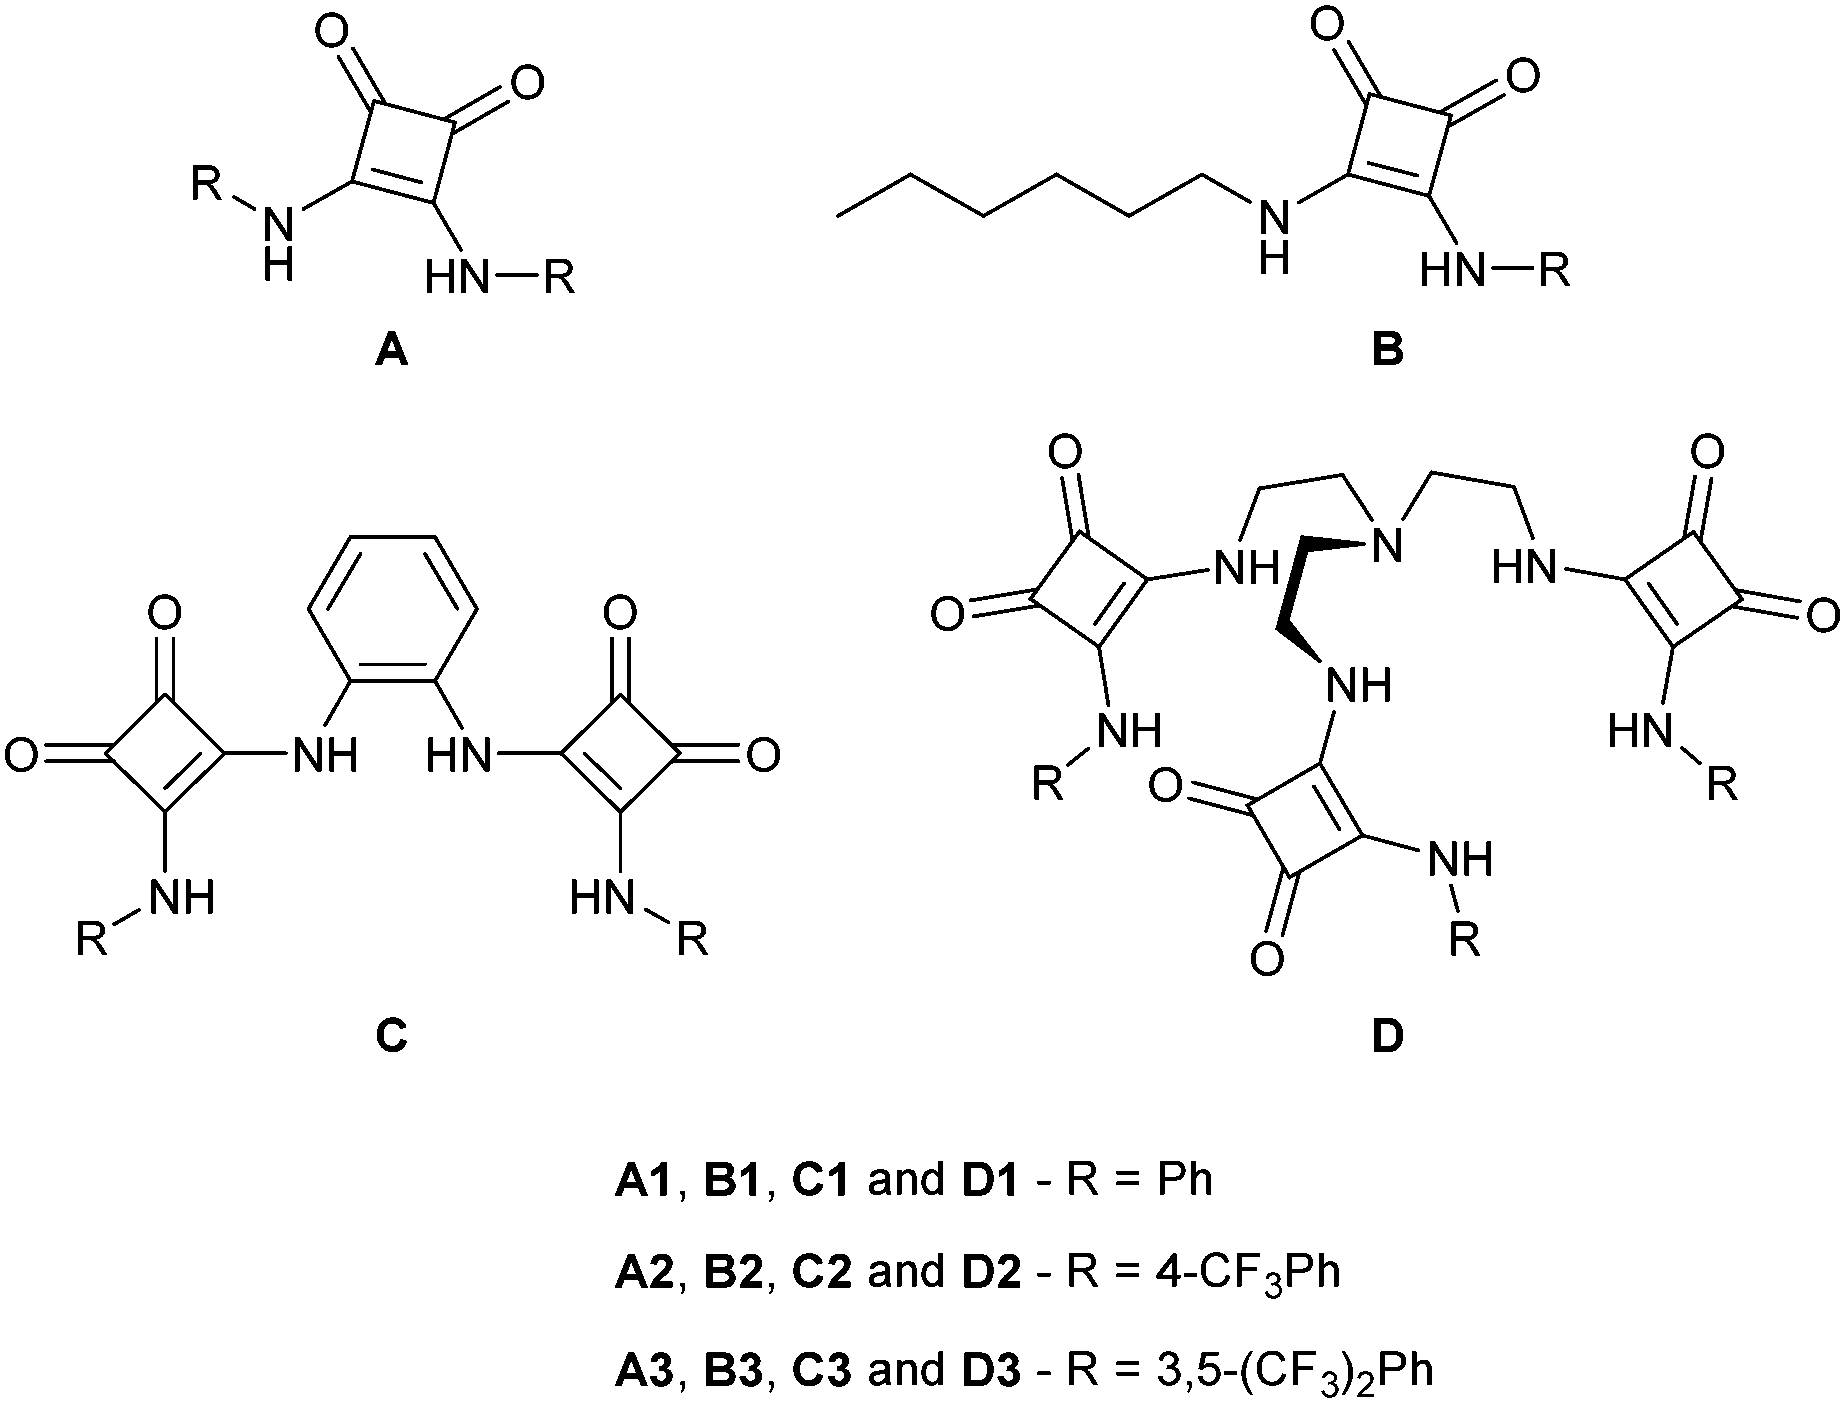
The transport of biologically relevant ions across phospholipid bilayers is a vital process that relies on channel proteins.1,2 A range of disorders involving membrane channels occurs when they are non-existent, or their transport properties are perturbed, due to toxic, autoimmune, or genetic causes.1,2 For instance, the impairment of the cystic fibrosis transmembrane conductance regulator (CFTR), an important epithelial transmembrane channel, affects both the transport of chloride and bicarbonate anions across epithelial cell membranes throughout the organism, resulting in male infertility and cystic fibrosis.2 Furthermore, chloride deficient transmembrane transport is also linked with other diseases, such as epilepsy, neurodegeneration, lung infections, renal salt loss, and kidney stones.3 A strategy for future therapeutic amelioration of the symptoms of this family of disorders is to replace the function of the faulty channels with small molecules. Thus, these so-called channel replacement therapies, that rely on anionophores to promote transmembrane anion transport, are currently being developed by the supramolecular chemistry community.4–20 Transporter molecules exploit different combinations of binding units and scaffolds (e.g., cholapods21,22 and tren-based molecules,23–26 using (thio)ureas; tambjamines;27–29ortho-phenylene-diamine-based bis-ureas;30–32 calixpyrroles;33–36 anion–π slides;37–39 or, even more recently, molecules that rely on unconventional halogen40–43 and chalcogen bonds44) resulting in anion transporters that function either as mobile carriers or as artificial anion channels.Squaramide derivatives are well characterised as ditopic receptors, both experimentally and computationally.45–57 Squaramide-based receptors, decorated with aromatic motifs, are able to establish strong hydrogen bonding interactions with halides, showing a greater binding affinity then the analogous urea based receptors.55 Given their abilities as anion receptors, as well as their applicability in the field of medicinal chemistry,58–63 squaramide derivatives have been studied as anion transporters.64 Indeed, squaramides A1, A2 and A3 (see Scheme 1) were shown to be superior chloride transporters than the corresponding urea and thiourea analogues, as it was possible to improve their binding affinities without significantly changing their lipophilicities.64 The application of squaramide derivatives has also been expanded to the transport of amino-acids.65 On the other hand, the incorporation of the squaramide motifs into a steroidal framework has produced exceptional anion receptors, but poor anion transporters.66 Further tuning of the simple oxosquaramide derivatives A1–A3 involved their thionation to afford analogous thiosquaramides, which can enable/disable their transport ability as a function of the medium's pH,67 further increasing the range of potential applications of the squaramide-based transporters.
 | ||
| Scheme 1 Squaramide-based receptors studied in this work. | ||
Molecular Dynamics (MD) simulations are a powerful tool to obtain energetic and structural insights into transmembrane transport,68 including drug delivery and ion traffic through protein channels.69,70 While in silico studies on these topics are quite common, MD studies on anion transport promoted by small synthetic molecules are still scarce. Our group has reported the diffusion of bis-indolylureas in a POPC bilayer,71 showing the importance of the interactions between these anionophores and the phospholipid head groups for effective transmembrane transport. Furthermore, a proof of concept study with a cationic calix[4]arene in a DOPC membrane allowed us to observe the passive transport of chloride assisted by a synthetic anion carrier for the first time.72 We have extended the MD investigations with membrane models to the study of the interaction of ortho-phenylene-diamine-based bisurea molecules30 and tren-based tris-thiourea compounds73 with POPC bilayers. More recently, MD studies on a series of dithioureidodecalin transporters with different alkyl chains lengths, allowed us to establish a relation between their transport abilities and their tilting and tumbling within the bilayer, which are slowed down by the increasing length of the alkyl chains via van der Waals interactions with phospholipid tails.74
Scheme 1 presents four series of structurally related squaramide derivatives, as follows: the A-series contains a single squaramide motif flanked by two aryl substituents, while in the B-series one of the aromatic groups is replaced by an n-hexyl substituent. The C-series’ molecules are bis-squaramides based on an ortho-phenylene-diamine scaffold, while the D-series has three squaramide binding motifs appended to a tren scaffold. Overall, these series allow the systematic study of the effects of fluorination on the lipophilicity and anion binding strength, and how they can affect anion transport. Furthermore, the C and D families offer the possibility of investigating how different numbers of binding units, as well as their conformational dispositions, affect anion binding and transport. In this work, we report a comprehensive investigation on the twelve squaramide derivatives’ transport properties, derived from a synergistic theoretical and experimental approach. This work has a clear focus on the structural and energetic features of these four series of molecules as anion carriers, while most of the experimental results are presented in the ESI.†
General methods
Receptor synthesis and characterisation, anion transport in liposomes and in vitro
Synthesis and structural characterisation of B1, B3 and C1 are detailed in Section S2 of the ESI.† Moreover, the binding affinity of A1, A3, B1, B3, C1 and D1 towards physiologically relevant anions Cl−, NO3−, HCO3−, H2PO4− and SO42− was elucidated by 1H NMR titrations and are reported in Section S3 of the ESI.† Anion transport experiments in liposomes with B1, B3, C1 and D1 were performed as previously reported75 and are detailed in Section S4 of the ESI.†In vitro assays of A1, A3, B1, B3, C1 and D1 consisted of standard MTT assays, and staining with acridine orange and Hoechst 33342. Detailed procedures are given in Section S5 (ESI†). Overall, equivalent experimental investigations were previously carried out for the remaining molecules shown in Scheme 1.64,67,75–79Quantum calculations and MD simulations
The atomistic characterisation of the squaramide derivatives as anion transmembrane transporters was assessed by DFT calculations followed by MD simulations in two membrane models, composed of 128 POPC lipids, ca. 0.15 M NaCl and different water![[thin space (1/6-em)]](https://www.rsc.org/images/entities/char_2009.gif) :lipid ratios (50.8:1 or 31.6:1).
:lipid ratios (50.8:1 or 31.6:1).
The DFT calculations, carried out with Gaussian 09,80 include the geometry optimisations of the free squaramide derivatives and their chloride complexes in gas phase, followed by the calculation of the E2 energy values, and calculation of the distribution of electrostatic potential.
Overall, the anion transport properties of the squaramide derivatives were investigated with resort to MD simulations, using AMBER 1481 (passive diffusion), NAMD 2.982 (Steered Molecular Dynamics) or AMBER 1683 (Umbrella Sampling simulations), with resort to GPU acceleration.84–86 The LIPID1487 force field was employed for the POPC lipids, while GAFF88,89 parameters and atomic RESP charges90 were used for the squaramide derivatives. The passive diffusion MD simulations mainly gave insights into the interactions between squaramide derivatives and POPC bilayer, while the US simulations allowed to reconstruct the energetic profile associated with the translocation of the A-series molecules along the bilayer normal. The detailed computational methods are given in Section S6.1 of the ESI.†
Results and discussion
Anion transport in liposomes
We have previously reported the anion transport properties of the mono-squaramides A1, A2 and A3,64 as well as the more elaborate squaramides B2, C2, C3, D2, D3,75 and a series of cholapod-based squaramides.66 Much to our surprise, the bis-squaramides (C2, C3 and the cholapods) only displayed modest chloride transport rates, while the tris-squaramides (D2 and D3) were completely inactive. This behaviour is in stark contrast with the high chloride transport ability of the mono-squaramides A1–A3,64 and of analogous bis-ureas30,31 and tris-ureas.24,26 It was postulated that the exceptionally high anion binding strengths displayed by these squaramides has a detrimental effect on the anion transport rate. To fully understand this phenomenon, the series was extended to the structures shown in Scheme 1 (see ESI† for synthesis and characterisation).Initially, standard Cl−/NO3− antiport assays were performed. Vesicles were loaded with a buffered NaCl solution (489 mM, pH 7.2), dispersed in a buffered NaNO3 solution (489 mM, pH 7.2), and the chloride efflux induced by the various squaramides was monitored using a chloride selective electrode. The initial rates of chloride transport (kini) obtained using this assay are shown in Fig. 1b, and confirmed our previous observations. The A-series are the best performing squaramides, while the tripodal D-series does not show any chloride transport activity. The same trend was also confirmed by concentration-dependent Hill analysis (Table S3, ESI†), and for the transport of other anions such as HCO3− (Fig. S11, ESI†). Chen et al. have recently assessed the anion transport ability of the tripodal D2 and D3 as well.91 In agreement with our results, they observed little anion transport activity in Cl−/NO3− antiport assays. However, these authors did report some anion transport activity for D2 and D3 in the presence of a pH gradient, which we did not see using our HPTS assays (Fig. S20–S23, ESI†). Nevertheless, the obtained EC50 values (0.75 mol% for D3)91 are still significantly higher than those reported for the A-series (0.00074 mol% for A3 using a similar pH gradient).92 Therefore, the pertinent question remains: why do the tripodal squaramides exhibit inferior transport ability when compared to the mono-squaramides?
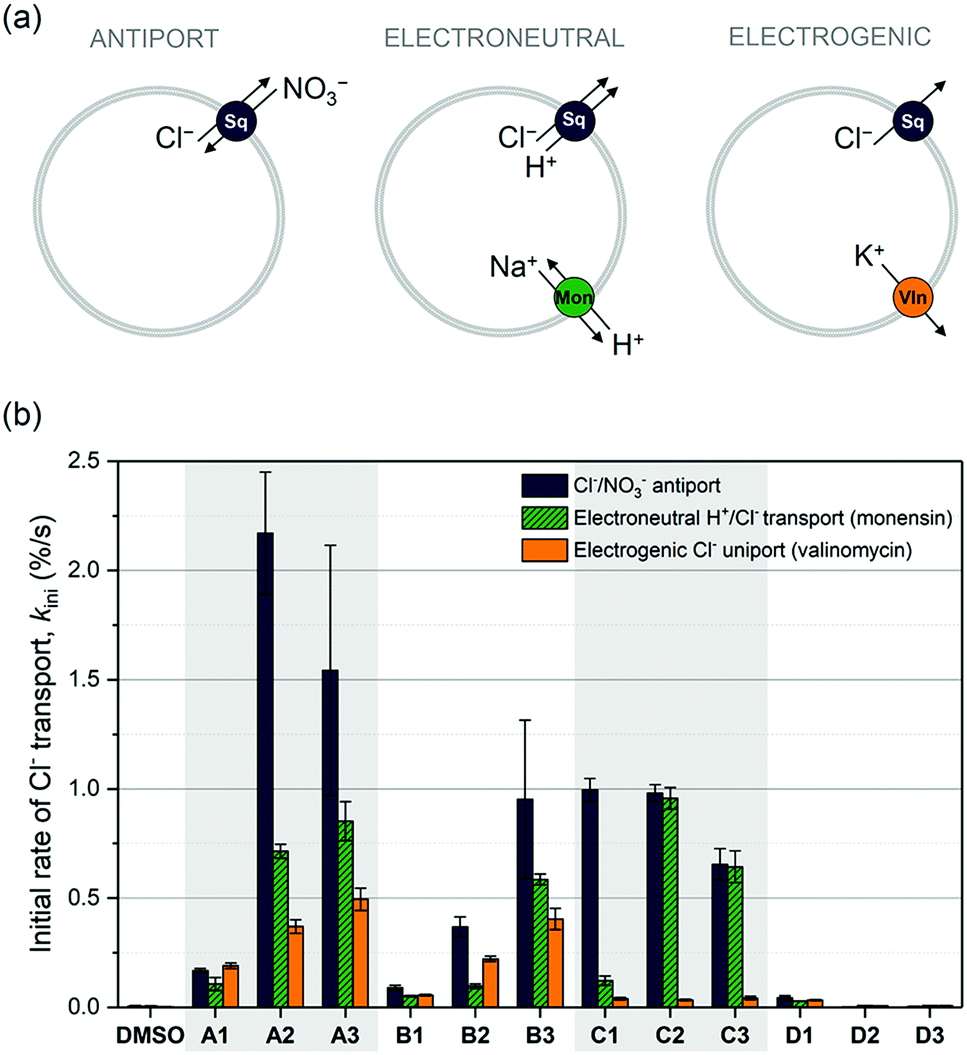 | ||
| Fig. 1 Overview of the anion transport ability of the squaramides in liposomes. (a) Schematic lay-out of the experiments, where Sq = squaramide, Mon = monensin, and Vln = valinomycin. (b) Initial rate of chloride transport calculated by asymptotic or linear fit for each squaramide (1 mol%) under various assay conditions. Experimental conditions are as follows: ANTIPORT – Unilamellar POPC vesicles were loaded with a 489 mM NaCl solution buffered to pH 7.2 with 5 mM phosphate, and were suspended in a 489 mM NaNO3 solution buffered to pH 7.2 with 5 mM phosphate salts. The experiment was started by the addition of a DMSO solution of the appropriate squaramide (1 mol% w.r.t. lipid) and terminated by the addition of detergent at 300 s. ELECTRONEUTRAL – Unilamellar POPC vesicles were loaded with 300 mM KCl buffered to pH 7.2 with 5 mM phosphate salts and were suspended in 300 mM potassium gluconate buffered to pH 7.2 with 5 mM phosphate salts. The experiment was started by the addition of monensin (0.1 mol% w.r.t. lipid) and squaramide (1 mol% w.r.t. lipid), and terminated by the addition of detergent at 300 s. ELECTROGENIC – Unilamellar POPC vesicles were loaded with 300 mM KCl buffered to pH 7.2 with 5 mM phosphate salts and were suspended in 300 mM potassium gluconate buffered to pH 7.2 with 5 mM phosphate salts. The experiment was started by the addition of valinomycin (0.1 mol% w.r.t. lipid) and squaramide (1 mol% w.r.t. lipid), and terminated by the addition of detergent at 300 s. | ||
To understand the behaviour and transport mechanism of the squaramides in more detail, we conducted a series of additional anion transport experiments. Cholesterol and calcein leakage assays provided evidence to support the hypothesis that the squaramides function as anion carriers and not as ion channels (Fig. S25–S27, ESI†). We therefore wished to elucidate whether the diffusion of the carrier across the membrane can occur as a pure uniport event (electrogenic transport of chloride ions), an ion pair symport event (electroneutral transport), or a combination of both. This was achieved using previously reported assays92 depicted in Fig. 1a. In brief, unilamellar vesicles containing buffered NaCl or KCl solutions were suspended in an external solution containing buffered potassium gluconate. Exchange of internal chloride ions with external gluconate anions is not possible, due to the large size and highly polar nature of the gluconate anion. Efflux of chloride ions can therefore only occur if (1) electroneutral H+/Cl− (or Cl−/OH−) transport by the squaramide is compensated by electroneutral H+/Na+ transport by monensin, or (2) electrogenic Cl− transport by the squaramide is neutralised by electrogenic K+ transport by valinomycin. The results of these assays are summarised in Fig. 1b. Not surprisingly, the A-series (and the B-series) is capable of both fast electrogenic and electroneutral transport, while the D-series is unable to transport ions under any conditions. More interesting are the results observed for the C-series, which appear to be only capable of transporting chloride ions through electroneutral transport but not electrogenic transport. This suggests that these bis-squaramides promote transport via a pure ion pair symport event, or via ion exchange at the water/lipid interface; therefore, translocation of the free receptor is not required to complete the process. A possible explanation for this behaviour is that diffusion is hindered due to strong binding of the C-series to phospholipid head groups, which is likely given the high affinity of the squaramides for phosphate in both the solid state (Fig. S9, ESI†) and in solution (Fig. S37–S42, ESI†). The same observation can also explain why the bis-squaramides (C-series) are poorer transporters than the mono-squaramides (A-series), and why the tris-squaramides (D-series) do not display any transport activity at all. The bis- and tris-squaramides have higher anion affinities and are thus expected to bind to the phospholipid head groups more strongly, which competes with the chloride transport mediated by these squaramides. Alternatively, it is also possible that the strong chloride binding ability of the C- and D-series hinders the release of chloride ions and thus impedes anion transport. Nevertheless, the unexpectedly low anion transport ability of the bis- and tris-squaramides appears to be due to their exceptionally high anion binding properties, (which hinders transport due to problematic chloride release or due to competition with lipid head group binding). To investigate this hypothesis in more detail, extensive DFT and MD calculations were performed (vide infra).
We decided to investigate whether the anion transport ability correlates with the in vitro anticancer activity of the compounds. MTT assays were performed on a variety of cancer cells (PC3, A375 and A549) to investigate the cytotoxicity of the compounds. These assays confirmed our previous observation that mono-squaramide A2 is both the best anion transporter and displays the most pronounced cytotoxic effect,75 while the D-series has minimal activity (see Fig. S49, ESI†). In addition, vital fluorescence microscopy using acridine orange, as well as Hoechst 33342 staining and FACS analysis confirmed that the cytotoxicity of the squaramides is probably due to induction of apoptosis and/or changes in lysosomal pH (Fig. S50–S52, ESI†). However, we encountered problems with the solubility of these squaramides during the in vitro assays (particularly the heavily fluorinated meta-CF3 compounds, and the C-series) and it is thus possible that the observed cytotoxicity is an underestimate of the real value.
DFT calculations
Fig. 2 shows the structures of the chloride complexes of A2, B2, C2 and D2, optimised in the gas phase using the M06-2X functional and the 6-31+G(d,p) level of theory with Gaussian 09,80 while Fig. S53 (ESI†) shows the remaining optimised complexes. The calculated N⋯Cl− distances and N–H⋯Cl− angles are listed in Table S8 (ESI†), as well as the values of the individual Ntren–C–C–N torsion angles, starting at the tertiary nitrogen atom (Ntren) of the tripodal receptors D.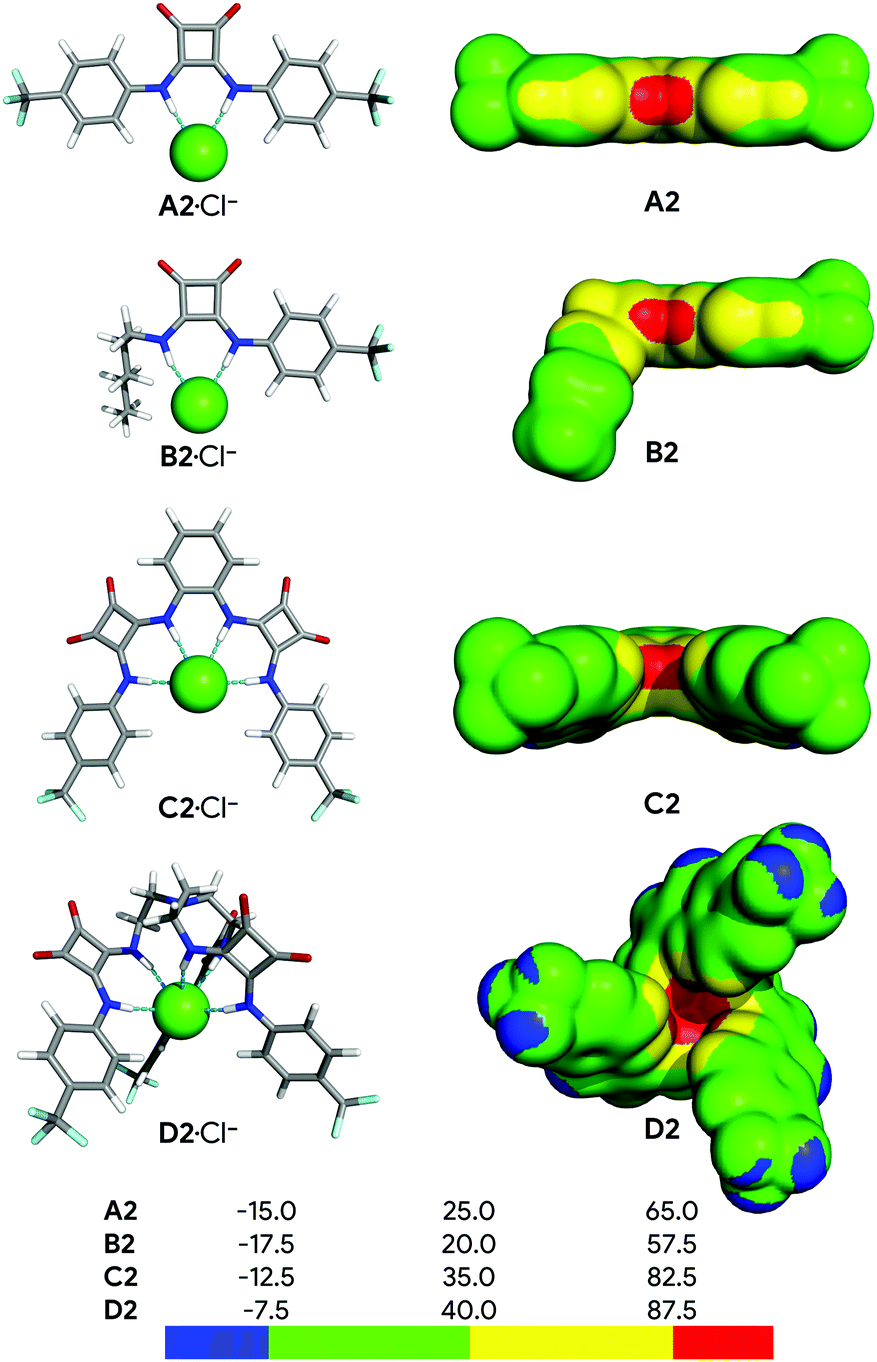 | ||
| Fig. 2 Left: DFT optimised structures of the A2, B2, C2 and D2 chloride complexes. The hydrogen, carbon, oxygen, nitrogen, and fluorine atoms are shown in white, grey, red, blue and cyan sticks, respectively, while chloride is shown as a green sphere. Right: Distribution of the electrostatic potential mapped on the 0.001 electrons Bohr−3 isodensity surface of A2, B2, C2 and D2. The colour scales are given in kcal mol−1. | ||
Overall, the N–H⋯Cl− hydrogen bonds are roughly linear, with the N–H⋯Cl− angles ranging from 160.7° to 177.7°, while the N⋯Cl− distances decrease along each individual series, indicating that these intermolecular interactions become stronger with the increasing fluorination degree (see Section S6.4 in the ESI†). Subsequently, the effect of the different degrees of fluorination on the strength of the bonding interactions was evaluated using the distribution of the electrostatic potential mapped onto the electron density surface (VS),93 as well as the E2 energy derived from the 2nd Order Perturbation Theory Analysis.94
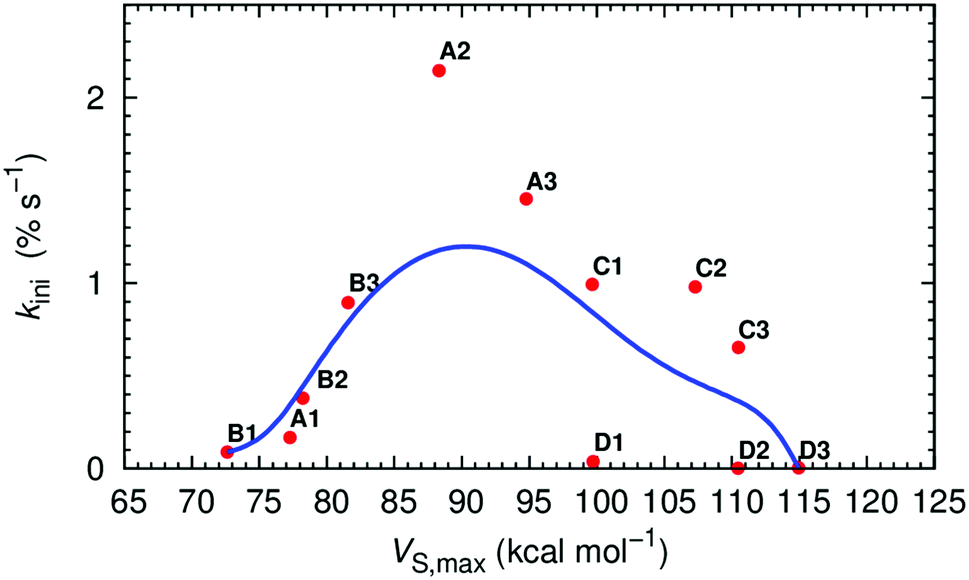
The VS of the squaramide ligands in their chloride complexes (see ESI†) was determined at the same level of theory and is shown in Fig. 2 for A2, B2, C2 and D2, and in Fig. S53 (ESI†) for the remaining molecules. It is important to note that the VS were estimated through single point calculations from the DFT optimised structures of the complexes after removal of the chloride ion. In these circumstances, as the spatial disposition of the N–H binding units of the receptor is maintained, the electrostatic potential becomes more well-defined, leading to higher VS,max values than would be expected. The linear squaramides of the A- and B-series display a well-defined positive region (red) centred at the N–H binding units while the most negative region (blue) covers the oxygen atoms of the carbonyl groups. In the molecules of the C-series the red region encompasses the four acidic N–H binding units of the two squaramide motifs, while the carbonyl groups are surrounded by blue areas of negative potential. In the tripodal molecules, the most positive region is located inside the binding pocket enclosing all six N–H binding units. On the other hand, in D2 and D3, the areas of negative potential, in addition to the carbonyl groups, also include the –CF3 moieties. The negative potentials (blue area) around the oxygen atoms of the carbonyl groups enable the squaramide motif to establish hydrogen bonds with putative hydrogen bond acceptors, such as the water molecules in a membrane system (vide infra) or other squaramide motifs, as observed in crystalline state.64,95 The maximum values of VS (VS,max), listed in Table 1, mainly reflect the number and the position of the –CF3 electron withdrawing groups on the squaramide's phenyl substituents. Oddly enough, for C1 and D1 the VS,max values are comparable, despite the presence of an extra binding unit in the tripodal receptor. Moreover, the graphical representation of the transport rate (kini) versus VS,max, depicted in Fig. 3 (red points), roughly follows a bell-shaped tendency (blue line), estimated by Bézier curve smoothing all data points (degree of 12). It is clear that the B-series, with low VS,max values, has moderate anion transport activity because of weak anion binding. The C- and D-series, with low to no anion transport activity, have high and very high VS,max values, binding anions too strongly and hampering their release. In stark contrast, A2 and A3, with intermediate VS,max values are the most efficient transporters.
| Squaramide | E 2 | V S,max |
|---|---|---|
| A1 | 65.60 | 77.27 |
| A2 | 72.74 | 88.32 |
| A3 | 81.23 | 94.78 |
| B1 | 60.06 | 72.62 |
| B2 | 60.92 | 78.22 |
| B3 | 68.38 | 81.58 |
| C1 | 79.25 | 99.66 |
| C2 | 80.44 | 107.30 |
| C3 | 84.38 | 110.49 |
| D1 | 85.77 | 99.71 |
| D2 | 85.92 | 110.46 |
| D3 | 87.86 | 114.93 |
 | ||
| Fig. 3 Plot of kiniversus VS,max (red dots) and corresponding data smoothed Bézier curve (blue line). | ||
The chloride binding strength in the squaramide complexes was further evaluated through the E2 values, also listed in Table 1. The stabilisation energy of the squaramide complexes increases with the fluorination of the phenyl substituents, as a function of their electron withdrawing nature. Moreover, the E2 values of the chloride complexes increase along with the VS,max of the free receptors, being linear related (R2 = 0.90), and also yielding a similar profile when plotted against the anion transport data (see Fig. S54, ESI†).
This comparison indicates that these quantum descriptors, intrinsically related with the binding ability of the squaramide derivatives for chloride, per se are insufficient for the accurate description of these small molecules as anion transporters. Thus, MD simulations were undertaken to gain further insights on the anion transport ability of these squaramide derivatives at the atomistic level, as follows.
Passive diffusion MD simulations
The MD simulations of the squaramide complexes on membrane systems were preceded by a force field parameterisation to more accurately reproduce the structure of the squaramide core in the phospholipid bilayer environment. This parameterisation was based in crystallographic data and is reported in the ESI† (see Section S6.7). The main purpose of the MD simulations is to assess the ability of the squaramide derivatives to interact with the POPC bilayer and to promote the chloride translocation.The DFT optimised structures of the chloride complexes were either inserted into the water slab (scenario W) or at the core (scenario M) of a POPC bilayer composed of 128 phospholipids. In addition, the anion carrier ability of these receptors was evaluated using distance restraints between the squaramide's binding sites and the chloride, leading to scenarios W′ and M′. Scenarios W and W′ allow the assessment of the passive diffusion of squaramide derivatives’ complexes from the aqueous phase to the water/lipid interface, while the M and M′ scenarios enable the assessment of diffusion events that the chloride complexes experience within the highly-packed phospholipid bilayer. Furthermore, the W and M starting scenarios allow the monitoring, at the atomistic level, of the eventual chloride release and uptake events, intrinsically associated with the anion carrier mechanism. These MD simulations also permit the evaluation of the preferential orientation of the transporters relatively to the bilayer normal, as well as the competitive hydrogen bonding interactions between the squaramide binding sites and the water molecules or phospholipids over the N–H⋯Cl− bonding interactions. The simulated systems, as well as their MD simulation times, are summarised in Table 2.
| Squaramide | Starting scenario | |
|---|---|---|
| W/W′ | M/M′ | |
| Simulation IDsb | Simulation IDsb | |
| a Except for the MD simulation with the D-series in scenario M, which were 500 ns long. b Each simulation ID results from the combination of the initial position of the transporter in the membrane system, the run number and the transporter. For instance, W1·A1 stands for the first MD run carried out with A1 in setup W. c The chloride complexes of D1, D2 and D3 were positioned within the membrane core either perpendicular to the bilayer normal (subscript H) or parallel to it (subscript V). | ||
| A1 | W1·A1, W2·A1/W1′·A1 | M1·A1, M2·A1/M1′·A1 |
| A2 | W1·A2, W2·A2/W1′·A2 | M1·A2, M2·A2/M1′·A2 |
| A3 | W1·A3, W2·A3/W1′·A3 | M1·A3, M2·A3/M1′·A3 |
| B1 | W1·B1, W2·B1/W1′·B1 | M1·B1, M2·B1/M1′·B1 |
| B2 | W1·B2, W2·B2/W1′·B2 | M1·B2, M2·B2/M1′·B2 |
| B3 | W1·B3, W2·B3/W1′·B3 | M1·B3, M2·B3/M1′·B3 |
| C1 | W1·C1, W2·C1 | M1·C1, M2·C1 |
| C2 | W1·C2, W2·C2 | M1·C2, M2·C2 |
| C3 | W1·C3, W2·C3 | M1·C3, M2·C3 |
| D1 | W1·D1, W2·D1 | M1·D1V, M2·D1V, M1·D1H, M2·D1Hc |
| D2 | W1·D2, W2·D2 | M1·D2V, M2·D2V, M1·D2H, M2·D2Hc |
| D3 | W1·D3, W2·D3 | M1·D3V, M2·D3V, M1·D3H, M2·D3Hc |
![[double bond, length as m-dash]](https://www.rsc.org/images/entities/char_e001.gif) OCOM) to the closest membrane interface (Pint, defined by the average position of the phosphorus atoms in that monolayer) measured along the z-dimension (the membrane normal, COCOM⋯Pint distance). Moreover, this distance, together with the relative distance between the centre of the mass of the nitrogen atoms from the two binding units and Pint (N–HCOM⋯Pint) gives the relative positioning of these carbonyl groups and N–H binding sites towards the water/lipid interface.
OCOM) to the closest membrane interface (Pint, defined by the average position of the phosphorus atoms in that monolayer) measured along the z-dimension (the membrane normal, COCOM⋯Pint distance). Moreover, this distance, together with the relative distance between the centre of the mass of the nitrogen atoms from the two binding units and Pint (N–HCOM⋯Pint) gives the relative positioning of these carbonyl groups and N–H binding sites towards the water/lipid interface.
The evolution of the N–HCOM⋯Pint and COCOM⋯Pint distances along the entire production run of simulation W1·A2 is plotted in Fig. 4 (top), together with the number of hydrogen bonds that A2 establishes with any of the 19 chloride ions present in the system. The initially coordinated chloride and the N–H binding sites are quickly solvated by the water molecules and the anion is released to the water phase, with disruption of the N–H⋯Cl− hydrogen bonds (see Fig. 4 bottom, green dashed line). Concomitantly, these hydrogen bonding interactions are replaced by N–H⋯OH2, as evident in Fig. 4 (bottom, blue dotted line), with the plot of the count of these hydrogen bonds versus the relative position of A2 along the bilayer normal (z-dimension). Afterwards, as A2 approaches the interface, some of the N–H⋯OH2 interactions are replaced by hydrogen bonds with the phosphate head groups (N–H⋯O4P−, orange short dashed line in Fig. 4, bottom). The diffusion of A2 from the water phase, illustrated in Fig. 5 with six selected snapshots taken from MD run W1·A2, shows the squaramide derivative entering the phospholipid bilayer with a hydrophobic –CF3 group first. After 25 ns of simulation, the squaramide derivative is found completely embedded into the phospholipid bilayer. The evolution of the N–HCOM⋯Pint distance (blue line) shows that the binding units are closer to the water/lipid interface, while the COCOM⋯Pint relative distance (red line), systematically longer than the former one, indicates that the polar carbonyl groups point towards the lipophilic bilayer core – henceforth, this spatial disposition is type a (see Scheme 2). In addition, both p-CF3-Ph substituents adopt a roughly perpendicular disposition to the plane of the water/lipid interface, enabling the rigid molecule A2 to establish N–H⋯O hydrogen bonding interactions, mainly with water molecules, followed by interactions with carbonyl and the phospholipid head groups (see Fig. 4, bottom). Equivalent results can be found in Fig. S55 (ESI†) for the second run and for the MD simulations carried out with A1 and A3. In the MD simulations of A1 and A3, the squaramides’ penetration is accompanied by a decrease of the N–H⋯OH2 hydrogen bonds and concomitant increase of the N–H⋯O4P− interactions, at the interface level (see Fig. S56, ESI†).
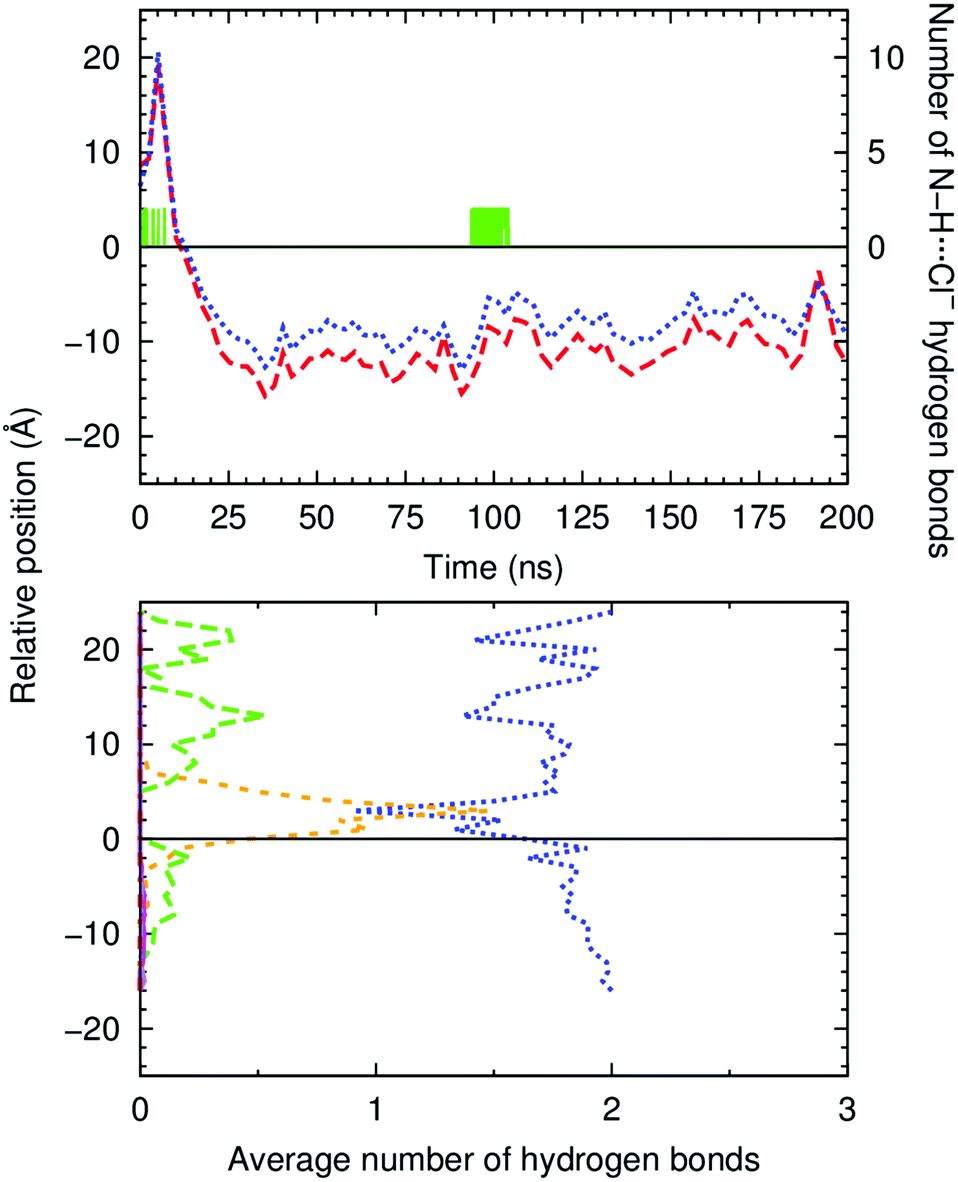 | ||
| Fig. 4
A2's permeation of the water/lipid interface in MD simulation W1·A2. Top: Evolution of COCOM⋯Pint (red dashed line) and N–HCOM⋯Pint (blue dotted line) distances. The evolution of the number of N–H⋯Cl− hydrogen bonds is also plotted as a green solid line. The water/lipid interface is represented as a black line at z = 0 Å. Bottom: Average number of hydrogen bonds versus the relative position of the COM of A2. The following colour scheme was used for the interactions between A2 and chloride ions (green dashed line), water molecules (blue dotted line), POPC head groups (orange short dashed line), and ester groups (magenta solid line for the sn-1 chains and purple dot-dashed line for the sn-2 chains). The water/lipid interface is represented as a black line at z = 0 Å. | ||
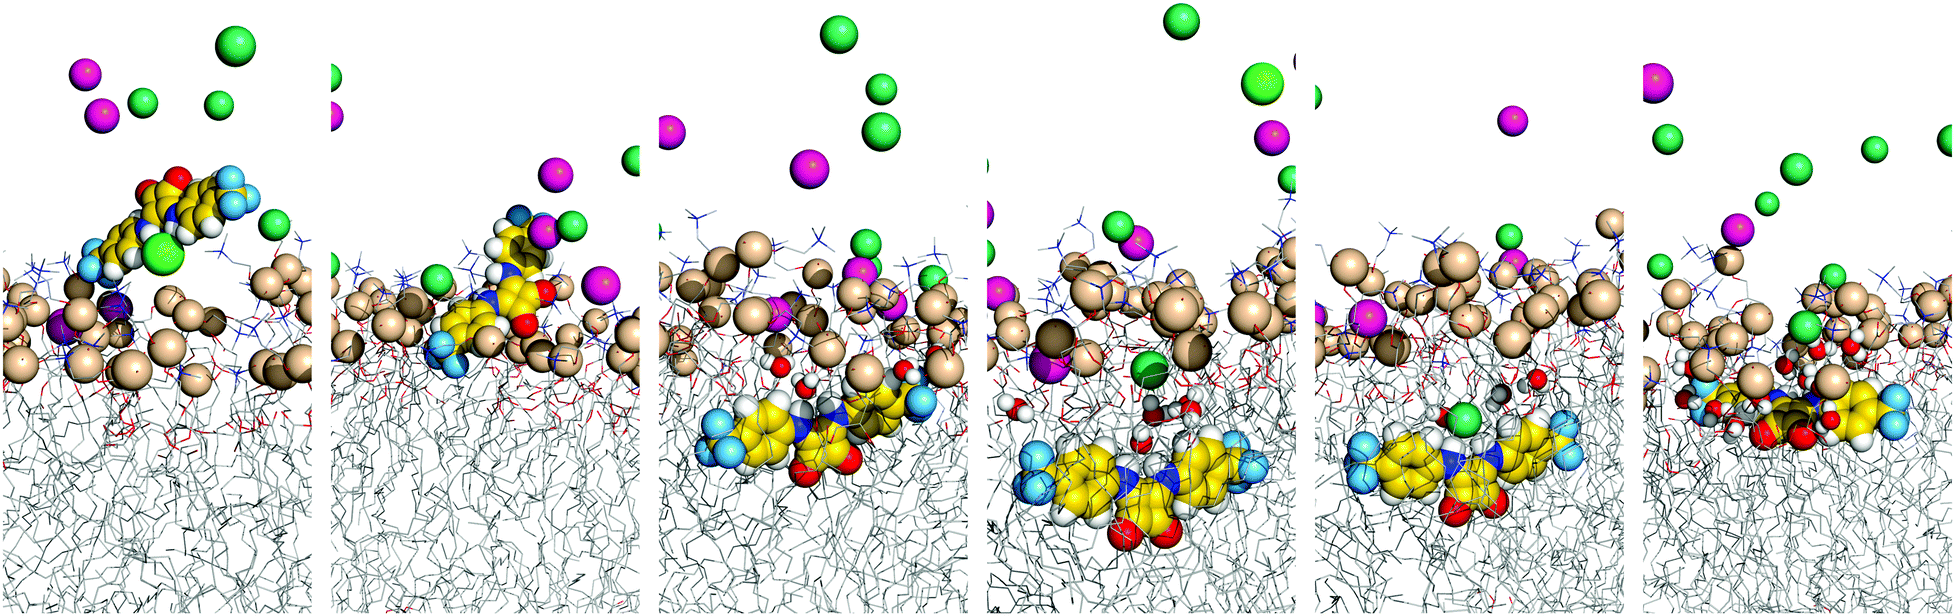 | ||
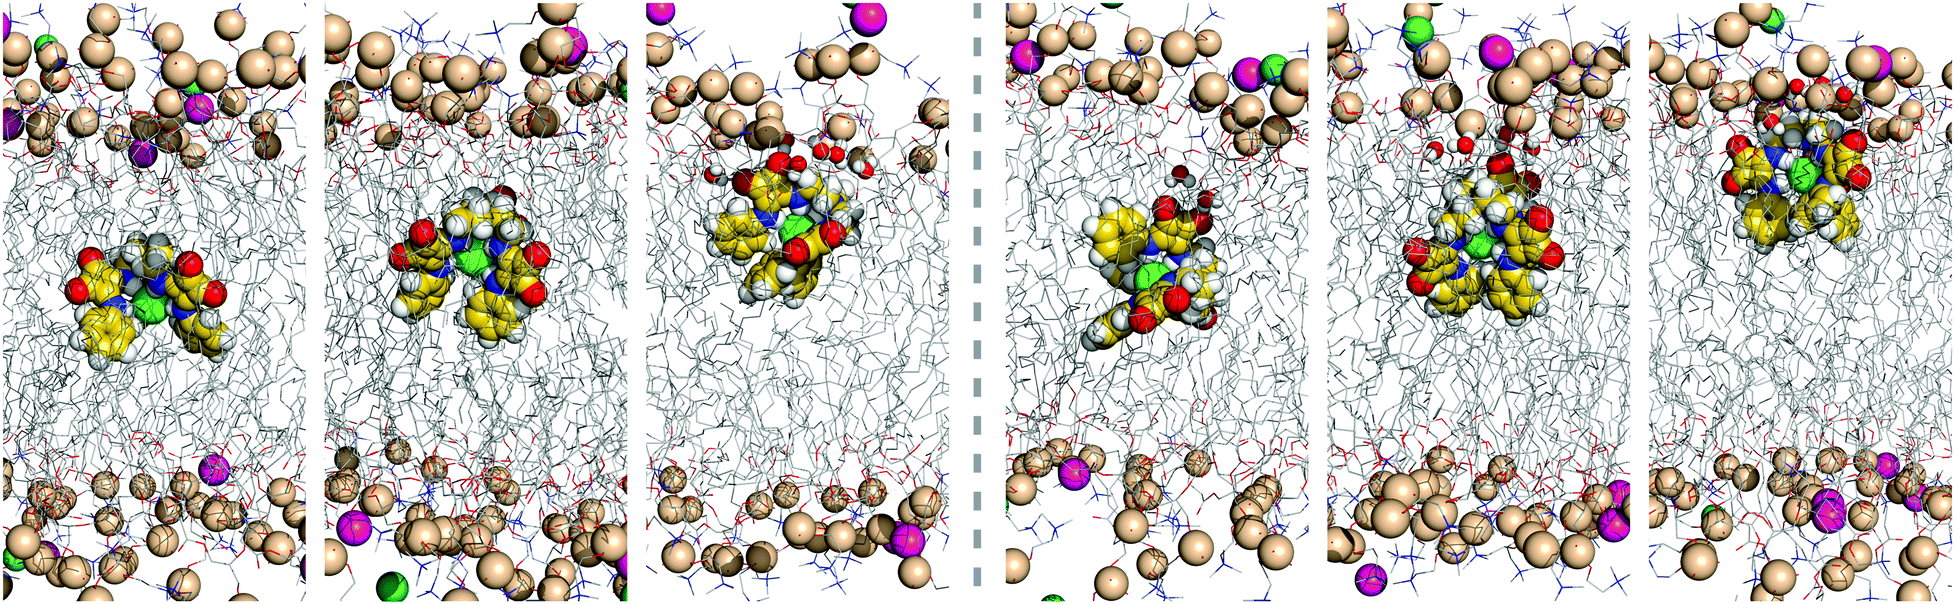
| Fig. 5 Consecutive snapshots depicting the diffusion of the chloride complex of A2 throughout MD simulation W1·A2. The squaramide derivative, sodium and chloride ions, together with the phosphorus atoms, are represented in spheres. The remaining atoms of the bilayer are shown as lines. The hydrogen atoms are shown in white, oxygen atoms in red, nitrogen atoms in blue, fluorine atoms in light blue, phosphorus atoms in wheat and carbon atoms in yellow (A2) or grey (phospholipids). The sodium ions are shown in pink and the chloride ions are shown in green (complex) or green marine (counter ions). The interaction of the internalised A2 with the solvent molecules is emphasised with the depiction of water molecules within 3.5 Å from A2 as spheres. Most water molecules and the lipids’ C–H bonds are omitted for clarity. | ||
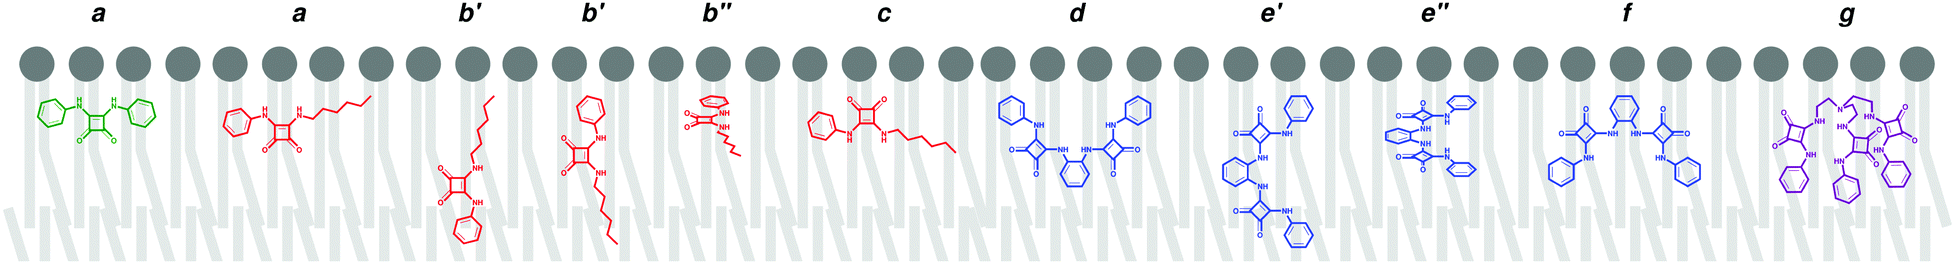 | ||
| Scheme 2 Spatial dispositions adopted by the squaramide derivatives with respect to the lipid bilayer. Each series is represented by their nonfluorinated analogue (A1 – green; B1 – red; C1 – blue; D1 – purple). | ||
Overall, the evolution of the N–H⋯Cl− (green line in Fig. 4 top and Fig. S55, ESI†) shows that the A-series squaramides can recognise chloride throughout the passive diffusion in the bilayer system. Indeed, it is noteworthy that A2, in MD simulation W1·A2, uptakes a solvated chloride ion for 10 ns (between the 93rd and 104th ns), while embedded in the membrane. This feature can be perceived by the increase of N–H⋯Cl− bonding interactions in Fig. 4 (top), for the above-mentioned period, as well as in the last panels of Fig. 5 and in Movie S1 (ESI†). However, in the second MD run of A2 in scenario W, and in both MD runs of A1 and A3 (see Fig. S55, ESI†), no chloride recognition events are observed after the internalisation of the small molecules. It is noteworthy that, in all these MD simulations, sporadic chloride recognition events in the water phase are monitored prior to the permeation of the water/lipid interface. The observed chloride uptake and release events are remarkable and show that these molecules have the potential to function as anion carriers. Moreover, the MD simulations suggest that the anion binding can either occur in the water phase or in the water/lipid interface (vide infra).
The B-series squaramides have an asymmetric structure, with the squaramide core decorated with an n-hexyl chain and a phenyl substituent accounting for different degrees of fluorination (videScheme 1) and lipophilicities. These two structural features dictate that additional dispositions to type a are adopted by this series of molecules in the phospholipid packed environment, as follows. In the MD simulations of the asymmetric squaramides B, in addition to the COCOM⋯Pint and N–HCOM⋯Pint distances, the distance between the centre of mass of the aromatic ring (PhCOM) and the closest Pint (PhCOM⋯Pint distance), was evaluated to ascertain the relative orientation of B1, B2 or B3 towards the water/lipid interface. The evolution of these distances throughout the two independent MD runs is plotted in Fig. S57 (ESI†). In the MD runs of the B-series in scenario W, after the water/lipid interface permeation, the squaramide core disposition of the free squaramide derivatives interchanges between type a and two other spatial dispositions, characterised by similar COCOM⋯Pint and N–HCOM⋯Pint distances (type b) or a shorter COCOM⋯Pint distance than the N–HCOM⋯Pint distance (type c).
Furthermore, the MD simulations have shown that the type b disposition must be subdivided in function of the PhCOM⋯Pint distance: in type b′ the squaramide core can be roughly perpendicular to the plane of the interface, while in type b′′ the squaramide core is almost parallel to the interface with three reference points approximately at the same distance to the interface. Furthermore, in type b′ the PhCOM is closer to or further from the closest membrane interface than the COCOM and N–HCOM reference points. The evolution of these distances is plotted in Fig. S57 (ESI†) and the relevant spatial dispositions observed for the B molecules are also sketched in Scheme 2 and illustrated in Fig. S58 (ESI†).
Overall, the analysis of the spatial dispositions can be related with the lipophilic character of the substituents present along these two series. Indeed, for the symmetric A-series, with equally lipophilic aromatic substituents, the main spatial disposition adopted is type a. On the other hand, in the asymmetric B-series, the different lipophilic nature of the substituents leads to a frequent exchange between spatial dispositions with the prevalence of type b ones. With the increase of the lipophilic character of the aromatic substituents (logP values: Ph = 2.05 < 4-CF3Ph = 2.93 < 3,5-(CF3)2Ph = 3.81),96 the n-hexyl substituent (logP = 2.88)96 is closer to the water/lipid interface, rather than being aligned with the phospholipid tails. Throughout their diffusion along the membrane system, likewise the A-series, the squaramide core of the B molecules interacts with the POPC head groups and water molecules via hydrogen bonds, as can be seen in Fig. S56 (ESI†).
Following the study of free A and B squaramides, the passive diffusion of their chloride complexes was also investigated for 200 ns using two Cl−⋯N distances restraints (scenario W′). As shown in Fig. S59 (ESI†), all complexes are able to permeate the water/lipid interface, staying below it until the end of simulation time, with the chloride widely exposed to a variable number of water molecules ranging between 0 and 9, as summarised in Table 3. On the other hand, the carbonyl moieties of the squaramide motifs, deeper in the POPC bilayer, have a negligible solvation.
| MD simulation | Solvated entity | ||
|---|---|---|---|
| Squaramide derivative | Carbonyl groupsb | Complexed chloride | |
|
a These parameters were evaluated throughout the last 100 ns of simulation time for the A-, B- and C-series, and the last 400 ns for the D-series.
b Sum of the number of water molecules around the independent CO groups.
c
N = 10000.
d The data from the two individual runs were concatenated and treated together, resulting in N = 20000.
e The data from the four individual runs (vertical and horizontal initial orientations) were concatenated and treated together, resulting in N = 160000. The complete statistics for the individual MD runs can be found in Table S10 (ESI).
|
|||
| W1′·A1c | 9.2 ± 3.6 | 0.4 ± 0.8 | 3.7 ± 1.0 |
| W1′·A2c | 7.2 ± 2.5 | 0.2 ± 0.5 | 3.9 ± 0.9 |
| W1′·A3c | 9.7 ± 10.4 | 0.6 ± 1.9 | 3.7 ± 1.1 |
| W1′·B1c | 8.3 ± 3.0 | 0.5 ± 0.8 | 3.5 ± 1.2 |
| W1′·B2c | 8.1 ± 3.1 | 0.3 ± 0.7 | 4.1 ± 1.1 |
| W1′·B3c | 10.1 ± 3.6 | 0.4 ± 0.7 | 3.8 ± 0.9 |
| M1′·A1c | 8.8 ± 3.0 | 0.4 ± 0.8 | 3.8 ± 1.0 |
| M1′·A2c | 6.6 ± 2.6 | 0.1 ± 0.5 | 3.5 ± 1.3 |
| M1′·A3c | 6.0 ± 2.7 | 0.0 ± 0.3 | 3.3 ± 1.0 |
| M1′·B1c | 10.0 ± 3.2 | 0.5 ± 0.8 | 4.2 ± 1.0 |
| M1′·B2c | 9.3 ± 2.7 | 0.6 ± 0.8 | 4.1 ± 0.9 |
| M1′·B3c | 8.9 ± 3.0 | 0.4 ± 0.6 | 3.9 ± 1.0 |
| M·C1d | 10.6 ± 3.2 | 1.5 ± 1.5 | 2.6 ± 0.9 |
| M·C2d | 9.8 ± 3.2 | 2.2 ± 1.8 | 2.4 ± 0.9 |
| M·C3d | 9.3 ± 3.2 | 2.1 ± 1.7 | 2.1 ± 0.8 |
| M·D1e | 9.5 ± 3.2 | 4.5 ± 2.3 | 0.1 ± 0.3 |
| M·D2e | 9.5 ± 2.9 | 4.2 ± 2.1 | 0.0 ± 0.2 |
| M·D3e | 9.1 ± 3.4 | 4.2 ± 2.3 | 0.1 ± 0.3 |
The ability of these two mono-squaramide series to assist chloride transport by passive diffusion across the phospholipid bilayer was also investigated with the anion complexes inserted into the bilayer core with a random spatial disposition (scenario M). The evolution of the COCOM⋯Pint and N–HCOM⋯Pint relative distances, plotted in Fig. S55 (ESI†) for squaramides A, shows that during the first ps of MD production runs, the complexes of this series reorient within the packed phospholipid environment adopting mainly a type a disposition. Subsequently, the chloride ion is released before the complex reaches the water/lipid interface, as indicated by the interruption of the N–H⋯Cl− interactions, also shown in Fig. S55 (green line) (ESI†), accompanied by few water molecules. Afterwards, the free A squaramides nest between the phospholipids preserving the type a disposition, as in the MD simulations in scenario W. This sequence of diffusion events is illustrated in Fig. S60 (ESI†) with selected snapshots obtained from simulation M1·A3. It is also noteworthy that in this MD run, a chloride ion is taken up by embedded A3, near the end of the MD simulation for a period of ca. 20 ns (see Fig. S55, S60 and Movie S2, ESI†). This is in line with the uptake event reported for simulation W1·A2 (vide supra), emphasising the hypothesis that anion binding can occur at the water/lipid interface, rather than in the water phase.
Likewise the A squaramide complexes, in the MD runs carried out with complexes of B-series squaramides in scenario M, the chloride release towards the aqueous phase is promoted by water molecules. Furthermore, the spatial disposition adopted by the B molecules exchange between types a, b and c (see Fig. S57, ESI†), corroborating the insights reported for the MD simulations where their complexes are initially positioned in the water phase (scenario W).
In the simulations carried out in the M′ scenario, the complexes promptly migrate to the water/lipid interface, as requested for the anion carrier mechanism. The complexes are disposed with the N–H binding units close to the interface (see Fig. S59, ESI†), the anion exposed to water molecules, and the CO pointing away from the aqueous phase (see Table 3).
In both MD runs of non-fluorinated bis-squaramide C1, its spatial disposition interchanges between types d, e′, e′′ and f. In contrast, for the fluorinated C2 and C3, the evolution of the N–HCOM⋯Pint, SpCOM⋯Pint and PhCOM⋯Pint distances indicates that these molecules adopt a type f spatial disposition with the hydrophobic substituents deeply embed into the bilayer. In addition, apart of MD simulation W1·C2, the chloride complexes are maintained throughout most of the simulation time, as illustrated in Fig. S61 and S63 (ESI†).
The diffusion of the chloride complexes of the C-series within the phospholipid bilayer was also investigated (scenario M), initially positioning the three anion complexes in the middle of the phospholipid molecules’ tails. Moreover, due to the bulk of these molecules, the complexes were lodged almost parallel to the water/lipid interface plane (type e′ disposition). All complexes promptly diffuse towards the interface, as seen in Fig. S61 (ESI†), and concomitantly reorient themselves, acquiring the same types of spatial dispositions as observed in MD simulations from the water phase (scenario W, vide supra). While the main spatial dispositions of C2 and C3 anion complexes are unequivocally of type f, non-fluorinated C1 adopted several spatial dispositions, as in scenario W. Overall, the complexes are highly hydrated when they reach the water/lipid interface (see Table 3), but the anion is firmly bound by the four cooperative N–H⋯Cl− interactions, which preclude the anion release to the water phase (see Fig. S61, ESI†). Thus, the MD simulations with the C-series in scenarios W′ and M′ were not undertaken. Moreover, these structural insights obtained at the atomistic level are entirely consistent with the moderate transport ability experimentally observed for this series of molecules, suggesting that the low activity is more likely due to the problematic release of chloride, rather than competition with phospholipid head group binding.
The three tripodal molecules exhibit equivalent diffusion behaviours, being able to permeate the interface and residing below it in a well-defined spatial disposition until the end of the simulation time (vide infra). This spatial disposition of type g (see Scheme 2) is characterised by the Ntren and N–H binding units near the interface level (orange and blue lines) and the aromatic substituents between the lipophilic tails (magenta line), as indicated by the evolution of the three relative distances for W1·D3 plotted in Fig. 6, with the number of hydrogen bonds to chloride. The passive diffusion of this tripodal complex is also depicted in Fig. 7 with six snapshots taken from W1·D3. Equivalent plots for the remaining run of D3 and for the MD runs of D1 and D2 are shown in Fig. S64 (ESI†).
 | ||
| Fig. 6 Evolution of Ntren⋯Pint (cyan dashed line), N–HCOM⋯Pint (blue dotted line), and PhCOM⋯Pint (purple dot-dashed line) distances throughout MD simulations W1·D3 (top) and M1·D1V (bottom). The evolution of the number of N–H⋯Cl− hydrogen bonds is also plotted as a green line. The water/lipid interface is represented as a black line at z = 0 Å. | ||
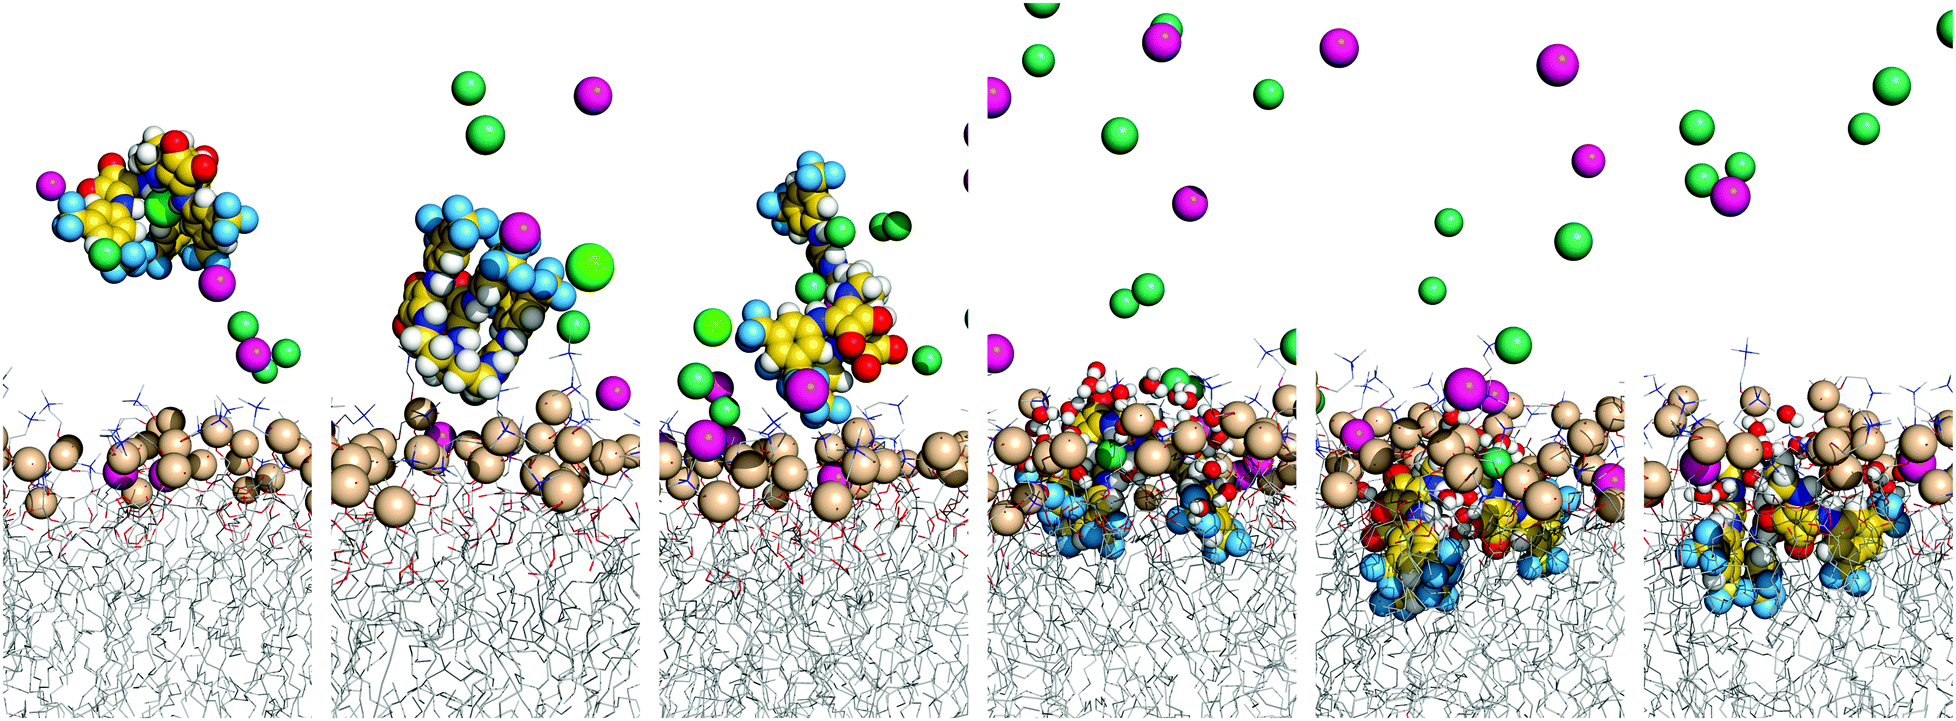 | ||
| Fig. 7 Consecutive snapshots depicting the diffusion of the chloride complex of D3 throughout MD simulation W1·D3. Remaining details as given in Fig. 5. | ||
Overall, the MD simulations of the D-series molecules are characterised by multiple chloride release and uptake events in the water phase, prior to the internalisation of the squaramide derivatives. However, due to the six convergent binding units, and higher value of VS,max, the initially complexed chloride is replaced by a hydrated chloride ion present in the system. Thus, in both MD runs of D1 in scenario W, the receptor enters the bilayer as chloride complex, which is preserved until the end of the MD simulation with up to six N–H⋯Cl− hydrogen bonds (see Fig. S64 and S65, ESI†). In contrast, in both MD runs of D2 and in simulation W2·D3, the tripodal molecule loses its chloride before penetrating the bilayer. On the other hand, in the first MD run of D3, the initial anion complex is maintained for a long period of time, ca. 61 ns, as the receptor lodges itself within the membrane, followed by the definitive anion release to the water phase. By the end of the MD sampling periods, all binding units of the internalised D2 and D3 are locked by hydrogen bonds established with lipid head groups, carbonyl groups of neighbouring squaramide moieties, or water molecules, as shown in Fig. S65 (ESI†), where the number of hydrogen bonds is plotted versus the relative position of the receptor along the membrane normal. Indeed, apart of simulations W2·D2 and W1·D3, the D-series molecules maintain the initial tripodal shape, characterised by three Ntren–C–C–N torsion angles of ca. ±60°, consistent with a ggg conformation, as thoroughly discussed in the ESI.†
Like the A-, B- and C-series of squaramide molecules, the ability of the tripodal molecules to assist with chloride diffusion within the phospholipid bilayer was also ascertained in scenario M. Initially, the anion complexes were inserted into the POPC bilayer with the C3 symmetry axis roughly parallel to the membrane normal. The variations on the Ntren⋯Pint, N–HCOM⋯Pint and PhCOM⋯Pint distances along with the number of N–H⋯Cl− hydrogen bonds, for the long production runs of 500 ns are plotted in Fig. 6, for the MD run M1·D1V, while the second run and the remaining MD simulations with D2 and D3 are represented in Fig. S67 (ESI†). The histograms of the Ntren–C–C–N torsion angles are plotted in Fig. S68 (ESI†). Equivalent results were obtained for all runs, as discussed for the M1·D1 run.
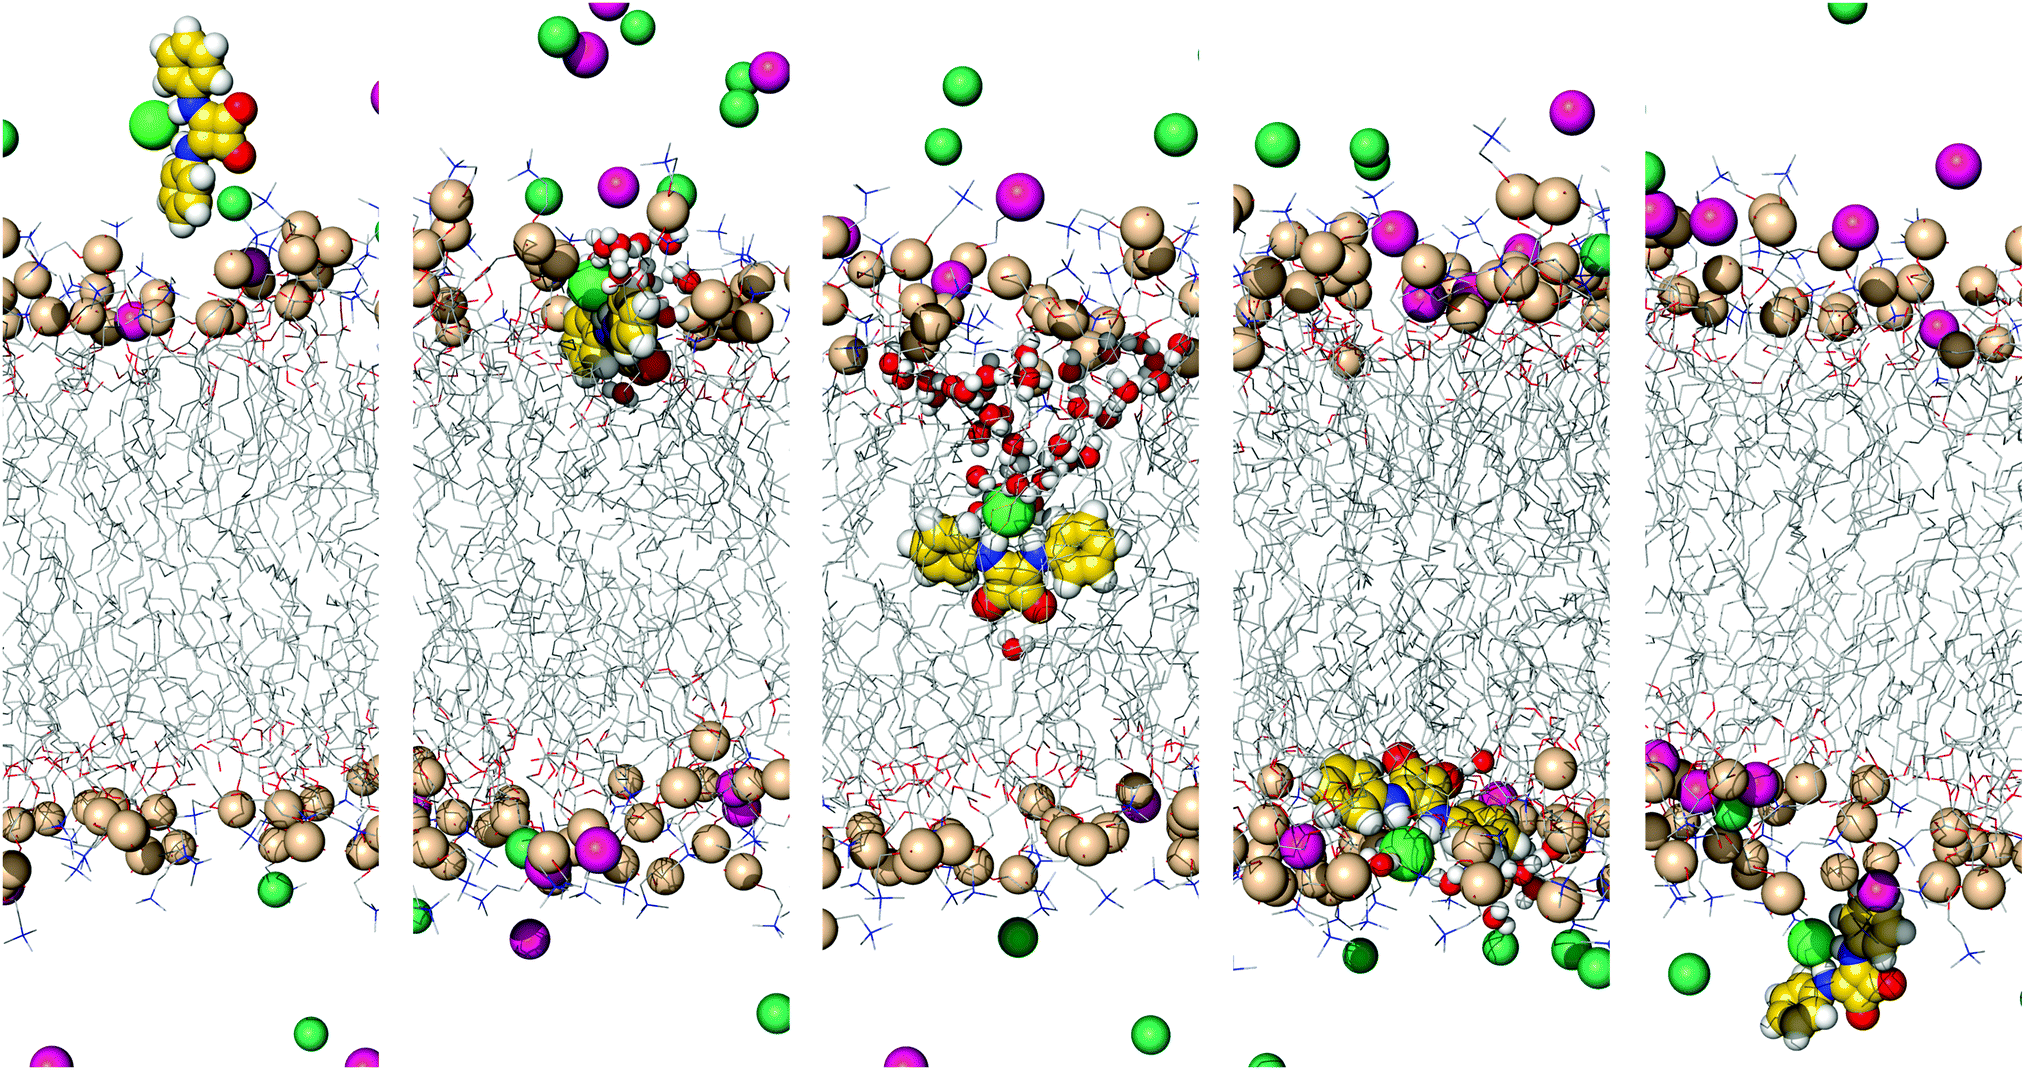
The complex D1·Cl− promptly diffuses towards the membrane interface with the phenyl groups pointing to the bilayer core, while the tripodal nitrogen atom and the carbonyl groups are closer to the water phase. This orientation is maintained until the end of the simulation time, with the ggg tripodal D1 receptor tightly bonded to chloride under the water/lipid interface. The pertinent diffusion events are illustrated in Fig. 8 (left) with three snapshots extracted from simulation M1·D1v. The carbonyl groups of the D-series molecules are exposed to the water phase, being solvated by an average number of water molecules ranging between 3.7 and 4.9 (see Table 3). In contrast, the complexed chloride is rarely visited by water molecules throughout the last 400 ns of simulation time. In other words, the combination of the tripodal shape and the orientation of the complex shelters the chloride from the water molecules. The final orientation of D1 is entirely consistent with the negative electrostatic potential around the polar carbonyl groups (vide supra) and the inherent lipophilic nature of the aromatic substituents of this tripodal molecule.
 | ||
| Fig. 8 Consecutive snapshots depicting the diffusion of the chloride complex of D1 throughout the first MD simulation run in scenario M: left – initial vertical orientation; right – initial horizontal orientation. Remaining details as given in Fig. 5. | ||
Having observed that the anion complexes of D have the ability to diffuse within the phospholipid bilayer, we decided to ascertain if the results reported above are dependent on the starting orientation of the tripodal anion complexes. Thus, the tripodal chloride complex was alternatively placed at the bilayer core with the C3 symmetry axis perpendicular to the bilayer normal. The current discussion will focus on M1·D1H, given that similar results were observed for the remaining MD run and simulated systems of D2 and D3. D1·Cl− promptly reorients itself during the first ns of the MD production run, concomitantly diffusing along the bilayer normal towards the water/lipid interface, as can be seen in Fig. S67 and S68 (ESI†) and with selected snapshots of this MD simulation in Fig. 8 (right). In other words, equivalent diffusion events were observed independently of the initial orientation of the complex inside of the phospholipid bilayer, affording a type g orientation. The different passive diffusion events of the A- and D-series are shown in Movies S3 and S4 (ESI†), respectively. As the D-series is able to permeate the water/lipid interface complexed to chloride and is unable to release it when placed in the membrane core, the MD simulations in scenarios W′ and M′ were not undertaken.
In summary, the tripodal chloride complexes are preserved during the extensive 6 μs sampling period of scenario M simulations, which is entirely consistent with the inability of this series to operate the chloride transport, as experimentally observed. In other words, if these tripodal molecules are able to take up a chloride ion at the interface (as observed in some MD simulations of scenario W), it is very unlikely that the chloride release to the water phase can occur, as required by an anion carrier mechanism. Furthermore, the MD insights suggest that the lack of transport activity is mainly due to the sheltering tripodal architecture synergistically associated with a superior binding affinity of the D molecules for chloride ion, which is characterised by higher VS,max values inside of its tripodal conformation.
Free energy calculations: steered molecular dynamics and umbrella sampling simulations
The energetic barriers associated with the anion transmembrane transport for the A-series, the most active anion transporters, were estimated from the Potential of Mean Force (PMF) profiles obtained by combining US simulations and the Weighted Histogram Analysis Method (WHAM).97–99 The US simulations were preceded by SMD simulations to generate the starting positions of the three A free squaramides and their chloride complexes along the membrane normal (vide supra).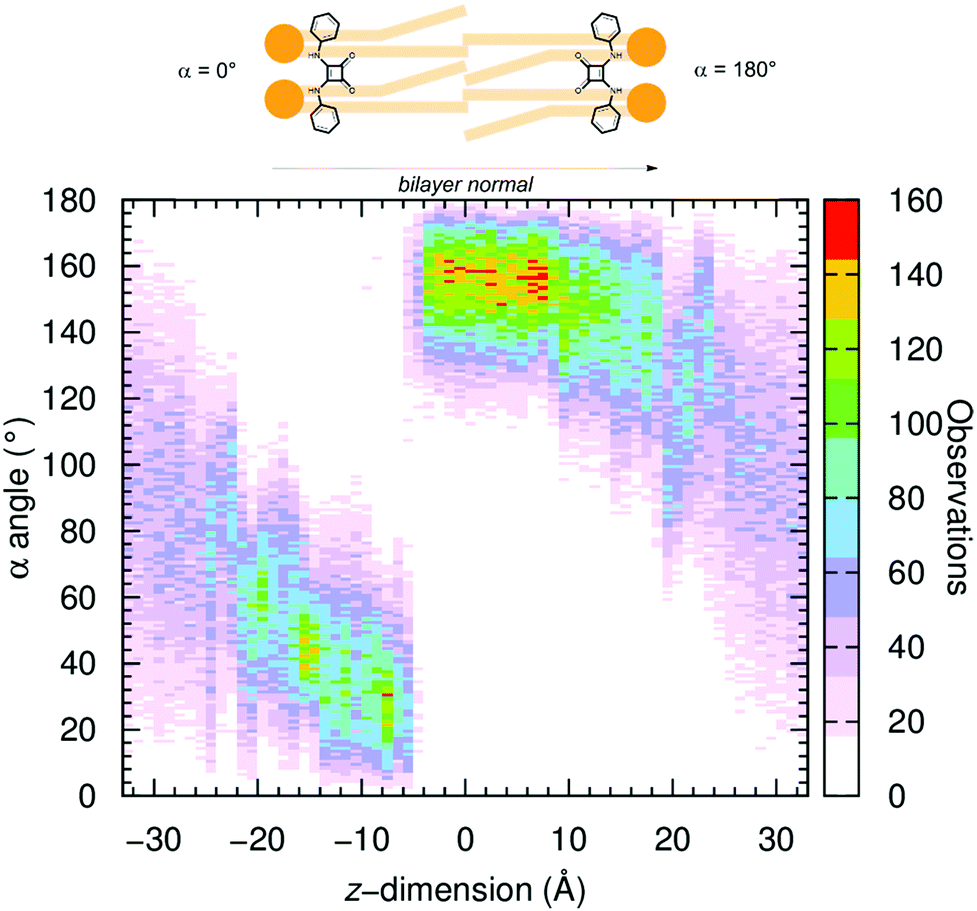 | ||
| Fig. 9 2D histogram created from the α angle values monitored along the z-dimension position of the chloride complex of A1 throughout the 67 independent US windows. The colour ranges from white (no occurrence) to red (120 occurrences). | ||
The α angle was histogrammed along the z-dimension for all systems and is plotted in Fig. 9 for US simulations of A1·Cl− and in Fig. S70 (ESI†) with the five remaining systems. Overall, in the water phase (for z-dimension values under ca. −20 and above +20 Å), as expected, the squaramide derivatives adopt an undefined orientation in either free or complexed form. On the other hand, in the US windows comprised between −20 and +20 Å, where the transporters are found within the POPC bilayer and restricted by the highly-packed lipid molecules, the α angles assume values close to 0° or to 180°. In other words, during the US simulations’ equilibration period, the molecules reoriented themselves, with the N–H binding units always pointing to one of the water/lipid interfaces. This spatial orientation corresponds to a type a disposition previously observed in the passive diffusion MD simulations (vide supra), as illustrated in Fig. 10 with snapshots taken from different US windows and in Movie S5 (ESI†). Consequently, these snapshots also enlighten the putative anion carrier mechanism proposed for these synthetic drug-like molecules.
 | ||
| Fig. 10 Illustrative snapshots depicting the orientation of A1·Cl− in the US windows at z = −30, −15, 0, 15 and 30 Å (from left to right). Remaining details as given in Fig. 5. | ||
The PMF profiles along the membrane normal were estimated for the three molecules of the A-series, in their free and chloride complexed forms. For energetic comparison purposes, the PMF of a single free chloride was also estimated in the pure bilayer model used in this work. The energy profiles, normalised to zero in bulk water (+33 Å) and estimated spanning the whole membrane model are shown in Fig. 11, for the free transporters (top) and for their chloride complexes (bottom), together with the free chloride. The individual profiles with the corresponding errors, estimated with Monte Carlo Bootstrap analysis determined from 1000 random trials,100 are shown in Fig. S101–S103 (ESI†). The PMF profiles, spanning the membrane, are asymmetric indicating that the entry and the exit of the POPC bilayer is accompanied by different interactions with water molecules and/or phospholipids,101 regardless of the orientation of the squaramide derivatives. The interactions of the small synthetic transporters with the water/lipid interface are discussed below. Each US sampling window was simulated for 50 ns, with the last 20 ns being used to estimate the PMF profiles of the six systems, amounting to 1.34 μs of sampling per system. The initial 30 ns were discarded as equilibration period, given that the PMF profiles only converged after this period as shown in Fig. S73 (ESI†). On the other hand, for the free chloride, the US simulations were 25 ns long with the initial 15 ns corresponding to the equilibration period.
 | ||
| Fig. 11 PMF as a function of the A squaramides’ distance to the membrane COM (z = 0 Å), for the free squaramides (top) and for the chloride complexes (bottom). The red dashed lines, blue dotted lines and purple dot-dashed lines correspond to A1, A2 and A3, in this order, while the green solid line corresponds to the PMF of a free chloride. | ||
Overall, the profiles of the three complexes show that the three receptors lower the energetic barrier for the transmembrane transport of chloride, when compared with the free anion profile, thus being able to facilitate chloride transport as anion carriers. The presence of free A2 and A3 in bulk water after exiting the POPC bilayer (z = −33 Å) appears to be disfavoured by ca. 2 kcal mol−1 when compared to the opposite water phase (z = +33 Å). This small energy hysteresis is acceptable for these solvated molecules, given that in the PMF calculated for the membrane spanning of the smaller and neutral urea molecule, even with sampling times of 4.32 μs, an energy difference of ca. 1.5 kcal mol−1 was still present.102 The energy profiles are divided in four zones, identified in Fig. 11: (a) recognition and penetration of the bilayer, leading to the first basin; (b) the energetic barrier associated with diffusion within the highly-packed bilayer medium; (c) the second basin, after the core of the bilayer; and (d) before the protrusion of the opposite water/lipid interface.
The diffusion of the A1 chloride complex is favoured by 6.4 kcal mol−1 at z = 9.4 Å, i.e., when the complex is nested just below the water/lipid interface and surrounded by few water molecules (zone a). The diffusion of the complex within the phospholipids’ aliphatic tails (zone b), towards the bilayer core, naturally results in the increase of the energy barrier to a maximum of ca. 7.7 kcal mol−1 at z = −4.4 Å. The approach to the opposite water/lipid interface (zones c and d) is accompanied by the decrease of energy to −3.2 kcal mol−1 at z = −16.6 Å, as the complex is solvated with water molecules coming from the closest aqueous phase (see Fig. 10, with 5 snapshots). The energy profile of A2's chloride complex mirrors the PMF of A1·Cl−, with the entry being lowered by 12.1 kcal mol−1, at z = 8.3 Å. The energy increases from −12.1 to 1.8 kcal mol−1 when the complex is positioned at z = −6.1 Å. In contrast, the PMF of A3's chloride complex displays an energetic profile with two deep basins (zones a and c), at similar distances from the bilayer core (ca. 13 Å), with energy minima of ca. −9.3 kcal mol−1 relative to the water phase. Between these basins, the maximum of −1.1 kcal mol−1 occurs at z = −1.4 Å (zone b). This odd energy profile should be intimately linked with the higher lipophilic character of A3 when compared with the other two analogous. This complex “feels better” within the phospholipid environment and needs to overcome an energetic barrier of ca. 10 kcal mol−1 to leave the bilayer from z = −13.2 Å (zone d). At a similar position, the less lipophilic complexes need only to overcome barriers of 3.2 (A1·Cl−) or 5.4 (A2·Cl−) kcal mol−1 barrier. In other words, while A1·Cl− and A2·Cl− have low energetic barriers to exit the bilayer, A3·Cl− has to surmount a larger energy barrier to reach the water phase. In addition, A2·Cl− has a smaller energetic barrier to cross the bilayer core, most likely due to its lipophilic character. These results indicate that A2 should be energetically favoured to assist the chloride transport when compared with the analogous A1 and A3, which is in line with the experimental transport studies.
The energy profiles associated with the diffusion of the free squaramide derivatives across the POPC bilayer are quite similar. In zone a, it is evident that all receptors’ penetration of the bilayer is energetically driven, being favoured by 5.6 kcal mol−1 for A1, by 10.4 kcal mol−1 for A2 and by 12.9 kcal mol−1 for A3. These results are in line with the MD simulation carried out in scenario W, in which the permeation of the water/lipid interface is accompanied by hydrogen bonding interactions to the phospholipid head groups and water molecules. Free A1, A2 and A3 face comparable energy barriers of 9.9, 12.6 kcal, 10.8 kcal mol−1, in this order, to surmount the bilayer core. After the energetic barrier, the energy drop to the second basin is of 8.3 kcal mol−1 for A1, while A2 and A3 are favoured by 7.1 and 5.8 kcal mol−1, respectively, to stay in the basin of zone c. Despite the different energetic profiles in zones a to c, receptors A1 and A2 show low energetic barriers to exit the bilayer, 3.6 and 6.5 kcal mol−1 respectively, as also observed for their anion associations. On the other hand, free A3 has to overcome a higher energy barrier of ca. 8.7 kcal mol−1 to leave the bilayer. These profiles show that the differences between free A1 and A2 to span the bilayer are quite small, while A3, the most lipophilic molecule, faces several energetic barriers to go from one side of the bilayer to the other.
In summary, these energetic outcomes suggest that squaramides A1–A3 should operate the anion transport event without leaving the phospholipid bilayer, shuttling between both water/lipid interfaces. In this context, the anion transport by A2 is thermodynamically favoured when compared with A1 and A3.
Conclusions
Squaramide series C and D, with four and six convergent binding sites respectively, have higher E2 and VS,max values, and therefore, higher binding affinities for chloride. Overall, the MD simulations showed that these series’ molecules are able to recognise and release chloride ions in the water phase and to permeate the water/lipid interface as anion complexes. However, when the chloride complexes of C and D are initially positioned in the bilayer core they promptly diffuse towards the membrane interface and are maintained throughout the simulation length. Given that the chloride uptake and release events are condiciones sine quibus non for a small drug-like molecule to operate as an anion carrier, these structural insights are entirely consistent with the absence of experimental transport activity for squaramide derivatives D. The encapsulated chloride is sheltered from the water molecules by the tripodal scaffold architecture of these receptors, as shown by the negligible number of water molecules surrounding the encapsulated anion (see Table 3). The C-series molecules also tightly held chloride, but its hydration is higher than in the D-series, hinting that the release of the anion is more likely, although it has not been observed in the reported MD simulations, but is suggested by the experimental findings.The A-series molecules, with more moderate E2 and VS,max values, when located below the phospholipid interface, adopt well-defined spatial dispositions with the N–H binding units pointing to the water phase. This orientation enables sporadic exchange of the hydrogen bonded phosphate head groups or water molecules with chloride ions taken from the water phase. In contrast, the B-series molecules, with overall lower E2 and VS,max values, are also able to bind chloride in water, but, after penetration, due to their asymmetric nature, are unable to preserve a well-defined orientation consistent with occurrence of further chloride uptake events. These insights suggest that the A-series molecules are better anion carriers than B, corroborating the experimental transport data.
Our PMF calculations have unequivocally indicated that the chloride transport across the phospholipid bilayer is energetically favoured by the A-series’ molecules when compared with its unassisted translocation. The energy profiles of the free A1–A3 on positive z-dimension values follow their lipophilicities. For the chloride complexes of these three linear transporters, there is no significant energetic differences for their diffusions until the membrane core.
The experimental anion transport studies in liposomes indicate that the A-series mono-squaramides undoubtedly assist the chloride efflux, mainly through an Cl−/NO3− antiport mechanism. Although this feature was not theoretically investigated, our MD simulations shows that these carriers are able to easily shuttle within the hydrophobic medium of the phospholipid bilayer as free transporters or as chloride complexes. Furthermore, the chloride uptake and release events can occur in the water phase or, alternatively and more likely, with the squaramides nested at the water/lipid interface level, without surmounting the energy barrier associated with the transporter's membrane exit.
Author contributions
P. A. G. and V. F. devised the project. I. M. and P. M. R. C. carried out the MD simulations and DFT calculations. I. M. and M. Q. M. analysed the simulations data. N. B., E. N. W. H., H. J. C., and C. J. E. H. synthesised and characterised the compounds, performed the ion-binding studies, and the ion-transport studies in liposomes. I. L. K. collected the single-crystal X-ray data and determined the structures. A. M. R. and R. P. T. performed the biological studies. I. M., N. B. wrote the manuscript together with P. A. G. and V. F.Conflicts of interest
There are no conflicts to declare.Acknowledgements
The theoretical studies were supported by projects P2020-PTDC/QEQ-SUP/4283/2014 and CICECO – Aveiro Institute of Materials (UID/CTM/50011/2013), financed by National Funds through the FCT/MEC and co-financed by QREN-FEDER through COMPETE under the PT2020 Partnership Agreement. I. M. acknowledges FCT for PhD scholarship SFRH/BD/87520/2012. P. A. G. acknowledges the EPSRC for postdoctoral fellowships (EP/J009687/1 to N. B. and E. N. W. H.) and the Royal Society and the Wolfson Foundation for a Research Merit Award. P. A. G. also thanks for the University of Sydney for postdoctoral funding (E. N. W. H.) and the ARC for funding (DP170100118, DP180100612 and LE180100050). The in vitro studies were supported by grants from the Spanish government and the EU (FIS PI13/00089) and La Marato de TV3 Foundation (20132730).Notes and references
- G. G. Celesia, Clin. Neurophysiol., 2001, 112, 2–18 CrossRef PubMed.
- J. LaRusch, J. Jung, I. J. General, M. D. Lewis, H. W. Park, R. E. Brand, A. Gelrud, M. A. Anderson, P. A. Banks, D. Conwell, C. Lawrence, J. Romagnuolo, J. Baillie, S. Alkaade, G. Cote, T. B. Gardner, S. T. Amann, A. Slivka, B. Sandhu, A. Aloe, M. L. Kienholz, D. Yadav, M. M. Barmada, I. Bahar, M. G. Lee, D. C. Whitcomb and North American Pancreatitis Study Group, PLoS Genet., 2014, 10, e1004376 CrossRef PubMed.
- R. Planells-Cases and T. J. Jentsch, Biochim. Biophys. Acta, 2009, 1792, 173–189 CrossRef PubMed.
- P. A. Gale, Coord. Chem. Rev., 2000, 199, 181–233 CrossRef.
- P. D. Beer and P. A. Gale, Angew. Chem., Int. Ed., 2001, 40, 486–516 CrossRef PubMed.
- P. A. Gale, Coord. Chem. Rev., 2001, 213, 79–128 CrossRef.
- P. A. Gale, Coord. Chem. Rev., 2003, 240, 191–221 CrossRef.
- P. A. Gale and R. Quesada, Coord. Chem. Rev., 2006, 250, 3219–3244 CrossRef.
- A. P. Davis, D. N. Sheppard and B. D. Smith, Chem. Soc. Rev., 2007, 36, 348–357 RSC.
- P. A. Gale, S. E. Garcia-Garrido and J. Garric, Chem. Soc. Rev., 2008, 37, 151–190 RSC.
- C. Caltagirone and P. A. Gale, Chem. Soc. Rev., 2009, 38, 520–563 RSC.
- P. A. Gale, Chem. Soc. Rev., 2010, 39, 3746–3771 RSC.
- J. T. Davis, O. Okunola and R. Quesada, Chem. Soc. Rev., 2010, 39, 3843–3862 RSC.
- S. Matile, A. Vargas Jentzsch, J. Montenegro and A. Fin, Chem. Soc. Rev., 2011, 40, 2453–2474 RSC.
- M. Wenzel, J. R. Hiscock and P. A. Gale, Chem. Soc. Rev., 2012, 41, 480–520 RSC.
- N. Sakai and S. Matile, Langmuir, 2013, 29, 9031–9040 CrossRef PubMed.
- P. A. Gale, N. Busschaert, C. J. Haynes, L. E. Karagiannidis and I. L. Kirby, Chem. Soc. Rev., 2014, 43, 205–241 RSC.
- P. A. Gale, E. N. W. Howe and X. Wu, Chem, 2016, 1, 351–422 Search PubMed.
- P. A. Gale, J. T. Davis and R. Quesada, Chem. Soc. Rev., 2017, 46, 2497–2519 RSC.
- P. A. Gale, E. N. W. Howe, X. Wu and M. J. Spooner, Coord. Chem. Rev., 2018 DOI:10.1016/j.ccr.2018.02.005.
- A. J. Ayling, M. N. Perez-Payan and A. P. Davis, J. Am. Chem. Soc., 2001, 123, 12716–12717 CrossRef PubMed.
- L. W. Judd and A. P. Davis, Chem. Commun., 2010, 46, 2227–2229 RSC.
- N. Busschaert, P. A. Gale, C. J. Haynes, M. E. Light, S. J. Moore, C. C. Tong, J. T. Davis and W. A. Harrell, Jr., Chem. Commun., 2010, 46, 6252–6254 RSC.
- N. Busschaert, M. Wenzel, M. E. Light, P. Iglesias-Hernandez, R. Perez-Tomas and P. A. Gale, J. Am. Chem. Soc., 2011, 133, 14136–14148 CrossRef PubMed.
- M. J. Spooner and P. A. Gale, Supramol. Chem., 2018, 30, 514–519 CrossRef.
- L. Jowett, E. Howe, X. Wu, N. Busschaert and P. A. Gale, Chem. – Eur. J., 2018 DOI:10.1002/chem.201801463.
- B. Diaz de Grenu, P. Iglesias Hernandez, M. Espona, D. Quinonero, M. E. Light, T. Torroba, R. Perez-Tomas and R. Quesada, Chem. – Eur. J., 2011, 17, 14074–14083 CrossRef PubMed.
- E. Hernando, V. Soto-Cerrato, S. Cortes-Arroyo, R. Perez-Tomas and R. Quesada, Org. Biomol. Chem., 2014, 12, 1771–1778 RSC.
- P. Manuel-Manresa, L. Korrodi-Gregorio, E. Hernando, A. Villanueva, D. Martinez-Garcia, A. M. Rodilla, R. Ramos, M. Fardilha, J. Moya, R. Quesada, V. Soto-Cerrato and R. Perez-Tomas, Mol. Cancer Ther., 2017, 16, 1224–1235 CrossRef PubMed.
- S. J. Moore, C. J. E. Haynes, J. Gonzalez, J. L. Sutton, S. J. Brooks, M. E. Light, J. Herniman, G. J. Langley, V. Soto-Cerrato, R. Perez-Tomas, I. Marques, P. J. Costa, V. Félix and P. A. Gale, Chem. Sci., 2013, 4, 103–117 RSC.
- L. E. Karagiannidis, C. J. Haynes, K. J. Holder, I. L. Kirby, S. J. Moore, N. J. Wells and P. A. Gale, Chem. Commun., 2014, 50, 12050–12053 RSC.
- C. M. Dias, H. Li, H. Valkenier, L. E. Karagiannidis, P. A. Gale, D. N. Sheppard and A. P. Davis, Org. Biomol. Chem., 2018, 16, 1083–1087 RSC.
- C. C. Tong, R. Quesada, J. L. Sessler and P. A. Gale, Chem. Commun., 2008, 6321–6323 RSC.
- M. G. Fisher, P. A. Gale, J. R. Hiscock, M. B. Hursthouse, M. E. Light, F. P. Schmidtchen and C. C. Tong, Chem. Commun., 2009, 3017–3019 RSC.
- P. A. Gale, C. C. Tong, C. J. Haynes, O. Adeosun, D. E. Gross, E. Karnas, E. M. Sedenberg, R. Quesada and J. L. Sessler, J. Am. Chem. Soc., 2010, 132, 3240–3241 CrossRef PubMed.
- M. Yano, C. C. Tong, M. E. Light, F. P. Schmidtchen and P. A. Gale, Org. Biomol. Chem., 2010, 8, 4356–4363 RSC.
- V. Gorteau, G. Bollot, J. Mareda, A. Perez-Velasco and S. Matile, J. Am. Chem. Soc., 2006, 128, 14788–14789 CrossRef PubMed.
- V. Gorteau, G. Bollot, J. Mareda and S. Matile, Org. Biomol. Chem., 2007, 5, 3000–3012 RSC.
- J. Mareda and S. Matile, Chem. – Eur. J., 2009, 15, 28–37 CrossRef PubMed.
- A. V. Jentzsch, D. Emery, J. Mareda, S. K. Nayak, P. Metrangolo, G. Resnati, N. Sakai and S. Matile, Nat. Commun., 2012, 3, 905 CrossRef PubMed.
- A. Vargas Jentzsch, A. Hennig, J. Mareda and S. Matile, Acc. Chem. Res., 2013, 46, 2791–2800 CrossRef PubMed.
- A. Vargas Jentzsch and S. Matile, J. Am. Chem. Soc., 2013, 135, 5302–5303 CrossRef PubMed.
- A. V. Jentzsch and S. Matile, Top. Curr. Chem., 2015, 358, 205–239 CrossRef PubMed.
- S. Benz, M. Macchione, Q. Verolet, J. Mareda, N. Sakai and S. Matile, J. Am. Chem. Soc., 2016, 138, 9093–9096 CrossRef PubMed.
- S. Tomas, M. C. Rotger, J. F. Gonzalez, P. M. Deya, P. Ballester and A. Costa, Tetrahedron Lett., 1995, 36, 2523–2526 CrossRef.
- J. O. Morley, THEOCHEM, 1995, 357, 49–57 CrossRef.
- R. Prohens, S. Tomas, J. Morey, P. M. Deya, P. Ballester and A. Costa, Tetrahedron Lett., 1998, 39, 1063–1066 CrossRef.
- D. Quinonero, A. Frontera, G. A. Suner, J. Morey, A. Costa, P. Ballester and P. M. Deya, Chem. Phys. Lett., 2000, 326, 247–254 CrossRef.
- D. Quinonero, A. Frontera, P. Ballester and P. M. Deya, Tetrahedron Lett., 2000, 41, 2001–2005 CrossRef.
- R. Prohens, M. C. Rotger, M. N. Pina, P. M. Deya, J. Morey, P. Ballester and A. Costa, Tetrahedron Lett., 2001, 42, 4933–4936 CrossRef.
- D. Quinonero, R. Prohens, C. Garau, A. Frontera, P. Ballester, A. Costa and P. M. Deya, Chem. Phys. Lett., 2002, 351, 115–120 CrossRef.
- M. Neus Piña, M. Carmen Rotger, A. Costa, P. Ballester and P. M. Deyà, Tetrahedron Lett., 2004, 45, 3749–3752 CrossRef.
- V. Ramalingam, M. E. Domaradzki, S. Jang and R. S. Muthyala, Org. Lett., 2008, 10, 3315–3318 CrossRef PubMed.
- A. Rostami, A. Colin, X. Y. Li, M. G. Chudzinski, A. J. Lough and M. S. Taylor, J. Org. Chem., 2010, 75, 3983–3992 CrossRef PubMed.
- V. Amendola, G. Bergamaschi, M. Boiocchi, L. Fabbrizzi and M. Milani, Chem. – Eur. J., 2010, 16, 4368–4380 CrossRef PubMed.
- A. Rostami, C. J. Wei, G. Guerin and M. S. Taylor, Angew. Chem., Int. Ed., 2011, 50, 2059–2062 CrossRef PubMed.
- B. W. Gung and S. C. Schlitzer, Tetrahedron Lett., 2015, 56, 5043–5047 CrossRef.
- J. A. Butera, M. M. Antane, S. A. Antane, T. M. Argentieri, C. Freeden, R. F. Graceffa, B. H. Hirth, D. Jenkins, J. R. Lennox, E. Matelan, N. W. Norton, D. Quagliato, J. H. Sheldon, W. Spinelli, D. Warga, A. Wojdan and M. Woods, J. Med. Chem., 2000, 43, 1187–1202 CrossRef PubMed.
- J. A. Butera, D. J. Jenkins, J. R. Lennox, J. H. Sheldon, N. W. Norton, D. Warga and T. M. Argentieri, Bioorg. Med. Chem. Lett., 2005, 15, 2495–2501 CrossRef PubMed.
- R. I. Storer, C. Aciro and L. H. Jones, Chem. Soc. Rev., 2011, 40, 2330–2346 RSC.
- P. M. Gloria, J. Gut, L. M. Goncalves, P. J. Rosenthal, R. Moreira and M. M. Santos, Bioorg. Med. Chem., 2011, 19, 7635–7642 CrossRef PubMed.
- T. S. Elliott, A. Slowey, Y. L. Ye and S. J. Conway, MedChemComm, 2012, 3, 735–751 RSC.
- S. P. Kumar, P. M. C. Glória, L. M. Gonçalves, J. Gut, P. J. Rosenthal, R. Moreira and M. M. M. Santos, MedChemComm, 2012, 3, 489–493 RSC.
- N. Busschaert, I. L. Kirby, S. Young, S. J. Coles, P. N. Horton, M. E. Light and P. A. Gale, Angew. Chem., Int. Ed., 2012, 51, 4426–4430 CrossRef PubMed.
- X. Wu, N. Busschaert, N. J. Wells, Y. B. Jiang and P. A. Gale, J. Am. Chem. Soc., 2015, 137, 1476–1484 CrossRef PubMed.
- S. J. Edwards, H. Valkenier, N. Busschaert, P. A. Gale and A. P. Davis, Angew. Chem., Int. Ed., 2015, 54, 4592–4596 CrossRef PubMed.
- N. Busschaert, R. B. Elmes, D. D. Czech, X. Wu, I. L. Kirby, E. M. Peck, K. D. Hendzel, S. K. Shaw, B. Chan, B. D. Smith, K. A. Jolliffe and P. A. Gale, Chem. Sci., 2014, 5, 3617–3626 RSC.
- M. Chavent, A. L. Duncan and M. S. Sansom, Curr. Opin. Struct. Biol., 2016, 40, 8–16 CrossRef PubMed.
- S. M. Loverde, J. Phys. Chem. Lett., 2014, 5, 1659–1665 CrossRef PubMed.
- W. Khuntawee, P. Wolschann, T. Rungrotmongkol, J. Wong-Ekkabut and S. Hannongbua, J. Chem. Inf. Model., 2015, 55, 1894–1902 CrossRef PubMed.
- C. J. E. Haynes, S. J. Moore, J. R. Hiscock, I. Marques, P. J. Costa, V. Félix and P. A. Gale, Chem. Sci., 2012, 3, 1436–1444 RSC.
- P. J. Costa, I. Marques and V. Félix, Biochim. Biophys. Acta, 2014, 1838, 890–901 CrossRef PubMed.
- I. Marques, A. R. Colaco, P. J. Costa, N. Busschaert, P. A. Gale and V. Félix, Soft Matter, 2014, 10, 3608–3621 RSC.
- S. J. Edwards, I. Marques, C. M. Dias, R. A. Tromans, N. R. Lees, V. Félix, H. Valkenier and A. P. Davis, Chem. – Eur. J., 2016, 22, 2004–2011 CrossRef PubMed.
- N. Busschaert, S. H. Park, K. H. Baek, Y. P. Choi, J. Park, E. N. W. Howe, J. R. Hiscock, L. E. Karagiannidis, I. Marques, V. Félix, W. Namkung, J. L. Sessler, P. A. Gale and I. Shin, Nat. Chem., 2017, 9, 667–675 CrossRef PubMed.
- C. Jin, M. Zhang, L. Wu, Y. Guan, Y. Pan, J. Jiang, C. Lin and L. Wang, Chem. Commun., 2013, 49, 2025–2027 RSC.
- N. Busschaert and P. A. Gale, Angew. Chem., Int. Ed., 2013, 52, 1374–1382 CrossRef PubMed.
- C. Jin, M. Zhang, C. Deng, Y. F. Guan, J. Gong, D. R. Zhu, Y. Pan, J. L. Jiang and L. Y. Wang, Tetrahedron Lett., 2013, 54, 796–801 CrossRef.
- Y. Liu, Y. Qin and D. Jiang, Analyst, 2015, 140, 5317–5323 RSC.
- M. J. Frisch, G. W. Trucks, H. B. Schlegel, G. E. Scuseria, M. A. Robb, J. R. Cheeseman, G. Scalmani, V. Barone, B. Mennucci, G. A. Petersson, H. Nakatsuji, M. Caricato, X. Li, H. P. Hratchian, A. F. Izmaylov, J. Bloino, G. Zheng, J. L. Sonnenberg, M. Hada, M. Ehara, K. Toyota, R. Fukuda, J. Hasegawa, M. Ishida, T. Nakajima, Y. Honda, O. Kitao, H. Nakai, T. Vreven, J. A. Montgomery, Jr, J. E. Peralta, F. Ogliaro, M. Bearpark, J. J. Heyd, E. Brothers, K. N. Kudin, V. N. Staroverov, R. Kobayashi, J. Normand, K. Raghavachari, A. Rendell, J. C. Burant, S. S. Iyengar, J. Tomasi, M. Cossi, N. Rega, J. M. Millam, M. Klene, J. E. Knox, J. B. Cross, V. Bakken, C. Adamo, J. Jaramillo, R. Gomperts, R. E. Stratmann, O. Yazyev, A. J. Austin, R. Cammi, C. Pomelli, J. W. Ochterski, R. L. Martin, K. Morokuma, V. G. Zakrzewski, G. A. Voth, P. Salvador, J. J. Dannenberg, S. Dapprich, A. D. Daniels, Ö. Farkas, J. B. Foresman, J. V. Ortiz, J. Cioslowski and D. J. Fox, Gaussian 09, Revision A.02, Gaussian, Inc., Wallingford, CT, 2009 Search PubMed.
- D. Case, J. T. Berryman, D. S. S. R. M. Betz, T. E. Cheatham, T. A. Darden, R. E. Duke, T. J. Giese, H. Gohlke, A. W. Goetz, N. Homeyer, S. Izadi, P. Janowski, J. Kaus, A. Kovalenko, T. S. Lee, S. LeGrand, P. Li, R. Luo, B. Madej, K. M. Merz, G. Monard, P. Needham, H. Nguyen, H. T. Nguyen, I. Omelyan, A. Onufriev, D. R. Roe, A. Roitberg, R. Salomon-Ferrer, C. L. Simmerling, W. Smith, J. Swails, R. C. Walker, J. Wang, R. M. Wolf, X. Wu, D. M. York and P. A. Kollman, AMBER 14, University of California, San Francisco, 2014 Search PubMed.
- J. C. Phillips, R. Braun, W. Wang, J. Gumbart, E. Tajkhorshid, E. Villa, C. Chipot, R. D. Skeel, L. Kale and K. Schulten, J. Comput. Chem., 2005, 26, 1781–1802 CrossRef PubMed.
- D. A. Case, R. M. Betz, D. S. Cerutti, T. E. Cheatham, III, T. A. Darden, R. E. Duke, T. J. Giese, H. Gohlke, A. W. Goetz, N. Homeyer, S. Izadi, P. Janowski, J. Kaus, A. Kovalenko, T. S. Lee, S. LeGrand, P. Li, C. Lin, T. Luchko, R. Luo, B. Madej, D. Mermelstein, K. M. Merz, G. Monard, H. Nguyen, H. T. Nguyen, I. Omelyan, A. Onufriev, D. R. Roe, A. Roitberg, C. Sagui, C. L. Simmerling, W. M. Botello-Smith, J. Swails, R. C. Walker, J. Wang, R. M. Wolf, X. Wu, L. Xiao and P. A. Kollman, AMBER 2016, University of California, San Francisco, 2016 Search PubMed.
- A. W. Gotz, M. J. Williamson, D. Xu, D. Poole, S. Le Grand and R. C. Walker, J. Chem. Theory Comput., 2012, 8, 1542–1555 CrossRef PubMed.
- R. Salomon-Ferrer, A. W. Gotz, D. Poole, S. Le Grand and R. C. Walker, J. Chem. Theory Comput., 2013, 9, 3878–3888 CrossRef PubMed.
- S. Le Grand, A. W. Götz and R. C. Walker, Comput. Phys. Commun., 2013, 184, 374–380 CrossRef.
- C. J. Dickson, B. D. Madej, A. A. Skjevik, R. M. Betz, K. Teigen, I. R. Gould and R. C. Walker, J. Chem. Theory Comput., 2014, 10, 865–879 CrossRef PubMed.
- J. Wang, R. M. Wolf, J. W. Caldwell, P. A. Kollman and D. A. Case, J. Comput. Chem., 2004, 25, 1157–1174 CrossRef PubMed.
- J. Wang, R. M. Wolf, J. W. Caldwell, P. A. Kollman and D. A. Case, J. Comput. Chem., 2005, 26, 114 CrossRef.
- C. I. Bayly, P. Cieplak, W. D. Cornell and P. A. Kollman, J. Phys. Chem., 1993, 97, 10269–10280 CrossRef.
- X. J. Cai, Z. Li and W. H. Chen, Bioorg. Med. Chem. Lett., 2017, 27, 1999–2002 CrossRef PubMed.
- X. Wu, L. W. Judd, E. N. W. Howe, A. M. Withecombe, V. Soto-Cerrato, H. Li, N. Busschaert, H. Valkenier, R. Perez-Tomas, D. N. Sheppard, Y. B. Jiang, A. P. Davis and P. A. Gale, Chem, 2016, 1, 127–146 Search PubMed.
- P. Politzer and D. G. Truhlar, Chemical Applications of Atomic and Molecular Electrostatic Potentials, Springer US, 1st edn, 1981 Search PubMed.
- A. E. Reed, L. A. Curtiss and F. Weinhold, Chem. Rev., 1988, 88, 899–926 CrossRef.
- C. E. Silva, H. F. Dos Santos, N. L. Speziali, R. Diniz and L. F. de Oliveira, J. Phys. Chem. A, 2010, 114, 10097–10109 CrossRef PubMed.
- MarvinSketch, 16.5.16.0, ChemAxon Ltd, Budapest, Hungary, 2016.
- S. Kumar, J. M. Rosenberg, D. Bouzida, R. H. Swendsen and P. A. Kollman, J. Comput. Chem., 1992, 13, 1011–1021 CrossRef.
- B. Roux, Comput. Phys. Commun., 1995, 91, 275–282 CrossRef.
- A. Grossfield, WHAM: The Weighted Histogram Analysis Method, 2.0.9.1, Grossfield Lab, University of Rochester, New York, 2017 Search PubMed.
- B. Efron and R. J. Tibshirani, An Introduction to the Bootstrap, Chapman & Hall and CRC, New York, 1993 Search PubMed.
- H. A. Filipe, M. J. Moreno, T. Rog, I. Vattulainen and L. M. Loura, J. Phys. Chem. B, 2014, 118, 3572–3581 CrossRef PubMed.
- C. T. Lee, J. Comer, C. Herndon, N. Leung, A. Pavlova, R. V. Swift, C. Tung, C. N. Rowley, R. E. Amaro, C. Chipot, Y. Wang and J. C. Gumbart, J. Chem. Inf. Model., 2016, 56, 721–733 CrossRef PubMed.
Footnotes |
| † Electronic supplementary information (ESI) available: Synthesis and characterisation, anion transport and anion binding assays, in vitro assays, detailed computational methods and extended discussion. CCDC 1590597 and 1460288. For ESI and crystallographic data in CIF or other electronic format see DOI: 10.1039/c8cp02576b |
| ‡ Current address: Department of Chemistry, Tulane University, New Orleans, Louisiana 70118, USA. |
| § Current address: Department of Chemistry, University of Cambridge, Lensfield Road, Cambridge, CB2 1EW, UK. |
| This journal is © the Owner Societies 2018 |