 Open Access Article
Creative Commons Attribution 3.0 Unported Licence
Guidelines for optimizing the architecture of battery insertion electrodes based on the concept of wiring lengths
Robert E.
Usiskin
 * and
Joachim
Maier

Max Planck Institute for Solid State Research, Heisenbergstr. 1, 70569 Stuttgart, Germany. E-mail: r.usiskin@fkf.mpg.de
First published on 7th June 2018
Abstract
The kinetics of storing mass in a battery electrode are typically limited by slow diffusion in storage particles. The diffusion timescale can be made faster by decreasing the size of the particles, but then it becomes more difficult to efficiently contact each particle with ionic and electronic current collectors, e.g., electrolyte and carbon. To achieve an optimal balance, the dimensions of the various phases in the electrode architecture should be tuned to the transport properties of the storage phase. Here we quantify this strategy by modeling the kinetics of galvanostatic charging for several particle geometries using the Nernst–Planck formalism and assuming mass storage via a solid solution. We show that when ions and electrons are inserted at separate contact surfaces, in general the storage kinetics depend on two length scales – the ionic and electronic wiring lengths – that characterize the transport distances within the storage material to the respective current collectors. Quantitative guidelines for the optimal wiring lengths are derived for two model geometries, and the dependence on transport parameters, particle shape, and contact geometry is discussed. These results can guide the optimization of various aspects of the architecture of a battery electrode, including the size and shape of individual particles and the configuration of the electrolyte and current collector networks.
1. Introduction
A battery electrode consists of an electroactive storage phase that is supplied with ions from an ionic current collector (typically a liquid electrolyte) and electrons from an electronic current collector (typically a carbon admixture connected to metal foil). The storage phase often consists of a myriad of solid particles, and a binder may be added for mechanical stability. The overall storage capacity and kinetics in such a multi-phase composite system depends on more than just the choice of materials used – the choice of architecture is equally important. The architecture encompasses all aspects of the electrode geometry. Thus it includes such critical parameters as the size and shape of the storage particles, the geometry of the contacts between the various phases, and the morphologies of the ionic and electronic current collector networks. The latter are critical because typically these networks comprise a substantial fraction of the electrode weight and volume, yet are largely inactive for storage.The electrochemical kinetics in a given architecture are influenced by many transfer and transport steps. Solid-state transport within the storage material is typically a dominant factor, so it is pertinent to concentrate on this process, which requires the transport and storage of both ions and electrons. The governing transport equations involve an intermingling of electrical migration and chemical diffusion.1 The associated mass storage can occur by four possible modes: solid solution, phase transformation, multiphase conversion, and interfacial storage.2 This work focuses on the solid solution storage mode (which arises in LiCoO2, for example). If the storage particles are identical and (dis)charge concurrently, and if the transport resistances in the current collector networks and the interfacial resistances at the contacts can be neglected, then the charging behavior of the entire architecture can be understood by considering the kinetics in a single particle.
Previous works have modeled ambipolar diffusion in a particle exhibiting solid solution storage. Atlung et al. used the one-dimensional (1D) diffusion equation to obtain analytical solutions for the transport behavior in three simple particle shapes: plate, cylinder, and sphere.3 For each shape, the interfaces with the ionic and electronic current collector phases – which for brevity we will call the ionic and electronic contacts – were assumed to be coincident, i.e., both contacts span the entire surface of the particle. This assumption is valid only for certain situations, such as a carbon-coated particle immersed in a liquid electrolyte. The analytical approach and relevant results for this case are reviewed below in Section 3.1. The charging kinetics in these 1D situations can also be usefully modeled using an equivalent circuit approach.4,5
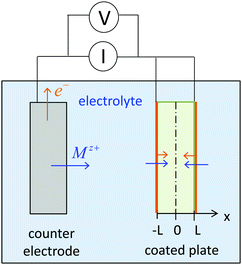 | ||
| Fig. 2 Ion and electron insertion into a plate particle with half-thickness L. The plate is coated by an electron-conducting material (e.g., carbon, shown in orange) that is permeable for Mz+. | ||
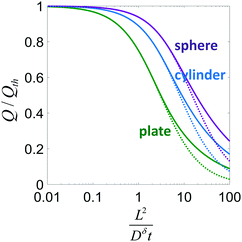 | ||
| Fig. 4 Normalized charge capacity Q/Qth obtained when a particle with the indicated shape is discharged until its cutoff voltage is reached at time t. Solid lines show the exact solutions; dotted lines correspond to the approximation in eqn (21). | ||
When the storage phase takes the form of a film, the ionic and electronic contacts are no longer coincident; instead they contact the particle on opposing faces. Preis and Sitte analyzed this geometry assuming constant transport coefficients, and for both galvanostatic6 and potentiostatic7 cases they showed that the transport behavior depends on the transference numbers for ions and electrons. (For a storage particle with two mobile carriers, the transference numbers are teon ≡ σeon/(σion + σeon) and tion = 1 − teon, where σion and σeon are the ionic and electronic conductivities.) If teon → 0, then electron transport is limiting and the diffusion propagates from the electronic contact; if teon → 1, then ion transport is limiting and diffusion proceeds from the ionic contact; and for intermediate values, the diffusion propagates from both contacts simultaneously. The galvanostatic results and their implications for battery charging are summarized below in Section 3.2.
More complex geometries have been treated numerically by solving the diffusion equation, e.g., using a commercial multiphysics solver.8 Phase fields have also been used to explore the influence of strain effects,9 grain boundaries,10 and phase transitions.11 However, the solid solution storage mode has rarely been addressed using phase fields.9,10 More significantly, we are unaware of any two- or three-dimensional analysis that considers an arbitrary electronic transference number in the mixed-conducting storage phase; instead, teon ≈ 1 is the common assumption.
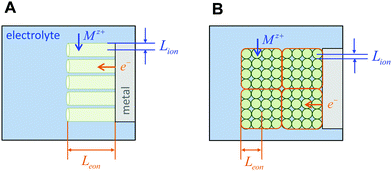
The above three situations – coincident contacts, film geometry, or teon ≈ 1 – are special cases in which the storage kinetics depend on only one length scale. The key conceptual insight in the present work is that in the general case of non-coincident contacts combined with two- or three-dimensional diffusion and arbitrary transference number, the kinetics depend on two length scales, which we term the wiring lengths. The ionic wiring length is defined as the path length from the ionic contacts to the farthest point away in the storage material. It is also possible (and equivalent) to define the ionic wiring length as the length scale down to which the storage phase and the ionic current collector network are mixed in the composite structure. The electronic wiring length is defined analogously for the electronic contact. These parameters are illustrated in Fig. 1 for two example electrode architectures. In Fig. 1A, ions are inserted over the entire length of each cylinder surface, while electrons are inserted only at one end. In Fig. 1B, the electrolyte penetrates the porous structure and provides ions on the length scale of the individual particles, while the electronic current collector (e.g., carbon, shown schematically in orange) is more coarsely distributed and provides electrons only at the perimeter of each cluster of particles. For both examples, charging the electrode requires the transport of ions over Lion and electrons over Leon, and these distances may be different by orders of magnitude. Moreover, for any given values of the wiring lengths, the kinetics may be fast or slow, depending on the ionic and electronic conductivities in the storage phase.
These considerations offer a rational approach for optimizing the architecture of an electrode. The overall strategy is to tune the wiring lengths based on the transport properties of the storage phase. In this work, analytical models are developed that provide some intuition and an initial set of guidelines for this strategy. First, the modeling approach based on the Nernst–Planck formalism is reviewed for the special cases of four geometries (plate, cylinder, sphere, and film) in which the storage kinetics depend on a single length scale. The analysis is then extended to the more general situation where the kinetics are characterized by two length scales. Two geometries (rectangular slab and cylinder) are chosen for analysis based on the fact that in these particular geometries, the wiring lengths can be independently varied. The discharge behavior in each configuration is derived, and quantitative guidelines for the optimal values of the wiring lengths are obtained. Finally, the examples in Fig. 1 are revisited, and the applicability and limits of the strategy are discussed.
A comment on the definition of “optimal” is warranted. In practice, the optimization of an architecture depends on many factors: cost, weight, ease of manufacturing, and so on. To simplify the problem while still capturing much of its essence, it is useful to note that a smaller particle volume is often detrimental for many of these factors. In particular, smaller particles are often more difficult and more costly to manufacture; they generally require the use of an increased amount of the electronic current collector and electrolyte phases, which are relatively inactive for storage and therefore lower the charge capacity per mass or volume; the requirement of a more intricate length scale can make the synthesis of a composite electrode more challenging; the time required to infiltrate liquid electrolyte into the architecture during manufacturing may be increased; and so on.12 Consequently, in this work the optimal dimensions are considered to be those that maximize the particle volume while still achieving the desired kinetics (i.e., the desired fraction of the theoretical storage capacity in the fastest (dis)charging time needed in the application).
2. Governing relations
2.1. Differential equation
In this section we review the derivation of the differential equation that will be used in subsequent sections.1,13Bulk transport in a mixed conductor is governed by the diffusion-drift equation – also called the Nernst–Planck equation – which is essentially a local combination of Fick's and Ohm's laws. If the only mobile species are electrons and ions of a single fixed valence (Mz+), then this equation can be expressed as:1
| iion = −zeDion∇cion − σion∇ϕ | (1) |
| ieon = eDeon∇ceon − σeon∇ϕ | (2) |
| iion = −zeDδ∇cion + tioni | (3) |
| ieon = eDδ∇ceon + teoni | (4) |
| Dδ = χionteonDion + χeontionDeon | (5) |
Taking the divergence of both sides of eqn (3) yields
| ∇·iion = −zeDδ∇2cion + ∇·(tioni) | (6) |
As an expression of mass conservation, the continuity equation holds:
 | (7) |
Combining eqn (6) and (7) and converting the concentration changes to the neutral species results in
 | (8) |
 | (9) |
This differential equation is used throughout the analysis below and is correct to first order in concentration changes.
It is noteworthy that flux divergences within the material – and hence mass storage – only occur as a consequence of the diffusion term in the drift-diffusion equation. The influence of the drift term consists in defining the boundary conditions, where concentration gradients build up immediately after switching on the current.
2.2. Boundary conditions
The boundary conditions are determined by noting that at interfaces with the electronic current collector, iion in eqn (3) can be set equal to zero, since ions are blocked. At interfaces with the electrolyte, ieon in eqn (4) can be set equal to zero, since electrons are blocked. At interfaces where neither carrier is blocked, eqn (3) and (4) can be simply summed. In all three cases, a Neumann boundary condition emerges.3. Special cases with a single length scale
3.1. 1D diffusion in a plate, cylinder, and sphere
We first review the case of galvanostatic charging of a plate particle (Fig. 2), following a simpler version of the treatment by Atlung et al.3 The particle half-thickness, denoted L, is assumed to be much smaller than the width and height, so that the diffusion can be considered with negligible error to be one-dimensional in the x-direction. The plate is surrounded by an Mz+-conducting electrolyte and is assumed to be coated by a thin electron conductor (e.g., carbon) that is permeable for Mz+. Thus the ionic and electronic contacts are coincident, and both ions and electrons can be inserted over all surfaces. By symmetry only the region from x = 0 to x = L must be modeled.The transport is governed by eqn (9) in one dimension:
 | (10) |
The boundary and initial conditions are:
 | (11) |
 | (12) |
| c(x, 0) = 0 | (13) |
 | (14) |
At some time the electrode discharging is considered complete, and the current is cut off. Typically the cutoff is chosen as the point beyond which further discharging would yield undesirable phase decomposition, metal plating, or a battery voltage below the minimum needed in the application. At the cutoff, the highest concentration in the particle is at the particle surface, c(L, t). Taking this concentration as the theoretical limit yields Qth = zFc(L, t) × 2AL, where Qth is the theoretical capacity that would be obtained if the limiting concentration were reached throughout the volume (2AL). However, the obtained capacity Q is smaller and equals only It.
Thus
 | (15) |
Inserting eqn (14) with x = L into eqn (15), one finds
 | (16) |
This expression is plotted in Fig. 4 as a function of the quantity  . It predicts the fraction of the discharge capacity that is obtained when a plate particle reaches its cutoff voltage in time t. The solid lines in this figure were first obtained by Atlung et al.3 At long discharge times, the capacity obtained approaches the theoretical limit, as expected. As the discharge time decreases, the obtained capacity also decreases: slowly at first, then more dramatically as the concentration polarization becomes more significant.
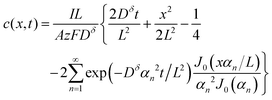
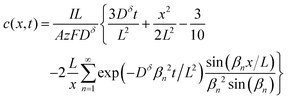
The above derivations can be repeated in cylindrical or spherical coordinates to find the concentration profile and the capacity obtained from a cylinder or sphere:3,15
Cylinder:
 | (17) |
 | (18) |
Sphere:
 | (19) |
 | (20) |
Eqn (18) and (20) are also plotted in Fig. 4. For a given value of the particle half-thickness or radius L, the charging time of a sphere is seen to be somewhat shorter than that of a cylinder, which in turn is shorter than that of a plate. This result is sensible, since the volume fraction that falls within a given distance of the surface is higher in a sphere than in a cylinder or plate. In other words, switching to a higher symmetry shape leads to somewhat faster kinetics. The precise magnitude of the improvement depends on the cutoff threshold. For example, if 99% of the theoretical capacity is desired, then switching from a plate to a sphere geometry shortens the charging time by a factor of 5.
Eqn (16), (18), and (20) give the normalized capacity Q/Qth in terms of L, Dδ, and t. For sufficiently long times, the exponential terms in the infinite sums can be neglected, and then all three equations are well-approximated by:
 | (21) |
 | (22) |
 | (23) |
Often it is useful to discuss electrode kinetics in terms of the discharge rate rather than the discharge time. Under a constant current I, the time to fill the theoretical capacity is tth = Qth/I. The obtained capacity is lower than the theoretical capacity and is reached sooner. The reciprocal of tth is the discharge rate r, which is defined here as the number of full discharges to the theoretical capacity that can be completed per unit time:
 | (24) |
The C-rate is simply the value of r in units of h−1. For example, a 5C rate corresponds to the current that can fill the theoretical capacity 5 times per hour. Note that r = 1/tth < 1/t. Combining the relation Q = It with eqn (24) leads to
 | (25) |
Eqn (25) can be inserted into eqn (16), (18), or (20) to obtain implicit solutions for the discharge capacity Q/Qth in terms of the discharge rate r. Insertion into eqn (21) gives an explicit solution:
 | (26) |
This expression gives the discharge capacity as a function of discharge rate and is valid for Q/Qth > 0.6. Finally, after adding asterisks to eqn (25) to indicate the values are selected for a particular application,
 | (27) |
 | (28) |
The above analysis treats the situation where both ions and electrons are inserted over the entire particle surface. The next section addresses the case where ions and electrons are inserted at opposing faces.
3.2. 1D diffusion in a film
In the typical film configuration shown in Fig. 5A, the ionic and electronic contacts are separated. By setting eqn (3) and (4) equal to zero, the boundary conditions are found to be: | (29) |
 | (30) |
 | (31) |
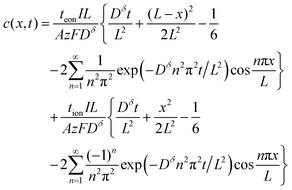
The first term in this relation corresponds to diffusion inward from the interface with the electrolyte, while the second term captures diffusion inward from the interface with the electronic current collector. The resulting profiles are plotted in Fig. 5 for three values of tion. As noted in the introduction, the diffusion can proceed from either interface or both, depending on tion. There is no source of mass inside the particle because of the assumption that the transference numbers are independent of concentration.
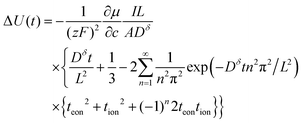
The voltage change of the battery in Fig. 5A was also obtained by Preis and Sitte:6
 | (32) |
The normalized charge capacity Q/Qth can now be determined as follows. Denote the cutoff voltage change by ΔUth. For sufficiently slow current Islow, the charging time tslow required to reach the cutoff voltage change is so long that the second and third terms in the brackets in eqn (32) can be neglected, and the voltage expression simplifies to:
 | (33) |
When the voltage reaches this cutoff threshold, ΔU = ΔUth, so eqn (32) and (33) can be set equal, yielding
 | (34) |
 | (35) |
 | (36) |
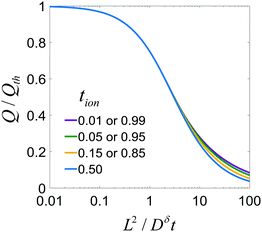
This result is plotted in Fig. 6. As tion approaches 0 or 1, the film behavior matches the plate behavior shown in Fig. 4, as expected; for such an extreme tion, the film is isomorphic to half of the plate. For intermediate values of tion, diffusion proceeds inward from both faces simultaneously, which leads to somewhat faster polarization initially. The threshold voltage is then reached more quickly, and thus the obtained capacity is lowered slightly relative to the 1D plate.
These results can be interpreted as providing a guideline for the optimal film thickness L*, i.e., the thickest film that can be discharged to the desired charge capacity Q*/Qth in a desired time t*:
 | (37) |
4. Cases with two length scales
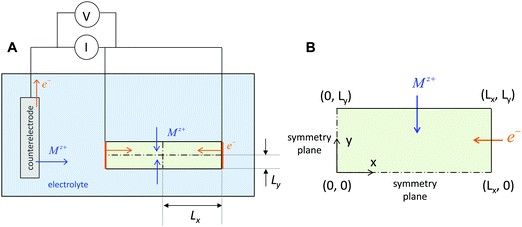
4.1. 2D diffusion in a rectangular slab
The governing diffusion equation is:
 | (38) |
The boundary and initial conditions (with the particle depth normalized to unity) are:13
 | (39) |
 | (40) |
 | (41) |
| c(x, y, 0) = 0 | (42) |
The factor of 4 arises in eqn (39) and (40) because only one fourth of the total current I is inserted into the quadrant being modeled.
The analytical solution to this 2D problem can be determined by inspecting and modifying the 1D film solution. First, consider the two terms in the 1D film solution (eqn (31)). These terms correspond to diffusion from the ionic and electronic contacts, respectively. Both terms satisfy the 1D diffusion equation, and they can be summed because the differential equation is linear. The 2D problem in Fig. 7B has analogous interfaces, and the differential equation remains linear. Thus the 2D solution should have the same two superimposed terms, except that the term from the electrolyte face propagates in the y-direction, and the contact areas with the electrolyte and metal are no longer the same. With this rationale, the following 2D solution is obtained:
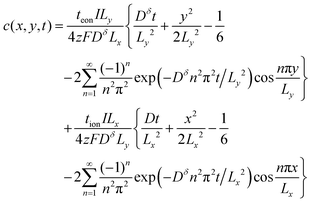 | (43) |
This expression satisfies eqn (38)–(42). Typical concentration profiles are illustrated in Fig. 8. As expected, the diffusion can propagate from the electronic contacts, the ionic contacts, or both, depending on tion. The profiles also illustrate that for any given dimensions and value of Dδ, the transport kinetics may be primarily limited by ions, electrons, or both, depending on the transference number. In Fig. 8A ions are limiting, and the particle could be made far longer without substantially penalizing the kinetics. In Fig. 8C electrons are limiting; it is visually evident that the particle is too long and the kinetics are slow. Fig. 8B shows the optimal situation where the aspect ratio is tuned to the transference number. The dimensions that correspond to this optimal situation will be derived shortly.
At the voltage cutoff, the concentration is highest in the corners, where (x, y) = (±Lx, ±Ly). If this limiting concentration were reached throughout the particle volume (4LxLy), then the full theoretical capacity Qth would be obtained, so Qth = zFc(Lx, Ly, t) × 4LxLy. However, the obtained capacity is only Q = It. Dividing these, one finds
 | (44) |
 | (45) |
 | (46) |
![[L with combining circumflex]](https://www.rsc.org/images/entities/i_char_004c_0302.gif) ≡ Lx/Ly and
≡ Lx/Ly and ![[t with combining circumflex]](https://www.rsc.org/images/entities/i_char_0074_0302.gif) ≡ Dδt/Ly2.
≡ Dδt/Ly2.
This equation is plotted in Fig. 9. For Lx/Ly = 1 (not shown), the behavior matches the 1D plate exactly, regardless of tion. For Lx/Ly ≠ 1 and tion sufficiently close to 0 or 1, the behavior still matches the 1D plate; examples are shown in Fig. 9A for the tion values 0.001 and 0.999 and in Fig. 9B for 0.00001 and 0.999. This behavior is physically reasonable, because only ions are limiting when tion is sufficiently close to 0, and only electrons are limiting when tion is sufficiently close to 1; in both cases the resulting diffusion is effectively 1D. However, for Lx/Ly≠1 and certain intermediate tion, the kinetics in 2D are improved relative to the 1D behavior. Overall the possible improvement increases with increasing Lx/Ly. Two cases are illustrated here. In Fig. 9A, Lx/Ly is only a factor of 4 different than unity, and the boost in kinetics is small; in Fig. 9B, Lx/Ly is a factor of 100 different than unity, and for a certain range of tion values, the possible improvement is substantial.
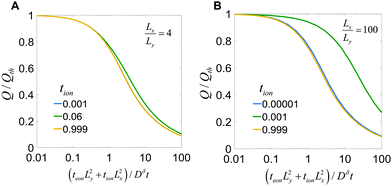 | ||
| Fig. 9 Charge capacity obtained when discharging the particle in Fig. 7, where tion takes the indicated values and Lx/Ly equals (A) 4 or (B) 100. | ||
The optimal particle dimensions are now determined. As noted earlier, the analysis is rooted in the assumption that making the particle unnecessarily small is undesirable due to several potential negative consequences.12 Thus the optimal dimensions are considered here to be those that maximize the particle volume while still having sufficient kinetics to obtain the desired capacity Q*/Qth in time t*.
An exact solution to this optimization problem can be obtained numerically as follows. First fix Q*/Qth to the desired threshold. Then, for each value of tion, an iterative routine can be used to find the value of ![[L with combining circumflex]](https://www.rsc.org/images/entities/i_char_004c_0302.gif) ≡ Lx/Ly that maximizes the ratio
≡ Lx/Ly that maximizes the ratio ![[L with combining circumflex]](https://www.rsc.org/images/entities/i_char_004c_0302.gif) /
/![[t with combining circumflex]](https://www.rsc.org/images/entities/i_char_0074_0302.gif) (which is proportional to the volume 4LxLy) subject to the constraint of eqn (46). This analysis was performed using the constrained minimization routine fmincon in MATLAB (Mathworks). The (exact) results for multiple values of Q*/Qth are shown as points in Fig. 10. In this figure the terms Lx* and Ly* are renamed Leon* and Lion* to make the notation independent of the coordinate system labels. The curves shown are analytical approximations that are derived in the next two sections.
(which is proportional to the volume 4LxLy) subject to the constraint of eqn (46). This analysis was performed using the constrained minimization routine fmincon in MATLAB (Mathworks). The (exact) results for multiple values of Q*/Qth are shown as points in Fig. 10. In this figure the terms Lx* and Ly* are renamed Leon* and Lion* to make the notation independent of the coordinate system labels. The curves shown are analytical approximations that are derived in the next two sections.
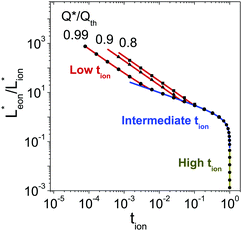 | ||
| Fig. 10 Optimal ratio of the wiring lengths, Leon*/Lion* ≡ Lx*/Ly*, for the rectangular geometry shown in Fig. 7 with desired capacities Q*/Qth = 0.99, 0.9, or 0.8. Points are the exact values found numerically; lines are the analytically-derived guidelines shown in the rightmost column of Table 1. This figure is also valid if the subscripts ion and eon are exchanged. | ||
 | (47) |
This expression can be rewritten as
 | (48) |
The optimization problem is then to maximize the volume 4LxLy subject to eqn (48). This problem can be solved analytically by rearranging eqn (48) to give  ; then the particle volume equals
  , and the maximum can be found by setting the derivative with respect to Lx equal to 0. The result is
 | (49) |
 | (50) |
 | (51) |
In general the two optimal wiring lengths are different. Only when teon = tion= 0.5 are they equal, and in this special case, the above guidelines match the 1D plate expression in eqn (23).
As before, the guidelines in eqn (50) and (51) can be written in terms of charging rate r* simply by inserting eqn (27).
A different set of guidelines is valid instead. These can be derived by switching to a “short-time” approximation for one of the infinite sum terms in eqn (45) while retaining a long-time approximation for the other term. Of course, the time t is the same in both terms, but the quotients t/Lx2 and t/Ly2 in the exponential arguments can be quite different; when the ratio Lx/Ly is sufficiently large or small, one of these quotients becomes small enough to make a “short-time” approximation valid. The derivation depends on whether the ratio Lx/Ly is large or small, i.e., if tion is close to 0 or 1. Here we show the situation where the ratio is large. In this case the exponential term preceded by teon in the concentration expression (eqn (43)) will decay much faster than the exponential term preceded by tion. The former can thus be neglected, yielding the following expression for the concentration at the point (Lx, Ly):
 | (52) |
Consider the second term in this relation. A virtually identical term appeared for the 1D film geometry in ref. 6, and the Laplace transform of that term in the short-time limit was given in eqn (16B) of that work. By analogy (or by repeating the derivation described in that work), a short-time approximation for the Laplace transform of this second term can be found:
 | (53) |
 | (54) |
 | (55) |
By inserting eqn (55) into eqn (44), an approximation for the ratio Q/Qth is obtained:
 | (56) |
The optimal particle dimensions can now be found analytically by maximizing the volume 4LxLy subject to eqn (56). The following condition is obtained:
 | (57) |
 | (58) |
 | (59) |
Because a long-time approximation was used in this derivation for the first term in the concentration, eqn (57)–(59) are only valid for Q*/Qth > 0.6, as was found for eqn (49)–(51) and eqn (23).
The guidelines in eqn (49) and (57) are plotted as curves in Fig. 10. Within their regimes of validity, these guidelines exhibit excellent agreement to the exact numerical solution, with the introduced errors being smaller than the markers in the figure (i.e., less than a few percent in virtually all cases). Moreover, as with the transition from short times to long times in the previous geometries (e.g., Fig. 3A), the transition between the regimes in Fig. 10 is rather abrupt. By setting eqn (49) equal to eqn (57), the transition is found to occur where  and
and  . For instance, when Q*/Qth = 0.99, the transition point is at tion = 0.005 and Leon*/Lion* = 14.
The above analysis applies when tion approaches 0. If instead teon approaches 0, a similar derivation leads to identical guidelines except with the ion and eon subscripts swapped. The complete set of guidelines is summarized in Table 1. In all cases the guidelines can be rewritten in terms of a selected discharge rate r* simply by inserting eqn (27).
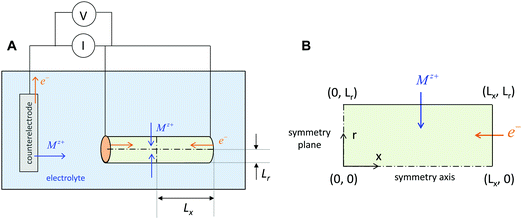
4.2. 2D diffusion in a cylinder
A natural question is whether the trends derived for the rectangular geometry can be extended to other geometries. Some insight can be gained by replacing the rectangular particle in Fig. 7 with a cylindrical particle where ions diffuse in a radial direction while electron diffusion is still linear. This configuration is shown in Fig. 11. The two wiring lengths now correspond to Lx and Lr. The analysis for this situation is summarized in the Appendix, and the resulting guidelines are shown in Table 2. Again, the guidelines can be rewritten in terms of a selected discharge rate r* simply by inserting eqn (27).Comparing Tables 1 and 2, it is apparent that upon switching from linear to radial diffusion for the ions, the scaling of the expressions with Dδ, t*, tion, and Q*/Qth remains unchanged. Furthermore, the prefactor changes are modest; for example, the optimal wiring length for ions increases by a factor of 2 or less. A comparable impact of geometry occurs for the 1D diffusion cases discussed earlier; as seen in eqn (23), switching from a plate to a cylinder or sphere causes the optimal length scale to increase by a factor of 1.6 or 2.2. This comparison suggests that except for modest changes to the prefactor, the optimal wiring lengths are insensitive to shape.
In summary, for a mixed conductor exhibiting tion roughly in the range 0.01–0.99, the optimal wiring lengths scale as  and
and  , and their ratio scales as
  . For an electrolyte or an electronic conductor with tion outside the range 0.01–0.99, the optimal wiring lengths scale as
  and
and  , and their ratio scales as
  . In both cases, it is striking and useful that the optimal ratio of the wiring lengths is independent of Dδ and t*.
(As an aside, it can be derived that  , where Cδ is the chemical capacitance,1 and combining this relation with the ones above yields
  and
and  , whereas the corresponding expression for coincident ionic and electronic contacts is
  . The similarity between these expressions indicates that the problem of finding the optimal wiring lengths is mimicked by a diffusion problem with coincident contacts (homogeneous boundary conditions) but apparent anisotropic diffusivities given by replacing σδ with σeon and σion. But note that the true diffusion inside is characterized by Dδ only.)
5. Applications
The relations derived above can help guide the optimization of realistic electrode microstructures. A full discussion is beyond the scope of the current work, but here we give three illustrative examples. The first application is depicted in Fig. 12. Three electrodes are shown that consist of cylindrical columns grown on an electronically conducting substrate. The critical design question is to estimate the optimal dimensions for the columns. Suppose the storage phase is known to have tion = 0.01. Fig. 12A shows a situation where the aspect ratio is unnecessarily small: Leon/Lion = 2. Since the storage phase has relatively high electronic conductivity, the columns could be longer with no carbon coating and minimal loss in kinetics. Fig. 12C shows the other extreme where the columns are excessively long: Leon/Lion = 16. Here the kinetics are substantially slowed because the electronic wiring length is too large. The optimal aspect ratio is depicted in Fig. 12B: Leon*/Lion* = 6, as estimated from the intermediate tion relation in Table 2. If the storage phase is changed to a material with tion = 10−4, such as LiNi0.5Mn1.5O4,16 then the optimal aspect ratio would become Leon*/Lion* = 220. If the chemical diffusivity Dδ is known, then not just the optimal aspect ratio but also the optimal column dimensions can be estimated from Table 2. For LiNi0.5Mn1.5O4, a value of 10−9 cm2 s−1 has been measured for Dδ;16 if this value is taken to be roughly constant during battery cycling, then the optimal dimensions to achieve 99% charging at a 5C rate can be estimated from Table 2 to be Lion* = 2 μm and Leon* = 380 μm. For comparison, quasi-spherical LiNi0.5Mn1.5O4 particles are commercially available from NEI Corporation (Nanomyte SP-10) with an average radius of 3 μm.17 The good agreement between this radius and the predicted Lion* helps to validate the guidelines. The large predicted Leon* suggests that manufacturing the particles as long rods rather than spheres would yield comparable kinetics, while potentially improving the architecture in other ways (e.g., reducing the weight of contact phases, decreasing the electrolyte infiltration time during manufacturing, and so on).
 | ||
| Fig. 12 Battery electrodes consisting of an array of columnar particles grown on a metal substrate, where Leon/Lion = (A) 2, (B) 6, and (C) 16. | ||
Strictly speaking, the geometry modeled in Fig. 11 and Table 2 includes a no-flux symmetry boundary at the end of the cylindrical region modeled, whereas in Fig. 12, the ends of the cylinders are uncovered and available to support an ion flux. This difference makes the overall ion transport slightly less slow relative to electron insertion, which decreases the optimal wiring length ratio for the columns in Fig. 12 relative to the estimates in Table 2. However, the difference is negligible when the columns are sufficiently long, or when they are capped.
A second application is given in Fig. 13. The electrodes shown consist of an agglomeration of spherical particles attached to a metal substrate. The critical design question here is to estimate the optimal configuration of the carbon. Suppose the storage phase again exhibits tion = 0.01. Fig. 13A depicts the typical case where every particle is carbon-coated: Leon/Lion = 1. However, since the storage phase has relatively high electronic conductivity, this configuration uses an unnecessarily large amount of carbon, which is undesirable because it lowers the capacity per weight of the electrode. Fig. 13C shows the other extreme with no carbon: Leon/Lion = 16. The kinetics are greatly slowed in this case because the electronic wiring length is too long. The best configuration will take maximum advantage of the electronic conductivity of the storage phase and use only enough carbon as is necessary achieve the optimal wiring length for electrons, as depicted in Fig. 13B.
A precise calculation of Leon*/Lion* for the geometry in Fig. 13 would need to consider the nearly spherical insertion path for the ions, porosity effects, as well as constriction and transfer effects that may arise as the electrons are transported through the narrow contact area between particles. Such a calculation would likely require numerical modeling, but an upper bound can be analytically estimated from the present work. It was shown above that a spherical geometry is slightly more favorable than a cylindrical geometry, so for the geometry in Fig. 13, the prefactor for Lion* should be slightly larger than in the cylindrical guidelines shown in Table 2. On the other hand, the constriction effects impede electron transport, so the optimal value of Leon* in Fig. 13 should be lower than in the guidelines derived above. Both of these effects will tend to decrease the ratio Leon*/Lion*, and thus the guidelines shown in Table 1 for Leon*/Lion* can be taken as an upper bound for the configuration in Fig. 13. For tion = 0.01, the upper bound is Leon*/Lion* = 10. For tion = 10−4, the upper bound is Leon*/Lion* = 590.
It is quite plausible that such intermediate-loading microstructures can be achieved in practice. For example, the particles could be mixed with a dilute amount of graphene sheets, or agglomerates of particles could be sprayed with an organic compound that decomposes into carbon upon annealing.
A third application involves optimizing the distribution of a solid electrolyte when the storage phase has high tion (e.g., Na3V2(PO4)2F3).18 This scenario can arise in solid state batteries, and it is analogous to the situation in Fig. 13, except with the roles of ions and electrons reversed. It follows that in some cases an intermediate loading of the solid electrolyte will be optimal, rather than contacting every particle with solid electrolyte or admixing no solid electrolyte at all.
6. Conclusions and outlook
The kinetics of inserting ions and electrons into an electroactive particle in a battery electrode are shown to depend in general on two length scales – the ionic and electronic wiring lengths – that characterize the transport distances within the particle to the respective current collectors. Alternatively, the wiring lengths can be interpreted as characterizing the “mixing length scales” (“mesh sizes”) of the ionic and electronic current collector networks with the storage phase. Analysis indicates that the optimal values of the wiring lengths depend on whether the ionic transference number tion in the storage phase is low, intermediate, or high. The following guidelines are derived for galvanostatic charging of a rectangular slab geometry: and
and  in the low range (roughly tion < 0.01), where a* ≡ 1/(Q*/Qth) − 1 and Q*/Qth is the desired charge capacity normalized by the theoretical capacity;
  and
and  in the intermediate range (tion ≈ 0.01–0.99); and in the high range (tion > 0.99), the guidelines are identical to the low range except with the ion and eon subscripts reversed. These expressions resemble the mean square displacement expression
  that arises from a typical single-species diffusion analysis, but they also include a dependence on transference number that arises because the two carriers are inserted at separate surfaces. The prefactors are weakly dependent on whether the corresponding carrier diffuses in planar or radial fashion, but the required corrections are modest (on the order of a factor of 2).
From these considerations, a design rule for the architecture of a battery insertion electrode can be formulated: the storage phase should be shaped and contacted by the current collector phases so that the ionic and electronic wiring lengths are as close to the optimal values as is practically feasible. The initial set of guidelines derived here can be used to estimate (or at least bound) the optimal values for a variety of electrode architectures. For example, one can estimate that the optimal aspect ratio for columnar storage particles grown on a metal substrate (Fig. 12) increases from 6 to 220 if tion in the storage phase is decreased from 0.01 to 0.0001.
It is important to keep in mind that these guidelines are based on several key assumptions: mass storage by a solid solution mechanism; transport parameters that do not vary significantly with concentration; no strain effects; isotropic transport; no cracking; negligible resistance in the electrolyte and electronic current collectors; negligible interfacial resistances; no constriction effects; and galvanostatic charging. An interesting topic for future work is to quantify the impact on the wiring lengths of relaxing one or more of these assumptions. For instance, mass storage by a two-phase mechanism could be treated by combining the concept of wiring lengths with the theory of diffusion via a moving two-phase boundary. Anisotropic transport properties could be handled by favorably aligning the carrier transport paths with the crystallographic directions exhibiting the fastest ionic and electronic transport. Significant transport resistances in one of the current collector networks will decrease the corresponding optimal wiring length, but this impact can be mitigated by the implementation of a hierarchical structure. The analysis of these more complex situations is likely to require numerical methods.
Conflicts of interest
There are no conflicts to declare.Appendix
2D diffusion in a cylinder
Diffusion equation: | (60) |
Boundary and initial conditions:
 | (61) |
 | (62) |
 | (63) |
| c(x, r, 0) = 0 | (64) |
Concentration solution:
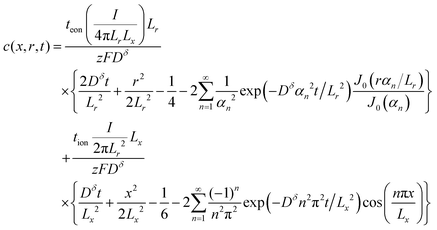 | (65) |
Capacity (exact):
 | (66) |
Capacity (long-term approximation):
 | (67) |
Capacity (short-term approximation):
 | (68) |
By maximizing the cylinder volume πLr2(2Lx) subject to the constraints given by eqn (67) or (68), one finds the optimal wiring lengths reported in Table 2.
Acknowledgements
Open Access funding provided by the Max Planck Society.References
- J. Maier, Physical chemistry of ionic materials: ions and electrons in solids, Wiley, 2004 Search PubMed.
- J. Maier, Angew. Chem., Int. Ed., 2013, 52, 4998–5026 CrossRef PubMed.
- S. Atlung, K. West and T. Jacobsen, J. Electrochem. Soc., 1979, 126, 1311–1321 CrossRef.
- J. Jamnik and J. Maier, Phys. Chem. Chem. Phys., 2001, 3, 1668–1678 RSC.
- W. Lai and F. Ciucci, J. Electrochem. Soc., 2011, 158, A115–A121 CrossRef.
- W. Preis and W. Sitte, J. Chem. Soc., Faraday Trans., 1996, 92, 1197–1203 RSC.
- W. Preis, Ber. Bunsenges. Phys. Chem., 1997, 101, 50–58 CrossRef.
- A. H. Wiedemann, G. M. Goldin, S. A. Barnett, H. Y. Zhu and R. J. Kee, Electrochim. Acta, 2013, 88, 580–588 CrossRef.
- S. Yamakawa, N. Nagasako, H. Yamasaki, T. Koyama and R. Asahi, Solid State Ionics, 2018, 319, 209–217 CrossRef.
- S. Yamakawa, H. Yamasaki, T. Koyama and R. Asahi, J. Power Sources, 2013, 223, 199–205 CrossRef.
- B. C. Han, A. Van der Ven, D. Morgan and G. Ceder, Electrochim. Acta, 2004, 49, 4691–4699 CrossRef.
- C. B. Zhu, R. E. Usiskin, Y. Yu and J. Maier, Science, 2017, 358, 8 CrossRef PubMed.
- I. Yokota, J. Phys. Soc. Jpn., 1961, 16, 2213–2223 CrossRef.
- J. Maier, J. Am. Ceram. Soc., 1993, 76, 1212–1217 CrossRef.
- J. Crank, The mathematics of diffusion, Clarendon Press, Oxford [England], 1975 Search PubMed.
- R. Amin and I. Belharouk, J. Power Sources, 2017, 348, 311–317 CrossRef.
- http://www.neicorporation.com/products/batteries/cathode-anode-powders/lithium-manganese-nickel-oxide/ .
- C. B. Zhu, C. Wu, C. C. Chen, P. Kopold, P. A. van Aken, J. Maier and Y. Yu, Chem. Mater., 2017, 29, 5207–5215 CrossRef.
Footnotes |
| † The equations in this section can be extended to situations with an arbitrary number of mobile charge carriers, including mobile ions with other valence states and mobile trapping sites; then the concentration and transport parameters refer to the total amount of the mobile element, i.e., summed over all valence states and trapping sites. For details see ref. 14. |
| ‡ The expression given in eqn (5) allows for trapping effects but assumes the trapped species are immobile. If the trapped species can move, a more general expression is required (ref. 14). |
| This journal is © the Owner Societies 2018 |

