
 Open Access Article
 This Open Access Article is licensed under a Creative Commons Attribution-Non Commercial 3.0 Unported Licence
Solute clustering in undersaturated solutions – systematic dependence on time, temperature and concentration†
Michael
Svärd‡
 *ab,
K.
Renuka Devi‡
b,
Dikshitkumar
Khamar
b,
Donal
Mealey
b,
Dominic
Cheuk
b,
Jacek
Zeglinski
b and
Åke C.
Rasmuson
ab
*ab,
K.
Renuka Devi‡
b,
Dikshitkumar
Khamar
b,
Donal
Mealey
b,
Dominic
Cheuk
b,
Jacek
Zeglinski
b and
Åke C.
Rasmuson
ab
aDepartment of Chemical Engineering, KTH Royal Institute of Technology, Stockholm, Sweden. E-mail: micsva@kth.se
bSynthesis and Solid State Pharmaceutical Centre, Department of Chemical and Environmental Science, Bernal Institute, University of Limerick, Castletroy, Ireland
First published on 21st May 2018
Abstract
Molecular clustering and solvent–solute interactions in isopropanol solutions of fenoxycarb have been thoroughly and systematically investigated by dynamic light scattering, small-angle X-ray scattering, and nanoparticle tracking, supported by infrared spectroscopy and molecular dynamics simulations. The existence of molecular aggregates, clusters, ranging in size up to almost a micrometre is clearly recorded at undersaturated as well as supersaturated conditions by all three analysis techniques. The results systematically reveal that the cluster size increases with solute concentration and time at stagnant conditions. For most concentrations the time scale of cluster growth is of the order of days. In undersaturated solutions the size appears to eventually reach a maximum value, higher the higher the concentration. Below a certain concentration threshold clusters are significantly smaller. Clusters are found to be smaller in solutions pre-heated at a higher temperature, which offers a possible explanation for the so-called “history of solution” effect. The cluster distribution is influenced by filtration through membranes with a pore size of 0.1 μm, offering an alternative explanation for the “foreign particle-catalysed nucleation” effect. At moderate concentrations larger clusters appear to be sheared into smaller ones, but the original size distribution is rapidly re-established. At higher concentrations, although still well below solubility, the cluster size as well as solute concentration are strongly affected, suggesting that larger clusters contain at least a core of more organized molecules not able to pass through the filter.
Introduction
Crystal nucleation a widely occurring phenomenon in nature, e.g. in the formation of bones, shells and ice, is of significant industrial importance in the manufacturing of many inorganic and organic materials, and has medical implications, e.g. in the formation of kidney stones and precipitates of amyloid proteins. Despite its importance, the current molecular level understanding of the mechanisms of crystal nucleation from solution is poor, and as a consequence, there are features of crystal nucleation that still lack proper explanation, e.g. the so called “history of solution” effect1 and the influence of filtration on nucleation.2,3It has been known for over a century that the propensity for crystal nucleation depends on the thermal history of the system. Initially, such observations were limited to crystallizations from melts,4 but the phenomenon was later confirmed to extend to nucleation from solutions of inorganic5 and organic compounds,6 as well as proteins.7 The generally manifested effect of thermal history is that an increased time and temperature of pre-heating prior to crystallization leads to slower nucleation. Our group recently published a comprehensive review of the research into this phenomenon, together with experimental work suggesting that there is also a structural dimension to the solution history phenomenon.8 The mechanism proposed as most plausible involves the existence and influence of some kind of molecular aggregates or clusters for a prolonged time after complete macroscopic dissolution of the solid phase. Related to this effect is the frequent observation that filtration of a solution tends to reduce the propensity for nucleation, which is commonly attributed to heterogeneous primary nucleation.
Lately, experimental indications of the existence of various types and sizes of clusters has accumulated,9–15 with most studies involving supersaturated solutions before nucleation. The existence of clusters in aqueous solutions of lysozyme14 and vanillin10 has been shown with dynamic light scattering. Chattopadhyay et al.13 were able to detect the presence of fractal clusters of glycine in supersaturated aqueous solution using small-angle X-ray scattering. Jawor-Baczynska et al.,15 using a combination of techniques, found two distinct populations of solute-rich, liquid-like nanoparticles in aqueous glycine solutions, with sizes of the order of 100 nm. Sorensen et al.11 used small-angle neutron scattering to observe a dual population of clusters of vanillin in aqueous alcohol solutions. Spix et al. measured the solution enantiomeric excess during Viedma ripening experiments of alanine 4-chlorobenzenesulfonic acid, and propose the existence of thermodynamic clusters having a structure with defined chirality which can incorporate into crystals of the same chirality.16 Recent advances have prompted new theories of crystal nucleation, highlighting the role of clusters. Gebauer and Cölfen demonstrated the existence of solute clusters of various size in solutions of calcium carbonate,9 and proposed that nucleation can proceed via the aggregation of solute clusters.17 These clusters are proposed to be thermodynamically stable entities without a defined phase boundary, which can be present also in undersaturated solutions. According to the two-step theory of nucleation, originally proposed for nucleation of proteins, concentration fluctuations result in a kind of clusters having a liquid-like structure with a higher concentration of the solute compared to the bulk solution, within which final crystal nucleation can then take place.18,19 The extent of applicability of these models, and the underlying molecular level mechanisms, are still subjects of debate.20
The present work constitutes a systematic investigation into the molecular association and clustering of an organic system: fenoxycarb in isopropanol solution. Fenoxycarb is an insect growth regulator with juvenile hormone activity,21 with a chemical resemblance to many pharmaceutically active molecules, e.g. fenofibrate. Solid–liquid thermodynamic properties and the solubility in five pure organic solvents,22 a crystal shape and structure analysis,23 and data on its nucleation behaviour24 has been reported. Primary nucleation of fenoxycarb in isopropanol solution has been shown to exhibit a strong effect of pre-heating on the propensity for nucleation, with increased temperature and time of pre-treatment of the solution resulting in longer nucleation induction times.24 The time scale for the process of erasure of this “history of solution” effect has been shown to be surprisingly large; of the order of hours or even days. Contrary to most compounds featured in clustering studies to date, the fenoxycarb molecule is bigger and has a significant degree of conformational flexibility.
Here, we present a systematic investigation into clustering in solutions, which unlike previous work focuses on solutions with concentrations below the solubility limit. The influence of concentration, time and solution pre-treatment has been systematically examined, with careful validation of experimental reproducibility. Through a systematic analysis of the effect of filtration of solutions, some insight has been gained with respect to the structural nature of the observed scattering species. Fourier-transform infrared (FTIR) spectroscopy and molecular dynamics (MD) simulations have been used as complementary tools to further elucidate the properties of the clustering at a molecular level.
Experimental
For full experimental details, please see the ESI.†Materials
Fenoxycarb [2-(p-phenoxyphenoxy)-ethylcarbamate, CAS no. 72490-01-8] (Syngenta, >98.8%), and isopropanol (Sigma-Aldrich, >99.9%) were used for all the experiments.Small angle X-ray scattering (SAXS) and nanoparticle tracking (NTA)
Clustering in solutions at room temperature subjected to various pre-treatment regimes following dissolution of crystals has been investigated with SAXS and NTA. Experiments have been carried out on sets of solutions with concentrations corresponding to saturation at 20 °C. The solutions were filtered at 40 °C using syringe filters (PTFE, 0.1 μm) into capped glass vials equipped with PTFE coated magnetic stir bars. The solutions were brought to crystallise through quench cooling, and the crystals were then immediately dissolved.For SAXS measurements, one vial was kept at 22 °C (weakly undersaturated conditions) and one vial was placed in a water bath at 55 °C. After 8 h, both solutions were analysed with SAXS at 20 °C. The SAXS experiments were conducted at the I22 beamline of the Diamond Light Source, UK. A temperature-controlled stationary brass liquid cell was used. For NTA, one vial was sampled and analysed with NTA immediately after dissolution, and the vial was then moved to a water bath at 20 °C. Another vial was placed in a water bath at 40 °C. After 22 h of agitation, the two solutions, both visibly clear, were sampled and analysed with NTA. The NTA measurements were done using a Malvern Nanosight LM14 instrument with temperature control. Each experiment consisted of ten repeat measurements at a temperature of 25 °C.
Dynamic light scattering (DLS) and infrared spectroscopy
Clustering in solutions of different solute concentration, ranging from undersaturated to weakly supersaturated conditions, following filtration and various stages of pre-treatment, has been investigated with DLS. In preliminary experiments, 26 different concentrations were investigated, and the results revealed a systematic behaviour with low random fluctuations. Out of these, 15 concentration values were selected for a more thorough investigation, including reproducibility analysis.After an initial filtration through 0.1 μm membranes (filtration-1), the solutions in set I were analysed with time-resolved DLS at 25 °C, while the solutions in set II were first kept at an elevated temperature (40 °C) for 22 h before time-resolved analysis with DLS at 25 °C. Stagnant solutions were analysed repeatedly over 72 h, using 1500 μL samples in capped square glass cells. After complete DLS analysis, all the solutions in set I were again filtered (filtration-2) and subjected to a new round of DLS analyses. Measurements were done using a Malvern Zetasizer ZSP Nano instrument, equipped with a temperature controller. The mean solvodynamic diameter was estimated using the method of cumulants.25 Fourier-transform infrared (FTIR) spectra were recorded for all solutions directly following filtration-1 and then again after 24 h. Measurements were done using a Mettler Toledo ReactIR 10 fitted with a silver halide in situ probe. The experimental protocol is shown in Fig. 1.
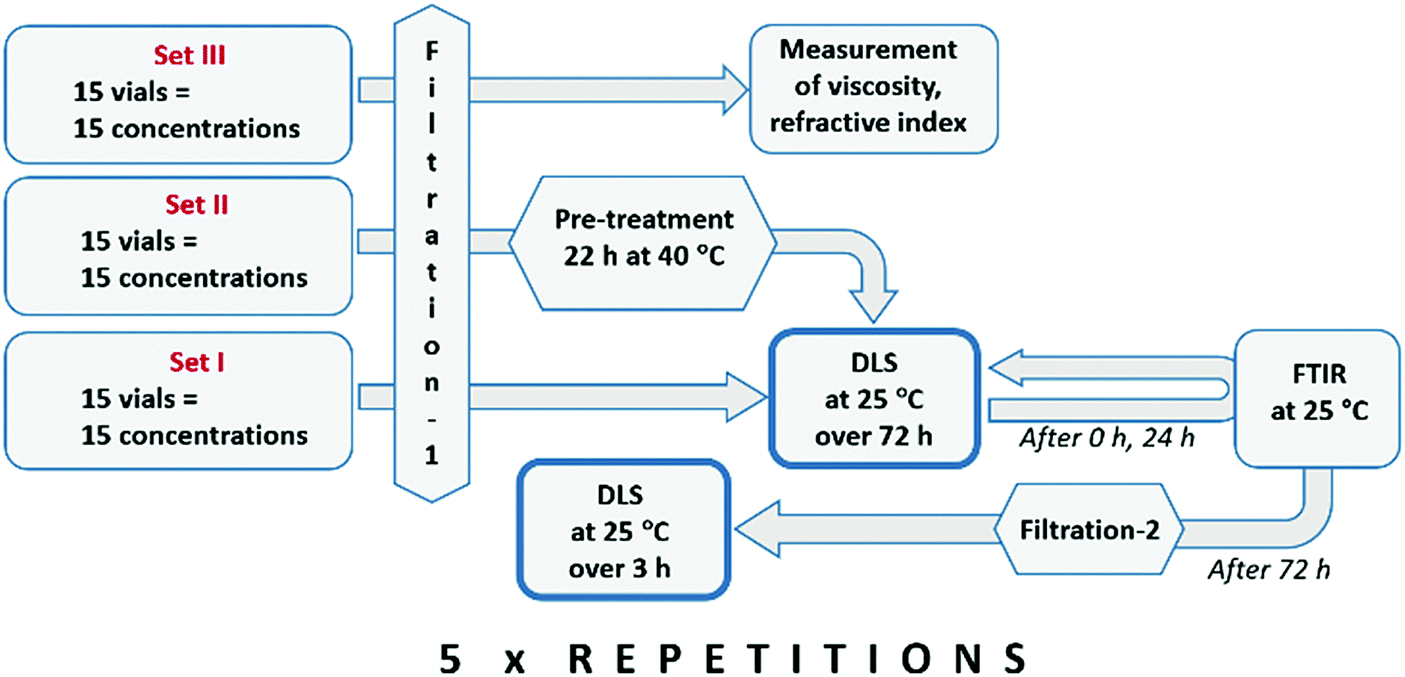 | ||
| Fig. 1 Experimental protocol used for DLS experiments. | ||
Molecular dynamics simulations
Langevin molecular dynamics (MD) simulations have been used to model solutions of fenoxycarb in isopropanol. The model system consisted of 71 fenoxycarb molecules and 1207 isopropanol molecules (corresponding to the saturation concentration at 20 °C) randomly positioned in a periodic cubic box. Simulations consisted of 50 ns runs at 25 °C in the NPT ensemble, using the NAMD software26 and the Charmm General Force Field (CGenFF).27Results and discussion
Clusters in solutions after dissolution and controlled pre-treatment
The small-angle X-ray scattering arising from the two solutions (pre-treated after dissolution for 8 h at 22 °C and 55 °C, respectively) is shown in Fig. 2 as log–log plots, where I denotes normalized intensity and q the scattering vector, which conveys information about the size (D) of scattering features. D is defined as π/q, and is related to, but not necessarily equal to, the solvodynamic diameter of the scattering species. These may be understood to be assemblies of solute molecules of different size, density and structure, which may or may not contain solvent molecules, and with a boundary to the surrounding solution that is not necessarily well-defined.17 | ||
Fig. 2 ln![[thin space (1/6-em)]](https://www.rsc.org/images/entities/char_2009.gif) I vs. ln I vs. ln![[thin space (1/6-em)]](https://www.rsc.org/images/entities/i_char_2009.gif) q plot of SAXS data of solutions with different pre-treatment temperature after dissolution. q plot of SAXS data of solutions with different pre-treatment temperature after dissolution. | ||
At high q values, corresponding to smaller sizes of scattering species, both curves are virtually identical down to the noise level. However, the scattering curve of the solution kept at room temperature (i.e. weakly undersaturated conditions) starts to deviate from that of the solution kept at a higher temperature at q values corresponding approximately to a D-range of 20–30 nm.
No Guinier region (i.e. a linear region in a plot of lnI vs. q2, shown in the ESI†) can be confidently asserted at the low q limit for either of the scattering curves. Instead, the curves exhibit gradually increasing slopes with decreasing q2 until sharply dropping off at the experimental limit, which is determined by the quality and tuning of the instrument optics. The observed behaviour could partly be caused by a high inter-particle structure factor, due to a high density of scattering species, but could also indicate that the size range of the scattering species exceeds the limit of detection of the experimental setup, which is approx. 100 nm. The absence of a Guinier region means that SAXS data cannot be used to derive an estimated value of the radius of gyration of the largest scattering species. However, the SAXS results of the two experiments shows clearly that the solution treated at a lower temperature has a higher concentration of species resulting in scattering, over a D-range starting at around 20 nm and exceeding 100 nm.
The results of the NTA experiments are shown in Fig. 3 as distributions of particle concentrations, with cumulative number distributions given in the ESI.† Each data series is an average of ten repeat measurements, with error bars showing the standard errors. Immediately after dissolution, the solution contains a rather narrow cluster size distribution, peaking between 120–160 nm. The total concentration of measured clusters is estimated to be 55 × 106 mL−1 (standard error = 10 × 106 mL−1). After 22 h at the saturation temperature (20 °C), the total cluster concentration is estimated to be 63 × 106 mL−1 (standard error = 10 × 106 mL−1), a slightly higher value but well within the statistical margin of error. The shape of the distribution is somewhat changed, however, with the difference being that slightly more clusters of larger sizes are observed. Both of the distributions are to a good approximation normal. The solution kept for 22 h at a higher temperature (40 °C) was shown to contain a markedly reduced cluster concentration, overall (total concentration estimated to be 42 × 106 mL−1, standard error = 4.4 × 10⁶ mL−1), and in particular in the range 100–200 nm. However, the mode of the distribution is also slightly shifted to higher sizes, now peaking at 200 nm.
 | ||
| Fig. 3 Cluster concentration distributions vs. solvodynamic diameter as obtained by NTA, for three experimental series. Error bars show standard errors over 10 repeat measurements. | ||
Emergence and behaviour of clusters in microfiltered solutions
For graphical clarity, a subset of 8 evaluated concentration values is shown in graphs, while the results of experiments for the full range of evaluated concentrations are provided as ESI.†Fig. 4 shows the overall intensity-based mean DLS solvodynamic cluster diameter for the solutions in set I (directly subjected to DLS measurement at 25 °C). At all analysed concentrations, the cluster size is the smallest at the beginning of the experiment immediately after filtration-1 (at 0 h), increasing with time. There is a clear general trend of increasing cluster size with increasing concentration. However, there is a particularly strong, almost step-like increase just above x = 0.021. For x < 0.021, the initial cluster size is in the range 1.6–3.2 nm. Above this concentration, the initial cluster size ranges from 3.8 nm to above 100 nm for x = 0.039, and above 600 nm for the highest concentration evaluated.
 | ||
| Fig. 4 DLS mean solvodynamic diameter of (a) clusters vs. time for different concentrations, and (b) clusters in solutions vs. concentration, for solutions in set I (pre-treated at 25 °C). Error bars show standard errors over 5 repetitions. | ||
The trend of a dramatically increased cluster size above a threshold concentration value is maintained over time, but the breaking point is shifted somewhat, from the initial x range (0.031–0.039) to (0.026–0.031) after 6 h and to (0.021–0.026) after 12 h. As shown in Fig. 4a, in all solutions except the supersaturated case (x = 0.132) the clusters grow with time, but at a gradually decreasing rate. After 24 h the size of the clusters ranges from 2.0 nm to 9.1 nm for solutions with x < 0.021, and from 250 nm to 747 nm for solutions with higher concentrations (except for the supersaturated solution). After 48 h, the cluster sizes have increased further, ranging from 2.4 nm to 12 nm in solutions with x < 0.021, and from 370 nm to around 800 nm above this concentration. At the final observation time after 72 h, clusters range from 2.5 nm to 14.8 nm with x < 0.021, and from 380 nm to 842 nm for x > 0.021.
For the highest concentration (x = 0.132) the solution is supersaturated at 25 °C. At this concentration, clusters start to grow more rapidly after approx. 36 h. This marks the onset of an important structural rearrangement, most likely crystal nucleation and growth. The rapid cluster size increase is also manifested as an increase in the derived count rate (which can indicate either a higher concentration, larger particles or both) obtained for the measurements beyond 36 h, as shown in the ESI.† At the end of the measurements (after 72 h), the solution was observed to have turned cloudy under the microscope, supporting the interpretation that nucleation had occurred. The mean solvodynamic diameter of the clusters after 36 h is just above 1 μm, and after 72 h it exceeds 2 μm.
A comparison across 5 identical repeat experiments at each concentration shows that the variation in cluster size decreases with increased time as well as concentration. The relative standard error in initial cluster size (at 0 h) decreases from 8.7% to 2.1% with increasing concentration from x = 0.006 to 0.132. For the lowest concentration (x = 0.006) the relative standard error decreases from 8.7% at 0 h to 0.67% after 72 h.
For the solutions in set II (subjected to pre-treatment at 40 °C for 22 h) the results show strong similarities with those of the set I solutions. (Graphs are provided in the ESI.†) Just like for set I there is a threshold concentration at approx. x = 0.021, below which the cluster sizes are very small; between 0.5 nm to 1.8 nm at 0 h, and below which the growth rate is quite modest, with clusters reaching a maximum size of up to 10 nm after 72 h. Above the concentration threshold the cluster size increases significantly with concentration as well as with time. Compared to the solutions in set I, however, the clusters are clearly smaller, with an initial cluster size at the highest concentration, x = 0.132, of slightly over 220 nm. After 72 h the maximum observed cluster size, also for x = 0.132, is around 700 nm. Moreover, the decrease in cluster growth rate with time is less pronounced for set II compared to set I. Notably, no nucleation was observed in the supersaturated solution in set II within the experimental time frame of 72 h. Across the 5 repeat experiments at each concentration, the variation in cluster size follows the same trend as observed for the solutions in set I. The initial relative standard error in the measured cluster size varies from 9.0% to 3.1% with increasing concentration from x = 0.006 to 0.132. For x = 0.006, the relative standard error decreases from 9.0% at 0 h to 1.1% after 72 h.
In Fig. 5, mean cluster diameters at various points in time before and after filtration-2 are compared, for solutions of different concentrations in set I. In the concentration range x = 0.006–0.021, with cluster sizes up to 15 nm, only marginal or no effects of filtration on cluster size could be observed. For solutions in the range x = 0.026–0.051, with cluster sizes in the range 300–600 nm, the cluster size 9 min after filtration-2 is significantly smaller than before filtration, but gradually increases with time, and after less than 1 h the clusters have regained their earlier size. For solutions in the range x = 0.070–0.095, with maximum cluster sizes in the range 600–800 nm, the cluster size 9 min after filtration-2 is again much smaller than before. The maximum cluster size gradually increases with time after filtration-2, but even after 3 h has not attained the value of the solution before the filtration. It is, however, comparable in size to the clusters found in solutions 3 h after filtration-1. Finally, for the saturated solution (with x = 0.110), where the maximum cluster size exceeds 800 nm, filtration-2 resulted in the complete removal of the previously observed molecular clusters, and no re-emergence of any larger molecular clusters at all was observed over a period of 3 h.
 | ||
| Fig. 5 (a) DLS mean solvodynamic diameter of clusters in solutions of different concentration at different points in time before and after filtration-2, and (b) magnified view of the smallest cluster sizes. Error bars show standard errors over 5 repetitions, and lines are guides for the eye only. | ||
In Fig. 6, the solute concentrations before and after filtration-2 are compared, for the solutions in set I. For the concentration range x = 0.006–0.026, the decrease in concentration resulting from filtration-2 is insignificant (below 2%). Over the range x = 0.031–0.051, there is a gradually increasing effect of filtration on the concentration, and filtration of solutions with x ≥ 0.070 resulted in a significant concentration decrease. For mole fractions of 0.070 and 0.095, the decrease is 33.5% and 39.3%, respectively. For the saturated solution (x = 0.110) filtration-2 reduced the concentration by 82.3%, averaged over 10 repeat experiments. There is a general trend of larger relative concentration decrease with increasing concentration. In all cases the decreases are statistically valid, as shown by the small error bars in Fig. 6 representing standard errors. For comparison, the measured differences in concentration before vs. after filtration-1 are all within ≤1% with standard errors all within ≤0.5%. The concentrations before and after both filtration steps are tabulated in the ESI.†
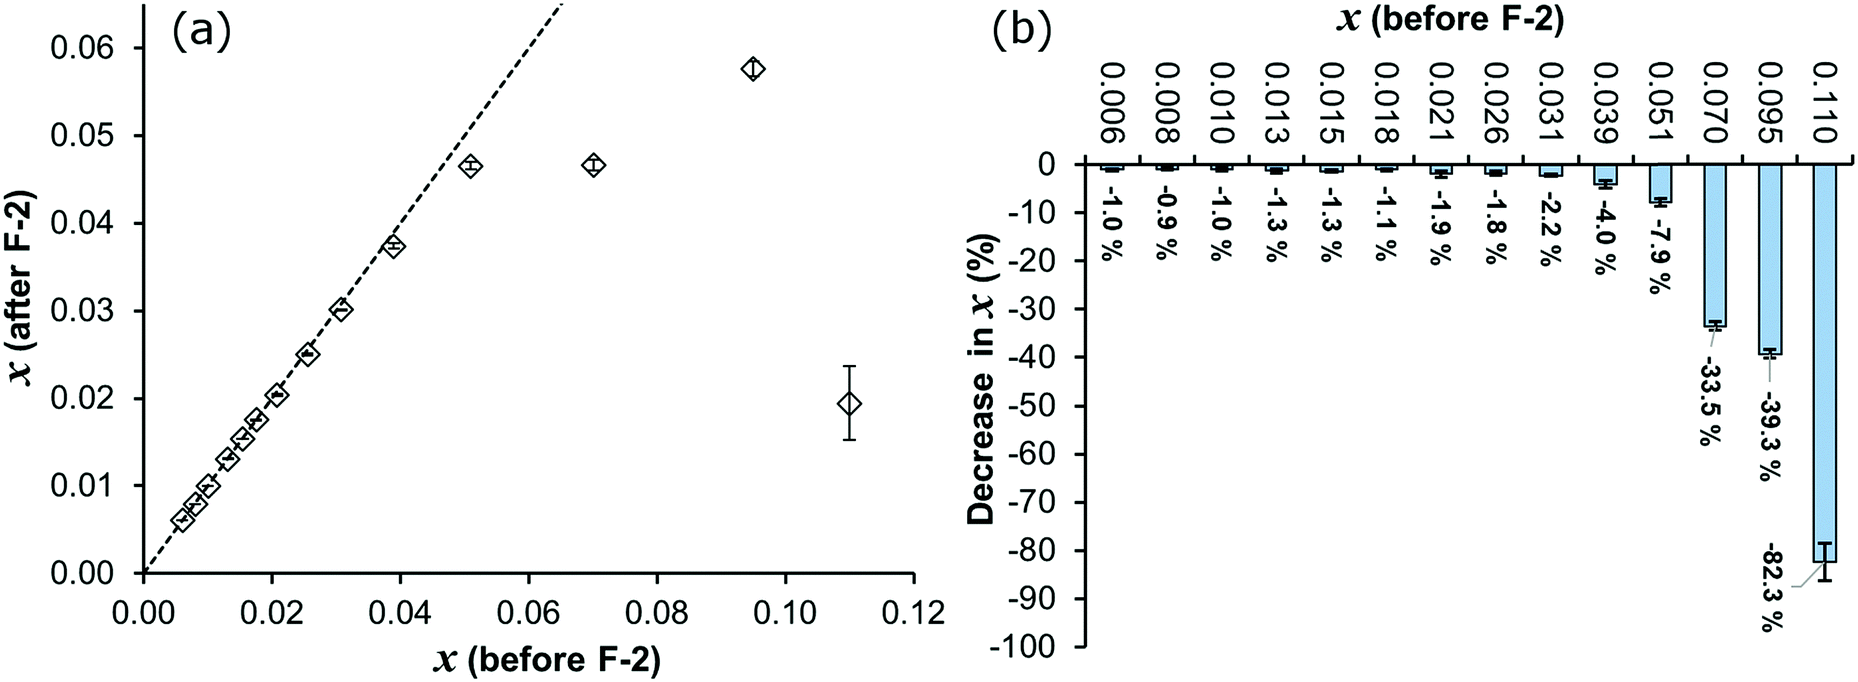 | ||
| Fig. 6 (a) Mole fraction concentration after filtration-2 compared to before filtration-2, and (b) percent decrease in concentration upon filtration. The dashed line represents y = x, and error bars show standard errors. | ||
Fig. 7a shows the FTIR spectrum of solid fenoxycarb, and corresponding solution spectra at different concentrations for set I and II, recorded immediately after filtration-1 (at 0 h) and after 24 h of DLS analysis, are provided in the ESI.† The solution FTIR spectra are analysed in terms of changes in position and intensity of the hydrogen bonding sensitive carbonyl ν(C![[double bond, length as m-dash]](https://www.rsc.org/images/entities/char_e001.gif) O) stretching and the amide δ(N–H) bending vibration peaks, resulting from differences in the bonding between adjacent molecules and between solute carbonyl groups and solvent molecules. The ν(CO) peak observed at 1686 cm−1 in solid fenoxycarb is shifted to 1704 cm−1 in the solutions with the lowest concentration. This shift towards higher wavenumbers depicts weaker interactions of the carbonyl group in the solution. Likewise, the δ(N–H) peak at 1547 cm−1 in the solid phase is shifted towards lower wavenumbers in isopropanol solutions. The observed shifts of ν(CO) and δ(N–H) are due to the rearrangement of molecules from the ordered crystalline state to a disordered dissolved state leading to a relaxation in the CO⋯N–H interaction.23 Furthermore, the peak corresponding to aromatic CC stretching at 1588 cm−1 and the doublet corresponding to C–H bending of aromatic and aliphatic groups at 1504 cm−1 and 1488 cm−1 remain essentially unaltered. The shift in the position of the carbonyl stretching peak with increasing solute concentration is shown in Fig. 7b for measurements at different times, for solutions in set I and set II. In all cases there is a clear linear decrease in the carbonyl frequency with increasing concentration. Furthermore, the carbonyl peak is systematically shifted towards lower wavenumbers in the solutions after 24 h compared to at 0 h. In both set I and set II, the carbonyl group vibrations become more restricted with increasing time. In addition, the carbonyl peak is systematically shifted towards higher wavenumbers for solutions in set II (pre-heated to 40 °C for 22 h) compared to solutions in set I (no pre-heating and without the 22 h time-lag before the first measurement), suggesting weaker bonding of the carbonyl group in the solutions in set II. This is clearly observed both at 0 h and after 24 h.
O) stretching and the amide δ(N–H) bending vibration peaks, resulting from differences in the bonding between adjacent molecules and between solute carbonyl groups and solvent molecules. The ν(CO) peak observed at 1686 cm−1 in solid fenoxycarb is shifted to 1704 cm−1 in the solutions with the lowest concentration. This shift towards higher wavenumbers depicts weaker interactions of the carbonyl group in the solution. Likewise, the δ(N–H) peak at 1547 cm−1 in the solid phase is shifted towards lower wavenumbers in isopropanol solutions. The observed shifts of ν(CO) and δ(N–H) are due to the rearrangement of molecules from the ordered crystalline state to a disordered dissolved state leading to a relaxation in the CO⋯N–H interaction.23 Furthermore, the peak corresponding to aromatic CC stretching at 1588 cm−1 and the doublet corresponding to C–H bending of aromatic and aliphatic groups at 1504 cm−1 and 1488 cm−1 remain essentially unaltered. The shift in the position of the carbonyl stretching peak with increasing solute concentration is shown in Fig. 7b for measurements at different times, for solutions in set I and set II. In all cases there is a clear linear decrease in the carbonyl frequency with increasing concentration. Furthermore, the carbonyl peak is systematically shifted towards lower wavenumbers in the solutions after 24 h compared to at 0 h. In both set I and set II, the carbonyl group vibrations become more restricted with increasing time. In addition, the carbonyl peak is systematically shifted towards higher wavenumbers for solutions in set II (pre-heated to 40 °C for 22 h) compared to solutions in set I (no pre-heating and without the 22 h time-lag before the first measurement), suggesting weaker bonding of the carbonyl group in the solutions in set II. This is clearly observed both at 0 h and after 24 h.
 | ||
| Fig. 7 (a) Partial FTIR spectrum of solid fenoxycarb, and (b) ν(CO) peak shifts in solutions in set I and set II with increasing concentration, after 0 h and 24 h, together with linear fits. | ||
Influence of concentration and pre-treatment on cluster size and structure
Clusters in isopropanol solutions of fenoxycarb are clearly detected by all three analysis techniques. While all rely on scattering of electromagnetic radiation, in NTA basically the scattering of individual clusters is recorded, while in SAXS and DLS the entire scattering information is deconvoluted into an average cluster size. The cluster sizes obtained with each of the three techniques are quite similar. Of course, notwithstanding the differences in experimental regimes (e.g. filtration, pre-treatment time and temperature), the three techniques have inherent differences and are not expected to produce identical values. The solvodynamic diameters determined with DLS and NTA are related, but unlike the latter, DLS does not produce a size distribution but rather a weighted average strongly dominated by the largest scattering species. The scattering profile resulting from SAXS contains components relating to the size and structure of the scattering species in the solution, but deconvoluting it for complex solutions containing polydisperse clusters is non-trivial. With respect to the comprehensiveness of the DLS experiments, and the carefully assessed reproducibility and the systematic dependence on concentration and time observed, these experiments in particular leave very little doubt about the existence of clusters in these solutions. Although only the NTA technique reports a more detailed size distribution, the data suggest that the number distribution is fairly broad.The SAXS and the NTA results show that pre-heating of solutions after dissolution for an extended period of time leads to a reduction in molecular clustering, both in terms of cluster size and cluster concentration, compared with the state of a “just-dissolved” solution. The SAXS curve of the solution saturated at 20 °C and pre-heated for 8 h at 55 °C shows a significantly decreased scattering from larger scattering species compared to the solution kept at room temperature. With NTA, it is shown that pre-heating of a solution saturated at 20 °C for 22 h at 40 °C led to a statistically significant reduction in the overall detectable particle concentration compared to a freshly dissolved solution. These findings are corroborated by the DLS results, which show that solutions pre-heated to 40 °C for 22 h (set II) contain clusters clearly smaller than those in solutions not exposed to this pre-treatment (set I) regardless of time after filtration. This in turn aligns with the observation that the carbonyl peak frequency in the FTIR spectra is lower in solutions of set I compared to solutions of set II regardless of concentration and time of aging.
The DLS results reveal that the clusters may range in size (solvodynamic diameter) up to several hundred nanometres at undersaturated conditions and almost a micrometre at supersaturated conditions. In these unstirred solutions, the cluster size increases very systematically with time at any given solute concentration. In undersaturated solutions the rate of cluster growth gradually diminishes and the size appears to approach a steady state value. Notably, the maximum size is not fully reached even after 72 h. For supersaturated solutions, the cluster growth does not cease, eventually leading to the formation of visible particles. At any instant of time, the DLS cluster size increases with solute concentration, and the cluster size after 72 h increases strongly with concentration as shown in Fig. 8. For both sets, the data points in the graph are grouped into a low and a high concentration region, each exhibiting strong correlations between cluster size and solute mole fraction, x. Below a mole fraction of approx. 0.025, the dependence of cluster size on concentration is very strong, with the linear cluster dimension increasing with x raised to the power of 1.5. If the number of clusters would be constant the linear size would increase with x raised to the power of 1/3. Accordingly, with increasing concentration there has to be an additional mechanism to account for the increase in cluster size besides the distribution of all additional supplied mass to the existing clusters. At x = 0.025, there is a discontinuous jump in cluster size of approximately an order of magnitude, accompanied by a transition into a markedly weaker concentration dependence, corresponding to a slope of 0.52 in logDsvs. logx. Notably, however, the slope is still clearly higher than 1/3. A mole fraction of 0.025 corresponds to about 40 solvent molecules per solute molecule, which is only slightly more than the number of solvent molecules required to fill the first solvation shell of a single fenoxycarb molecule.24 Thus, it is not surprising to observe that the principal behaviour of solutions with x > 0.025 is quite different compared to that of solutions of lower concentration.
 | ||
| Fig. 8 Dependence of the mean cluster size after 72 h on concentration, for solutions in set I (○,●), and set II (◊,✦), supersaturated solutions excluded. Hollow symbols are used for data points below x = 0.025. Solid lines are linear fits of Ds = f(x). | ||
The influence of a second filtration (filtration-2) after 72 h, together with the corresponding solute concentration measurements, indicate that the clustering behaviour can be divided into four rather distinct regions, as schematically illustrated in Fig. 9. In the first region, at mole fractions below 0.025, the clusters are essentially smaller than 20 nm, depending on concentration and time, and filtration has no effect on the cluster size nor on the solute concentration. The clusters are of a size comfortably below the pore size of the filter (100 nm) and hence expected to pass through it unaffected.
 | ||
| Fig. 9 Concentration regions based on filtration behaviour, illustrating the hypothesized differences in cluster structure. | ||
Over the second region (x between 0.025 and 0.060) the DLS cluster diameter increases by at least an order of magnitude to reach a size after 72 h ranging up to 600 nm, i.e. much larger than the nominal filter cut-off 100 nm. Even though the DLS scattering intensity depends on the particle diameter raised to the 6th power, and the DLS diameter reported is thus heavily biased towards the upper part of the size distribution, it still appears clear that a major fraction of the clusters should not be able to pass the filter unaffected. Accordingly, it is not surprising that clustering in these solutions is observed to be measurably affected by filtration-2. The DLS cluster size 9 min after filtration-2 is about one third of that before the filtration, but still clearly larger than the nominal filter pore size. However, the original DLS cluster size (measured before filtration-2) is re-established in less than an hour, i.e. markedly faster than the size increase during the 72 hours preceding filtration-2. There is an accompanying small but detectable and reproducible decrease in concentration. Accordingly, the results suggest that essentially all the clusters pass through the filter but a significant fraction appears to be sheared into smaller clusters in the process. This does not necessarily mean that they are reduced to a size where they can pass as rigid, spherical objects; clusters larger than the filter cut-off size could deform and percolate through the filter pores provided they are not too rigid, i.e. if they have a soft or liquid-like structure able to withstand a certain amount of shear and deformation. Such clusters have indeed been proposed by others,19 and are also suggested by the MD simulations, albeit for smaller aggregates. After the filtration the DLS cluster size can rapidly increase through coalescence.
In the third region, with concentrations in the range 0.060 < x < 0.095, filtration-2 strongly reduces the cluster size, and the ensuing cluster growth rate is much lower compared to region 2. The mean DLS cluster size 3 h after filtration-2 is even somewhat smaller than that recorded 3 h after filtration-1. Filtration leads to a significant reduction in concentration, ranging up to 39% for the solution with the highest initial concentration. The recorded DLS cluster sizes 9 minutes after filtration-2 are lower than the corresponding values for solutions in region 2, and the size decreases with increasing concentration, as opposed to the behaviour in region 2 where it increases. Hypothesizing that solutions in region 2 consist of loosely aggregated or even liquid-like clusters, it is conceivable that the biggest clusters in region 3 have at least a core of more strongly organized molecules, too big and rigid and unable to deform and percolate through the filter membrane. It should be noted that the solute concentration in these solutions is still well below the solubility.
In the fourth region, comprising the saturated solution, the original cluster size before filtration-2 exceeds 900 nm. Filtration-2 dramatically reduces the DLS cluster size and even 3 h after filtration-2 the recorded cluster size is still below 5 nm. Furthermore, the solution concentration is reduced by 82% on average, i.e. a significant portion of the solute mass before filtration-2 is in a physical form that prevents it from passing through the filter. This in turn suggests that the largest clusters should be relatively rigid, possibly with a proto-crystalline or a crystalline structure.
The reduced growth rate observed after filtration of the solutions in regions 3 and 4 can be explained by the fact that the solute concentration has been reduced down to a level which corresponds to a steady-state cluster distribution smaller in size compared to the case before filtration-2. For the saturated solution (region 4), the growth rate is severely cut after filtration, which is perfectly explainable by the fact that filtration reduced the concentration to somewhere between 10% and 20% of the original value, corresponding to a steady-state cluster size between 5 nm and 15 nm (cf.Fig. 4). It must be stressed that the significant reduction in concentration on filtration of solutions in regions 3 and 4 did not occur for the same solutions during filtration-1, and thus has to be directly related to the size and/or structure of the clusters that have developed over 72 h in these unstirred solutions.
In an effort to shed further light on the clustering of fenoxycarb in isopropanol, the system was modelled with molecular dynamics. As shown in Fig. 10a variety of types of solute aggregates are observed in the MD simulations, including monomers, dimers, and larger clusters. The structure of the clusters observed in MD is complex and not particularly ordered, apparently involving key elements of the packing found in the crystal structure but at the same time integrating both solute and solvent molecules. Due to their elongated shape, the solute molecules tend to line up to maximize the intermolecular interactions. However, it appears from the simulations that the formation of the crystal-like hydrogen bonds (shown in Fig. 10c) is interfered by interactions with competing solvent molecules. As a result, the clusters are to a certain extent interpenetrated by solvent molecules, with the latter being stabilized by hydrogen bonding with the solute molecules, as shown in Fig. 10b. During a simulation run, a rearrangement of molecules at the edges and within the clusters can be observed; this includes changes of molecular conformation and modes of interaction. A caveat of these simulations is that they cover time scales orders of magnitude shorter than those covered experimentally, and hence, they should be viewed as a first step only towards exploring the solution structure.
 | ||
| Fig. 10 (a) Snapshot of a cluster of fenoxycarb molecules in isopropanol solution simulated with MD (solvent not shown), (b) a magnified cluster with highlighted encapsulated solvent molecules (in yellow), and (c) molecular arrangement in the crystal lattice. Hydrogen bonds are shown as dotted lines. | ||
The results presented here could help explain our previously reported findings of strong “history of solution” effects in nucleation, based on experimental nucleation work on solutions differing with respect to the pre-treatment, both for fenoxycarb in isopropanol24 as well as another system.8 In these studies it was found that, with prolonged time and with increased temperature of pre-treatment at undersaturated conditions, the difficulty of subsequent nucleation increased. For fenoxycarb in isopropanol,24 an exponential decay relationship between the inverse of the nucleation induction time and the pre-heating time was derived, with a rate strongly dependent on the temperature, and with time constants of the order of days. The present study supports these findings, demonstrating similar time constants for the process of cluster distribution equilibration in solutions after filtration (with DLS) as well as after dissolution (with NTA). At mole fractions exceeding 0.03, a value well below the solubility limit, the ratio of solvent to solute molecules becomes too low even to form complete first solvation shells around all solute molecules. Based on DFT modelling, it has been hypothesized that the effect of pre-treatment on nucleation could emanate from structural differences between the clusters.24 The current study shows that there is also an effect on the size and concentration of clusters: an increased temperature of the pre-treatment step leads to a reduction in cluster size as well as concentration, in turn indicating a higher degree of solute–solvent intermixing, which may be expected to have an adverse effect on crystal nucleation.
In addition, the result of this work provide for an alternative interpretation concerning the role played by foreign, tiny dust particles in solution during crystal nucleation. It has been argued – and rightly so – that it is very difficult to achieve solutions that are entirely particle-free. The presence of such heterogeneous particles can catalyse nucleation by providing a surface where the total free energy barrier to nucleus formation becomes lower. This is sometimes used to explain results where pre-exponential factors and interfacial energies are lower than expected. It has also been used to explain the influence of filtration on nucleation. The data presented here offers a different interpretation: pre-exponential factors could be lower because they would depend on the number of clusters in the solution rather than on the number of monomers; interfacial energies could be lower because nucleation occurs within a cluster environment with a significantly higher solute concentration, and obviously filtration could remove clusters that otherwise would promote nucleation.
As regards the important and still heavily debated question of the mechanisms behind primary nucleation, the present work firmly establishes that clusters of a substantial size are formed in even undersaturated solutions of fenoxycarb in isopropanol, and that the time scale for reaching a steady state distribution is of the order of days. With some confidence, the results allow for the interpretation that clusters even at undersaturated conditions could have at least a core of higher molecular ordering, in line with the two-step theory.18,19
Conclusions
The presence of clusters in undersaturated as well as supersaturated solutions of fenoxycarb in isopropanol has been demonstrated with three different experimental analysis techniques: small-angle X-ray scattering (SAXS), nanoparticle tracking (NTA) and dynamic light scattering (DLS) with high confidence. The clustering is shown to have a systematic and reproducible dependence on the solute concentration, time and pre-heating. The clusters range in size up to several hundred nanometres at undersaturated conditions and up to one micrometre at supersaturated conditions. In general the cluster size increases with increasing solute concentration, but a step-wise increase is seen at mole fractions where complete solvation is being compromised. There is at all concentrations a substantial increase in cluster size with time in these unstirred solutions. At undersaturated conditions the cluster size appears to approach a steady-state value, with time scales of the order of days, while at supersaturation clusters continue to grow into nuclei. The steady-state mean cluster size is shown to increase with the mole fraction concentration approximately according to a power law behaviour, with a marked transition to a lower exponent at a mole fraction of 0.025. With all three methods it has been established that pre-heating of a solution leads to a reduction in cluster size. Depending on the concentration, the influence of filtration varies. The results indicate differences in the structure of the clusters.Conflicts of interest
There are no conflicts to declare.Acknowledgements
This publication has emanated from research conducted partly with the financial support of the Swedish Research Council (Grant Number 2015-5240), and partly by the Synthesis and Solid State Pharmaceutical Centre (SSPC), financed by a research grant from Science Foundation Ireland (SFI) co-funded under the European Regional Development Fund (Grant Number 12/RC/2275). The authors would like to acknowledge networking support by the COST Action CM1402 Crystallize.References
- T. Nakai, J. Chin. Inst. Chem. Eng., 1972, 3, 83 Search PubMed.
- N. Javid, T. Kendall, I. S. Burns and J. Sefcik, Cryst. Growth Des., 2016, 16, 4196 Search PubMed.
- J. Hirschler, M. H. Charon and J. C. Fontecilla-Camps, Protein Sci., 1995, 4, 2573 CrossRef PubMed.
- K. Schaum and F. Schoenbeck, Ann. Phys., 1902, 313, 652 CrossRef.
- J. Smid, J. Kvapil, J. Mýl and S. Solz, in Growth of crystals, ed. N. N. Sheftal and A. V. Shubnikov, Consultants bureau, New York, 1962, vol. 3, p. 196 Search PubMed.
- J. Nývlt, Collect. Czech. Chem. Commun., 1963, 28, 2269 CrossRef.
- M. W. Burke, R. A. Judge and M. L. Pusey, J. Cryst. Growth, 2001, 232, 301 CrossRef.
- F. L. Nordström, M. Svärd, B. Malmberg and Å. C. Rasmuson, Cryst. Growth Des., 2012, 12, 4340 Search PubMed.
- D. Gebauer, A. Völkel and H. Cölfen, Science, 2008, 322, 1819 CrossRef PubMed.
- T. J. Sorensen, Chem. Eng. Technol., 2014, 37, 1959 CrossRef.
- T. J. Sorensen, P. C. Sontum, J. Samseth, G. Thorsen and D. Malthe-Sorenssen, Chem. Eng. Technol., 2003, 26, 307 CrossRef.
- U. Gasser, E. R. Weeks, A. Schofield, P. N. Pusey and D. A. Weitz, Science, 2001, 292, 258 CrossRef PubMed.
- S. Chattopadhyay, D. Erdemir, J. M. B. Evans, J. Ilavsky, H. Amenitsch, C. U. Segre and A. S. Myerson, Cryst. Growth Des., 2005, 5, 523 Search PubMed.
- S. Tanaka, K. Ito, R. Hayakawa and M. Ataka, J. Chem. Phys., 1999, 111, 10330 CrossRef.
- A. Jawor-Baczynska, J. Sefcik and B. D. Moore, Cryst. Growth Des., 2013, 13, 470 Search PubMed.
- L. Spix, A. H. J. Engwerda, H. Meekes, W. J. P. van Enckevort and E. Vlieg, Cryst. Growth Des., 2016, 16, 4752 Search PubMed.
- D. Gebauer and H. Cölfen, Nano Today, 2011, 6, 564 CrossRef.
- W. Pan, A. B. Kolomeisky and P. G. Vekilov, J. Chem. Phys., 2005, 122, 174905 CrossRef PubMed.
- P. G. Vekilov, Cryst. Growth Des., 2004, 4, 671 Search PubMed.
- R. J. Davey, S. L. M. Schroeder and J. H. ter Horst, Angew. Chem., Int. Ed., 2013, 52, 2166 CrossRef PubMed.
- P. Masner, M. Angst and S. Dorn, Pestic. Sci., 1987, 18, 89 CrossRef.
- M. Kuhs, M. Svärd and Å. C. Rasmuson, J. Chem. Thermodyn., 2013, 66, 50 CrossRef.
- J. Zeglinski, M. Svärd, J. Karpinska, M. Kuhs and Å. C. Rasmuson, J. Mol. Graphics Modell., 2014, 53, 92 CrossRef PubMed.
- M. Kuhs, J. Zeglinski and Å. C. Rasmuson, Cryst. Growth Des., 2014, 14, 905 Search PubMed.
- P. Linder, T. Zember and P. N. Pusey, Neutron, X-rays and light scattering methods to soft condensed matter. Introduction to scattering experiments, Elsevier Science BV, New York, 2002 Search PubMed.
- M. T. Nelson, W. Humphrey, A. Gursoy, A. Dalke, L. V. Kalé, R. D. Skeel and K. Schulten, Int. J. High Perf. Comput. Appl., 1996, 10, 251 Search PubMed.
- K. Vanommeslaeghe, E. Hatcher, C. Acharya, S. Kundu, S. Zhong, J. Shim, E. Darian, O. Guvench, P. Lopes, I. Vorobyov and A. D. Mackerell, J. Comput. Chem., 2010, 31, 671 Search PubMed.
Footnotes |
| † Electronic supplementary information (ESI) available: Full experimental details, supplementary results, measured concentration values, and solution viscosities and refractive indices. See DOI: 10.1039/c8cp01509k |
| ‡ These authors contributed equally to this work. |
| This journal is © the Owner Societies 2018 |