
 Open Access Article
 This Open Access Article is licensed under a
 Creative Commons Attribution 3.0 Unported Licence
Effects of methyl substitution on DNA binding enthalpies of enantiopure Ru(phenanthroline)2dipyridophenazine2+ complexes†
Anna K. F.
Mårtensson
 and
Per
Lincoln
*
and
Per
Lincoln
*
Department of Chemistry and Chemical Engineering, Chalmers University of Technology, SE-41296 Gothenburg, Sweden. E-mail: lincoln@chalmers.se
First published on 3rd April 2018
Abstract
Isothermal titration calorimetry (ITC) has been utilized to investigate the effect of methyl substituents on the intercalating dppz ligand of the enantiomers of the parent complex Ru(phen)2dppz2+ (phen = 1,10-phenanthroline; dppz = dipyrido[3,2-a:2′,3′-c]phenazine) on DNA binding thermodynamics. The methylated complexes (10-methyl-dppz and 11,12-dimethyl-dppz) have large, concentration-dependent, positive heats of dilution, and a strong endothermic background is also apparent in the ITC-profiles from titration of methylated complexes into poly(dAdT)2, which make direct comparison between complexes difficult. By augmenting a simple cooperative binding model with one equilibrium for complex self-aggregation in solution and one equilibrium for complex aggregation on saturated DNA, it was possible to find an excellent global fit to the experimental data with DNA affinity parameters restricted to be equal for all Δ-enantiomers as well as for all Λ-enantiomers. In general, enthalpic differences, compared to the unsubstituted complex, were small and less than 4 kJ mol−1, except for the heat of intercalation of Δ-10-methyl-dppz (−11,6 kJ mol−1) and Λ-11,12-dimethyl-dppz (+4.3 kJ mol−1).
Introduction
Since the mid-1980s, there have been extensive studies on ruthenium(II) polypyridyl complexes.1–5 Along with their interesting photophysical properties, ruthenium complexes have been shown to have various useful interacting properties, such as acting as DNA probes6 or inducing DNA cleavage.7 Extending one of the planar ligands of the complex will facilitate intercalation between the base pairs, the most studied examples being ruthenium complexes possessing a dppz moiety (dppz = dipyrido[3,2-a:2′,3′-c]phenazine). Originally denoted “light-switch complexes”, tris-bidentate complexes of the general structure Ru(L)2dppz2+ (L = phen(1,10-phenanthroline) or bpy (2,2′-bipyridine)) will display a massive increase in the quantum yield when intercalated to DNA,6,8–10 owing to the hydrophobic environment between the base pairs protecting the dppz moiety from hydrogen bonding with the solvent water molecules.11,12By introducing small changes into the molecular structure of the complex, it is possible to modify the photophysical properties and also the DNA binding affinity and specificity. Consequently, there have been numerous reports on ruthenium complexes with substituents on both the ancillary and the intercalating ligands.13–18 By adding methyl groups on the outermost benzene ring of the dppz ligand in Ru(phen)2dppz2+ the steric consequences might alter the binding motifs of the complex. Previous studies observed a significant lengthening of the excited state lifetimes of dppz-based ruthenium complexes with methyl substitutions in the 10-position and in the 11,12-positions of the dppz moiety, which was attributed to a steric interference of the hydration cage around the complex.6,19 The structurally similar complex Ru(TAP)2dppz2+ (TAP = 1,4,5,8-tetraazaphenanthrene) has been reported to bind more strongly to DNA when methyl-substituted in the 11,12-position of the dppz moiety.20 Methyl substituents in the 11,12-positions of the dppz moiety of Cr(phen)2dppz3+ also increased the binding affinity of the parent complex.21 In contrast, methyl substituted dpq (dpq = dipyrido[3,2-f:2′,3′-h]-quinoxaline), a close analogue of dppz, has shown a decrease in DNA binding strength compared to its parent complex Ru(phen)2dpq2+, which was attributed to steric hindrance of the bulky methyl groups.22 Clearly, methyl substituents may alter the binding properties of intercalative complexes, but there are still many questions on the underlying binding mechanism that have been left unanswered. Also, many of the previous studies have limited themselves to unresolved ruthenium complexes. This is unfortunate as it has been demonstrated on numerous occasions by various experimental methods that DNA binding is highly influenced by the chirality of tris-bidentate ruthenium complexes with the right-handed Δ-form generally having a stronger affinity to DNA than the Λ-form.1,18,23–27
Isothermal titration calorimetry (ITC) is a high-precision tool used for the thermodynamic characterization of ligand binding to a macromolecule (e.g. DNA) and is the only thermodynamic method that directly measures all energetics associated with the ligand–macromolecule interaction process.28–30 Aliquots of the ligand are added to a solution of the macromolecule and the resulting heat effects observed can then be analysed for quantitative characterization of the energetic processes associated with the binding reaction. As the titration progresses, the binding sites on the macromolecule become increasingly occupied and at the end of the titration, only a small heat change caused by ligand dilution and other non-specific effects will be registered. In most cases this is corrected for by simply subtracting the average heat of dilution from a blank titration of ligand into buffer. However, if the blank titration shows a large non-constant heat of dilution it cannot simply be dismissed by subtraction. As an effect of the highly concentrated titrant solution, the ligands may self-aggregate to form oligomers, which partly dissociate when added to the macromolecule solution.31,32 Being another equilibrium process involving the free ligand in solution, the self-aggregation needs to be included in the analysis of the ligand–DNA interaction.
Intercalating dppz-based ruthenium complexes have previously been demonstrated to either facilitate or hinder the adjacent binding of neighboring complexes along the DNA polymer.27,33 In addition, the binding sites on a DNA polymer are in such close proximity of each other that each intercalated ruthenium complex covers more than one binding site. Based on the classical McGhee and von Hippel model, where DNA is treated as a one-dimensional lattice of binding sites,34 we have recently developed a general algorithm that can be utilized for the model fitting of binding interactions between ligands and linear biopolymers.35
In this study, we seek to thermodynamically characterize the DNA binding of Ru(phen)2dppz2+ with methyl groups substituted in the 10-position or the 11,12-positions of the dppz moiety (Fig. 1). In order to avoid the effects of DNA sequence heterogeneity, we chose to use poly(dAdT)2 (AT-DNA) for the ligand–DNA interaction. Since the methylated complexes show a pronounced non-constant heat of dilution, this has been included in the analysis.
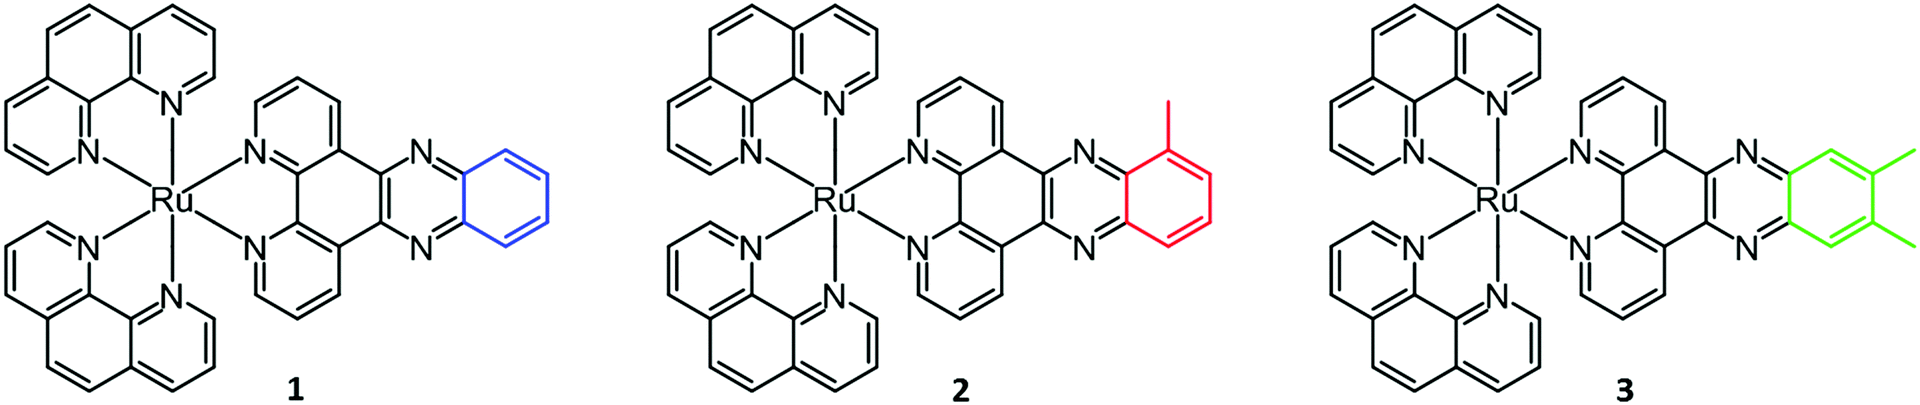 | ||
| Fig. 1 Structures of ruthenium complexes Ru(phen)2dppz2+ (1), Ru(phen)2dppzCH32+ (2) and Ru(phen)2dppz(CH3)22+ (3). | ||
Experimental
Materials and sample preparation
All experiments were performed in aqueous solution (pH = 7.0) containing 150 mM NaCl and 1 mM cacodylate (dimethylarsinic acid sodium salt). A stock solution of poly(dAdT)2 (AT-DNA) (∼5 mM nucleotides) was prepared by dissolving the sodium salt (Sigma-Aldrich) in buffer. Stock solutions of the complexes (∼1 mM) were prepared by dissolving the chloride salts in buffer. Concentrations were determined spectrophotometrically using extinction coefficients: ε260 = 6600 M−1 cm−1 per nucleotide for AT-DNA and ε440 = 20![[thin space (1/6-em)]](https://www.rsc.org/images/entities/char_2009.gif) 000 M−1 cm−1 for the ruthenium complexes. For ITC measurements the DNA solution was dialyzed against pure buffer for at least 48 hours at 8 °C. Ruthenium complex solutions of appropriate concentrations were prepared by dilution of the stock solutions in the dialysate. The dialysis membrane used had a molecular weight cut-off of 3.5–5 kDa (Spectra-Por® Float-A-Lyzer® G2, Sigma-Aldrich).
000 M−1 cm−1 for the ruthenium complexes. For ITC measurements the DNA solution was dialyzed against pure buffer for at least 48 hours at 8 °C. Ruthenium complex solutions of appropriate concentrations were prepared by dilution of the stock solutions in the dialysate. The dialysis membrane used had a molecular weight cut-off of 3.5–5 kDa (Spectra-Por® Float-A-Lyzer® G2, Sigma-Aldrich).
The enantiopure Δ- and Λ-[Ru(phen)2dppz]Cl2, [Ru(phen)2dppzCH3]Cl2 and [Ru(phen)2dppz(CH3)2]Cl2 (here denoted 1, 2 and 3, respectively) used in this study were synthesized and resolved as previously reported.23,36
Other chemicals were purchased from Sigma-Aldrich and used without purification.
Absorption spectra were measured on a Varian Cary 4000 UV/vis (Agilent Technologies) spectrophotometer (path length = 1 cm).
Isothermal titration calorimetry
During an isothermal titration calorimetry (ITC) experiment, the heat produced or absorbed upon addition of the complex to a DNA solution enables direct assessment of the binding free energy by integrating the power required to maintain the reference and sample cells at the same temperature. The experimental raw data consist of a series of heat flow peaks and each peak corresponds to one injection of the ruthenium complex. These heat flow peaks are then integrated with respect to time, to give the total heat exchanged per mole injectant plotted against the ratio [Ru complex]/[base pairs].Calorimetric data were obtained using a MicroCal iTC200 isothermal titration calorimeter (Malvern) controlled by Origin 7.0 software. The ITC profiles of the resolved ruthenium complexes were obtained by a single injection of 1 μl followed by 19 sequential injections of 2 μl aliquots of stock solution (∼590 μM) of the complex from a syringe into the sample cell (206 μl) loaded with AT-DNA in 150 mM NaCl aqueous buffer solution (∼312 μM nucleotides) or with buffer alone. All ITC experiments were performed at 25 °C. The injection spacing was 180 s, the syringe rotation was 750 rpm and there was an initial delay of 120 s prior to the first injection. The raw ITC data peaks were automatically integrated using the Origin 7.0 software. For improved accuracy of the integration, the integration range for the spacing between each heat peak was narrowed, thus reducing the background noise from the baseline.
Analysis of binding isotherms
For the analysis of the ITC-data we have used the classical McGhee–von Hippel DNA binding model, which assumes identical intercalation pockets in-between each base pair. In this model, the DNA ligand is characterized by an intrinsic binding constant K (for binding without neighbor interactions), a cooperativity parameter y (for cooperative binding interactions with neighbors, y > 1, for anti-cooperative neighbor interactions 0 < y < 1) and the number n of binding sites made inaccessible by the binding of one ligand. We have previously described an efficient algorithm for solving the mass balance for a general McGhee–von Hippel system,35 and here we have also incorporated a ligand solution oligomerization equilibrium m L → Lm into the mass balance (for details of the implementation, see the program code in ESI†). The thermodynamic constant for this equilibrium is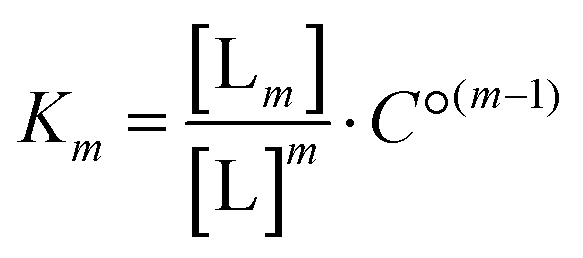 | (1) |
Two different intercalation pockets, TA/TA and AT/AT, alternate in the AT-DNA used for this study. However, for simplicity, the present model considers them to be equal, and thus n is expected to be close to 2 as for classical intercalation.
Furthermore, each intercalated ligand is also assumed to be able to become an external binding site for an additional ligand, characterized by an external binding constant Kext, which we have arbitrarily set as 104 for all ligands. The effect of external binding on the mass balance has been neglected, since Kext used will be at least 100 times less than the effective ligand intercalation binding constant, which is in the range between Ky and Ky2 when the free ligand concentration starts to rise as a consequence of increasing intercalation site saturation.
Results
Isothermal titration calorimetry and model fitting
The raw ITC data of the enantiomers of complexes 1, 2 and 3 are shown in Fig. S1(Δ) and S2(Λ) of ESI.† To the left side of the figures, the ligand is titrated into AT-DNA, and to the right, the ligand is titrated into pure buffer. The ITC profiles obtained deviate strongly from the standard sigmoidal shape typically expected from a ligand–macromolecule binding system with a single type of non-overlapping binding sites. This is consistently observed for both enantiomers of complexes 1–3. As previously suggested by us, this indicates a more complicated ligand–macromolecule binding system with at least two different types of binding interactions present.27,33,35 The Λ-enantiomers share the common feature of showing a more exothermic ITC profile than their Δ counterpart. All complexes show a non-constant heat of dilution, which is small for the unsubstituted complex 1, but very prominent for methylated complexes 2 and 3. Moreover, upon saturation at the end of the titration, when almost all binding sites on the DNA strand are occupied by ligands, the methyl substituted complexes 2 and 3 both show much more intense endothermal heat peaks, compared to the parent complex 1, which cannot be explained by heat of dilution only. To account for the phenomena in a physically meaningful way, here we have explicitly considered the heat of aggregation in solution as well as of external ligand binding to saturated DNA, rather than to introduce constant base-line terms in the model.Linear dichroism studies in solution do not indicate significant binding geometry differences between 1, 2 and 3 for either enantiomer,19 and high resolution X-ray crystal structures of the Λ-enantiomers show virtually identical intercalation geometries irrespective of methyl substituents.20 Thus, it seemed reasonable to attempt a global fit to the ITC data assuming identical intercalation equilibrium constants K and neighbor interaction parameters y for each set of enantiomers, while allowing the binding site coverage parameter n to vary freely.
Aside from the intrinsic (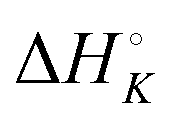 ) and neighbor interaction (
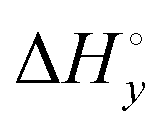 ) reaction enthalpies, this model also considers the oligomer dissociation (
 ) as well as the external DNA association (
 ) enthalpy. As can be seen in Fig. 2, it is possible to find a very good global fit to the integrated peaks of the raw data in Fig. S1 and S2 (ESI†) which gave nRMSD = 7.3% (nRMSD: normalized root-mean-square-deviation, the Euclidian norm of the residual divided by the Euclidian norm of the data). In fact, allowing K and y to vary freely gave only a slightly lower nRMSD (6.4%), indicating that the assumption of similar binding affinity parameters for each set of enantiomers was consistent with the data.
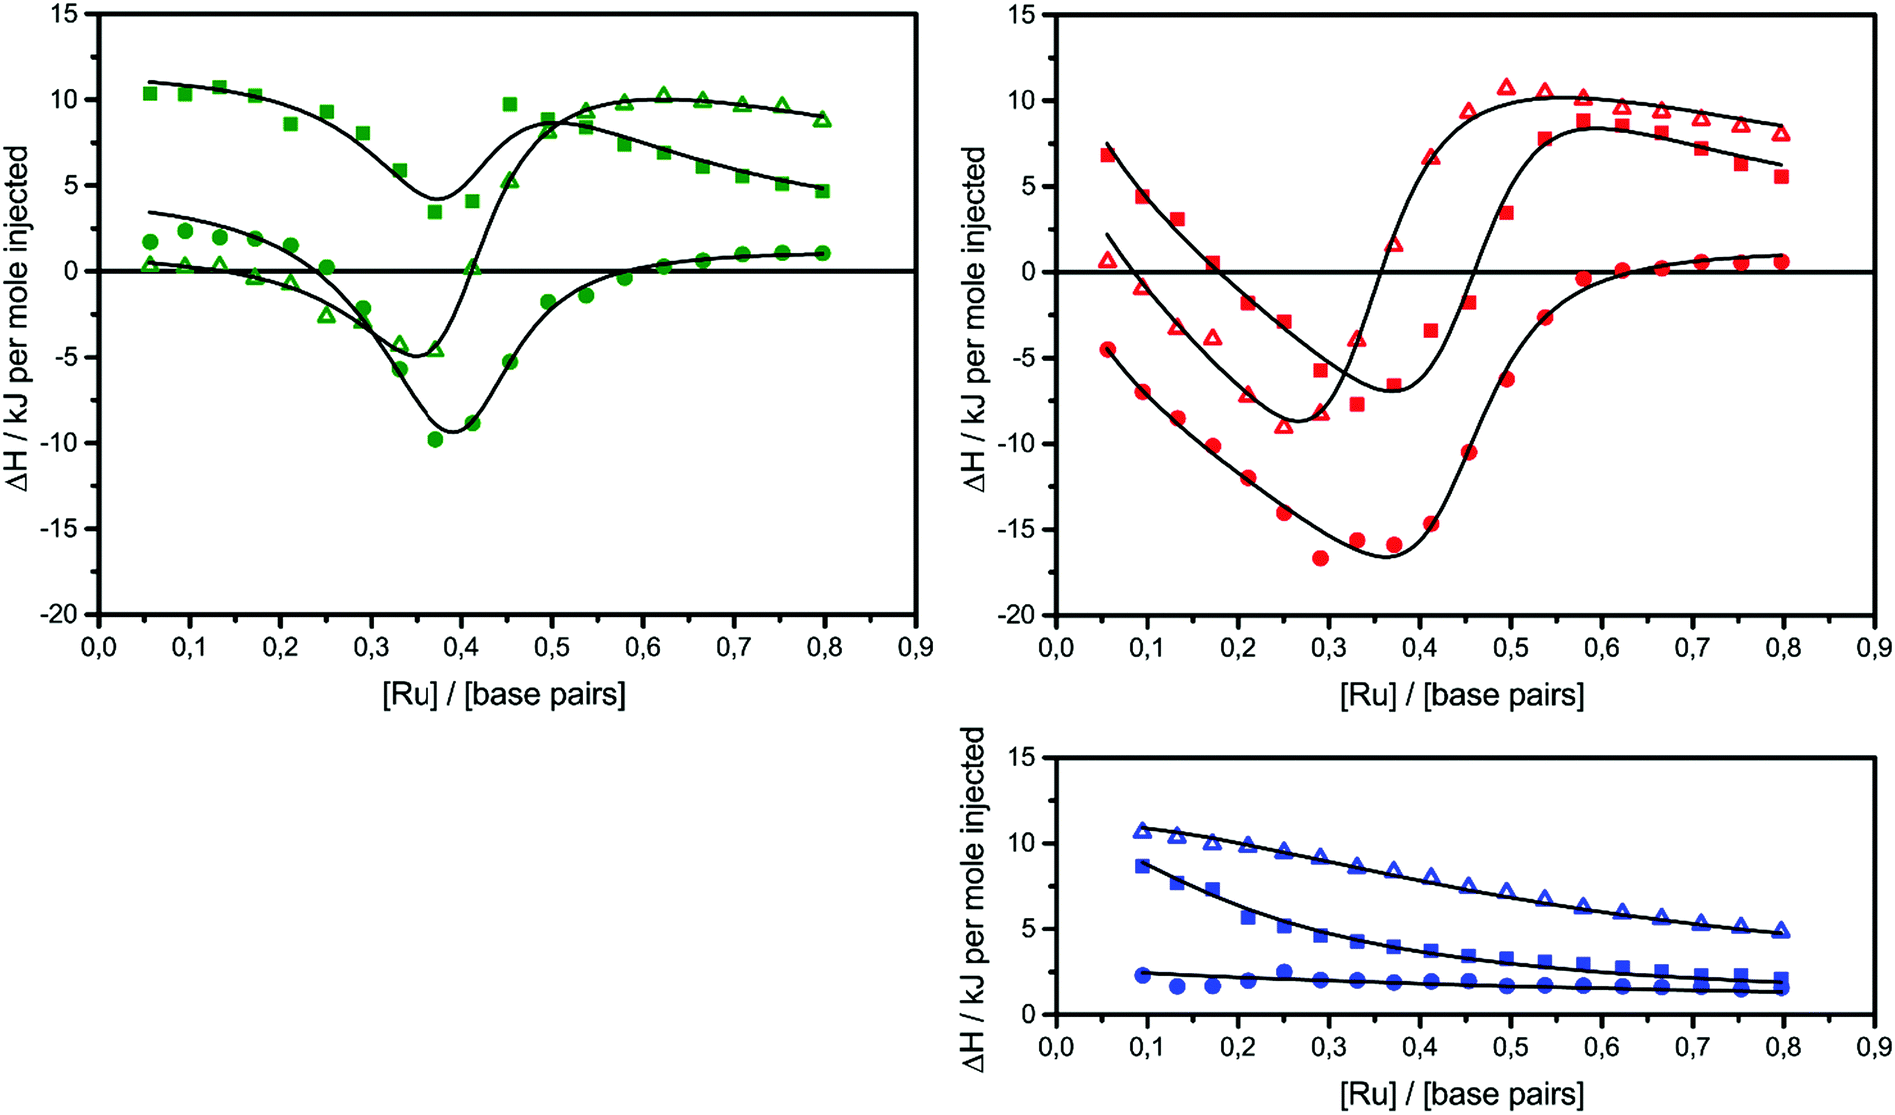 | ||
| Fig. 2 ITC profiles with fitted traces for the titrations of the Δ-enantiomers (top left) and the Λ-enantiomers (top right) into poly(dAdT)2. The symbols (circle: 1; triangle: 2; square: 3) indicate the normalized heat absorbed or evolved upon 2 μl injections of the complex (∼590 μM) into the 206 μl cell containing DNA (∼320 μM nucleotides). The bottom right graph shows the averaged titration of both enantiomers into pure buffer. All titrations were performed in 150 mM NaCl aqueous solution at 25 °C. | ||
Table 1 gives the best global fit binding parameter values, showing that the Δ-enantiomer is anti-cooperative in its nearest-neighbor interactions while the Λ-enantiomer is cooperative. It is worth noting that although the intrinsic binding constant K differs by more than two orders of magnitude between the enantiomers, the effective binding constant close to saturation, Ky2, is rather similar: Ky2 = 5.9 × 10⁶ for Δ and 3.2 × 10⁶ for Λ.
| K Δ/106 | y ΔΔ | n Δ | K Λ/106 | y ΛΛ | n Λ | K 1/(m−1) m | m | |
|---|---|---|---|---|---|---|---|---|
| 1 | 41 | 0.38 | 2.17 | 0.28 | 3.4 | 2.29 | 400 | 2.0 |
| 2 | 41 | 0.38 | 2.25 | 0.28 | 3.4 | 2.99 | 3300 | 3.0 |
| 3 | 41 | 0.38 | 2.24 | 0.28 | 3.4 | 2.25 | 8900 | 2.7 |
Interestingly, the Λ-enantiomers all have larger binding site coverage parameters n compared to Δ. While the difference is small for complexes 1 and 3, it is prominent for complex 2.
The self-aggregation (expressed as the effective dimerization constant K1/(m−1)m in Table 1) increases with the number of methyl groups, but the effective dimerization enthalpy  remains relatively constant as shown in Table 2. The external binding contribution to the ITC-signal
  becomes more prominent upon methylation, in particular for the Λ-enantiomers, but the weak binding makes it impossible to partition this trend into external binding affinity and external binding enthalpy. However, the distinct diastereomeric differences for 2 and, in particular, for 3 suggest that the distal benzene ring of the dppz of one complex and the phenanthroline of another are important for the external binding mode. By electrostatic arguments, it appears most likely that this interaction occurs in the groove opposite to where the Ru(phen)2-moieties of the intercalated complexes reside, i.e. that it is the phenanthrolines of the externally bound complexes that interacts with the methyl groups of the intercalated ones.
| Δ | Λ | |||||
|---|---|---|---|---|---|---|
| 1 | 2 | 3 | 1 | 2 | 3 | |
|
−19.5 | −26.8 | −21.8 | −19.5 | −26.8 | −21.8 |
|
+1.2 | −10.4 | +0.4 | −4.5 | −6.1 | −0.2 |

|
−7.7 | −4.3 | −4.4 | −13.7 | −14.8 | −16.3 |

|
−1.0 | +2.1 | +2.4 | −0.5 | +5.1 | +9.2 |
The differences in the intercalation enthalpy ( ) between the enantiomers of the same complex show no clear trend, but the neighbor interaction enthalpy (
 ) for Λ is about 2–3 times more exothermic than that of Δ. (As an example, the different enthalpy contributions are illustrated for complex 2 in Fig. S3 of ESI.†)
Table 3 highlights the differences in the enthalpy values due to methyl substitution. The much more exothermic intercalation for the Δ-enantiomer of 2 compared to 1 stands out as the most significant effect, followed by the less exothermic intercalation of the Λ-enantiomer of 3 and the less exothermic neighbor interaction enthalpies of the Δ-enantiomers of 2 and 3.
| Complex |
|
|
|
|
|---|---|---|---|---|
| 2 | −11.6 | +3.4 | −1.6 | −1.1 |
| 3 | −0.8 | +3.3 | +4.3 | −2.6 |
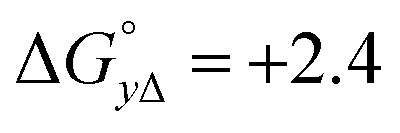
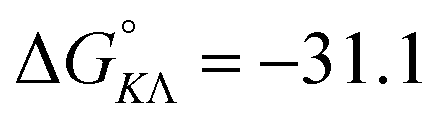
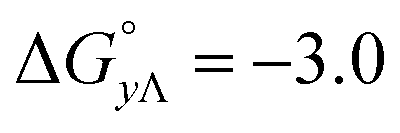
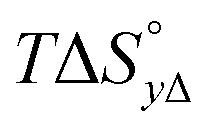
Table 4 gives the free energy changes and entropy contributions calculated from the data in Tables 1 and 2. Since the free energy changes were assumed to depend on chirality only, differences in TΔS° between different complexes directly reflect the enthalpy changes in Table 3. However, these are small enough not to change the overall pattern: intercalation is in all cases predominantly entropy driven, and most so for Δ-enantiomers; the neighbor interaction on the other hand, in all cases, has a large unfavorable entropy.
|
|
|
|
|
|
|---|---|---|---|---|
|
|
|
|
|
|
| 1 | +44.7 | +26.6 | −10.1 | −10.7 |
| 2 | +33.1 | +25.0 | −6.7 | −11.8 |
| 3 | +43.9 | +30.9 | −6.8 | −13.3 |


Discussion
Adding methyl substituents on the distant benzene ring of the intercalating dppz ligand in the parent complex Ru(phen)2dppz2+ increases the hydrophobicity of the complex causing an increased self-aggregation of dimer/trimer structures. This in turn results in a high non-constant heat of dilution when the ligand is added to the macromolecule solution. This additional enthalpy change is in the majority of ITC-studies simply subtracted from the experimental data, but here the magnitude of the heat change is too large not to be included in the analysis.For any binding model to be of practical use, a large number of fitting parameters is not acceptable. Here, we demonstrate an algorithm making it possible to fit experimental data of complicated ligand–macromolecule systems using only a minimum of additional parameters. In order not to over-interpret the data, we have limited the binding model to be the simplest possible. Thus effects due to AT/AT and TA/TA-differences, possible different groove-locations and different intercalation geometries are all neglected. Furthermore, we test the hypothesis that methyl substitution does significantly alter K and y for a given enantiomer.
When the self-aggregation and external binding effects had been accounted for, the seemingly disparate ITC-curves of 1, 2 and 3 (Fig. 2) were indeed found to be consistent with the same binding affinity for all Δ and all Λ enantiomers, i.e. all differences due to methylation could satisfactorily be accounted for as differences in the binding site coverage (n) and the binding and the interacting enthalpy values. This suggests that methylation on the distant benzene ring does not dramatically alter the binding affinity characteristics typical for the enantiomers.
The graphs of concentration changes in the total bound ligand and the neighboring bound ligand, respectively, for Δ and Λ are depicted for 1 in Fig. 3. The more cooperative binding of Λ becomes apparent in the initial part of the interaction curve; the convex shape is due to the facilitated binding of additional ligands. Δ-enantiomers, in contrast, have a concave initial shape due to the anti-cooperative behavior of the ligands. Since the fitting model needs to produce a close coincidence of the Δ and Λ-curves at the end of the titrations, the intrinsic binding constant K has to be correspondingly higher for the anti-cooperative Δ-enantiomer than for Λ.
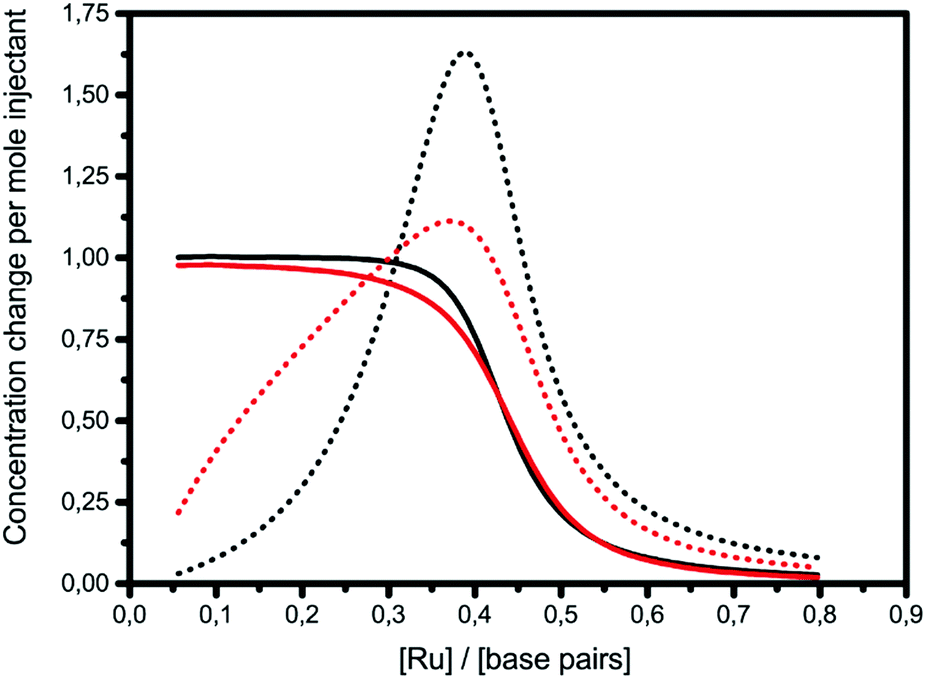 | ||
| Fig. 3 ITC titrations with complex 1 into poly(dAdT)2 with the changes in the concentration of the total bound ligand (solid line) and the neighboring bound ligand (dotted line) (black: Δ; red: Λ). | ||
X-ray structures by Hall et al. have demonstrated the Ru(TAP)2dppz analogues of Λ-1, -2 or -3 to intercalate with the same depth and the same angular orientation.20 The X-ray structure further showed that the 10-methyl group on dppz efficiently protects the exposed dppz aza-nitrogen from interaction with water, consistent with the observation by Olofsson et al. that methyl substitution in the 10-position gave longer luminescence lifetimes for both enantiomers, in polyol solution as well as when intercalated to DNA.19Fig. 4 (left) shows a model of three Δ-2 complexes consecutively intercalated (from the minor groove, as per the suggestion from X-ray structures) two base pairs apart from each other. A more hydrophobic environment around the 10-methyl group, as suggested by the model, than for the methyl groups of the 11,12-disubstituted derivative Δ-3 (Fig. 4 (right)) might account for the significantly more exothermic intercalation enthalpy of Δ-2. If this is the case, the environment around the methyl group of the corresponding enantiomer Λ-2 is expected to be different, perhaps due to a different intercalation depth or different angular orientation in the intercalation pocket.
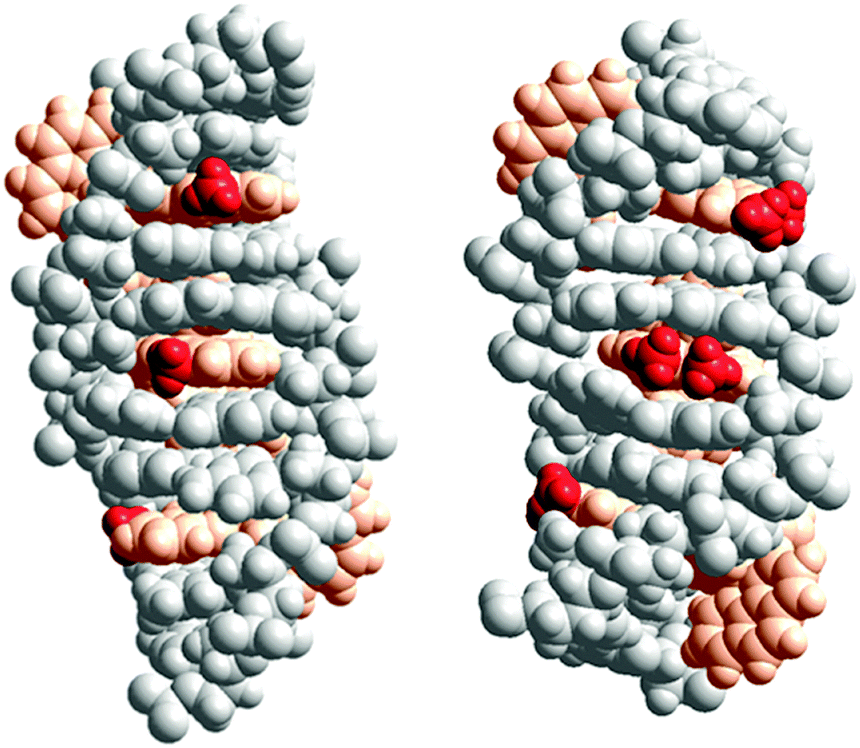 | ||
| Fig. 4 Schematic illustration of the proposed interaction geometries for Δ-2 (left) and Δ-3 (right) intercalated into DNA. The model was constructed by manual docking and subsequent energy minimization in vacuum, using the Amber 2 force field in the HyperChem 8.0 software package (HyperCube, Inc.). The ruthenium(II) ions together with the ancillary and intercalating ligands are colored orange, while the methyl substituents are colored red for easier identification. | ||
Conclusions
The addition of methyl substituents on the intercalating dppz moiety of ruthenium(II) polypyridyl complexes results in non-constant heat of dilution when titrated into a DNA solution. These heat peaks are too strong to simply be subtracted from the intrinsic binding enthalpy and must be included in the analysis. By incorporating the oligomer dissociation as well as the external DNA association enthalpy changes into our general mass balance solving algorithm, we have here demonstrated how complicated binding systems with a large background enthalpy change can still be properly fitted into a binding model, without the need to add unnecessary many parameters. A satisfactory global fit was found when assuming the binding affinities for each enantiomer of both non-methylated and methylated dppz-Ru to be equal, while only allowing the binding site size to vary freely.Conflicts of interest
There are no conflicts to declare.Acknowledgements
The authors gratefully acknowledge Swedish Research Council (Vetenskapsrådet) grant 2016-05421 and Chalmers Area of Advance Nano for funding, as well as COST Action CM1105 for providing a forum for stimulating discussions.Notes and references
- J. K. Barton, A. T. Danishefsky and J. M. Goldberg, J. Am. Chem. Soc., 1984, 106, 2172–2176 CrossRef CAS.
- C. V. Kumar, J. K. Barton and N. J. Turro, J. Am. Chem. Soc., 1985, 107, 5518–5523 CrossRef CAS.
- J. K. Barton, J. M. Goldberg, C. V. Kumar and N. J. Turro, J. Am. Chem. Soc., 1986, 108, 2081–2088 CrossRef CAS.
- A. Yamagishi, J. Chem. Soc., Chem. Commun., 1983, 572–573 RSC.
- J. M. Kelly, A. B. Tossi, D. J. McConnell and C. Ohuigin, Nucleic Acids Res., 1985, 13, 6017–6034 CrossRef CAS PubMed.
- R. M. Hartshorn and J. K. Barton, J. Am. Chem. Soc., 1992, 114, 5919–5925 CrossRef CAS.
- J. M. Kelly, D. J. McConnell, C. Ohuigin, A. B. Tossi, A. K. D. Mesmaeker, A. Masschelein and J. Nasielski, J. Chem. Soc., Chem. Commun., 1987, 1821–1823 RSC.
- A. E. Friedman, J. C. Chambron, J. P. Sauvage, N. J. Turro and J. K. Barton, J. Am. Chem. Soc., 1990, 112, 4960–4962 CrossRef CAS.
- A. E. Friedman, C. V. Kumar, N. J. Turro and J. K. Barton, Nucleic Acids Res., 1991, 19, 2595–2602 CrossRef CAS PubMed.
- Y. Jenkins, A. E. Friedman, N. J. Turro and J. K. Barton, Biochemistry, 1992, 31, 10809–10816 CrossRef CAS PubMed.
- B. Önfelt, P. Lincoln, B. Nordén, J. S. Baskin and A. H. Zewail, Proc. Natl. Acad. Sci. U. S. A., 2000, 97, 5708–5713 CrossRef PubMed.
- C. G. Coates, J. Olofsson, M. Coletti, J. J. McGarvey, B. Önfelt, P. Lincoln, B. Nordén, E. Tuite, P. Matousek and A. W. Parker, J. Phys. Chem. B, 2001, 105, 12653–12664 CrossRef CAS.
- J. G. Liu, B. H. Ye, H. Li, L. N. Ji, R. H. Li and J. Y. Zhou, J. Inorg. Biochem., 1999, 73, 117–122 CrossRef CAS.
- J. G. Liu, Q. L. Zhang, X. F. Shi and L. N. Ji, Inorg. Chem., 2001, 40, 5045–5050 CrossRef CAS PubMed.
- L. Wang, J. Z. Wu, G. Yang, T. X. Zeng and L. N. Ji, Transition Met. Chem., 1996, 21, 487–490 CAS.
- B. Y. Wu, L. H. Gao, Z. M. Duan and K. Z. Wang, J. Inorg. Biochem., 2005, 99, 1685–1691 CrossRef CAS PubMed.
- D. Lawrence, V. G. Vaidyanathan and B. U. Nair, J. Inorg. Biochem., 2006, 100, 1244–1251 CrossRef CAS PubMed.
- P. U. Maheswari, V. Rajendiran, M. Palaniandavar, R. Parthasarathi and V. Subramanian, J. Inorg. Biochem., 2006, 100, 3–17 CrossRef CAS PubMed.
- J. Olofsson, L. M. Wilhelmsson and P. Lincoln, J. Am. Chem. Soc., 2004, 126, 15458–15465 CrossRef CAS PubMed.
- J. P. Hall, H. Beer, K. Buchner, D. J. Cardin and C. J. Cardin, Organometallics, 2015, 34, 2481–2486 CrossRef CAS.
- S. Vasudevan, J. A. Smith, M. Wojdyla, A. DiTrapani, P. E. Kruger, T. McCabe, N. C. Fletcher, S. J. Quinn and J. M. Kelly, Dalton Trans., 2010, 39, 3990–3998 RSC.
- K. O’Donoghue, J. C. Penedo, J. M. Kelly and P. E. Kruger, Dalton Trans., 2005, 1123–1128 RSC.
- C. Hiort, P. Lincoln and B. Nordén, J. Am. Chem. Soc., 1993, 115, 3448–3454 CrossRef CAS.
- I. Haq, P. Lincoln, D. Suh, B. Nordén, B. Z. Chowdhry and J. B. Chaires, J. Am. Chem. Soc., 1995, 117, 4788–4796 CrossRef CAS.
- P. Lincoln, A. Broo and B. Nordén, J. Am. Chem. Soc., 1996, 118, 2644–2653 CrossRef CAS.
- P. Lincoln and B. Nordén, Chem. Commun., 1996, 2145–2146 RSC.
- J. Andersson, L. H. Fornander, M. Abrahamsson, E. Tuite, P. Nordell and P. Lincoln, Inorg. Chem., 2013, 52, 1151–1159 CrossRef CAS PubMed.
- I. Jelesarov and H. R. Bosshard, J. Mol. Recognit., 1999, 12, 3–18 CrossRef CAS PubMed.
- T. Wiseman, S. Williston, J. F. Brandts and L. N. Lin, Anal. Biochem., 1989, 179, 131–137 CrossRef CAS PubMed.
- J. E. Ladbury and B. Z. Chowdhry, Chem. Biol., 1996, 3, 791–801 CrossRef CAS PubMed.
- K. Luke, D. Apiyo and P. Wittung-Stafshede, Biophys. J., 2005, 89, 3332–3336 CrossRef CAS PubMed.
- A. Velazquez-Campoy, S. A. Leavitt and E. Freire, Methods Mol. Biol., 2004, 261, 35–54 CAS.
- A. K. F. Mårtensson and P. Lincoln, Dalton Trans., 2015, 44, 3604–3613 RSC.
- J. D. McGhee and P. H. V. Hippel, J. Mol. Biol., 1974, 86, 469–489 CrossRef CAS PubMed.
- A. K. F. Mårtensson and P. Lincoln, Phys. Chem. Chem. Phys., 2018, 20, 7920–7930 RSC.
- P. Lincoln and B. Nordén, J. Phys. Chem. B, 1998, 102, 9583–9594 CrossRef CAS.
Footnote |
| † Electronic supplementary information (ESI) available. See DOI: 10.1039/c8cp01151f |
| This journal is © the Owner Societies 2018 |