
 Open Access Article
 This Open Access Article is licensed under a Creative Commons Attribution-Non Commercial 3.0 Unported Licence
Average orientation of a fluoroaromatic molecule in lipid bilayers from DFT-informed NMR measurements of 1H–19F dipolar couplings†
Eleri
Hughes
,
John M.
Griffin
 ,
Michael P.
Coogan
and
David A.
Middleton
*
,
Michael P.
Coogan
and
David A.
Middleton
*
Department of Chemistry, Lancaster University, Lancaster, LA1 4YB, UK. E-mail: d.middleton@lancaster.ac.uk; Tel: +44 1524 594328
First published on 1st June 2018
Abstract
Fluorine is often incorporated into the aromatic moieties of synthetic bioactive molecules such as pharmaceuticals and disease diagnostics in order to alter their physicochemical properties. Fluorine substitution may increase a molecule's lipophilicity, thereby enabling its diffusion across cell membranes to enhance bioavailability or to exert a direct physiological effect from within the lipid bilayer. Understanding the structure, dynamics and orientation of fluoroaromatic molecules in lipid bilayers can provide useful insight into the effect of fluorine on their mode of action, and their interactions with membrane-embedded targets or efflux proteins. Here we demonstrate that NMR measurements of 19F chemical shift anisotropy combined with 1H–19F dipolar coupling measurements together report on the average orientation of a lipophilic fluoroaromatic molecule, 4-(6-fluorobenzo[d]thiazol-2-yl)aniline (FBTA), rapidly rotating within a lipid bilayer. The 19F chemical shift tensor orientation in the molecular frame was calculated by density functional theory and corroborated by 1H–19F PISEMA NMR. It was then possible to analyse the line shapes of proton-coupled and proton-decoupled 19F spectra of FBTA in chain perdeuterated dimyristoylphosphatidylcholine (DMPC-d54) bilayers to restrict the average axis of molecular reorientation of FBTA in the bilayer to a limited range orientations. This approach, which exploits the high sensitivity and gyromagnetic ratios of 19F and 1H, will be useful for comparing the membrane properties of related bioactive fluoroaromatic compounds.
Introduction
Fluorine is becoming increasing prevalent in pharmaceuticals and agrochemicals owing to its ability to influence physicochemical properties such as molecular dipole moments, pKa and lipophilicity, which can have profound effects on biological activity.1 Lipophilicity is an important property of bioactive molecules, which enables them to cross the blood–brain barrier and to enter, diffuse within, or cross cell membranes to reach their biological target. Drug–lipid interactions may also induce a direct biological response, by destabilising cell membranes to induce endocytosis or to promote fusion with liposomal delivery agents. Understanding the structural and dynamic properties of bioactive molecules within lipid bilayers is fundamentally important for assessing their potential as pharmaceuticals or as diagnostics, for example. Small molecules can diffuse laterally within the plane of a lipid bilayer and rotationally about an axis or axes that define the orientation of the molecule with respect to the bilayer normal. The orientational preference of a molecule within cell membranes can not only influence its activity, but may also affect its interaction with efflux transporters that export drugs from the bilayer back into the blood-stream.2 It is estimated that as many of 30% of new approved drugs contain fluoroaromatic or fluoroalkyl groups.3NMR is particularly well-suited to the study of molecular structure, orientation and dynamics of biomolecules within lipid bilayers represented by large multilamellar or unilamellar vesicles. For small, drug-like organic molecules in large vesicles, where rotational diffusion within the lipid bilayer is rapid and the rates of vesicle tumbling and drug lateral diffusion within the bilayer are slow, the anisotropic nuclear spin interactions (chemical shielding, dipole–dipole and quadrupolar for I ≥ 1) are averaged in a predictable way.2,4–8 NMR line shape analysis provides information about the nature of the dynamic process giving rise to the scaled interactions, such as the average orientation of the lipophile relative to the bilayer normal. These measurements often require isotope labelling with 13C, 15N or 2H to enhance sensitivity, which can be costly and technically demanding. 19F is an attractive nucleus for studies of drug–membrane interactions by virtue of its 100% isotopic abundance, high receptivity, high gyromagnetic ratio, and low background in endogenous biological materials.6
Here we report a new approach exploiting NMR measurements of 19F chemical shift anisotropy and 1H–19F dipolar coupling, combined with DFT calculations, to determine the average orientation of lipophilic solutes in lipid bilayers. The combination of 19F CSA measurements and 1H–19F dipolar coupling measurements could, if validated, provide a useful approach for determining molecular orientations of fluorinated drugs in lipid bilayers, by offering high sensitivity (and relatively short measurement times) without requiring isotope enrichment. To test this approach, we use as a model system the lipophilic compound 4-(6-fluorobenzo[d]thiazol-2-yl)aniline (FBTA) (Fig. 2A), which is a fluorinated analogue of the lipophilic Pittsburgh compound B used for imaging amyloid plaque deposition in the brain and which must cross the blood–brain barrier.9
Methods and materials
Preparation of membrane samples
For experiments in lipid bilayers, FBTA (Fluorochem Ltd) was recrystallized from 50% ethanol:water to remove a catalytic impurity. The compound (1 mg) was dissolved in chloroform![[thin space (1/6-em)]](https://www.rsc.org/images/entities/char_2009.gif) :methanol (50:50) with a 20-fold molar excess of DMPC-d54 (Avanti Polar Lipids, Inc.) and dried to a thin film in a round bottom flask under nitrogen and then under high vacuum. Multilamellar vesicles were produced by resuspending the film in water, subjecting to 5 freeze–thaw cycles and centrifuging in a bench top centrifuge to remove excess liquid. The pellet was transferred to a 3.2 mm diameter zirconium rotor and lyophilised overnight. The rotor was fitted with a cap for NMR analysis. The preparation of hydrated membranes followed the same procedure but omitting the final lyophilisation step.
:methanol (50:50) with a 20-fold molar excess of DMPC-d54 (Avanti Polar Lipids, Inc.) and dried to a thin film in a round bottom flask under nitrogen and then under high vacuum. Multilamellar vesicles were produced by resuspending the film in water, subjecting to 5 freeze–thaw cycles and centrifuging in a bench top centrifuge to remove excess liquid. The pellet was transferred to a 3.2 mm diameter zirconium rotor and lyophilised overnight. The rotor was fitted with a cap for NMR analysis. The preparation of hydrated membranes followed the same procedure but omitting the final lyophilisation step.
Crystallisation of FBTA
For crystal structure determination and NMR analysis of the solid, FBTA was recrystallized as a methanol solvate. Commercially sourced FBTA (Fluorochem Ltd) was initially purified by removal of impurities which crystallised first upon cooling of the minimum volume of hot ethanol required to dissolve the sample from hot ethanol followed by precipitation of the FBTA by addition of an equal volume of water. Crystals suitable for X-ray diffraction were then grown by repeatedly crystallising from hot methanol, removing the supernatant liquid and repeating the process 4 times. A suitable crystal was selected and mounted on a Rigaku SuperNova diffractometer with and Atlas detector. The crystal was kept at 100.01(10) K during data collection. The crystallographic data set was solved and refined using the SHELX suite of software.10NMR analysis
All measurements were performed on a Bruker Avance III spectrometer with a 89 mm bore magnet operating at 9.3 T. A Bruker quadruple resonance (HFXY) magic-angle spinning probe tuned simultaneously to 19F and 1H was used for all measurements, without sample spinning except where stated. The recycle delay was 2 s for measurements on the membrane samples and 4 s for measurements on solid FBTA.The proton-decoupled 19F spectra of solid FBTA and the lyophilised membrane sample were obtained with an initial 2.5 ms 90° pulse at the frequency of 1H followed by 2 ms ramped cross-polarisation from 1H to 19F at a proton nutation frequency of 40 kHz followed by SPINAL-64 proton decoupling11 at a field of 83 kHz during signal acquisition. The spectrum of lyophilised sample is the result of averaging 2048 transients and the spectrum of solid FBTA is the result of averaging 128 transients. The proton-decoupled 19F spectrum of the hydrated membrane sample at 30 °C was obtained with direct excitation of 19F using a 4.2 μs 90° pulse and is the result of averaging 64 transients. The proton-coupled spectrum was acquired under the same conditions but omitting proton irradiation, and is the result of averaging 2048 transients.
The 1H–19F polarisation-inversion spin-exchange at the magic-angle (PISEMA) spectra were obtained using the basic pulse sequence described by Wu et al.12 For the lyophilised sample, an initial 2.5 ms 90° pulse on 1H was followed by 2 ms ramped cross-polarisation from 1H to 19F at a proton nutation frequency of 40 kHz. Spin exchange at the magic-angle was achieved using frequency switched Lee-Goldberg cross-polarisation at a proton field of 62.5 kHz and matched 19F field of 76 kHz. The spectrum was the result of 32 t1 increments in the indirect dimension, with averaging of 512 transients per increment. For the hydrated sample at 30 °C, 19F was excited directly using a 4.2 μs 90° pulse and 16 transients were averaged for each of 128 t1 increments.
Computational details
Optimisation of the molecular geometry and calculation of the NMR parameters was performed using the CASTEP density functional theory code,13 employing the GIPAW algorithm,14 which allows the reconstruction of the all-electron wave function in the presence of a magnetic field. The CASTEP calculations employed the generalised gradient approximation (GGA) PBE functional15 and core–valence interactions were described by ultrasoft pseudopotentials.16 In the geometry optimisations for the single molecule and for the crystal structure, all atomic positions were allowed to vary. The optimisation of the methanol solvate crystal structure was carried out using the G06 semi-empirical dispersion correction scheme,17 with the unit cell parameters allowed to vary. Both the geometry optimisation and NMR calculation for this structure were carried out with a k-point spacing of 0.05 2π Å−1 and a planewave energy cut-off of 50 Ry. For the isolated molecule, the geometry optimisation and NMR calculation were performed also using a planewave energy cut-off of 50 Ry (680 eV), but calculations were performed using a planewave energy cut-off of 50 Ry (680 eV) and due to the large cell size, a single k-point at the fractional coordinate (0.25, 0.25, 0.25) in reciprocal space for integration over the Brillouin zone. The calculations generate the absolute shielding tensor (σ) and diagonalisation of the symmetric part of σ yields as eigenvalues the principal components σXX, σYY and σZZ and their orientations in the molecular frame are given by the eigenvectors.The Euler angles defining the orientation of the individual 1H–19F dipolar vectors in the chemical shift principal axis system were calculated using a C program written specifically for the purpose. Briefly, the angles were calculated from the atomic coordinates of the optimised FBTA molecule expressed in a systematically varied CSA axis system with the origin at fluorine. Simulations of protein-coupled and PISEMA spectra were performed using SIMPSON.18
Results and discussion
Theoretical considerations
Considering a fluorinated molecule in a lipid bilayer, the large 19F chemical shift anisotropy (CSA) is the most convenient measureable NMR property that carries information on the motional properties and orientation of the molecule. In the absence of motional averaging, the CSA tensor δ has three principal components, δ11, δ22 and δ33, where (δ11 − δiso) ≥ (δ33 − δiso) ≥ (δ22 − δiso) and δiso is the isotropic chemical shift derived according to δiso = (δ11 + δ22 + δ33)/3. The principal values are directed along three orthogonal principal axes. For a static solid, the magnitude of the anisotropy is defined as . For a molecule in a lipid bilayer, rapid anisotropic reorientation at a frequency greater than the static 19F CSA (typically >30 kHz) scales the anisotropy in a predictable way. Rapid molecular reorientation includes lateral diffusion within the plane of the lipid bilayer and/or vesicular tumbling when the vesicle radius r is sufficiently small, together represented by a single rotational correlation time:19
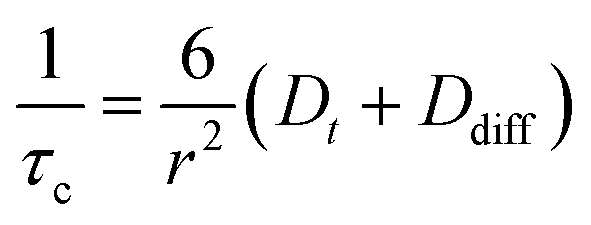 | (1) |
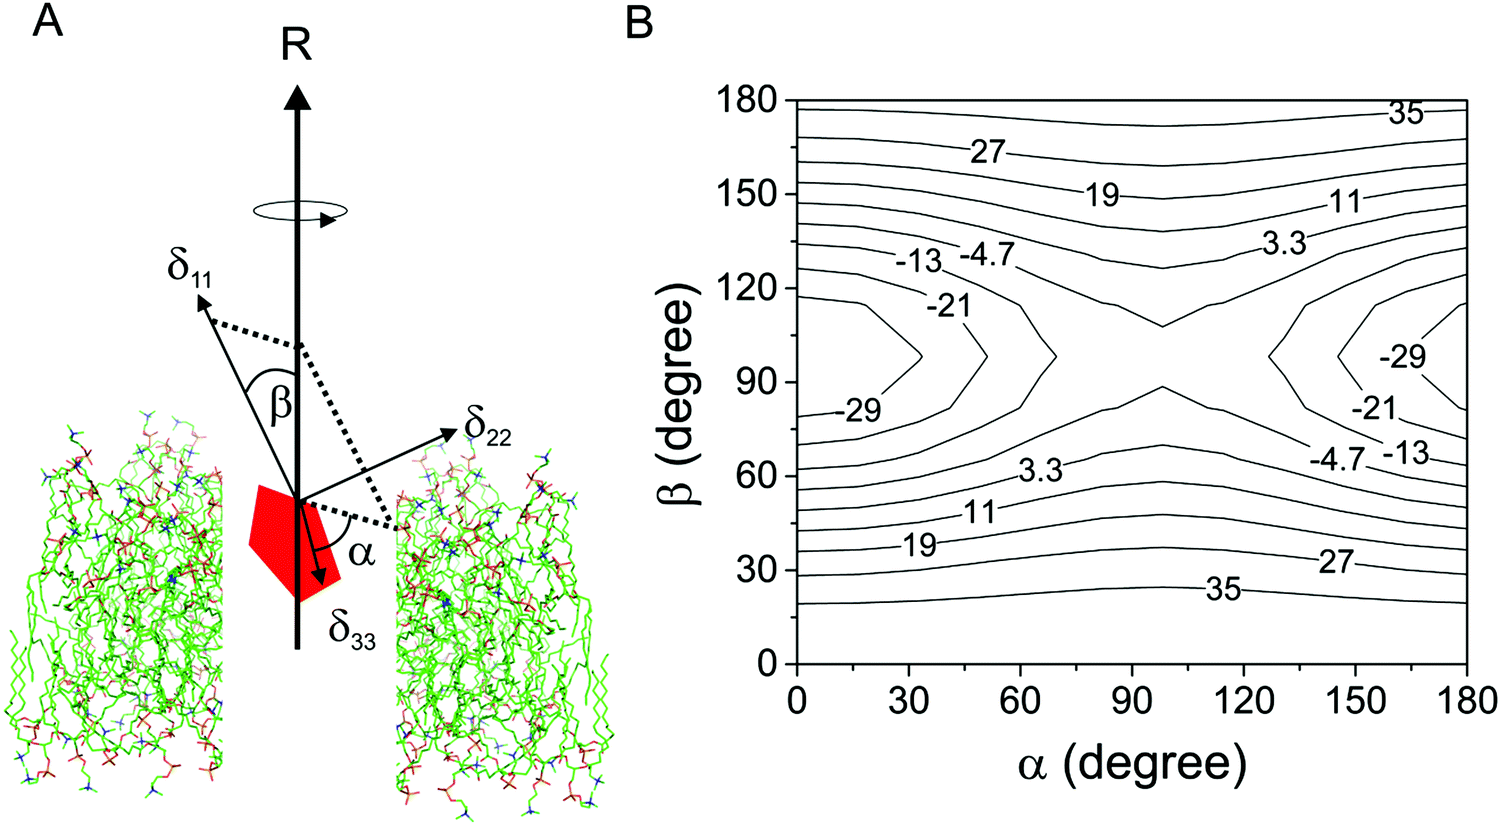 | ||
| Fig. 1 Relationship between the measured chemical shift anisotropy (CSA) and the molecular rotational axis of a molecule (red pentagon) undergoing rotational diffusion in a lipid bilayer. (A) The averaged anisotropy, Δδav, for a rapidly-rotating molecule is a function of the angles α and β, which define the orientations of the principal values, δ11 and δ33, relative to the axis of rotation R parallel with the bilayer normal. The origin is positioned at the observed nuclear spin. (B) Relationship between Δδav (contour levels given in ppm) and angles α and β. The values of Δδ shown in the contour plot are calculated from arbitrary values of δ11, δ22 and δ33 (100, 40 and 20 ppm, respectively) and Smol is given a value of 1.0 to represent rotational diffusion around a single axis with no additional motional fluctuations. | ||
When lateral diffusion, vesicle tumbling and internal motions are not significant, the observed averaged 19F CSA, Δδav, is given by20,21
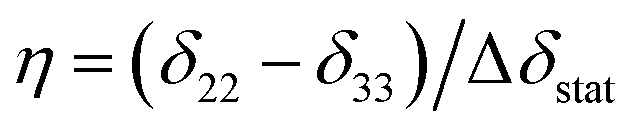
| Δδav = 0.5SmolΔδstat(3cos2β − 1 − ηsin2βcos2α) | (2) |
 . Fig. 1B illustrates an example of the relationship between Δδobs, α and β for a molecule rotating in a lipid bilayer, for arbitrary values of δ11, δ22 and δ33 and Smol = 1.0 to represent rotation about the principal axis only.
Fig. 1 highlights two points to consider when using scaled CSA values to determine the orientation of the axis of molecular rotation within lipid bilayers. First, it is necessary to know the orientation of the chemical shift principal axis system in the molecular reference frame. Good predictions are now possible using quantum chemistry calculations, such as density functional theory (DFT), which have been used as the basis for interpreting the NMR spectra of molecules within lipid bilayers.6,8 Close agreement between the calculated and the experimentally-measured principal values is usually taken as an indicator of the reliability of the predicted orientation of the tensor elements in the molecular frame. However, as such calculations are performed on isolated molecules or on molecules within a crystal lattice, they may not accurately reflect the bilayer environment. Secondly, it is clear from Fig. 1B that a continuum of α and β values can account for the measured value of Δδav and so the direction of the rotational axis in the molecular frame cannot be determined unambiguously from CSA information alone. Supplementary NMR measurements, such as 19F–13C dipolar couplings or 2H quadrupolar analysis of deuterated sites within the same molecule, have been shown to reduce the ambiguity but require lengthy measurement times and/or isotope enrichment.6
CSA analysis of FBTA in lipid bilayers
FBTA was incorporated into multilamellar vesicles (MLV) of chain-perdeuterated dimyristoylphosphatidylcholine (DMPC-d54) at a lipid to FBTA molar ratio of 20:1 and then the mixture was lyophilised to enable the static 19F CSA (i.e., Δδstat) to be measured in the lipid environment. Fig. 2B shows the proton-decoupled 19F spectrum of the lyophilised material, from which were extracted values of δ11, δ22 and δ33 (Table 1). The line shape is consistent with an axially asymmetric CSA tensor expected for FBTA in a static powder environment. The bilayers were then hydrated with phosphate buffer (10 mM in D2O) and a second spectrum was recorded at 30 °C (∼7 °C above the chain melting temperature of DMPC) (Fig. 2C). The 19F line shape now indicates a scaled and axially symmetric CSA brought about by rapid (i.e., >50 kHz, the static powder line width) motional averaging of the CSA; the value of Δδav lies between 1.05 ppm and 1.25 ppm according to comparisons with simulated spectra (Fig. 2D). Lateral diffusion and vesicle tumbling are not expected to influence the line shape because of the large size and low curvature of MLVs,19,23 but if FBTA disrupts the lipid bilayer and promotes the formation of smaller vesicles and/or non-bilayer structures then contributions of these modes of motion may be significant. A 31P NMR spectrum of the lipid head groups in the same sample gives an indication of the influence of lateral diffusion. The full width of the measured 31P powder pattern, Δδ = (δ|| − δ⊥), is close to 45 ppm (Fig. S1, ESI†), which is the value expected for large MLVs in which averaging of the static 31P CSA of the choline head groups is principally by rotational motion.19,23 Simulated spectra indicate that additional rapid lateral diffusion (or vesicle tumbling) resulting in a mean angular displacement of the lipid from its initial position within the plane of the bilayer would reduce the powder line width,22 and a displacement as small as 10° results in a measureable reduction of Δδ. If it is assumed that the rate of lateral diffusion of FBTA is similar to that of DMPC, it is reasonable to neglect the effects of lateral diffusion when analysing the 19F spectra and focus on the effects of rotational motions.
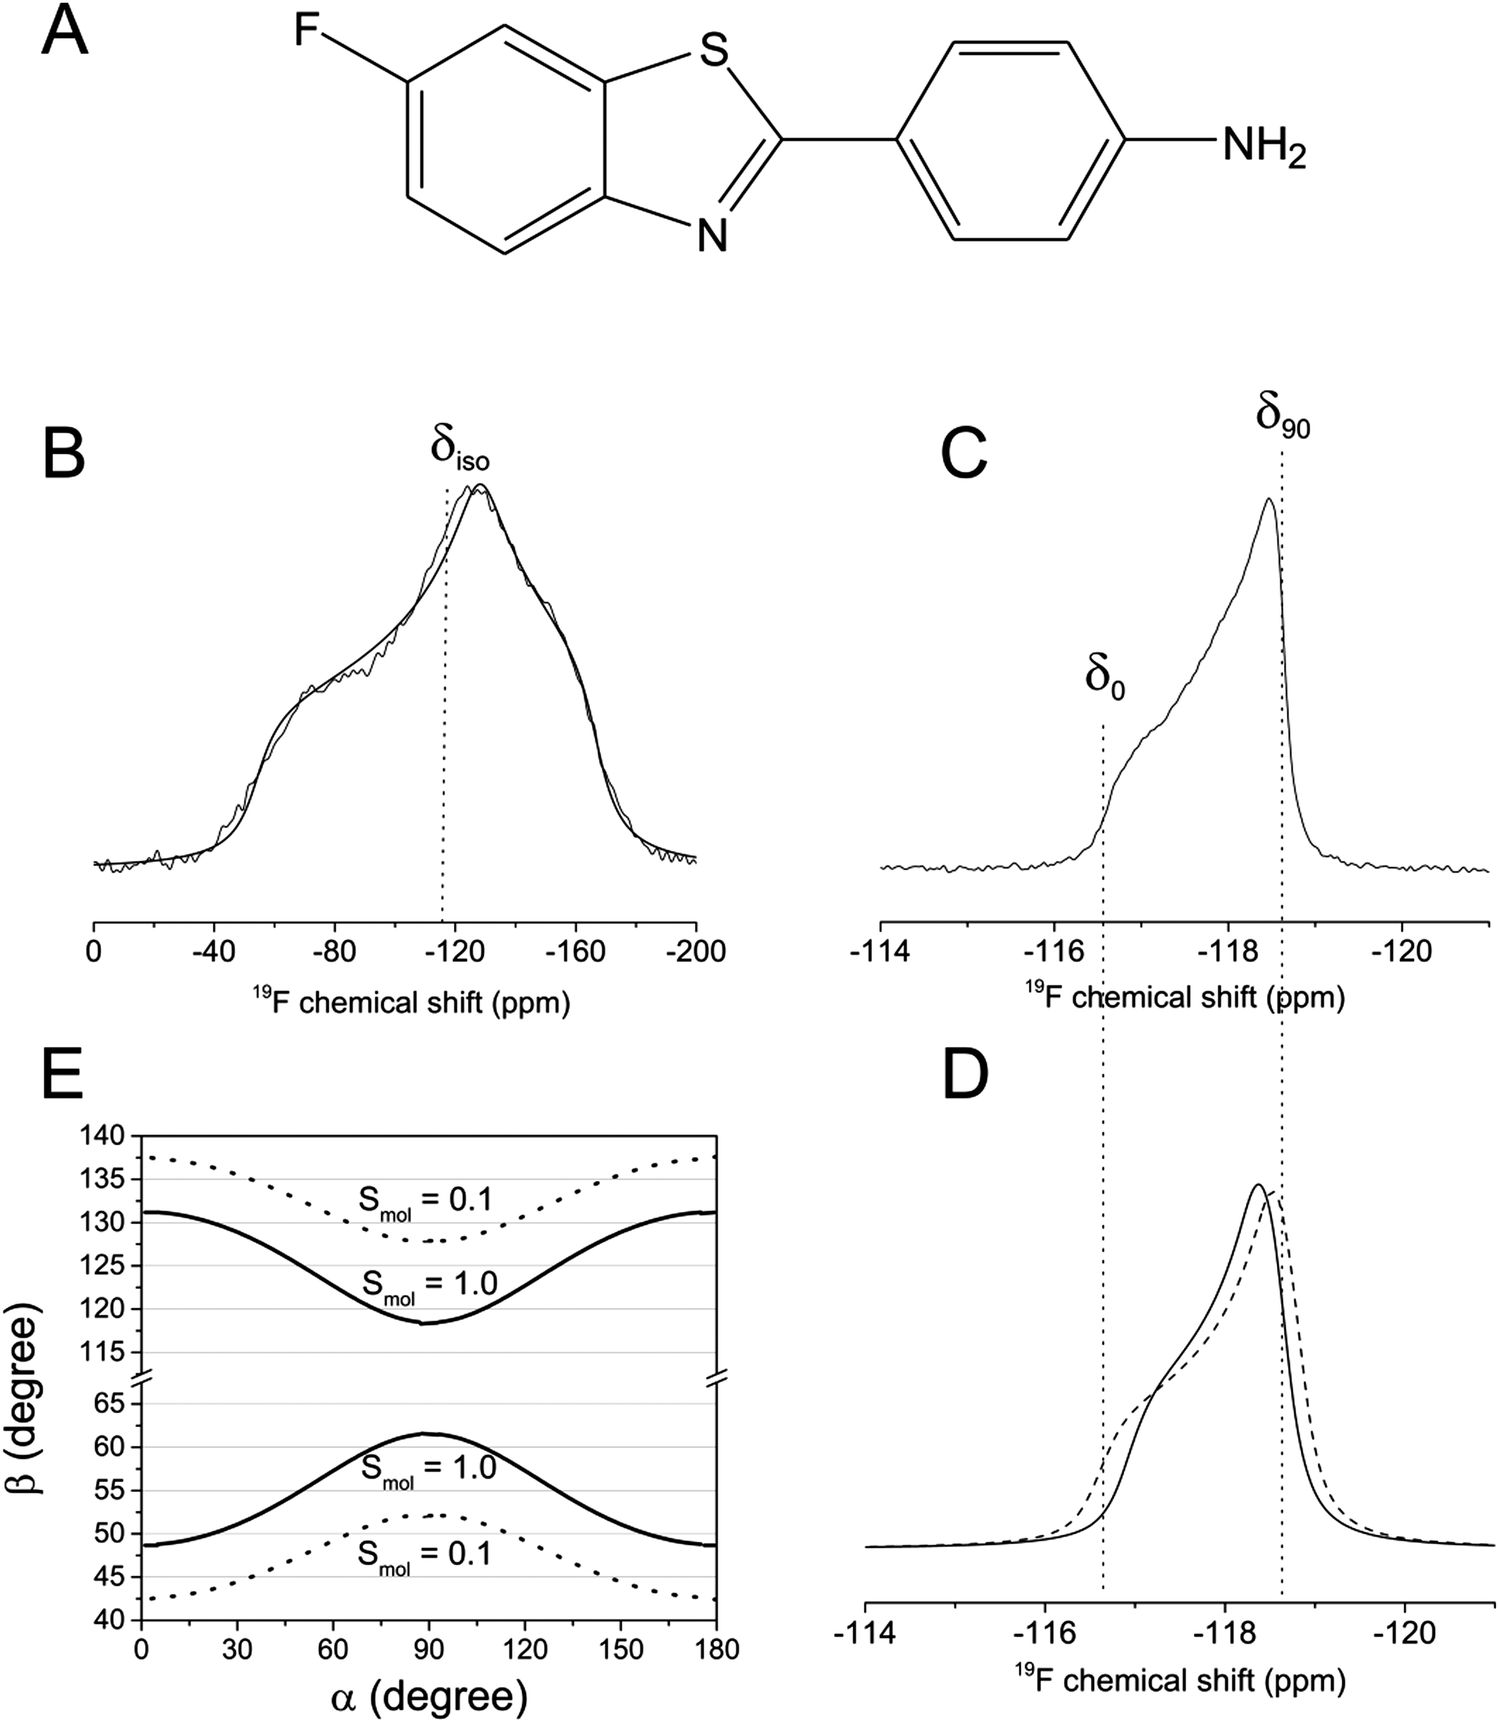 | ||
| Fig. 2 Static, proton-decoupled 19F NMR spectra of FBTA in DMPC-d54 bilayers. (A) Chemical structure of FBTA. (B) Powder spectrum of FBTA in lyophilised bilayers, with the calculated isotropic chemical shift, δiso, indicated. (C) Dynamically averaged powder pattern in hydrated bilayers at 30 °C, where δ0 and δ90 are the 19F chemical shifts for bilayer orientations at 0° and 90° to the magnetic field. (D) Simulated axially symmetric powder patterns for Δδav values of 1.05 ppm (solid line) and 1.25 ppm (dashed line), representing the lower and upper limits of the best fits to the experimental spectrum. (E) Permitted combinations of angles, [α, β], consistent with values of Δδ = 1.15 ± 0.10 ppm, when Smol = 1.0 (solid lines) and Smol = 0.1 (dashed lines). | ||
| Method (environment) | δ 11 (ppm) | δ 22 (ppm) | δ 33 (ppm) | δ iso (ppm) | Δδstat (ppm) | η |
|---|---|---|---|---|---|---|
| a Recrystallised from methanol. b Calculated with σref = 140.3 ppm. Computed values of σref, σXX, σYY and σZZ are averages for the 8 molecules in the crystal lattice. c Calculate with σref = 145.9 ppm. | ||||||
| Experimental (methanol solvate)a | −64.3 | −121.8 | −158.7 | −114.9 | 50.6 | 0.73 |
| Calculated (methanol solvate)b | −41.9 | −117.9 | −185.0 | −114.9 | 73.0 | 0.92 |
| Experimental (lyoph. bilayer) | −57.3 | −134.8 | −162.5 | −118.2 | 60.9 | 0.67 |
| Calculated (single molecule)c | −36.4 | −133.9 | −183.7 | −118.2 | 81.8 | 0.61 |
Combinations of angles α and β that are consistent with 1.05 ≤ Δδav ≤ 1.25 ppm were calculated from eqn (2) for values of Smol of 1.0 and 0.1. For each Smol value, two distributions of angle combinations are observed, as expected, each distribution forming a sinusoidal continuum (Fig. 2E). The combinations of permitted angles are clearly sensitive to Smol and so this variable must be taken into account in the calculations later. A value of 0.80 for Smol is typical of the order parameters determined for ergosterol and cholesterol in lipid bilayers.6,8
DFT calculations
Reliable calculation or measurement of the shielding tensor orientation in the molecular frame is required to extract the details of the FBTA molecular rotational axis from the NMR data. DFT calculations of the chemical shielding tensor values and orientation in the molecular frame were performed using the crystal structure coordinates for FBTA crystallised as a methanol solvate (orthorhombic, space group Pbca; Fig. S2, ESI†). The calculations generate the absolute shielding tensor (σ) with principal components σXX > σYY > σZZ, and the calculated isotropic shielding, σic, is given by (1/3) Trσ. The calculated chemical shift values are obtained by subtracting σXX, σYY and σZZ from a reference shielding value defined here as| σref = δiso + 1/3(σXX + σYY + σZZ) | (3) |
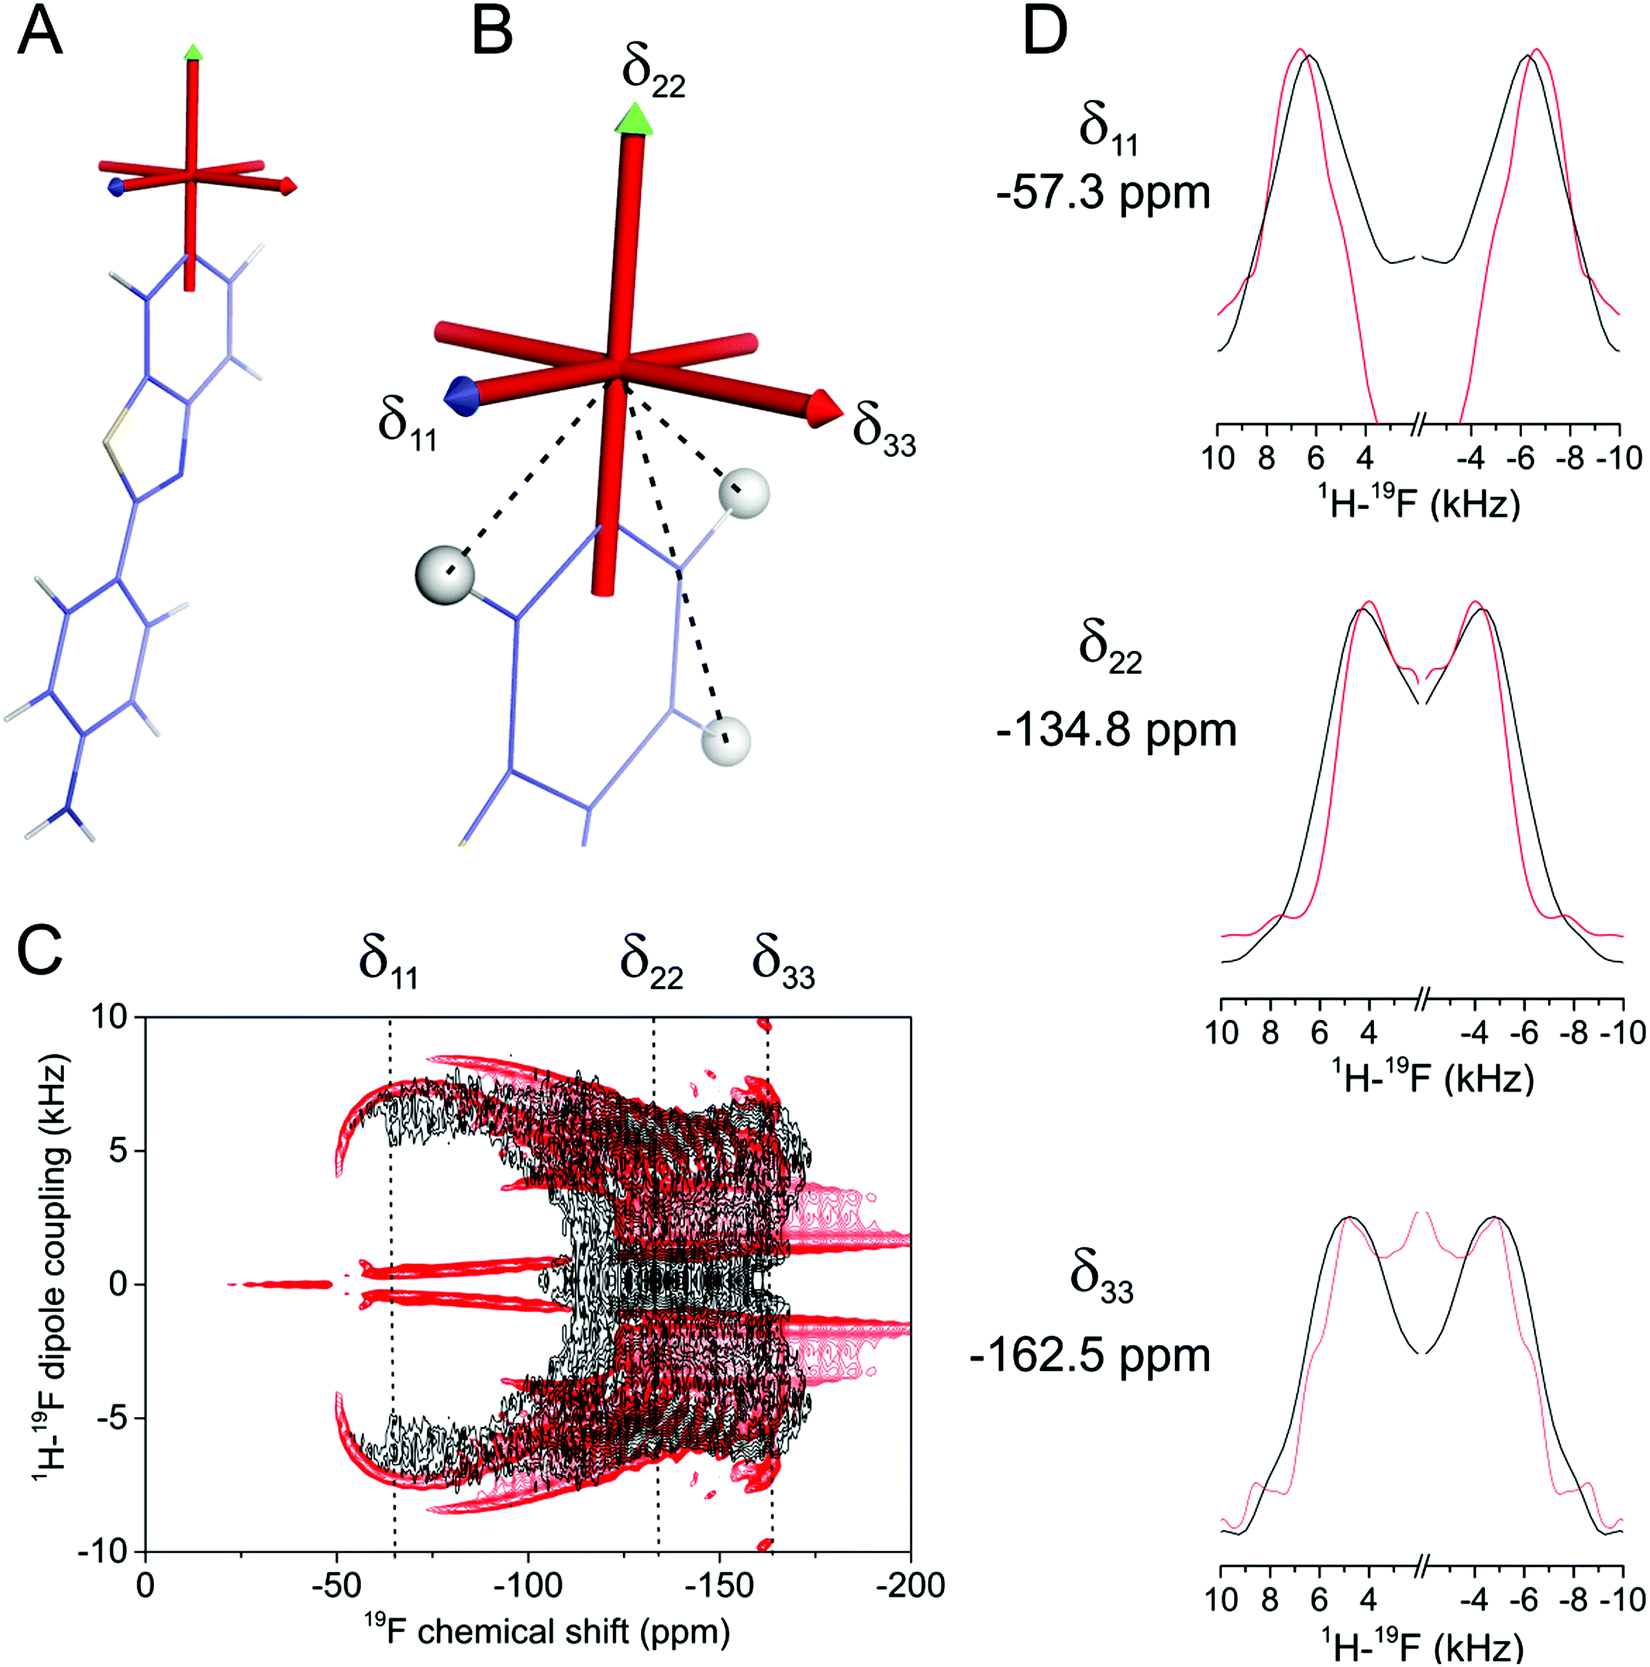 | ||
| Fig. 3 Orientation of the chemical shift principal axis system of FBTA in the molecular frame. (A) Computed shielding tensor directions in the molecular frame, calculated for an isolated molecule using CASTEP. (B) Expansion of (A) showing δ22 parallel with the F–C bond and δ33 normal to the plane of the aromatic ring. Dashed lines indicate the 1H–19F dipolar vectors in the δ11–δ22 plane, at angles (and H–F distances) of 34° (2.6 Å), 119° (4.4 Å) and 146° (2.6 Å). (C) Experimental 1H–19F PISEMA NMR spectrum under static conditions (black) of FBTA in lyophilised DMPC-d54 bilayers overlaid with a simulated spectrum (red) calculated from the H–F distances and the orientation of the principal axes shown in (B). (D) Vertical slices through the experimental and calculated spectra at chemical shifts corresponding to (top to bottom) δ11, δ22 and δ22. | ||
Experimental validation of DFT calculations
The discrepancy between the calculated and measured chemical shift components reduces confidence in the reliability of the calculated chemical shift tensor geometry that is needed in the analysis. To test the validity of the calculated tensor orientation we employed a 1H–19F PISEMA NMR experiment,12 which correlates the chemical shift with the 1H–19F dipolar coupling constant for each molecular orientation in a powder distribution. In the lyophilised membrane sample, FBTA is distributed randomly with individual molecules separated by the lipid host. Each 19F spin of FBTA is dipolar coupled predominantly to three neighbouring proton spins within the same aromatic ring, with coupling constants dHF of 6433 Hz, 6433 Hz and 1241 Hz determined from the fixed internuclear distances in the optimised structure (Fig. 3B). The use of chain-perdeuterated DMPC prevents couplings between lipid acyl chain protons and 19F of FBTA that may otherwise complicate the analysis. In a static powder sample, the dipolar coupling for each molecular orientation is given by dHF × (3cos2θ − 1)/2, where θ is the angle between the dipolar vector and the magnetic field. The corresponding 19F chemical shift for each molecular orientation is determined by the orientation of the 19F CSA tensor in a laboratory frame in which the z-axis is parallel with the magnetic field. The shape of the PISEMA spectrum is thus sensitive to the relative orientations of the CSA tensor and the 1H–19F dipolar vectors in the same molecular frame, and the spectrum can be readily predicted for the structurally-invariant spin system of FBTA. Fig. 3C shows an experimental 1H–19F PISEMA spectrum of FBTA in lyophilised DMPC-d54 superimposed with a simulated spectrum based on the values of dHF and the calculated orientation of the CSA tensor in the molecular frame (i.e., δ22 directed along the C–F bond and δ33 normal to the aromatic ring plane. Visual inspection reveals a good agreement between experimental and calculated spectra (Fig. 3C and D), but, to test the sensitivity of the spectrum to deviations of the tensor orientation, further simulations were performed in which the each of the principal axes were varied by ±20° from the initial predicted positions. Even these small deviations resulted in a visibly poorer agreement with the experimental spectrum (Fig. S4, ESI†). Simulated spectra in which δ11 is directed along the C–F bond or normal to the aromatic ring deviate significantly from the observed spectrum (Fig. S5, ESI†) The PISEMA spectrum is thus consistent with the calculated tensor orientations.
Orientational information from 1H–19F dipolar couplings
Next we attempted to reduce the ambiguity in the [α, β] angles determined from the CSA analysis. As dipolar couplings are also scaled predictably by molecular rotation, it was reasoned that line shape analysis of proton-coupled 19F spectra would reduce the ambiguity inherent in the CSA measurement alone. Simulations of proton-coupled 1D spectra for several allowed values of α and β (i.e., which produce the continuous lines for Δδav = 1.15 ± 0.10 ppm in Fig. 2E) show that the 19F line shape is sensitive to the different combinations of angles (Fig. 4, left hand spectra). In fact, because of molecular symmetry and the dominance of dipolar couplings of the protons ortho to 19F, the combinations of angles [α, β], [180 − α, β], [α, 180 − β] and [180 − α, 180 − β] all result in similar line shapes. Simulations of rotationally-averaged 1H–19F PISEMA spectra also reveal sensitivity to the same [α, β] combinations (Fig. 4, right hand spectra).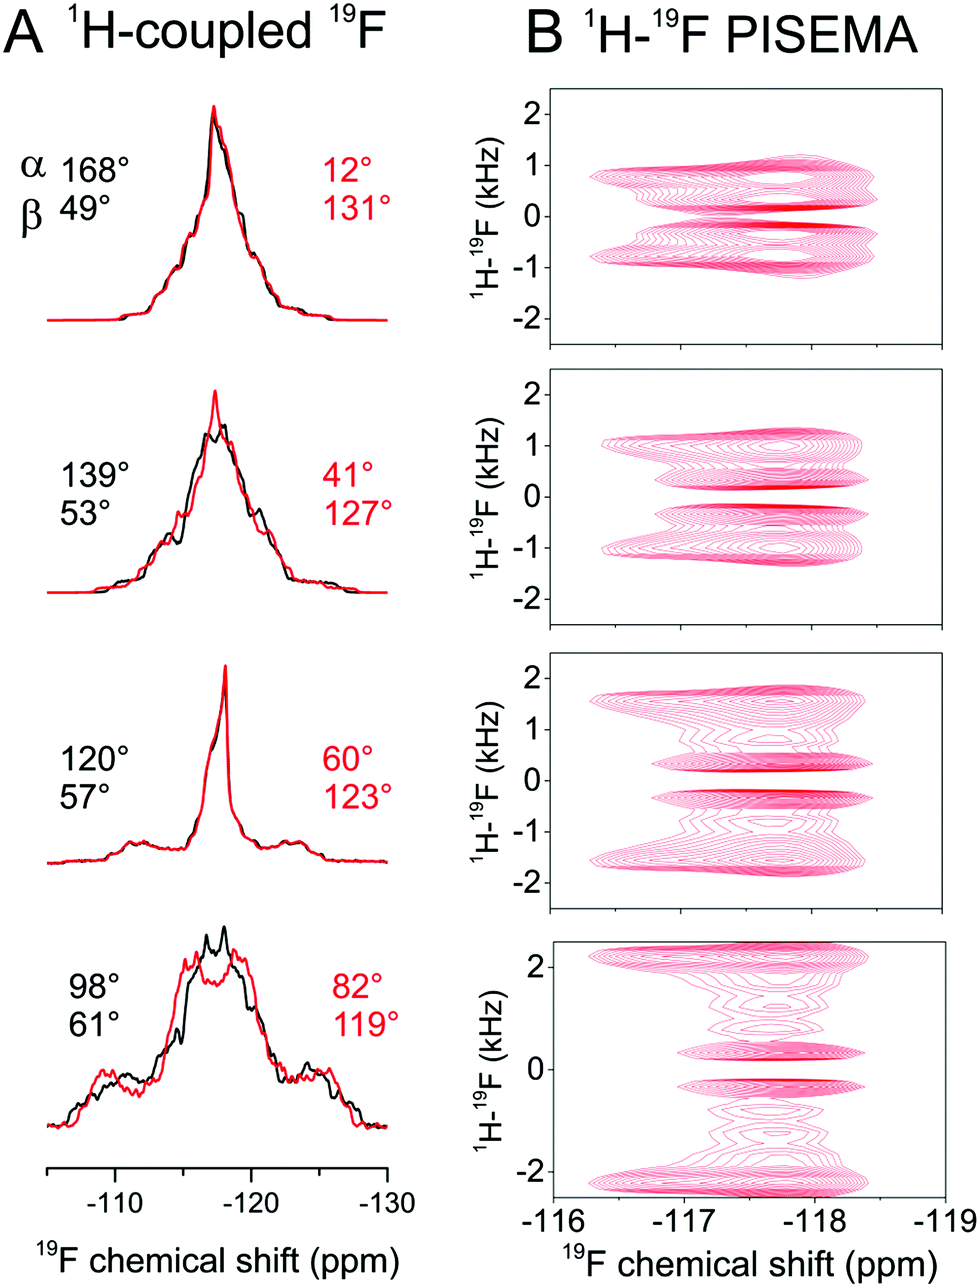 | ||
| Fig. 4 Analysis of the rotational axis orientation of FBTA in hydrated, liquid-crystalline DMPC-d54 bilayers. (A) Simulated static, proton-coupled 19F spectra for a four-spin (19F and 3 × 1H) system undergoing rapid rotation as described in Fig. 1A. Simulations are based on the calculated CSA principal value orientations in the molecular frame from Fig. 3B with three rotationally averaged 1H–19F dipolar couplings projected onto the principal rotational axis, with a scaling factor Smol of 0.80 representing rotational excursions about the axes orthogonal to the bilayer normal. Simulated spectra are shown for 8 combinations of 8 × α and 8 × β values, each combination being consistent with the observed Δδav range in Fig. 2E. (B) Simulated 1H–19F PISEMA spectra for the same [α, β] angles shown in red in A. | ||
Further experimental 19F NMR spectra of FBTA in DMPC-d54 bilayers were obtained in the presence of 1H–19F dipolar couplings. The 1D proton-coupled spectrum was compared with a series of simulated spectra to find the combinations of Smol, α and β giving the best agreement. Smol was varied from 0–1.0 in increments of 0.1 and applied as a scaling factor for the three 1H–19F dipolar couplings dHF and used to calculate the values of α and β that are consistent with the measured Δδav of 1.15 ± 0.10 ppm. The variance between the simulated and experimental spectra was calculated for each set of Smol, α and β values (Fig. S6 and S7, ESI†). Simulations for Smol values of less than 0.7 did not produce good agreement with the experimental spectrum and were discounted (Fig. S7, ESI†). The remaining acceptable values of the three variables are given in Table 2. The best overall agreement corresponds to Smol = 0.8 and angle combinations of [α = 0 ± 12°, β = 49° ± 0.5°] and [α = 0 ± 12°, β = 130.5° ± 0.5°] (Fig. 5A). Good agreement is also seen between an experimental 1H–19F PISEMA spectrum of the same sample and a simulated spectrum calculated using the parameter set [Smol = 0.8, α = 12°, β = 131°] (Fig. 5B). Together, the combination of 19F CSA and 1H–19F coupling measurements has restrained the rotational diffusion axis of FBTA to within a narrow range of orientations in the molecular frame.
| S mol | [α, β]lower | [α, β]mid | [α, β]upper |
|---|---|---|---|
| 1.0 (upper) | [153°, 49.5°] | [0°, 47.3°] | [27°, 49.5°] |
| [153°, 130.5°] | [0°, 132.7°] | [27°, 130.5°] | |
| 0.8 (best) | [168°, 49.6°] | [0, 48.5°] | [12°, 49.6°] |
| [168°, 130.4°] | [0, 131.5°] | [12°, 130.4°] | |
| 0.7 (lower) | [147°, 50.7°] | [±8°, 48.3°] | [33°, 50.7°] |
| [147°, 129.7°] | [±8°, 131.7°] | [33°, 129.7°] |
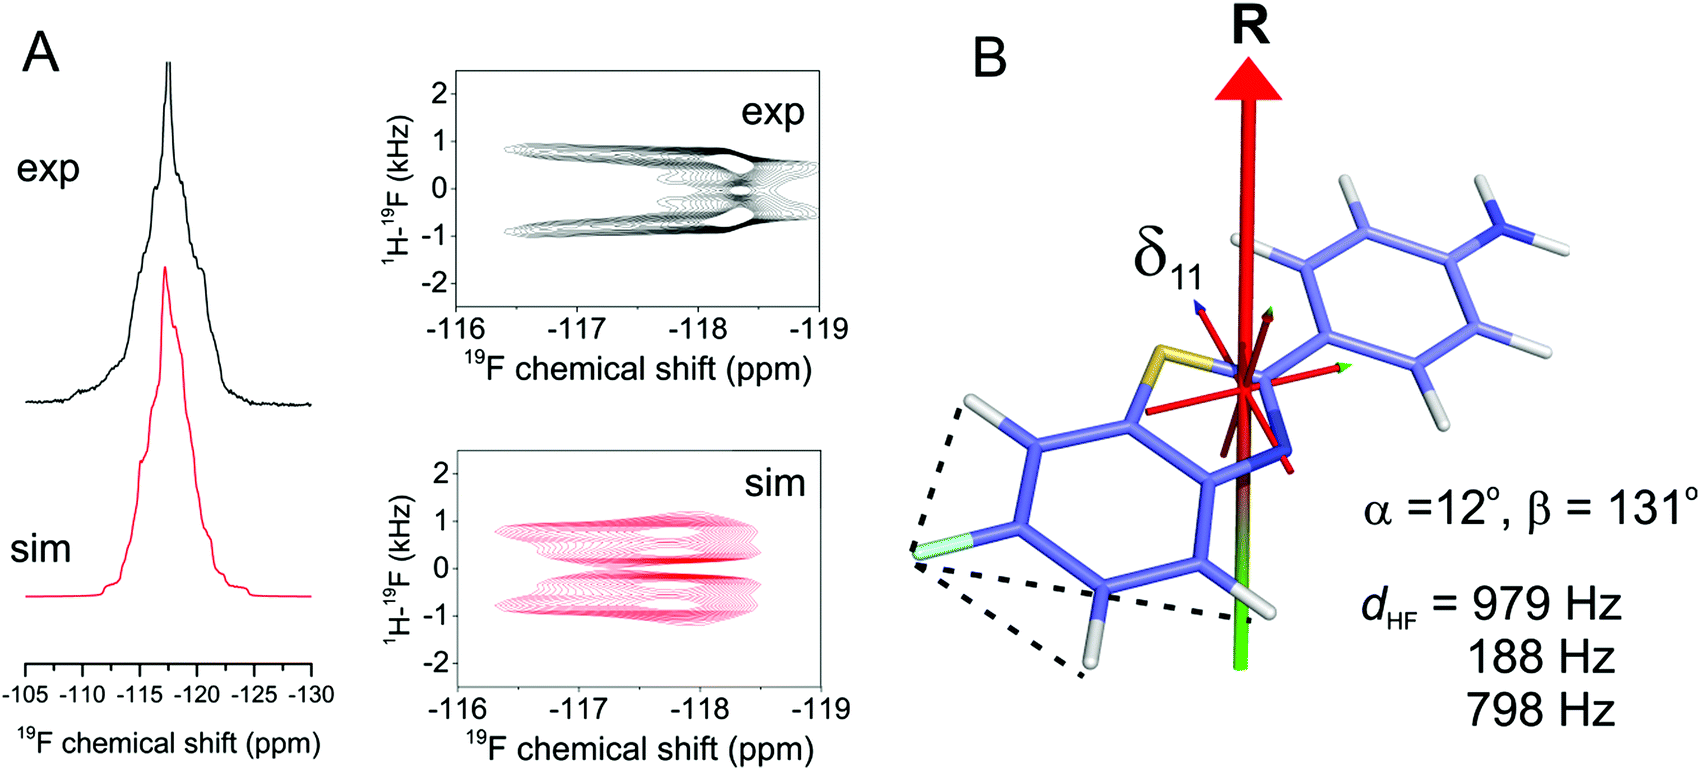 | ||
| Fig. 5 Additional restraints on the axis of rotation of FBTA in hydrated DMPC-d54 bilayers at 30 °C. (A) Experimental proton-coupled 1D 19F and 1H–19F PISEMA NMR spectra (black) and simulated spectrum in closest agreement (red). The simulated spectra correspond to the values of angles α and β, and coupling constants dHF shown at the bottom right of the figure. (B) Representation of FBTA rotating about a single axis inclined at the angles α and β shown. The axis system is shown with the origin coincident with the centre of mass of FBTA. The dotted lines signify the 1H–19F couplings. The molecule is predicted to be positioned in a lipid bilayer with the –NH2 group facing toward the lipid–water interface rather than toward the hydrophobic interior. | ||
Finally we calculated how internal rotation of the fluoroaromatic ring would influence the spectra. Rapid internal rotation about an axis parallel with the bond linking the two ring systems scales the 19F CSA to ∼40 kHz in the absence of other motion, with the principal axis of the axially symmetric tensor directed along the axis of internal rotation. Further averaging will occur as a result of molecular rotational diffusion about the axis collinear with the bilayer normal, and the observed scaling of the CSA to Δδav = 1.15 ± 0.1 ppm depends on a single angle, θ, between the internal rotation axis and the molecular rotational axis (Fig. S8, ESI†). For an initial condition of Smol = 1.0 it is found that angle θ = 51° or 129°, which by coincidence is similar to the angle β calculated in the absence of internal rotation. However, the corresponding rotationally scaled values of dHF are all less than 150 Hz, which are lower than the values (979 Hz, 798 Hz and 188 Hz) required for a good fit to the 1D and PISEMA spectra. For Smol < 1.0, the scaled values of dHF are even lower. It is unlikely, therefore, that rapid internal motions contribute to the observed spectra.
Conclusions
In summary, we present a new NMR approach, combining 19F CSA and 1H–19F dipolar coupling measurements, for determining average molecular orientations within lipid bilayers. This approach can provide detailed information about the biological activity of fluorinated pharmaceutical or diagnostic molecules with minimal chemical preparation. The approach requires NMR probeheads and appropriate frequency filters enabling observation of 19F whilst simultaneously decoupling protons, but such equipment is now routinely commercially available. In the given example, uncertainties in the average orientation were reduced by the lack of internal rotational of the FBTA molecule and by the narrow range of the order parameter Smol, which restricts angular fluctuations from the principal molecular rotational axis. In the case of more flexible molecules, for which these additional motions may be more significant, further independent NMR constraints such as 1H–13C dipolar couplings (at natural 13C abundance) may be required to determine the average orientation with more certainty.We envisage a range of applications beyond the model compound study reported here. It is anticipated that this approach will be useful when comparing the membrane properties of families of drug molecules such as statins, several of which contain fluorine.24 Indeed, this class of molecules has been evaluated for use with lipid-nanoparticle based drug-delivery systems (recombinant high-density lipoprotein)25 and our approach can report on their properties in these confined environments compared to more expansive lipid bilayers. Changes in drug orientations in the presence of integral membrane proteins such as efflux protein can also be studied using this method.
Abbreviations
| PISEMA | Polarisation inversion spin exchange at the magic angle |
| CSA | Chemical shift anisotropy |
| REDOR | Rotational-echo double-resonance |
| GIPAW | Gauge including projector augmented waves |
| CASTEP | Cambridge serial total energy package |
| DMPC | Dimyristoylphosphatidylcholine |
Conflicts of interest
There are no conflicts to declare.Acknowledgements
The work was supported by the British Heart Foundation project grant PG/16/97/32567.References
- B. C. Wang, L. J. Wang, B. Jiang, S. Y. Wang, N. Wu, X. Q. Li and D. Y. Shi, Mini-Rev. Med. Chem., 2017, 17, 683–692 CrossRef PubMed.
- J. Ma, L. Domicevica, J. R. Schnell and P. C. Biggin, Phys. Chem. Chem. Phys., 2015, 17, 19766–19776 RSC.
- Y. Zhou, J. Wang, Z. N. Gu, S. N. Wang, W. Zhu, J. L. Acena, V. A. Soloshonok, K. Izawa and H. Liu, Chem. Rev., 2016, 116, 422–518 CrossRef PubMed.
- J. Barry, M. Fritz, J. R. Brender, P. E. S. Smith, D. K. Lee and A. Ramamoorthy, J. Am. Chem. Soc., 2009, 131, 4490–4498 CrossRef PubMed.
- M. P. Boland and D. A. Middleton, Phys. Chem. Chem. Phys., 2008, 10, 178–185 RSC.
- N. Matsumori, Y. Kasai, T. Oishi, M. Murata and K. Nomura, J. Am. Chem. Soc., 2008, 130, 4757–4766 CrossRef PubMed.
- E. Okamura and M. Nakahara, J. Phys. Chem. B, 1999, 103, 3505–3509 CrossRef.
- O. Soubias, F. Jolibois, S. Massou, A. Milon and V. Reat, Biophys. J., 2005, 89, 1120–1131 CrossRef PubMed.
- W. E. Klunk, H. Engler, A. Nordberg, Y. M. Wang, G. Blomqvist, D. P. Holt, M. Bergstrom, I. Savitcheva, G. F. Huang, S. Estrada, B. Ausen, M. L. Debnath, J. Barletta, J. C. Price, J. Sandell, B. J. Lopresti, A. Wall, P. Koivisto, G. Antoni, C. A. Mathis and B. Langstrom, Ann. Neurol., 2004, 55, 306–319 CrossRef PubMed.
- G. M. Sheldrick, Acta Crystallogr., Sect. A: Found. Crystallogr., 2008, 64, 112–122 CrossRef PubMed.
- B. M. Fung, A. K. Khitrin and K. Ermolaev, J. Magn. Reson., 2000, 142, 97–101 CrossRef PubMed.
- C. H. Wu, A. Ramamoorthy and S. J. Opella, J. Magn. Reson., Ser. A, 1994, 109, 270–272 CrossRef.
- M. D. Segall, P. J. D. Lindan, M. J. Probert, C. J. Pickard, P. J. Hasnip, S. J. Clark and M. C. Payne, J. Phys.: Condens. Matter, 2002, 14, 2717–2744 CrossRef.
- C. J. Pickard and F. Mauri, Phys. Rev. B: Condens. Matter Mater. Phys., 2001, 63, 245101 CrossRef.
- J. P. Perdew, K. Burke and M. Ernzerhof, Phys. Rev. Lett., 1996, 77, 3865–3868 CrossRef PubMed.
- J. R. Yates, C. J. Pickard and F. Mauri, Phys. Rev. B: Condens. Matter Mater. Phys., 2007, 76, 024401 CrossRef.
- S. Grimme, J. Comput. Chem., 2006, 27, 1787–1799 CrossRef PubMed.
- M. Bak, J. T. Rasmussen and N. C. Nielsen, J. Magn. Reson., 2000, 147, 296–330 CrossRef PubMed.
- E. E. Burnell, P. R. Cullis and B. Dekruijff, Biochim. Biophys. Acta, 1980, 603, 63–69 CrossRef.
- J. H. Davis and M. Auger, Prog. Nucl. Magn. Reson. Spectrosc., 1999, 35, 1–84 CrossRef.
- B. Bechinger, Biochim. Biophys. Acta, Biomembr., 1999, 1462, 157–183 CrossRef.
- R. F. Campbell, E. Meirovitch and J. H. Freed, J. Phys. Chem., 1979, 83, 525–533 CrossRef.
- P. M. Macdonald, Q. Saleem, A. Lai and H. H. Morales, Chem. Phys. Lipids, 2013, 166, 31–44 CrossRef PubMed.
- M. Schachter, Fundam. Clin. Pharmacol., 2005, 19, 117–125 CrossRef PubMed.
- R. Duivenvoorden, J. Tang, D. P. Cormode, A. J. Mieszawska, D. Izquierdo-Garcia, C. Ozcan, M. J. Otten, N. Zaidi, M. E. Lobatto, S. M. van Rijs, B. Priem, E. L. Kuan, C. Martel, B. Hewing, H. Sager, M. Nahrendorf, G. J. Randolph, E. S. G. Stroes, V. Fuster, E. A. Fisher, Z. A. Fayad and W. J. M. Mulder, Nat. Commun., 2014, 5, 11 Search PubMed.
Footnote |
| † Electronic supplementary information (ESI) available. CCDC 1584785. For ESI and crystallographic data in CIF or other electronic format see DOI: 10.1039/c8cp01064a |
| This journal is © the Owner Societies 2018 |