 Open Access Article
209Bi quadrupole relaxation enhancement in solids as a step towards new contrast mechanisms in magnetic resonance imaging
D.
Kruk
 *a,
E.
Umut
a,
E.
Masiewicz
a,
C.
Sampl
b,
R.
Fischer
b,
S.
Spirk
b,
C.
Goesweiner
 c and
H.
Scharfetter
c
aUniversity of Warmia & Mazury in Olsztyn, Faculty of Mathematics and Computer Science, Słoneczna 54, PL-10-710 Olsztyn, Poland. E-mail: danuta.kruk@matman.uwm.edu.pl; Tel: +48 89 524 60 11
bInstitute for Chemistry and Technology of Materials, Graz University of Technology, Stremayrgasse 9, 8010 Graz, Austria
cInstitute of Medical Engineering, Graz University of Technology, Stremayrgasse 16/III, A-8010 Graz, Austria
First published on 26th April 2018
Abstract
Motivated by the possibility of exploiting species containing high spin quantum number nuclei (referred to as quadrupole nuclei) as novel contrast agents for Magnetic Resonance Imaging, based on Quadrupole Relaxation Enhancement (QRE) effects, 1H spin–lattice relaxation has been investigated for tris(2-methoxyphenyl)bismuthane and tris(2,6-dimethoxyphenyl)bismuthane in powder. The relaxation experiment has been performed in the magnetic field range of 0.5 T to 3 T (the upper limit corresponds to the field used in many medical scanners). A very rich QRE pattern (several frequency specific 1H spin–lattice relaxation rate maxima) has been observed for both compounds. Complementary Nuclear Quadrupole Resonance experiments have been performed in order to determine the quadrupole parameters (quadrupole coupling constant and asymmetry parameters) for 209Bi. Knowing the parameters, the QRE pattern has been explained on the basis of a quantum-mechanical picture of the system including single and double-quantum coherences for the participating nuclei (1H and 209Bi). In this way the quantum-mechanical origin of the spin transitions leading to the QRE effects has been explained.
1. Introduction
Magnetic Resonance Imaging (MRI) is one of the most versatile and powerful diagnostic tools due to its superior intrinsic soft tissue contrast. MRI provides spatially and temporally resolved maps of 1H relaxation times of the inside of human bodies. The observation that 1H relaxation times of healthy tissues and tumours differ was made decades ago.1,2 This discovery has motivated the scientific community to extensive studies on how to exploit this effect by enlarging the difference (contrast) in the relaxation times between healthy and pathological tissues. The studies have given rise to a development of paramagnetic contrast agents causing Paramagnetic Relaxation Enhancement (PRE) effects.3–5 Paramagnetic contrast agents are complexes of transition or rare-earth metal ions; in clinical practice usually gadolinium (Gd) based chelates are used.3,5 Very strong magnetic electron–proton dipole–dipole interactions between the electron spin of the paramagnetic species and neighbouring proton spins lead to very fast proton spin relaxation (the relaxation rates become larger – in other words, the relaxation is enhanced). Taking into account the ratio between the electron and proton gyromagnetic factors (≈659), the large spin of Gd ions (S = 7/2) and the fact that the 1H relaxation rate depends on a square of the electron gyromagnetic factor one could expect a very large enhancement of the relaxation rate. The observed 1H paramagnetic relaxation enhancement is, however, much smaller. The reason of that is electron spin relaxation that acts as an additional (besides the molecular motion) source of modulations of the electron–proton dipole–dipole interaction.3,4,6–9 The electron spin relaxation is independent of the presence of neighbouring protons as its predominating mechanism is Zero Field Splitting (ZFS) interactions. The ZFS coupling is so strong that it leads to very fast electron spin relaxation and, in consequence, the 1H relaxation enhancement is far below the expected value.3,4,6 The relaxation enhancement observed for typical paramagnetic contrast agents is by the factor of 20–50 larger10,11 compared to 1H relaxation in water (referring to 1 mmol concentration of the paramagnetic species). The PRE effects have been a subject of extensive theoretical studies motivated not only by the diagnostic applications, but also as a very interesting and demanding problem of quantum-mechanical theory of spin relaxation. The theory of PRE has started from very simple models,3,8,12,13 developing towards advanced, comprehensive theoretical tools predicting PRE values for arbitrary magnetic field, interaction strengths and motional conditions.3–5,8,9,14–16 These theoretical tools are very useful for tailoring properties of paramagnetic contrast agents to obtain the desired enhancement effects. As far as paramagnetic contrast agents are concerned, significant effort has also gone into the development of nanoparticles containing iron oxides.17,18 In the last few years, the concept of “smart” paramagnetic contrast agents that not only lead to the relaxation enhancement, but additionally exhibit on and off switches or are sensitive to physiological parameters such as pH has been developed.11,19 This comprehensive effort directed towards exploiting the potential of paramagnetic contrast agents has significantly contributed to make MRI the key method of non-invasive medical diagnostics.Nuclear Magnetic Resonance (NMR) methods are widely used not only in medicine, but also in generally understood molecular science to investigate dynamics and structure of condensed matter. A special role plays NMR relaxometry. “Classical” relaxation experiments are performed at a single, relatively high magnetic field (resonance frequency) versus temperature. In NMR relaxometry experiments the magnetic field and hence the resonance frequency varies in a broad range so one can measure spin–lattice relaxation rate versus the resonance frequency. In this way 1H spin–lattice quadrupole relaxation enhancement (QRE) has been discovered in biological systems20–25 and various solids containing 14N nuclei.26,2714N nuclei possess spin S = 1 and therefore, when placed in an electric field gradient (EFG), exhibit quadrupole interaction. The principles of the QRE effect is as follows. The 1H and the quadrupole nucleus (a nucleus possessing a quadrupole moment) are coupled by a magnetic dipole–dipole interaction. As a result of its Zeeman interaction the 1H nucleus (I = 1/2) can occupy two states described by the magnetic quantum numbers mI = ±1/2. At the same time the energy level structure of the quadrupole nucleus stems from a superposition of its quadrupole and Zeeman couplings; in fact, except of high magnetic fields, it is dominated by the quadrupole coupling that does not depend of the magnetic field. Thus, there are magnetic fields at which the 1H energy level splitting matches one of the transitions of the quadrupole nucleus between its energy levels. When the dynamics of the system is slow (like in solids) at these magnetic fields (1H frequencies) the 1H magnetisation can be transferred to the quadrupole nucleus; this manifests itself as a faster 1H decay – i.e. a frequency specific 1H spin–lattice relaxation enhancement (quadrupole peaks).20–28 For 14N one observes three relaxation maxima.20–30 As far as higher spin quantum number quadrupole nuclei are concerned, there are some indications of the QRE effects in LaF3.31,32
In this context the question arises whether QRE can be exploited as a mechanism for novel extrinsic MRI contrast agents. The essential difference between the PRE and QRE effects is that in the first case a 1H relaxation enhancement is observed in the whole frequency range as a result of a strong proton–electron dipole–dipole coupling. In the case of QRE the relaxation enhancement appears only at selected frequencies – therefore it can be switched on and off in response to subtle changes in the EFG. This opens the possibility for designing smart contrast agents for molecular imaging which change contrast e.g. by chemical interaction with the surrounding tissues. One could argue that the QRE effects are too weak to be exploited as a contrast mechanism. To increase the contrast one has to use high spin quantum number nuclei of S = 9/2 or S = 7/2, but this is obviously not sufficient – the electronic spin of Gd3+ is also 7/2. However, due to very fast electron spin relaxation which leads to a reduction of 1H spin–lattice relaxation3,4,6–11 the PRE enhancement is much lower than one could expect from the large electronic gyromagnetic factor. The quadrupole spin relaxation is slow and this acts towards increasing 1H spin–lattice relaxation rate.
Among several high spin quadrupole nuclei we consider 209Bi as a very promising candidate because of its large quadrupole moment that opens the opportunity to observe QRE effects at high magnetic field (3 T) used in many clinical MRI scanners and because of its comparatively low toxicity. To explore the potential of 209Bi compounds as possible contrast agents it is necessary to reveal details of the quantum-mechanical mechanism of QRE for S = 9/2. For this purpose two 209Bi compounds have been chosen: tris(2-methoxyphenyl)bismuthane (C21H21BiO3) and tris(2,6-dimethoxyphenyl)bismuthane (C24H27BiO6). 1H spin–lattice relaxation experiments have been performed for the system revealing a rich QRE pattern; to our knowledge this is the first experimental observation of QRE effects for high spin quadrupole nuclei (the examples reported in literature concern 14N). The QRE pattern has been associated with specific spin transitions and thoroughly discussed.
The paper is organized as follows: in Section 2 the principles of QRE are presented, Section 3 contains experimental details, in Section 4 the data are presented and discussed, while Section 5 includes concluding remarks.
2. Quadrupole interactions and relaxation enhancement effects
As already explained, the term QRE refers to frequency specific 1H spin–lattice relaxation maxima resulting from a magnetic dipole–dipole coupling between 1H and a high spin nucleus (S > 1/2), 209Bi (S = 9/2) in this case. QRE is a complex quantum-mechanical phenomenon;25,28 here we shall outline its basic concept. The high spin nucleus placed in an electric field gradient (EFG) exhibits a quadrupole coupling (therefore we shall call it “quadrupole nucleus”). The energy level structure of the quadrupole nucleus is determined by a sum of its Zeeman, HZ(S), and quadrupole, HQ(S), Hamiltonians, denoted as H0(S):33ωS = γSB0 is its resonance frequency, while aQ = e2qQ/ħ denotes the quadrupole coupling constant, with γS: gyromagnetic factor, B0: magnetic flux density, Q: quadrupole moment of the nucleus and q is the zz component of the electric field gradient tensor. The tensor operators are defined as:
 and
and  , while the spatial components of the quadrupole Hamiltonian are given as:
  , where η is the asymmetry parameter of the EFG tensor, D2k, −m(Ω) denotes the Wigner rotation matrices.34,35 The angle Ω describes the orientation of the principal axis system of the EFG with respect to the direction of the external magnetic field (laboratory frame). This implies that energy levels of the quadrupole nucleus depend on the orientation. They can be obtained by diagonalizing the matrix representation of the Hamiltonian H0(S) in the basis {|S,mS〉} (mS denotes magnetic quantum numbers) that leads to a set of eigenfunctions {|ψα(Ω)〉} of the S spin which are linear combinations of the functions |n〉 = |S,mS〉:
  , and a set of corresponding eigenvalues (energy levels). This implies that the |n〉 = |S,mS〉 vectors are not the eigenvectors of the quadrupole nucleus. The basis {|S,mS〉} (referred to as Zeeman basis) is the eigenbasis only in the high field range, when the Zeeman interaction is much stronger than the quadrupole coupling or when Ω = 0 and η = 0. In a general case each eigenvector |ψα〉 includes vectors |S,mS〉 of different magnetic spin quantum numbers, mS. Dipole–dipole interactions between 1H and the quadrupole nucleus are the source of 1H relaxation. This means that the transition of 1H between its energy levels is coupled to the transitions of the quadrupole nucleus – in this way 1H “feels” the energy level structure of the quadrupole nucleus. When the 1H resonance frequency, ω, matches one of the transition frequencies ωαβ = ωα − ωβ (ωα,ωβ denote energy levels corresponding to eigenvectors |ψα〉 and |ψβ〉, respectively) of the S-spin nucleus, the 1H magnetisation can be transferred to the quadrupole nucleus, thus leading to a faster decay of the 1H magnetisation – i.e. an enhancement of 1H spin–lattice relaxation, referred to as the QRE. This process can involve two protons coupled by a dipolar interaction (provided the coupling is not fully averaged out by molecular motion).28–30 In this case QRE effects can also occur when the frequency of the joint (double-quantum) transition of two coupled 1H nuclei, 2ω, matches one of the ωαβ frequencies.
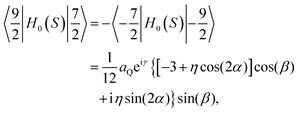
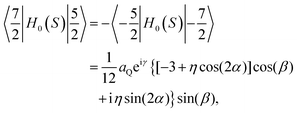
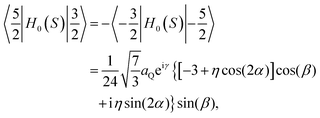
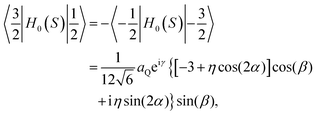
The explicit form of the Hamiltonian H0(S) in the basis {|S,mS〉} is given in Appendix.
3. Materials and methods
1H NMR spin–lattice relaxation experiments were performed for tris(2-methoxyphenyl)bismuthane (C21H21BiO3) and tris(2,6-dimethoxyphenyl)bismuthane (C24H27BiO6) in powder form. The structure of the compounds is shown in Fig. 1. The experiment was performed at 295 K (temperature stability 1 K) in the frequency range of 20 MHz–128 MHz using superconducting magnet operating up to magnetic field of 3 T compatible with STELAR Spinmaster Fast Field Cycling (FFC) relaxometer. The measurements were performed with an inversion-recovery pulse sequence with the 90° pulse length between 3.5–5.0 μs. It turned out that the magnetisation evolution is, in a good approximation, single exponential in the whole frequency range; examples are shown in Fig. 2.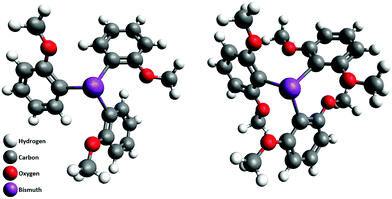 | ||
| Fig. 1 Structure of tris(2-methoxyphenyl)bismuthane (left) and tris(2,6-dimethoxyphenyl)bismuthane (right). | ||
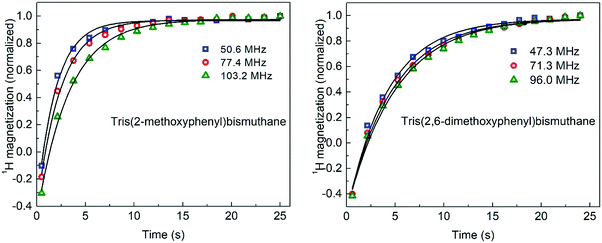 | ||
| Fig. 2 1H magnetisation versus time for tris(2-methoxyphenyl)bismuthane (left) and tris(2,6-dimethoxyphenyl)bismuthane (right); solid lines – single exponential fits. | ||
NQR-data were collected using two complementary pulse type NQR spectrometers equipped with gas (air)-flow thermal control system for 10 °C up to 50 °C. First the unknown NQR peaks were located by fast explorative scans with the custom-built spectrometer “Graz-NQRS-MK1”36 over wide bands up to 50 MHz Then the NQR parameters and peak shapes were determined with the commercially available “Scout” (Tecmag, Inc., USA), which allows advanced pulse sequence programming including phase cycling. Both spectrometers are driven by a 500 W power amplifier that can supply a set of different solenoid RF-coils of 10 mm diameter all together covering a range of 20 MHz up to 150 MHz. Usually spin echo (SE) and free induction decay (FID) rectangular pulse sequences were used to address the samples of solid, crystalline powders, filled in glass vials of 10 mm diameter and 40 mm length. The NQR measurements were performed at 310 K.
4. Results and analysis
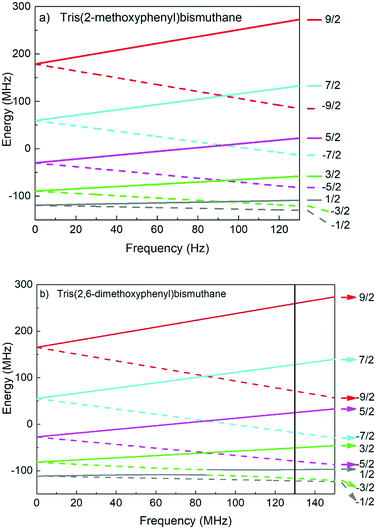
The NQR experiments have revealed four 209Bi spectral lines for tris(2-methoxyphenyl)bismuthane at the frequencies of 29.82 MHz, 59.64 MHz, 89.47 MHz and 119.27 MHz. The quadrupole constant, aQ, and the asymmetry parameter, η of the 209Bi were determined by diagonalization of the quadrupole spin Hamiltonian, HQ(S) for Ω = 0 which gives the 209Bi energy levels and hence the transition frequencies as a function of aQ and η. As the experiment was performed at zero magnetic field the Zeeman Hamiltonian, HZ(S) needs not be considered and there is no need to discuss relative orientations of the principal axis system of the quadrupole interaction and the direction of the external magnetic field, (moreover, eigenvalues of a Hamiltonian do not depend of a reference frame). The positions of the NQR lines can be well reproduced for aQ = 715.3 ± 0.4 MHz and η = 0 ± 0.001. This is the limiting case when the Zeeman basis {|S,mS〉} is the eigenbasis of the quadrupole nucleus. In consequence, one can talk about single-quantum spin transitions – i.e. transitions between energy levels associated with |S,mS〉 and |S,mS′〉 vectors for which |mS − mS′| = 1. The single-quantum 209Bi transitions correspond to the above frequencies of 29.82 MHz, 59.61 MHz, 89.41 MHz and 119.21 MHz that are associated with the following changes of the magnetic spin quantum number mS: 3/2 → 1/2, 5/2 → 3/2, 7/2 → 5/2 and 9/2 → 7/2, respectively. For tris(2,6-dimethoxyphenyl)bismuthane the three NQR lines recorded at the frequencies 54.40 MHz, 82.45 MHz and 110.06 MHz give aQ = 660.9 ± 0.4 MHz and η = 0.105 ± 0.001. As in this case η ≠0 the eigenvectors of the quadrupole Hamiltonian are not represented by a single |S,mS〉 vector, but by their linear combinations. In consequence, one cannot attribute these frequencies to the “pure” 7/2 → 5/2 and 9/2 → 7/2 transitions.The 1H spin–lattice relaxation data (relaxation rate, R1, versus the resonance frequency) for tris(2-methoxyphenyl)bismuthane and tris(2,6-dimethoxyphenyl)bismuthane are shown in Fig. 3(a) and (b), respectively. One can see several relaxation maxima (QRE peaks). As explained in Section 2, 1H spin–lattice QRE maxima can appear at 1H frequencies matching one of the 209Bi transitions between its energy levels which depend on the orientation of the principal axis system of the quadrupole coupling with respect to the direction of the external magnetic field. Fig. 4(a) and (b) show the energy levels for Ω = 0 and aQ = 715.27 MHz, η = 0 (tris(2-methoxyphenyl)bismuthane) and aQ = 660.94 MHz, η = 0.105 (tris(2,6-dimethoxyphenyl)bismuthane), respectively. As already explained, in the first case (η = 0), the |S,mS〉 functions are the eigenvectors of the total Hamiltonian: H0(S) = HQ(S) + HZ(S); therefore the energy levels in Fig. 4(a) have been attributed to the |S,mS〉 eigenvectors. This does not apply to Ω ≠ 0; then the eigenvectors are given as linear combinations of the |S,mS〉. In the second case when η ≠ 0 (tris(2,6-dimethoxyphenyl)bismuthane), even for Ω = 0 [Fig. 4(b)] the |S,mS〉 vectors are not eigenvectors of the S-spin. Nevertheless we have kept the same colour scheme in Fig. 4(b) as in Fig. 4(a) taking as a reference the |S,mS〉 vector to which the eigenvector |ψα〉 converges in the high field limit.
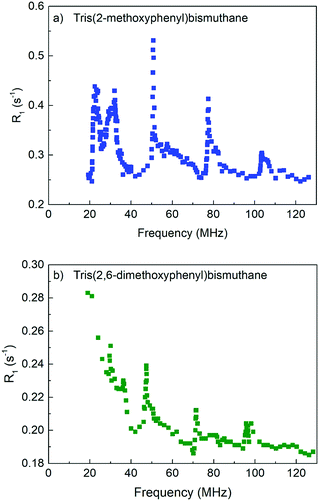 | ||
| Fig. 3 1H spin–lattice relaxation rate versus frequency for (a) tris(2-methoxyphenyl)bismuthane and (b) tris(2,6-dimethoxyphenyl)bismuthane. | ||
For the purpose of the further discussion it is useful to introduce the following nomenclature: a transition between the energy levels associated with the eigenvectors |ψi〉 and |ψj〉 that in the high field range converge to the vectors |S,mS〉 and |S,mS′〉, respectively, will be denoted as |ψi〉 → |ψj〉 (mS, mS′). It is very important to remember that, except of the high field limit, the |ψi〉 eigenvectors include a combination of |S,mS〉 vectors of different mS values.
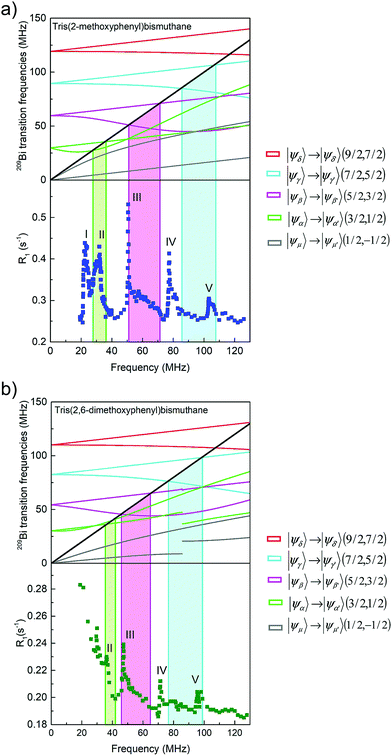
To attribute the positions of the 1H spin–lattice relaxation maxima to specific 209Bi transitions it is necessary to thoroughly analyse the orientation dependence of the energy level structure. In Fig. 5(a)209Bi transition frequencies |ψi〉 → |ψj〉 (mS, mS − 1) are plotted versus1H resonance frequency, covering all orientations Ω. The areas representing the transition frequencies for the whole Ω range are crossed by a line representing the 1H resonance frequency, corresponding to the 1H transition between the energy levels described by the magnetic quantum numbers mI = 1/2 and mI = −1/2. One can see from Fig. 5(a) (top) that the |ψμ〉 → |ψμ′〉 (1/2, −1/2) transition frequency of 209Bi (grey) is smaller than the 1H resonance frequency. Thus, we are left with four 209Bi transitions: |ψα〉 → |ψα′〉 (3/2, 1/2), |ψβ〉 → |ψβ′〉 (5/2, 3/2), |ψγ〉 → |ψγ′〉 (7/2, 5/2) and |ψδ〉 → |ψδ′〉 (9/2, 7/2), frequencies of which are projected onto the 1H spin–lattice relaxation data for tris(2-methoxyphenyl)bismuthane [Fig. 5(a), bottom]. The data show five QRE peaks referred to as I, II, III, IV and V. One can see that the position of the low frequency peak (I) cannot be explained as a result of |ψi〉 → |ψj〉 (mS, mS − 1) transitions. QRE peaks denoted as II and III are associated with the |ψα〉 → |ψα′〉 (3/2, 1/2) and |ψβ〉 → |ψβ′〉 (5/2, 3/2) 209Bi transitions, respectively. The QRE peak IV again cannot be explained by one of the |ψi〉 → |ψj〉 (mS, mS − 1) transitions, while peak V is associated with the |ψγ〉 → |ψγ′〉 (7/2, 5/2) 209Bi transition. In the frequency range covered in this experiment one does not observe a QRE peak being a consequence of the |ψδ〉 → |ψδ′〉 (9/2, 7/2) 209Bi transition, but its existence is not excluded – the effect might possibly appear above 130 MHz. Thus, summarizing, three 1H spin–lattice relaxation maxima observed for tris(2-methoxyphenyl)bismuthane can be attributed to the |ψα〉 → |ψα′〉 (3/2, 1/2), |ψβ〉 → |ψβ′〉 (5/2, 3/2) and |ψγ〉 → |ψγ′〉 (7/2, 5/2) 209Bi transitions combined with 1H single-quantum transition, while the origin of two others remain unexplained at this stage.
In Fig. 5(b) we compare this finding with the 1H spin–lattice relaxation data for tris(2,6-dimethoxyphenyl)bismuthane. Again the QRE peaks II, III and V can be attributed to the 209Bi transitions: |ψα〉 → |ψα′〉 (3/2, 1/2), |ψβ〉 → |ψβ′〉 (5/2, 3/2) and |ψγ〉 → |ψγ′〉 (7/2, 5/2), respectively, in analogy to tris(2-methoxyphenyl)bismuthane, combined with a single quantum transition of 1H. Analogously to tris(2-methoxyphenyl)bismuthane, peak IV cannot be attributed to a |ψi〉 → |ψj〉 (mS, mS − 1) transition (coherence). As far as the low frequency range is concerned, we restrain ourselves at this moment from numbering the QRE peaks, as for tris(2,6-dimethoxyphenyl)bismuthane they are less pronounced than for tris(2-methoxyphenyl)bismuthane.
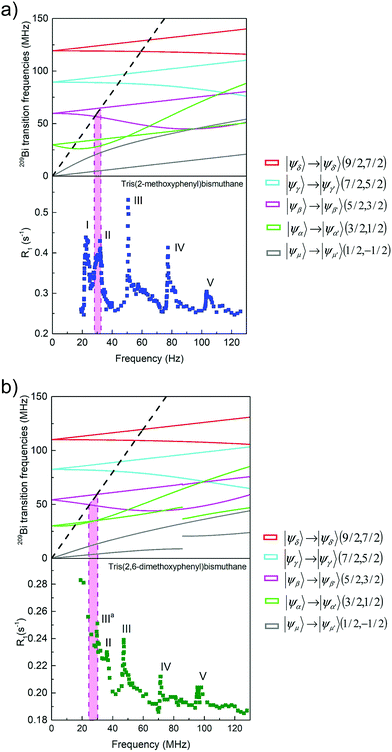
The analysis clearly shows that the full QRE patterns of the investigated compounds cannot be fully explained in terms of the single quantum 1H transition combined with one of the |ψi〉 → |ψj〉 (mS, mS − 1) 209Bi transitions. However, as explained in Section 2, QRE effects can involve two coupled spin 1/2 nuclei. Therefore, in the next step we shall consider a combination of the double quantum 1H transition with |ψi〉 → |ψj〉 (mS, mS − 1) 209Bi transitions – such a scenario can take place in a system composed of one 209Bi nucleus and two 1H nuclei. In Fig. 6(a) (top) the frequency ranges are plotted in which the transition frequency of the 1H double quantum transitions (twice the resonance frequency, 2ω) crosses one of the |ψi〉 → |ψj〉 (mS, mS − 1) 209Bi transitions. Projecting these ranges onto the 1H relaxation data for tris(2-methoxyphenyl)bismuthane reveals that the joint transition of two 1H spins only contribute to QRE peak II – the origin of peaks I and IV still remain unexplained. Analogous analysis has been performed for tris(2,6-dimethoxyphenyl)bismuthane [Fig. 6(b)]. In this case the asymmetry of the quadrupole interaction (η ≠ 0) affects the 209Bi energy level structure and, in consequence, leads to a shift of the transition frequency |ψβ〉 → |ψβ′〉 (5/2, 3/2) which now yields a peak denoted as IIIa instead of peak II like for η = 0. The notation reflects the fact that this QRE peak is a 1H double quantum counterpart of peak III. This comparison between the cases of η = 0 and η ≠ 0 implies that for η = 0 peak IIIa overlaps with peak II. Including the possibility of joint single quantum transitions of two coupled 1H nuclei (i.e. the double quantum transition) gives a better understanding of the QRE effects, but it still does not fully explain the QRE pattern.
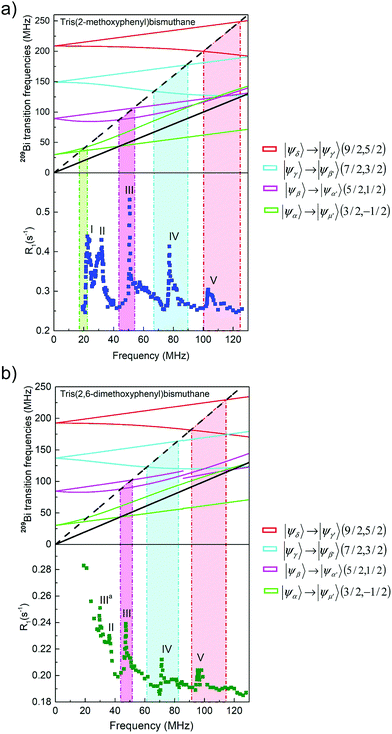
Therefore we consider, in the next step, |ψi〉 → |ψj〉 (mS, mS − 2) transitions of 209Bi combined with single quantum and double quantum 1H transitions. Fig. 7(a) (top) shows |ψi〉 → |ψj〉 (mS, mS − 2) 209Bi transition frequencies for tris(2-methoxyphenyl)bismuthane and single and double quantum transition frequencies of 1H. Following the same approach as above, the ranges in which the 209Bi and 1H transition frequencies match are projected onto the 1H spin–lattice relaxation data. The first observation is that the range in which the |ψi〉 → |ψj〉 (mS, mS − 2) 209Bi transition frequencies cross the 1H resonance frequency is very broad and, in consequence, somewhat contributes to the “background” relaxation, but does not lead to distinct relaxation maxima. At the same time the |ψi〉 → |ψj〉 (mS, mS − 2) transition frequencies compared with the frequency of 2ω lead to interesting results. The frequency of |ψδ〉 → |ψγ′〉 (9/2, 5/2) 209Bi transition covers the frequency range in which peak V is present. Nevertheless, taking into account probability of a double quantum 1H transition is lower than of single quantum ones and that the position of peak V has already been attributed to the |ψγ〉 → |ψγ′〉 (7/2, 5/2) 209Bi transition combined with the 1H resonance frequency, ω, one can expect that the contribution of the last one to the creation of peak V is more significant. Then the presence of peak IV can be attributed to the |ψγ〉 → |ψβ′〉 (7/2, 3/2) 209Bi transition combined with the 1H double quantum transition, 2ω. Proceeding further, the |ψβ〉 → |ψα′〉 (5/2, 1/2) transition contributes to the formation of peak III (already associated with the |ψβ〉 → |ψα′〉 (5/2, 1/2) transition combined with 1H single quantum transition). Then again, the so far unexplained presence of peak I can be attributed to the |ψα〉 → |ψμ′〉 (3/2, −1/2) 209Bi transition combined with 1H double quantum transition. Analogous pattern has been found for tris(2,6-dimethoxyphenyl)bismuthane [Fig. 7(b)]. Here also the |ψδ〉 → |ψγ′〉 (9/2, 5/2) and |ψβ〉 → |ψα′〉 (5/2, 1/2) 209Bi transitions combined with double quantum 1H transition can give a contribution to the QRE effects reflected by peak V and peak III, respectively, while the position of peak IV corresponds to the range in which the frequency of |ψγ〉 → |ψβ′〉 (7/2, 3/2) transition matches the frequency of double quantum 1H transition. On the basis of the experimental data for tris(2,6-dimethoxyphenyl)bismuthane (C24H27BiO6) one can hardly discuss the possibility of the presence of a counterpart of peak I observed for tris(2-methoxyphenyl)bismuthane.
5. Conclusions
In order to reveal the quantum-mechanical picture of QRE effects for 209Bi in the context of a novel mechanism of MRI contrast, NQR and NMR relaxometry studies have been performed for tris(2-methoxyphenyl)bismuthane and tris(2,6-dimethoxyphenyl)bismuthane in powder. On the basis of the NQR spectra the quadrupole parameters for both compounds have been determined: aQ = 715.27 MHz, η = 0 for tris(2-methoxyphenyl)bismuthane and aQ = 660.94 MHz, η = 0.105 for tris(2,6-dimethoxyphenyl)bismuthane. On the basis of these parameters the 1H spin–lattice QRE patterns, collected in the magnetic field range of 0.5 T–3 T, have been attributed to specific spin transitions. In the first step |ψi〉 → |ψj〉 (mS, mS − 1) 209Bi transitions combined with 1H single quantum transition have been considered. It has been shown that this combination explains the existence of three 1H spin–lattice relaxation maxima observed at the 1H frequency of 27–36 MHz (peak II), 50–71 MHz (peak III) and 85–107 MHz (peak V) for tris(2-methoxyphenyl)bismuthane and of 35–42 MHz (peak II), 46–65 MHz (peak III) and 76–98 MHz (peak V) for tris(2,6-dimethoxyphenyl)bismuthane, corresponding to the |ψα〉 → |ψα′〉 (3/2, 1/2), |ψβ〉 → |ψβ′〉 (5/2, 3/2) and |ψγ〉 → |ψγ′〉 (7/2, 5/2) 209Bi transitions. Joint 1H double-quantum transition combined with the |ψβ〉 → |ψβ′〉 (5/2, 3/2) 209Bi transition for tris(2,6-dimethoxyphenyl)bismuthane gives rise to the quadrupole peak observed at 24–30 MHz (peak IIIa) (it is a double quantum counterpart of the maximum observed at 46–65 MHz (peak III)); for tris(2-methoxyphenyl)bismuthane this combination leads to a QRE effect which overlaps with the peak originating from 1H single quantum transition combined with the |ψβ〉 → |ψβ′〉 (3/2, 1/2) 209Bi transition. The peaks observed at the 1H frequency of 99–125 MHz (peak V), 66–89 MHz (peak IV) and 43–54 MHz (peak III) for tris(2-methoxyphenyl)bismuthane and of 91–114 MHz (peak V), 61–82 MHz (peak IV) and 44–52 MHz (peak III) for tris(2,6-dimethoxyphenyl)bismuthane can include contributions originating from combinations of 1H double quantum transitions with 209Bi |ψi〉 → |ψj〉 (mS, mS − 2) transitions: |ψδ〉 → |ψγ′〉 (9/2, 5/2), |ψδ〉 → |ψγ′〉 (7/2, 3/2) and |ψβ〉 → |ψα′〉 (5/2, 1/2), respectively. Moreover, for tris(2-methoxyphenyl)bismuthane the combination of 1H double quantum transition with the |ψi〉 → |ψj〉 (3/2, −1/2) transition explains the presence of the quadrupole peak at the frequency of 16–23 MHz (peak I).This thorough analysis reveals the quantum-mechanical background of the observed QRE effects. This is, to our knowledge, a first example of QRE effects for high spin quantum numbers of a quadrupolar nucleus reported and discussed in the literature and demonstrates the existence of one important prerequisite for the potential use of the phenomenon for medical imaging.
Conflicts of interest
There are no conflicts to declare.Appendix
Matrix elements of the Hamiltonian, H0(S) in the {|S,mS〉} basis take the form:diagonal elements:
off diagonal elements:
The elements of the H0(S) matrix below the diagonal are given as 〈m|H0(S)|n〉 = 〈n|H0(S)|m〉*, where “*”denotes complex conjugation. Other elements are equal to zero.
Acknowledgements
This project has received funding from the European Union's Horizon 2020 research and innovation programme under grant agreement no. 665172.References
- R. Damadian, Science, 1971, 171, 1151 CAS.
- I. C. Kiricuta and V. Simplăceanu, Cancer Res., 1975, 35, 1164 Search PubMed.
- J. Kowalewski, D. Kruk and G. Parigi, Adv. Inorg. Chem., 2005, 57, 41 CrossRef CAS.
- E. Belorizky, P. H. Fries, L. Helm, J. Kowalewski, D. Kruk, R. R. Sharp and P.-O. Westlund, J. Chem. Phys., 2008, 128, 052315 CrossRef PubMed.
- P. Caravan, Chem. Soc. Rev., 2006, 35, 512 RSC.
- D. Kruk, T. Nilsson and J. Kowalewski, Phys. Chem. Chem. Phys., 2001, 3, 4907 RSC.
- D. Kruk and J. Kowalewski, Mol. Phys., 2003, 101, 2861 CrossRef CAS.
- I. Bertini, O. Galas, C. Luchinat and G. Parigi, J. Magn. Reson., 1995, 113, 151 CrossRef CAS.
- T. Nilsson, J. Svoboda, P.-O. Westlund and J. Kowalewski, J. Chem. Phys., 1998, 109, 6364 CrossRef CAS.
- P. Caravan, J. J. Ellison, T. J. McMurry and R. B. Lauffer, Chem. Rev., 1999, 99, 2293 CrossRef CAS PubMed.
- É. Tóth, L. Helm and A. E. Merbach, Contrast Agents I, ed. W. Krause, Springer-Verlag, Germany, 2002, p. 61 Search PubMed.
- I. Solomon and N. Bloembergen, J. Chem. Phys., 1956, 25, 261 CrossRef CAS.
- N. Bloembergen and L. O. Morgan, J. Chem. Phys., 1961, 34, 842 CrossRef CAS.
- P.-O. Westlund, J. Chem. Phys., 1998, 108, 4945 CrossRef CAS.
- D. Kruk, J. Kowalewski, D. S. Tipikin, J. H. Freed, M. Mościcki, A. Mielczarek and M. Port, J. Chem. Phys., 2011, 134, 024508 CrossRef CAS PubMed.
- D. Kruk and J. Kowalewski, J. Chem. Phys., 2009, 130, 174104 CrossRef CAS PubMed.
- S. Laurent, D. Forge, M. Port, A. Roch, C. Robic, L. V. Elst and R. N. Muller, Chem. Rev., 2008, 108, 2064 CrossRef CAS PubMed.
- D. Kruk, A. Korpała, S. M. Taheri, A. Kozłowski, S. Förster and E. A. Rössler, J. Chem. Phys., 2014, 140, 174504 CrossRef CAS PubMed.
- D. V. Hingorani, A. S. Bernstein and M. D. Pagel, Contrast Media Mol. Imaging, 2015, 10, 245 CrossRef CAS PubMed.
- F. Winter and R. Kimmich, Mol. Phys., 1982, 45, 33 CrossRef CAS.
- F. Winter and R. Kimmich, Biophys. J., 1985, 48, 331 CrossRef CAS PubMed.
- E. Anoardo and D. J. Pusiol, Phys. Rev. Lett., 1996, 76, 3983 CrossRef CAS PubMed.
- E. P. Sunde and B. Halle, J. Magn. Reson., 2010, 203, 257 CrossRef CAS PubMed.
- L. M. Broche, G. P. Ashcroft and D. J. Lurie, Magn. Reson. Med., 2012, 68, 358 CrossRef PubMed.
- P.-O. Westlund, Phys. Chem. Chem. Phys., 2010, 12, 3136 RSC.
- M. Florek-Wojciechowska, M. Wojciechowski, R. Jakubas, S. Brym and D. Kruk, J. Chem. Phys., 2016, 144, 054501 CrossRef CAS PubMed.
- M. Florek-Wojciechowska, R. Jakubas and D. Kruk, Phys. Chem. Chem. Phys., 2017, 19, 11197 RSC.
- D. Kruk, A. Kubica, W. Masierak, A. F. Privalov, M. Wojciechowski and W. Medycki, Solid State Nucl. Magn. Reson., 2011, 40, 114 CrossRef CAS PubMed.
- M. Nolte, A. Privalov, J. Altmann, V. Anferov and F. Fujara, J. Phys. D: Appl. Phys., 2002, 35, 939 CrossRef CAS.
- D. Kruk, J. Altmann, F. Fujara, A. Gädke, M. Nolte and A. F. Privalov, J. Phys.: Condens. Matter, 2005, 17, 519 CrossRef CAS.
- D. Kruk and O. Lips, Solid State Nucl. Magn. Reson., 2005, 28, 180 CrossRef CAS PubMed.
- D. Kruk and O. Lips, J. Magn. Reson., 2006, 179, 250 CrossRef CAS PubMed.
- D. Kruk, Understanding Spin Dynamics, Pan Stanford Publishing Pte. Ltd., Singapore, 2016 Search PubMed.
- D. M. Brink and G. R. Satchler, Angular Momentum, Clarendon Press, Oxford, 1979 Search PubMed.
- A. R. Edmonds, Angular Momentum in Quantum Mechanics, Princeton University Press, Princeton, 1974 Search PubMed.
- H. Scharfetter, J. Magn. Reson., 2016, 271, 90 CrossRef CAS PubMed.
| This journal is © the Owner Societies 2018 |


