 Open Access Article
Creative Commons Attribution 3.0 Unported Licence
Multiscale design of ZnO nanostructured photocatalysts†
A.
Ramirez-Canon
 ab,
M.
Medina-Llamas
a,
M.
Vezzoli
a and
D.
Mattia
 *a
*a
aDepartment of Chemical Engineering, University of Bath, BA27AY, UK. E-mail: d.mattia@bath.ac.uk
bDepartment of Chemical and Biological Sciences, University of Huddersfield, HD13DH, Huddersfield, UK
First published on 12th February 2018
Abstract
A systematic investigation of the photocatalytic activity (PCA) of nanostructured ZnO films showed how this is directly affected by the films’ morphology at different scales, from the macroscale morphology of films (e.g. thickness and surface area), to the microscale feature arrangement (e.g. aligned vs. randomly oriented structures or interpenetrated ones), to the nanoscale structure (e.g. crystal size and orientation). The interest in immobilizing photocatalysts in water treatment stems from concerns about the potential toxicity of their slurry form, which requires expensive downstream removal. Immobilisation, though, leads to a reduction in PCA, generally attributed to a lower surface area. By reducing the films’ feature size to the nanoscale, an immobilized photocatalyst with high surface area can be achieved. At this scale, however, feature structuring and morphology become important as they determine the interaction between light and the photocatalytic material. In this work, nanostructured ZnO films with different morphology, arrangement and structure were produced by electrochemical anodization of zinc and were tested using the degradation of phenol in a batch reactor as a model system. Results show that the PCA for immobilized catalysts can be optimised by controlling microscale arrangement (light absorbance capacity) and nanoscale structure (crystal size and orientation) rather than macroscale morphology (surface area). These results provide a clear direction to maximising the photocatalytic activity of immobilised photocatalysts for the removal of organic pollutants from water.
Introduction
Photocatalysis is an attractive technology for the removal of organic pollutants in water without the aid of hazardous chemicals such as hypochlorite, peroxide or ozone.1 The majority of existing small and pilot-scale water treatment plants using photocatalysis are based on particle slurry designs, taking advantage of the high surface area displayed by the powdered photocatalyst and the potential high mass transfer between pollutants and photocatalyst.2 The large-scale implementation of this technology, though, is hindered by the need for a post-processing step of the treated water to remove the catalyst powder. This additional step is required due to the potential adverse effects of photoactive materials on the natural environment, resulting in a significant cost increase.3 An alternative solution is the use of immobilised catalysts, which do not require subsequent recovery steps4 and can be more easily scaled up. However, the challenge with immobilized catalysts is the significant loss of PCA once they are supported, generally attributed to a lower surface area and mass transfer coefficient in the reactor.2,5 Nanostructured supported photocatalyst could potentially simultaneously offer the benefits of immobilization while at the same time providing a high surface area.6 In general, surface area is considered to play a major role in the photocatalytic activity, as studies have found evidence of the enhancement of PCA due to an increase in the surface area for suspended catalysts such as ZnO and TiO2. This has been achieved either by decreasing particle size7,8 or by developing hierarchical structures.9,10 However, surface area alone cannot explain the photocatalytic activity of nanostructured photocatalysts. For example, a study looking at the activity of ZnO powders with different morphologies, found a linear relationship between the amount of adsorbed substrate (acetaldehyde) and the photocatalytic activity once the data is normalised by BET surface area, but differences in the PCA were attributed to differences in morphology rather than surface area.11 Comparing the photocatalytic activity of mesoporous TiO2 spheres with similar surface area but different morphology (i.e. semi-hollow, hollow and solid spheres) the authors suggested that the semi-hollow structures displayed higher activity due to a multi-deflection of light produced by the partially hollow morphology.12 Similarly, ZnO particles with different morphologies but similar surface area displayed significantly different photoactivity under the same conditions and, in some cases, particles with lower surface area but specific morphologies (e.g. spherical shape) outperformed the ones with a higher surface area (e.g. rodlike morphology).13 A review on ZnO suspensions for photocatalytic applications also highlighted the importance of morphology in optimizing the degradation of these materials, focusing primarily on the effect of surface area, crystallinity and shape of the nanostructures.14 Unfortunately, much of this evidence cannot be directly applied to immobilised photocatalysts as they present a further level of complexity given by the fact that not all surface area is equally active, since the photocatalyst's structuring might ‘obscure’ some of the available surface. As an example, films of aligned ZnO rods displayed higher activity than randomly oriented ones in the degradation of methylene blue.6 Furthermore, and in analogy to suspended photocatalysts, differences in photocatalytic activity for immobilised materials were attributed to a combined effect of surface area and crystallinity, in particular surface oxygen vacancies.15From the analysis above, it emerges that a major challenge in designing immobilised photocatalysts is how to separate the effect of macroscale morphology (i.e. surface area) from that microscale feature arrangement (i.e. feature orientation) and nanoscale structuring (i.e. degree of crystallinity or crystal size). By studying the degradation of phenol in a batch reactor, a systematic analysis of the effect of structuring and morphology of immobilised photocatalysts on PCA was conducted in this work. For that, nanostructured ZnO films (ZnO-NFs) were manufactured via the electrochemical anodization of zinc metal foils as it enables the production of ZnO nanostructures with a variety of morphologies and structures, and controlled crystallinity, crystal size and dimensions.16 The analysis includes the effect of morphology on the adsorption process (measured through adsorption–desorption experiments, surface area and crystallinity) and the interaction between light and the photocatalytic material (measured by light absorbance analysis). ZnO and phenol were selected as model photocatalyst and pollutant, respectively. The former has been successfully used for degrading organic pollutants such as aromatics compounds,17–22 and dyes;23–29 the latter's degradation has been extensively studied with its degradation pathway fully known.30,31
Experimental
ZnO film fabrication procedures
The ZnO films were produced via anodization of high purity zinc foil (99.98%, 0.25 mm thickness, Alfa Aesar). The Zn foil was pre-annealed in air at 300 °C (CWF1100, Carbolite) for one hour with a heating rate of 1 °C min−1, followed by a cleaning process with acetone (HPLC grade, 99.5+%, Fisher) in an ultrasonic bath for 10 minutes. Anodization was performed in a 2-electrode cell with 8 mm spacing, using the zinc foil as the anode and stainless steel (SS316 grade) as the cathode, with anodization conditions selected to obtain a variety of shapes.16 ZnO nanostructured films with different morphologies and structuring were obtained by varying the applied potential (1 to 40 V) using a DC power supply (Agilent E3634A); the reaction time (1 minute or 1 hour); and the electrolytes i.e. aqueous solution of potassium bicarbonate (KHCO3, 99.99% Powder, Sigma Aldrich), and ethanoic solutions of orthophosphoric acid (H3PO4, 85%, Alfa Aesar), hydrochloric acid (HCl, 37% solution, Acros Organic), oxalic acid (H2C2O4, 98%, Acros Organic), and sodium hydroxide (NaOH, 1 M volumetric solution, Fisher). The temperature of the electrolyte was kept constant throughout anodization (0 or 10 °C) using a water-cooled bath (Thermo Scientific). After anodization, the samples were thoroughly rinsed with ethanol and deionized water and annealed at 350 °C for 1 hour at a heating rate of 1 °C min−1. Subsequently, the films were stored in darkness in a desiccator cabinet before further analysis.ZnO film characterization
The surface morphology of all ZnO films was analysed using a JEOL 6301F FESEM. The crystal structure of these films was studied using a Philips PW XRD 1710 diffractometer set in flat plate mode for 2θ values of 10°–80°; and a Philips CM200 FEG-TEM. The compositional analysis was carried out using XPS (GV Escalab 250) equipped with a high intensity monochromated Al Kα source, focussed to a spot of 120–600 μm in diameter on the sample, and the light adsorbance capacity of these films was measured using a UV/Vis/NIR spectroscopy with an integrating sphere. Statistical image analysis of the nanowire diameter and crystal distribution was performed using ImageJ on micrographs obtained using a TEM operated at 80–200 kV with resolution to 0.14 nm (Philips CM200 FEGTEM).The measurement of the surface area in films represents a challenge. Among the different methods used to measure total surface area of catalysts, BET, t-plot and αs-plot methods are the most commonly used and well-recognised.32–34 These techniques are based on a mechanism of physical adsorption of gas molecules on the solid catalyst surface in powder form, limiting their applicability to supported photocatalysts. Herein, adsorption–desorption experiments with a metal solution were performed to compare quantitatively the adsorption capacity of the selected films. Based on a published method,35 magnesium was absorbed on the surface of the selected ZnO structures. The films were immersed in 10 mL of MgCl2 [150 ppm] and left overnight, constantly shaken at room temperature. After completing the adsorption experiment, films were removed from the solution and rinsed thoroughly with deionised water. Desorption was performed by immersing the ZnO-NFs in 10 mL of 0.01 M CaCl2 solution for 24 hours. The solutions with the desorbed Mg were filtered and the concentration of this metal was measured by atomic absorption spectroscopy. Similar experiments were carried out with different amount of ZnO powder (99.95%, 18 nm, US Research nanomaterials Inc.) with a known surface area of 22 m2 g−1 measured by BET. Then, the adsorption capacities of the films and the powder were correlated to obtain the films’ surface area in terms of m2 of surface per cm2 of film area.
Phenol photocatalytic degradation experiments
The PCA of the ZnO films was studied in the degradation of 50 mL solution of phenol [5 ppm] at 10 ± 1 °C using a batch reactor. The reactor consists of a jacketed vessel of 100 mL (reservoir) with a magnetic stirrer (1000 rpm) where temperature was controlled using a water-cooled bath (Thermo Scientific). UV light was provided from the top at a fixed distance of 3 cm between the solution and the UV-lamp (UVG-54 Handheld UV lamp, 254 nm UV/6 Watts) with an intensity of light of 0.82 ± 0.01 mW cm−2, measured using a UV light meter (HHUV254SD – OMEGA engineering). Changes in concentration of phenol and its by-products were measured by HPLC (Shimadzu SCL-10A) equipped with an isocratic pump (LC-10-ATVP), an auto-sampler (SIL-10AD), and a UV-VIS detector (SPD-10AV). Reverse phase chromatography was performed with a stainless steel, 150 mm × 2.0 mm, C18 column (Thermo, Germany). Solutions of water/acetonitrile [75![[thin space (1/6-em)]](https://www.rsc.org/images/entities/char_2009.gif) :
:![[thin space (1/6-em)]](https://www.rsc.org/images/entities/char_2009.gif) 25 v/v] and [50
25 v/v] and [50![[thin space (1/6-em)]](https://www.rsc.org/images/entities/char_2009.gif) :
:![[thin space (1/6-em)]](https://www.rsc.org/images/entities/char_2009.gif) 50 v/v] were used as mobile phase using an isocratic method.36
50 v/v] were used as mobile phase using an isocratic method.36
Phenol has a molar absorption coefficient (ε) of 2340 cm−1 M−1 and strong tendency to absorb light in the 220–300 nm range with a maximum absorption peak at 270.8 nm.37 Since the wavelength of light used in this study was 254 nm, a certain amount of photolysis was expected. The photolysis of phenol in the reactor was measured, showing that less than 5% of the phenol was degraded by UV light after 4 hours, so that any further degradation can be attributed solely to photocatalysis.
Preliminary 11 hours-long experiments, under constant UV irradiation, were carried out using a model ZnO-NF (0.1 M KHCO3; 1 V/1 h). Each film was initially immersed in the phenol solution for 30 minutes in darkness allowing the system to reach the absorption equilibrium, with no significant reduction in phenol concentration observed. Fig. 1 displays the degradation of phenol and the 3 most-common by-products (i.e. catechol, benzoquinone and hydroquinone)31 over time under UV irradiation (i.e. not including the 30 min in dark).
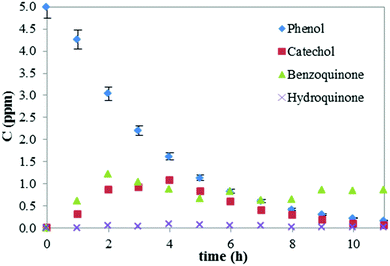 | ||
| Fig. 1 Photocatalytic degradation of phenol and formation of by-products. Error (%) for the by-products is similar to that of phenol (shown) but omitted for clarity. | ||
The photocatalytic degradation of phenol obeys pseudo first-order kinetics, as expected.16,38 Complete degradation of phenol was obtained after 9 hours of reaction. The degradation of benzoquinone appears to be affected by its low solubility in water (1.0 g/100 mL), compared to the other phenolate intermediates (8.3 g/100 mL for phenol, 43 g/100 mL for catechol and 5.9 g/100 mL for hydroquinone), which limits its adsorption on the photocatalyst and hinders its degradation.36 Additionally, benzoquinone can be produced from the oxidation of phenol and catechol maintaining the concentration of benzoquinone quasi constant. After 11 hours, the TOC was reduced by 98% (Fig. S1, ESI†). Since preliminary experiments showed that changes produced by adsorption were negligible, the degradation due to photolysis accounted for less than 5% and that ∼70% of the degradation occurred within 4 hours, further experiments were stopped after 4 h. Kinetic constants were calculated as a straight fit on the linear portion of a log plot of concentration vs. time.
Result and discussion
XPS analysis shown in Table 1 revealed that the main elements of the films were Zn(2p) and O(1s). Traces of the deposited electrolyte were also found (a common occurrence in anodization processes39) and, as such, an extensive rinsing of the films was carried out before photocatalytic experiments. Similar oxygen content was observed for films produced with the same electrolyte (e.g. KHCO3).40 The band gap for all the different films was in the range of 3.27–3.50 eV. Variations in the band gap of nanostructured materials has been attributed to feature,41–43 or particle size.44| % (w/w) | Zn(2p) | O(1s) | C(1s) | Fe(2p) | Cl(2p) | F(1s) | Na(1s) | P(2s) |
|---|---|---|---|---|---|---|---|---|
| KHCO3 | 34.0 | 55.0 | 9.2 | 1.8 | — | — | — | — |
| NaOH | 32.2 | 52.1 | 10.0 | 1.7 | — | — | 4.0 | — |
| H2C2O4 | 15.5 | 49.2 | 34.6 | 0.8 | — | — | — | — |
| H3PO4 | 16.4 | 53.0 | 17.0 | 1.1 | 0.6 | 2.2 | — | 9.8 |
| HCl | 26.3 | 47.7 | 22.0 | 1.3 | 2.7 | — | — | — |
The XRD analysis showed that all films after thermal post-annealing contain wurtzite-type crystals with the strongest intensity in the (101), (100), (002) and (112) peaks (Fig. 2), consistent with literature on anodized ZnO films.46–48
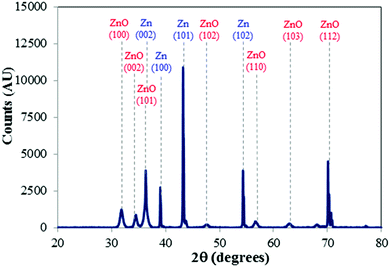 | ||
| Fig. 2 XRD pattern of ZnO obtained with 0.1 M KHCO3 at 1 V for 1 hour, representative of samples produced with all electrolytes after thermal annealing. | ||
Effect of macroscale film morphology on photocatalytic activity
First, a screening of the effect of different ZnO macroscopic film morphologies on photocatalytic activity was conducted. Using different anodization conditions (i.e. electrolyte type and concentration, applied voltage time and temperature), ZnO films with different structures were obtained (Fig. 3): Flake-like nanostructures using H3PO4; nano-flower-like structures using HCl, NaOH, H2C2O4, and HNO3; nanorods and nanowires with KHCO3. The different morphologies resulted in different degradation rates with a difference of 40% in the final concentration of phenol observed between the lowest and the highest degradation (Table 2 and Fig. S2, ESI†). Although it is not possible to establish a precise correlation between photocatalytic activity and anodization parameters, given their significant number and the fact that they are interrelated, it is clear that the latter affect the former. For example, films produced with HCl at different conditions, display very different structures (Fig. 3b, h and k) with very different phenol degradation (Table 2, b, h and k). A systematic analysis of the effect of anodization conditions on ZnO film morphology can be found elsewhere.16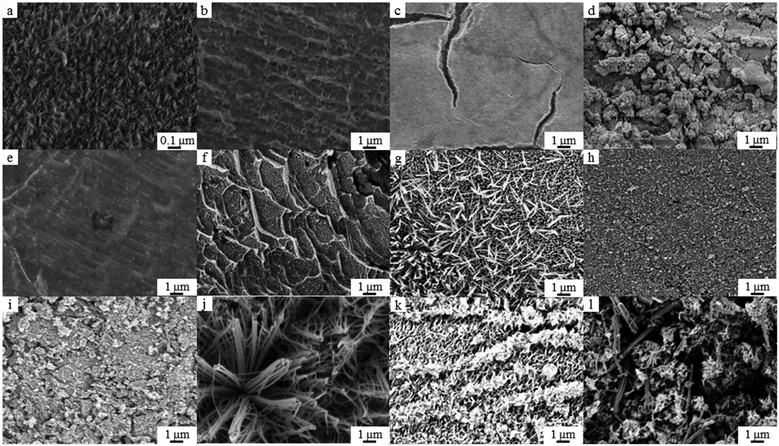 | ||
| Fig. 3 FESEM micrographs of ZnO films used for photocatalytic studies. The letters correspond to the anodization conditions reported in Table 2. | ||
| FESEM (Fig. 3) | Electrolyte | V app (V) | Time (min) | T (°C) | k (h−1) | C/Coa (−) | |
|---|---|---|---|---|---|---|---|
| Type | C (M) | ||||||
| a C/Co was calculated after 240 minutes of reaction time. | |||||||
| a | H2C2O4 | 1 | 10 | 15 | 10 | 0.44 | 0.18 |
| b | HCl | 0.1 | 40 | 60 | 10 | 0.32 | 0.32 |
| c | H2C2O4 | 1 | 40 | 5 | 0 | 0.29 | 0.34 |
| d | NaOH | 0.1 | 40 | 120 | 10 | 0.25 | 0.39 |
| e | H2C2O4 | 0.1 | 10 | 30 | 10 | 0.23 | 0.45 |
| f | H3PO4 | 1 | 40 | 120 | 10 | 0.20 | 0.48 |
| g | KHCO3 | 0.05 | 10 | 5 | 10 | 0.20 | 0.52 |
| h | HCl | 1 | 1 | 60 | 0 | 0.16 | 0.54 |
| i | NaOH | 0.1 | 40 | 60 | 10 | 0.16 | 0.55 |
| j | KHCO3 | 0.05 | 1 | 30 | 10 | 0.16 | 0.56 |
| k | HCl | 1 | 5 | 30 | 10 | 0.16 | 0.56 |
| l | KHCO3 | 0.05 | 5 | 15 | 10 | 0.14 | 0.61 |
The highest phenol degradation was obtained for films with a nanoflake morphology (Fig. 3a), while the lowest degradation was obtained for films with interpenetrated nanowire structures (Fig. 3l). Some qualitative trends were identified by comparing films’ morphologies and PCA: large and interconnected structures showed lower phenol degradation (e.g.Fig. 3j–l). Small structures (less than 1 μm in size), on the other hand, displayed higher degradation of phenol (e.g.Fig. 3a and b). Even nearly featureless films (e.g.Fig. 3c and e), outperformed those with larger and better-defined nanostructures (Fig. 3f–l). This analysis, though qualitative, support the idea that for immobilised photocatalysts, overall surface area, while playing an important role, is not the only material property defining their photocatalytic activity.
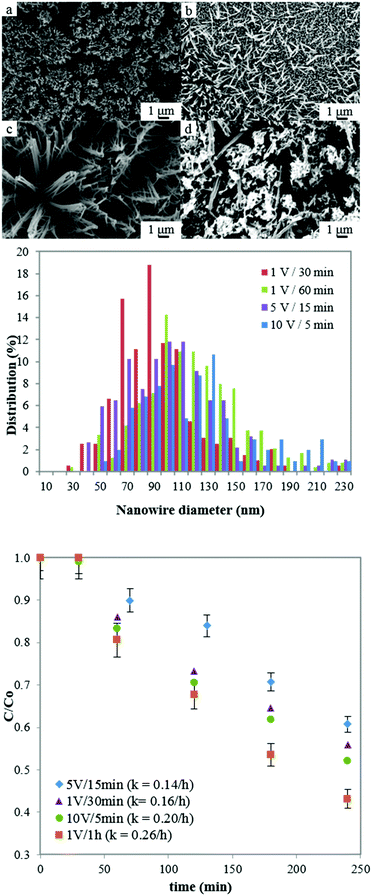
To provide quantitative data on the effect of macroscale film morphology, nanowires arrays produced with KHCO3 were selected as a model system for further analysis. This was done on the basis that different anodization conditions (voltage and time using the same electrolyte) result in different film macroscale morphologies (Fig. 4 top panel) while preserving the nanoscale feature structure (i.e. constant nanowire diameter, Fig. 4 middle panel) allowing to study the effect of film structuring independently of feature shape. Furthermore, selecting a single nanostructure shape, produced using the same method, minimised variations in oxygen vacancies between the samples.49 This is further supported by the nearly constant band-gap value measured for all the nanowire samples (3.36 ± 0.1 eV), indicating a similar level of oxygen vacancies.40,45
Fig. 4 bottom panel shows the degradation of phenol produced by the selected films. From a qualitative point of view, it appears that a similar trend to Fig. 3 is observed here, with the highest phenol degradation obtained for films with increased nanowire alignment and aspect ratio while interpenetrated nanowire structures produced the lowest degradation. A quantitative analysis, on the other hand, was carried out by correlating the kinetic constants of phenol degradation produced by the ZnO films displayed in Fig. 4 with their morphological properties such as surface area, thickness, crystal size distribution and light absorbance (Table 3 and Fig. S3, ESI†).
| Anodization conditions | k (h−1) | s (m2 cm−2) | t (μm) | l (−) | d (nm) |
|---|---|---|---|---|---|
| 5 V/15 min | 0.14 | 5.6 | 47.9 | 0.419 | 12.3 |
| 1 V/30 min | 0.16 | 3.6 | 14.1 | 0.432 | 10.6 |
| 10 V/5 min | 0.20 | 9.2 | 6.2 | 0.423 | 8.5 |
| 1 V/1 h | 0.26 | 4.4 | 36.4 | 0.554 | 7.7 |
| Correlation (abs) | — | 0.03 | 0.068 | 0.88 | 0.94 |
In terms of surface area and thickness, no correlation with the photocatalytic activity was found via the kinetic constants. The highest degradation of phenol with a kinetic constant of 0.26 h−1 was displayed by a film with relatively low surface area (produced at 1 V/1 h). Similarly, the thickest film (∼50 μm), which has the highest amount of photocatalytic material, produces the lowest phenol degradation. These results show that samples with a higher surface area (i.e. thicker samples or the ones with highly interpenetrated structures and high surface area) do not necessarily produce the highest phenol degradation. A study on the effect of thickness of ZnO films on the photocatalytic performance of the material has shown that there is a limit beyond which further increases in ZnO film thickness do not increase the photocatalytic activity of the material despite a higher amount of photocatalyst.50 In terms of surface area, similar results have been obtained in a suspended slurry, where TiO2 nanoparticles with the highest specific area displayed a lower degradation of an organic pollutant compared to nanoparticles with relatively low surface area.51 To further investigate this aspect, a ZnO film (obtained under the same experimental conditions to the film with the highest photocatalytic activity i.e. 1 V/1 h) was exposed to a post-treatment process to increase its roughness and thus its surface area.52 This was done by immersing the films in deionised water for 24 hours in darkness, followed by the same thermal annealing process used for other samples (350 °C for 1 hour at 1 °C min−1). FESEM micrographs (Fig. S4, ESI†) revealed the formation of hierarchical nanostructures with secondary growth occurring on the individual nanowires of the array, resulting in increased roughness and higher surface area.52 Nonetheless, no significant improvement in the photocatalytic performance was observed (Fig. S5, ESI†).
Effect of microscale feature arrangement on PCA
To investigate whether microscale feature arrangement has any effect on the photocatalytic activity, the different nanowire arrays were tested for their light absorbance (Fig. 5). A comparison of light absorbance values with PCA for the four nanowire films (Table 3) shows a high correlation (0.88), with the film with highest light absorbance displaying also the highest kinetic constant and thus the highest photocatalytic activity. Reduction in light absorbance of the films also resulted in lower degradation of phenol. The latter result can explain why the film produced at 1 V/1 h has the higher PCA despite its low surface area.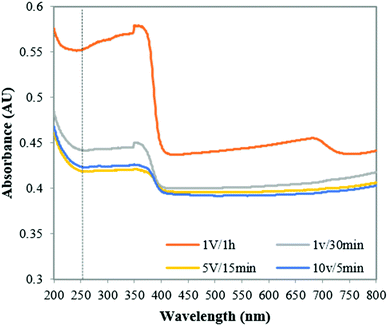 | ||
| Fig. 5 Light absorbance of ZnO-NFs obtained at different with 0.1 M KHCO3 at different voltages and reaction times. | ||
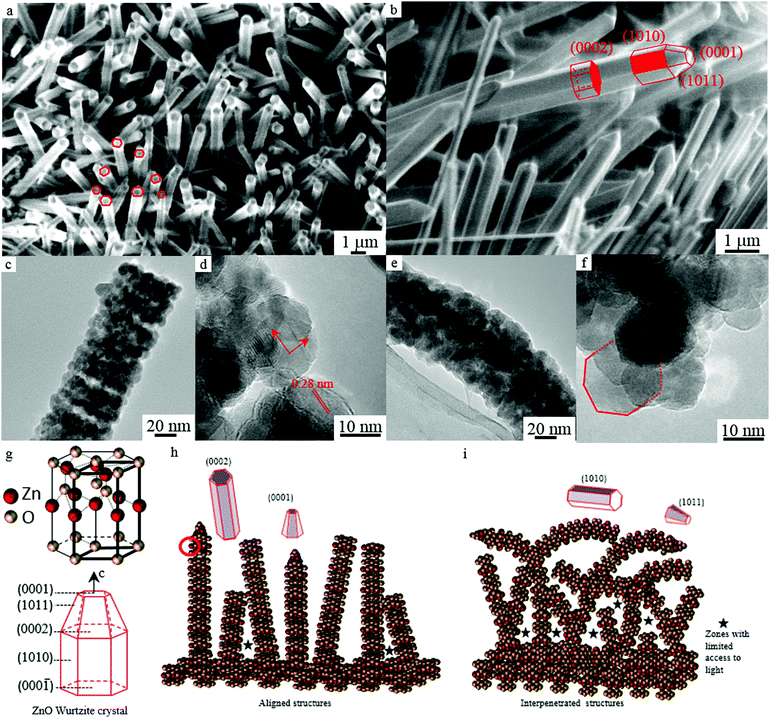
The more open and aligned arrangement (Fig. 4a and 7h) allows more light to penetrate deeper inside the film. In addition, since the film is not as thick as others, it is reasonable to assume that a higher proportion of the photocatalytic material can actually be reached by the light and be catalytically active. Conversely, the film produced at 5 V/15 min although having a relatively high surface area, has the lowest PCA. This can be explained by the fact that the film has a higher thickness and a more interpenetrated structure (Fig. 4d and 7i), resulting in less overall material being accessible to light which is evidenced by its low light absorbance.
Effect of nanoscale feature structure on photocatalytic activity
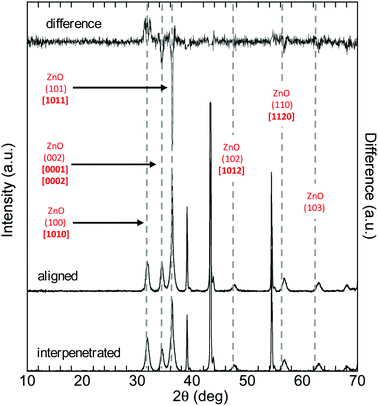
Finally, analysis of XRD and TEM data showed a substantial effect of the nanoscale feature morphology on photocatalytic activity in terms of nanowire crystal structure. Meaningful differences in the average crystal size of the different nanowires were measured (Table 3), with the highest correlation to PCA (0.94). The film with the smallest average nanowire crystal size (7.7 nm) displays the highest photocatalytic activity whilst the film with the largest average nanowire crystal size (12.3 nm) showed the lowest PCA. Furthermore, differences in the intensity of the XRD peaks indicate a potential effect of crystal orientation on photocatalytic activity: the hexagonal shape of the wurtzite-type crystals forming the nanowires allows exposing both polar facets [0001–0002] and non-polar facets [1010–1011] (Fig. 7g). While retaining the same crystal structure, the XRD spectra for the samples with the highest and lowest PCA appeared to show some difference in the peaks with the facets [0001/0002], [1010] and [1011] (Fig. 6). This difference was quantified by calculating the area under each peak and the ratio of the peak for the aligned sample (1 V/1 h) vs. the interpenetrated sample (5 V/15 min) (Table 4). Results show that the area of the peak (002) is higher in the sample with higher photocatalytic activity. Peak (002) corresponds to polar facets [0001] and [0002], the most active due to their higher surface energy.53,54| Facet | 1 V/1 h | 5 V/15 min | Ratio |
|---|---|---|---|
| [1010] | 671 | 842 | 0.80 |
| [0001, 0002] | 576 | 531 | 1.1 |
| [1011] | 1724 | 1505 | 1.1 |
On the other hand, the peak (100) corresponding to facet [1010], which is more thermodynamically stable but less reactive, is higher in the sample with lower photocatalytic activity. The peak (101) with the facet [1011], which is less stable and thus more reactive than facet [1010], is also higher in the sample with the highest PCA, however this last result must be considered with caution due to a partial overlap with the Zn(002) peak.
In agreement with XRD data, the analysis of TEM micrographs for the samples with highest and lowest photocatalytic activity showed that nanostructures exposing their terminal facet [0001] and [0002] (Fig. 7a–c and h) display higher PCA for the degradation of phenol. On the other hand, the interpenetrated nanowire structures, with curved nanowires (Fig. 7e), are more likely to expose non-polar facets (Fig. 7i) displaying a lower photocatalytic activity.
Considering the effect on PCA of the films’ morphology at different scales, it is clear that the microscale arrangement of the nanowires in the films determines the way and how much light is adsorbed, with denser, interpenetrated nanowire structures reducing light penetration and, therefore, photocatalytic activity and more open structures allowing more light through (Fig. 7a and b). For open or aligned arrangements, a higher proportion of the photocatalytic material can actually be reached by the light and be catalytically active, as is the case of the film produced at 1 V/1 h (Fig. 7h). In contrast, since the photon penetration length for polycrystalline ZnO is only 0.13 μm,55 and the diameter distribution of the nanowires (Fig. 4 central panel) is in the range of 0.7 to 1.5 μm, it is reasonable to assume that some areas of the film can be obscured or not fully illuminated by light. For example, the film produced at 5 V/15 min although having a higher surface area, has lower light absorbance and lower photocatalytic activity. This can be explained by the fact that the film has a more interpenetrated structure (Fig. 7i), resulting in less overall material being accessible to light.
Conclusions
A systematic investigation from the macroscale to the nanoscale of the relation between morphology and photocatalytic activity of nanostructured ZnO films reveals that light absorbance capacity and crystal size are the defining parameters to maximise photocatalytic activity in immobilised photocatalysts, rather than surface area, as is the case for suspended slurries. The nanostructures were produced via electrochemical anodization of zinc, which allows precise control over feature size, shape and crystallinity, as well as macro- and microscale film morphology.The analysis of the photocatalytic degradation of phenol with different supported morphologies shows how the former is directly affected by the latter at different scales, from the macroscale morphology of the films (e.g. thickness and surface area), to their microscale arrangement (e.g. aligned structures vs. randomly oriented or interpenetrated ones), to their nanoscale structure (crystal orientation of individual nanostructures). All these parameters are intertwined and their effects on the material's PCA are difficult to untangle for immobilized photocatalysts. Furthermore, results show that light interacts with these features at all length scales involved and light absorbance could be used as the overall optimization factor to maximise the photocatalytic activity of these photocatalysts. These results show a clear direction to optimising immobilised nanostructured films to enhance their photocatalytic activity.
Conflicts of interest
There are no conflicts to declare.Acknowledgements
The authors acknowledge the Centre for Sustainable Chemical Technologies of the University of Bath for funding support through UK EPSRC (Grant No. EP/G03768X/1), Leeds EPSRC Nanoscience and Nanotechnology Research Equipment Facility-University of Leeds, and COLCIENCIAS–Colombia for supporting this project via the award of Francisco Jose de Caldas Scholarship to ARC. All data created during this research are openly available from the University of Bath data archive at http://dx.doi.org/.References
- C. McCullagh, N. Skillen, M. Adams and P. K. J. Robertson, Photocatalytic reactors for environmental remediation: a review, J. Chem. Technol. Biotechnol., 2011, 86, 1002–1017 CrossRef CAS.
- H. Amiri, B. Ayati and H. Ganjidoust, Mass transfer phenomenon in photocatalytic cascade disc reactor: effects of artificial roughness and flow rate, Chem. Eng. Process. Process Intensif., 2017, 116, 48–59 CrossRef CAS.
- W. M. Samhaber and M. T. Nguyen, Applicability and costs of nanofiltration in combination with photocatalysis for the treatment of dye house effluents, Beilstein J. Nanotechnol., 2014, 5, 476–484 CrossRef PubMed.
- N. Boussatha, M. Gilliot, H. Ghoualem and J. Martin, Formation of nanogranular ZnO ultrathin films and estimation of their performance for photocatalytic degradation of amoxicillin antibiotic, Mater. Res. Bull., 2018, 99, 485–490 CrossRef CAS.
- A. Rachel, M. Subrahmanyam and P. Boule, Comparison of photocatalytic efficiencies of TiO2 in suspended and immobilised form for the photocatalytic degradation of nitrobenzenesulfonic acids, Appl. Catal., B, 2002, 37, 301–308 CrossRef CAS.
- A. M. Ali, E. A. C. Emanuelsson and D. A. Patterson, Photocatalysis with nanostructured zinc oxide thin films: The relationship between morphology and photocatalytic activity under oxygen limited and oxygen rich conditions and evidence for a Mars Van Krevelen mechanism, Appl. Catal., B, 2010, 97, 168–181 CrossRef CAS.
- L. Jing, Z. Xu, X. Sun and J. Shang, The surface properties and photocatalytic activities of ZnO ultrafine particles, Appl. Surf. Sci., 2001, 180, 308–314 CrossRef CAS.
- A. Kalita and M. P. C. Kalita, Effects of size reduction on microstructural, optical, vibrational, magnetic and photocatalytic properties of ZnO nanocrystals, Mater. Charact., 2018, 109–118 CrossRef CAS.
- S. Wang, P. Kuang, B. Cheng, J. Yu and C. Jiang, ZnO hierarchical microsphere for enhanced photocatalytic activity, Elsevier B.V., 2018 Search PubMed.
- Y. Miao, H. Zhang, S. Yuan, Z. Jiao and X. Zhu, Preparation of flower-like ZnO architectures assembled with nanosheets for enhanced photocatalytic activity, J. Colloid Interface Sci., 2016, 462, 9–18 CrossRef CAS PubMed.
- D. Li and H. Haneda, Morphologies of zinc oxide particles and their effects on photocatalysis, Chemosphere, 2003, 51, 129–137 CrossRef CAS PubMed.
- H. Li, Z. Bian, J. Zhu, D. Zhang, G. Li, Y. Huo, H. Li and Y. Lu, Mesoporous Titania Spheres with Tunable Chamber Structure and Enhanced Photocatalytic Activity, J. Am. Chem. Soc., 2007, 129, 8406–8407 CrossRef CAS PubMed.
- L. Xu, Y.-L. Hu, C. Pelligra, C.-H. Chen, L. Jin, H. Huang, S. Sithambaram, M. Aindow, R. Joesten and S. L. Suib, ZnO with Different Morphologies Synthesized by Solvothermal Methods for Enhanced Photocatalytic Activity, Chem. Mater., 2009, 21, 2875–2885 CrossRef CAS.
- S. G. Kumar and K. S. R. K. Rao, Zinc oxide based photocatalysis: tailoring surface-bulk structure and related interfacial charge carrier dynamics for better environmental applications, RSC Adv., 2015, 5, 3306–3351 RSC.
- S. S. Shinde, P. S. Shinde, C. H. Bhosale and K. Y. Rajpure, Zinc oxide mediated heterogeneous photocatalytic degradation of organic species under solar radiation, J. Photochem. Photobiol., B, 2011, 104, 425–433 CrossRef CAS PubMed.
- A. Ramirez-Canon, D. O. Miles, P. J. Cameron and D. Mattia, Zinc oxide nanostructured films produced via anodization: a rational design approach, RSC Adv., 2013, 3, 25323 RSC.
- J. Al-Sabahi, T. Bora, M. Al-Abri and J. Dutta, Efficient visible light photocatalysis of benzene, toluene, ethylbenzene and xylene (BTEX) in aqueous solutions using supported zinc oxide nanorods, PLoS One, 2017, 12, 1–16 Search PubMed.
- J. Sen Chang, J. K. Tan, S. N. Shah, A. Mateblowski, J. Strunk, P. E. Poh and M. N. Chong, Morphological tunable three-dimensional flower-like zinc oxides with high photoactivity for targeted environmental remediation: degradation of emerging micropollutant and radicals trapping experiments, J. Taiwan Inst. Chem. Eng., 2017, 81, 206–217 CrossRef.
- S. P. Devipriya and S. Yesodharan, Photocatalytic degradation of phenol in water using TiO2 and ZnO, J. Environ. Biol., 2010, 31, 247–249 CAS.
- M. Qamar and M. Muneer, A comparative photocatalytic activity of titanium dioxide and zinc oxide by investigating the degradation of vanillin, Desalination, 2009, 249, 535–540 CrossRef CAS.
- J. J. Vora, S. K. Chauhan, K. C. Parmar, S. B. Vasava, S. Sharma and L. S. Bhutadiya, Kinetic Study of Application of ZnO as a Photocatalyst in Heterogeneous Medium, E. – J. Chem., 2009, 6, 531–536 CrossRef CAS.
- J. F. Richard, C. Bosquet and F. Pilichowski, Photocatalytic transformation of aromatic compounds in aqueous zinc oxide suspensions effect of substrate concentration on the distribution of products, J. Photochem. Photobiol., A, 1997, 108, 45–49 CrossRef.
- A. Ulyankina, I. Leontyev, M. Avramenko, D. Zhigunov and N. Smirnova, Large-scale synthesis of ZnO nanostructures by pulse electrochemical method and their photocatalytic properties, Mater. Sci. Semicond. Process., 2018, 76, 7–13 CrossRef CAS.
- C. A. K. Gouvêa, S. G. Wypych, N. Moraes, N. Durán, N. Nagata and P. Peralta-Zamora, Semiconductor-assisted photocatalytic degradation of reactive dyes in aqueous solution, Chemosphere, 2000, 40, 433–440 CrossRef.
- M. B. A. Akyol and H. C. Yatmaz, Photocatalytic decolorization of Rema-zol Red RR in aqueous ZnO suspensions, Appl. Catal., B, 2004, 54, 19–24 CrossRef.
- V. M. S. Sakthivel, B. Neppolian, M. V. Shankar, B. Arabindoo and M. Palanichamy, Solar photocatalytic degradation of azo dye: comparison of photocatalytic efficiency of ZnO and TiO2, Sol. Energy Mater. Sol. Cells, 2003, 77, 65–82 CrossRef.
- K. Byrappa, A. K. Subramani, S. Ananda, K. M. L. Rai, R. Dinesh and M. Yoshimura, Photocatalytic degradation of rhodamine B dye using hydrothermally synthesized ZnO, Bull. Mater. Sci., 2006, 29, 433–438 CrossRef CAS.
- N. Daneshvar, D. Salari and A. Khataee, Photocatalytic degradation of azo dye acid red 14 in water on ZnO as an alternative catalyst to TiO2, J. Photochem. Photobiol., A, 2004, 162, 317–322 CrossRef CAS.
- S. Sakthivel, B. Neppolian, M. V. Shankar, B. Arabindoo, M. Palanichamy and V. Murugesan, Solar photocatalytic degradation of azo dye: comparison of photocatalytic efficiency of ZnO and TiO2, Sol. Energy Mater. Sol. Cells, 2003, 77, 65–82 CrossRef CAS.
- V. Vaiano, M. Matarangolo, J. J. Murcia, H. Rojas, J. A. Navío and M. C. Hidalgo, Enhanced photocatalytic removal of phenol from aqueous solutions using ZnO modified with Ag, Appl. Catal., B, 2018, 225, 197–206 CrossRef CAS.
- J. Moreira, B. Serrano, A. Ortiz and H. de Lasa, A unified kinetic model for phenol photocatalytic degradation over TiO2 photocatalysts, Chem. Eng. Sci., 2012, 78, 186–203 CrossRef CAS.
- G. Leofanti, M. Padovan, G. Tozzola and B. Venturelli, Surface area and pore texture of catalysts, Catal. Today, 1998, 41, 207–219 CrossRef CAS.
- K. S. Sing, Adsorption by powders and porous solids, Elsevier, Oxford, 2014, pp. 253–258 Search PubMed.
- T. Kozłowski, I. Babiarz and E. Grobelska, Application of Thermoporometry Based on Convolutive DSC to Investigation of Mesoporosity in Cohesive Soils, Hydro-Eng. Environ. Mech., 2010, 57, 199–218 Search PubMed.
- S. Mahdavi, M. Jalali and A. Afkhami, Removal of heavy metals from aqueous solutions using Fe3O4, ZnO, and CuO nanoparticles, J. Nanopart. Res., 2012, 14, 846 CrossRef.
- E. Grabowska, J. Reszczyńska and A. Zaleska, Mechanism of phenol photodegradation in the presence of pure and modified-TiO2: A review, Water Res., 2012, 46, 5453–5471 CrossRef CAS PubMed.
- I. B. Berlman, Handbook of fluorescence spectra of aromatic molecules, Academic Press, New York, 2nd edn, 1971 Search PubMed.
- S. Lathasree, A. N. Rao, B. SivaSankar, V. Sadasivam and K. Rengaraj, Heterogeneous photocatalytic mineralisation of phenols in aqueous solutions, J. Mol. Catal. A: Chem., 2004, 223, 101–105 CrossRef CAS.
- A. Eftekhari, R. Alkire, Y. Gogotsi and P. Simon, Nanostructured Materials in Electrochemistry, Wiley-VCH, 2008, pp. 1–116 DOI:10.1002/9783527621507.ch1.
- M. S. Hamdy, I. S. Yahia, W. Knoff and T. Story, Oxygen-defected ZnO: facial Synthesis and high photocatalytic performance under visible light, Optik, 2018, 158, 1123–1130 CrossRef CAS.
- A. Janotti and C. G. Van de Walle, Fundamentals of zinc oxide as a semiconductor, Rep. Prog. Phys., 2009, 72, 1–30 CrossRef.
- S. Rahmane, B. Abdallah, A. Soussou, E. Gautron, P.-Y. Jouan, L. Le Brizoual, N. Barreau, A. Soltani and M. A. Djouadi, Epitaxial growth of ZnO thin films on AlN substrates deposited at low temperature by magnetron sputtering, Phys. Status Solidi, 2010, 207, 1604–1608 CrossRef CAS.
- L. Schmidt-Mende and J. L. MacManus-Driscoll, ZnO – nanostructures, defects, and devices, Mater. Today, 2007, 10, 40–48 CrossRef CAS.
- L. Kukreja, S. Barik and P. Misra, Variable band gap ZnO nanostructures grown by pulsed laser deposition, J. Cryst. Growth, 2004, 268, 531–535 CrossRef CAS.
- M. M. El-Nahass, H. S. Soliman and A. El-Denglawey, Absorption edge shift, optical conductivity, and energy loss function of nano thermal-evaporated N-type anatase TiO2 films, Appl. Phys. A: Mater. Sci. Process., 2016, 122, 1–10 CrossRef.
- L.-M. P. Zhudong Hu, Q. Chen, Z. Li and Y. Yu, Large-Scale and Rapid Synthesis of Ultralong ZnO Nanowire Films via Anodization, J. Phys. Chem. C, 2010, 114, 881–889 Search PubMed.
- X. Wu, G. Lu, C. Li and G. Shi, Room-temperature fabrication of highly oriented ZnO nanoneedle arrays by anodization of zinc foil, Nanotechnology, 2006, 17, 4936–4940 CrossRef CAS.
- G. S. Huang, X. L. Wu, Y. C. Cheng, J. C. Shen, A. P. Huang and P. K. Chu, Fabrication and characterization of anodic ZnO nanoparticles, Appl. Phys. A: Mater. Sci. Process., 2006, 86, 463–467 CrossRef.
- G. R. Li, T. Hu, G. L. Pan, T. Y. Yan, X. P. Gao and H. Y. Zhu, Morphology – Function Relationship of ZnO: Polar Planes, Oxygen Vacancies, and Activity, J. Phys. Chem. C, 2008, 112, 11859–11864 CAS.
- A. January, N. V. Kaneva and S. Kliment, Effect of the thickness on photocatalytic performance of ZnO films, Nanosci. Nanotechnol., 2016, 16, 24–26 Search PubMed.
- F. Dufour, S. Pigeot-Remy, O. Durupthy, S. Cassaignon, V. Ruaux, S. Torelli, L. Mariey, F. Mauge and C. Chaneac, Morphological control of TiO2 anatase nanoparticles: What is the good surface property to obtain efficient photocatalysts?, Appl. Catal., B, 2015, 174–175, 350–360 CrossRef CAS.
- D. O. Miles, P. J. Cameron and D. Mattia, Hierarchical 3D ZnO Nanowire Structures via Fast Anodization of Zinc, J. Mater. Chem. A, 2015, 3, 17569–17577 CAS.
- A. Mclaren, T. Valdes-Solis, G. Li and S. C. Tsang, Shape and size effects of ZnO nanocrystals on photocatalytic activity, J. Am. Chem. Soc., 2009, 131, 12540–12541 CrossRef CAS PubMed.
- R. Boppella, K. Anjaneyulu, P. Basak and S. V. Manorama, Facile synthesis of face oriented ZnO crystals: tunable polar facets and shape induced enhanced photocatalytic performance, J. Phys. Chem. C, 2013, 117, 4597–4605 CAS.
- R. A. Rosenberg, M. Abu Haija, K. Vijayalakshmi, J. Zhou, S. Xu and Z. L. Wang, Depth resolved luminescence from oriented ZnO nanowires, Appl. Phys. Lett., 2009, 95, 2009–2011 Search PubMed.
Footnote |
| † Electronic supplementary information (ESI) available. See DOI: 10.1039/c7cp07984b |
| This journal is © the Owner Societies 2018 |

