
Tannic acid-loaded mesoporous silica for rapid hemostasis and antibacterial activity†
Chengwei
Wang
abc,
Huayi
Zhou
ab,
Haoyi
Niu
ab,
Xiaoyu
Ma
ab,
Yuan
Yuan
 *ac,
Hua
Hong
*ac and
Changsheng
Liu
*ab
*ac,
Hua
Hong
*ac and
Changsheng
Liu
*ab
aKey Laboratory for Ultrafine Materials of Ministry of Education, East China University of Science and Technology, Shanghai 200237, PR China. E-mail: hhong@ecust.edu.cn; yyuan@ecust.edu.cn; liucs@ecust.edu.cn
bEngineering Research Center for Biomedical Materials of Ministry of Education, East China University of Science and Technology, Shanghai 200237, China
cShanghai Wego Biological Technology Co., Ltd, Shanghai 200237, PR China
First published on 10th October 2018
Abstract
Massive blood loss and bacterial infection are major challenges for global public health. In this study, we developed tannic acid (TA)-loaded mesoporous silica (MS) nanoparticles for both hemorrhage control and effective antibacterium via covalent conjugation and electrostatic adsorption. The TA-absorbed MS could significantly relieve hemolysis and facilitate blood contact, therefore efficiently promoting protein adhesion and the contact activation pathway of the coagulation cascade with desirable hemostasis. Comparably, with increasing TAs absorption, the bleeding control and antibacterial performance were improved simultaneously, especially for 15TMS. Hemostasis tests demonstrated that the 15TMS could reduce the hemostatic time by 65% both in vitro and in vivo, with lower blood loss and could exhibit better antibacterial activities against Staphylococcus aureus and Staphylococcus epidermidis as well as promote wound healing. However, the TAs-loaded MS via chemical grafting (15T-g-MS) significantly reduced the surface area of MS, by replacing the Si–OH on the MS, and thus it exhibited worse bleeding control and antibacterial efficacy than 15TMS. Furthermore, all the samples exhibited excellent cell viability. Based on these results, it can be concluded that the 15TMS would be a promising material platform for designing hemostats in more extensive clinical application.
1. Introduction
Uncontrolled hemorrhage caused by severe trauma is the main cause of deaths that usually occur in transportation accident, surgery, or combat.1–3 According to statistics, 15–25% of deaths caused by massive bleeding came from trauma deaths in civilian hospitals and 50% was from combat deaths in the military.1,2,4 Additionally, severe trauma is prone to infection, which can impair the natural healing process and even cause life-threating sepsis.5,6 Therefore, it still maintains a challenge to develop more alternative and effective hemostatic materials for the control of hemorrhage and infection.Some of the inorganic materials, such as mineral zeolite7 or kaolin,8 have already been used as hemostatic materials in a clinical setting, but patients inevitably suffered from thermal injuries and inflammation because of the highly exothermic nature and poor biodegradability of the materials.1,9 Compared with zeolite, mesoporous silica (MS) possesses similar elements and structure, with highly ordered mesopores and a negatively-charged surface.9,10 Meanwhile, MS demonstrated desirable biodegradability and biocompatibility.10,11 Over the past years, MS as a hemostatic agent was successfully developed in our lab, and the in vitro coagulation results showed that this material could achieve effective hemostasis by initiating the intrinsic pathway10,11 and that the hemostatic efficiency of MS was further improved by the granulation process.12,13
Trauma infection is another challenge that is easily encountered in curing and can delay the healing process, and even lead to life-threatening complications.14,15 In this sense, an ideal hemostat material should be bacteriostatic and/or bactericidal when applied to the wound.5,15,16 Based on this concept, various hemostatic agents were developed by loading a bactericide or antibacterial agent, such as an antibiotic, silver ion, and antibacterial peptide, to inhibit wound infection.10,14 Among these, tannic acid (TA), a natural compound present in a variety of plants and fruits, has excellent antibacterial efficiency and has already been approved as a human-use material by the FDA.17–19 The molecular structure of TA contains a central carbohydrate (glucose) core, which is esterified by phenols (galloyl group).20,21 Although the antibacterial mechanism of TA is not clear yet, the presence of a galloyl group (3,4,5-trihydroxybenzoyl group) is considered as the key to its antibacterial activity.22 However, the galloyl group can be easily oxidized in neutral/basic pH,20 and thus may hamper TA antibacterial activity. To solve this issue, different methods have been employed to improve the TA stability and activity.20,23 Inspired by the above reports, MS can be used as a carrier for TA loading because of its stable porous structure, high surface areas, and tunable pore sizes.24,25 Moreover, TA is also biocompatible toward mammalian cells,26 and has low cost and great availability.27 Furthermore, it could be easily coated on a material surface and bind to proteins, antimutagenics, and antioxidants.27,28
Herein, we endeavored to examine the possibility of utilizing TA-loaded MS as an antibacterial and hemostasis agent. We took advantage of both MS and TA to obtain a highly effective hemostasis via covalent conjugation and electrostatic adsorption (Scheme 1). Specifically, MS as the carrier and activator component can provide excellent absorption and an efficient activation of coagulation factors. TA as an antibacterial agent and “molecule glue” can provide excellent antibacterial properties and plasma protein crosslinking. The potential of the compound powder as topical hemostatic agents was evaluated in terms of their morphology, physicochemical properties, in vitro antibacterial performance, plasma contact, clotting time, PT, and aPTT, as well as hemostatic efficacy in a rat-tail amputation model of severe extremity hemorrhage in vivo. We also confirmed the safety and biocompatibility of the materials via live/dead staining and hemolysis examination.
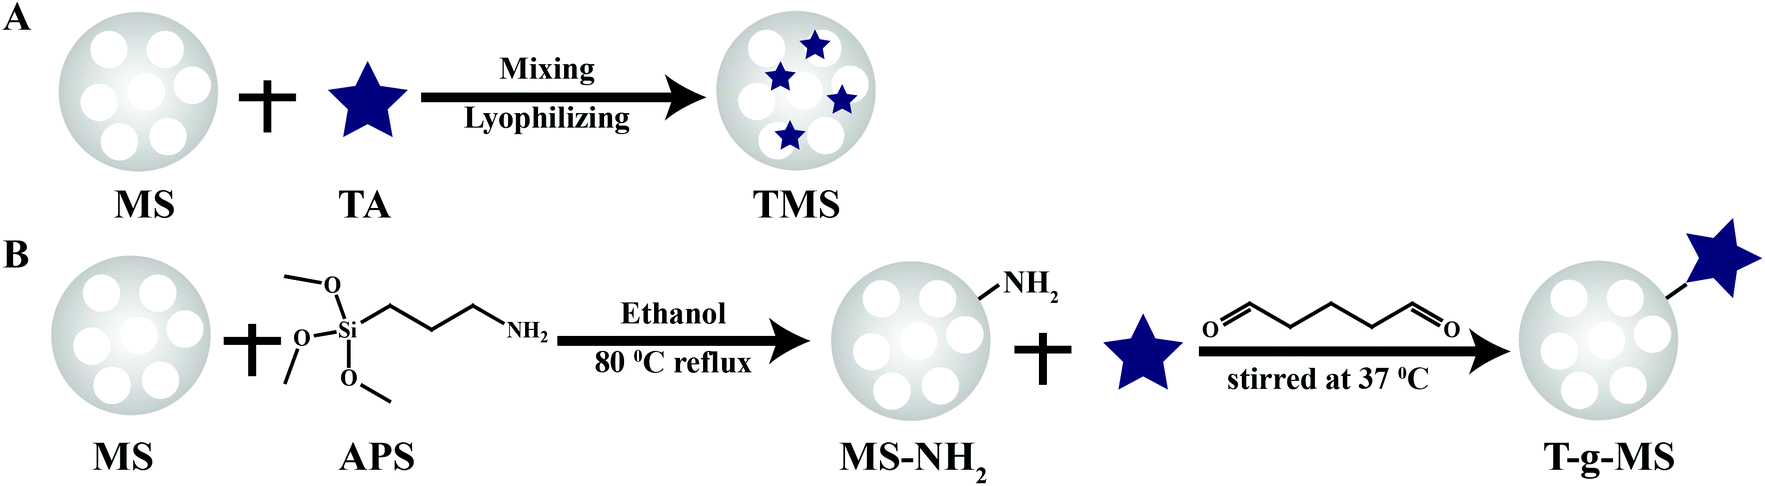 | ||
| Scheme 1 Schematic diagram for the preparation of TA-loaded samples. (A) TMS prepared by simple physical adsorption. (B) T-g-MS as-synthesized utilizing glutaric dialdehyde to crosslink the amino group of MS-NH2 and the hydroxyl group of TA. | ||
2. Results and discussion
2.1 Preparation of TA-loaded MS
As a comparison, TA was loaded onto MS by chemical grafting and physical absorption, respectively. For chemical grafting, the amino-functionalized MS (MS-NH2) and TA were mixed in water, linked by glutaraldehyde, and named 15T-g-MS. After grafting, the color of 15T-g-MS changed from white to yellow, which was consistent with the previous reports (Fig. 1A).32 For physical absorption, TA and MS were mixed in water, stirred for the set time, and collected by lyophilizing, and named 5TMS/15TMS, where 5 and 15 represent the theoretical percentages of TA loaded on the samples.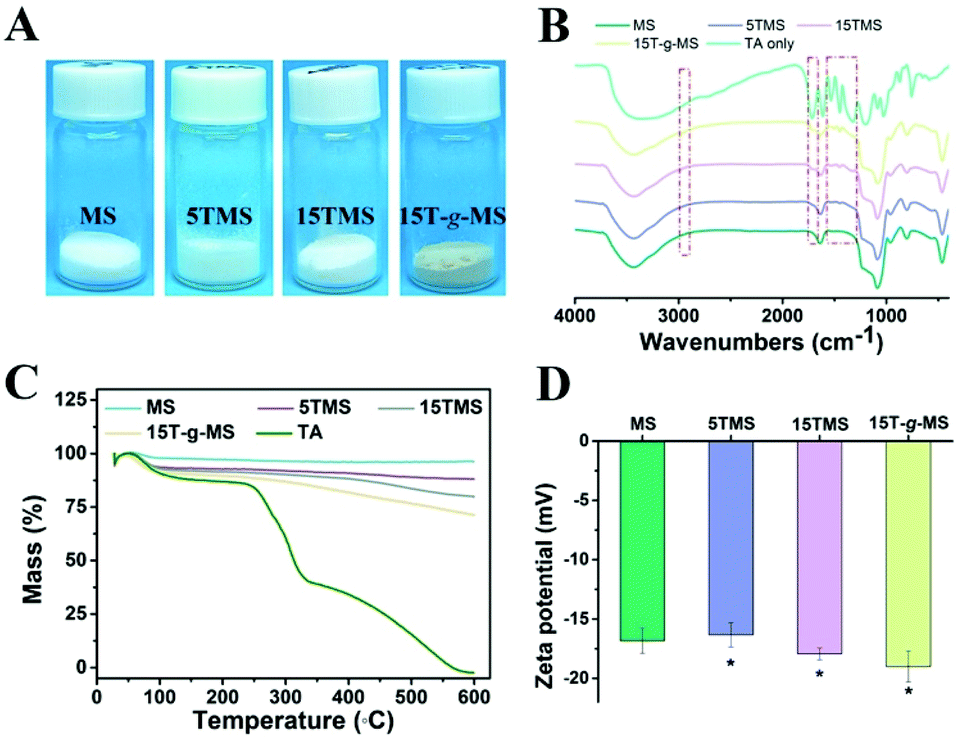 | ||
| Fig. 1 (A) Photograph of the prepared samples. (B) FTIR spectrum of the samples. (C) TG characterization of the samples. (D) Zeta potential of the samples (*, P < 0.05). | ||
The successful functionalization of MS was confirmed by FTIR spectra. As shown in Fig. 1B, MS displayed a typical FTIR spectrum of mesoporous silica. The peaks at 3445 cm−1 and 1634 cm−1 were assigned to vibrations of the hydrogen bond of silanols n(–Si–OH) and n(–OH) of physisorbed water molecules. The peaks of Si–O–Si asymmetric stretching vibration, symmetric stretching vibration, and bending vibration were observed at 1084, 800, and 465 cm−1. The peak at 972 cm−1 was attributed to n(–Si–OH) of free silanols.29 In the FTIR spectrum of TA, a characteristic peak at 1716 cm−1 was apparent, due to the stretching vibrations of C–O (carboxylic ester) groups, while the peaks at 1612, 1534, and 1447 cm−1 were consistent with aromatic C–C stretches.19,42 For 5TMS/15TMS, the characteristic peaks of TA could be observed at 1716, 1534, and 1447 cm−1, which suggests the successful deposition of TA on the MS nanoparticles. For 15T-g-MS, a peak at 2930 cm−1 appeared, corresponding to n(–CH2–) stretching spectra, which was attributed to n(–CH2–) of APS (Fig. S1†). After GA linking, the same characteristic peaks appeared and were slightly stronger than for physical absorption.
The amounts of TA loaded on the surface of MS were confirmed by TG analysis under airflow. The weight loss from TG curves is demonstrated in Fig. 1C. The weight loss of MS was 3.3% between 20 °C and 118 °C, which was attributed to the loss of absorbed water. Other samples showed two-stage weight losses. The first was between 20 °C and 118 °C with about 6.9%, 8%, and 9.6% weight loss, which correspond to the loss of absorbed and bonded water in 5TMS, 15TMS, and 15T-g-MS, respectively. The second stage ranging from about 240 °C and 600 °C showed 4.6%, 11.2%, and 17.5% weight losses of the samples, respectively. This can be attributed to the oxidative degradation of TA loaded on MS. It has to be noted that part of the weight loss of 15T-g-MS was attributed to the oxidative degradation of APS grafted on MS, which was about 6.0% (Fig. S2†). The amount of TA loaded on MS was about 11.5%, close to the saturated mass grafting percentage of TA, as confirmed by TG (Fig. S2†). The TG analysis supported that a similar TA mass was loaded on MS by physical absorption and chemical grafting.
Then, the electrophoretic mobility analysis was used to measure the surface charge (zeta potential) of the samples (Fig. 1D). It can be observed that the zeta potential of the MS was −16.83 mV. After TA absorption, the zeta potentials of 5TMS and 15TMS were −16.33 mV and −17.93 mV, respectively, with no significant change. For 15T-g-MS, compared with the charge of the amino-functionalized MS (Fig. S3†), the surface charge significantly turned to −19 mV.
Fig. 2 shows the N2 adsorption/desorption isotherms and pore-size distributions of MS before and after TA was loaded. The samples of MS, 5TMS, and 15TMS revealed typical IV hysteresis loops, indicating rod-like pores in these mesoporous nanoparticles. The sharp capillary condensations in the range of relative pressure of 0.2–0.4 suggested a uniform pore-size distribution. The BET surface areas (SBET) of MS was 767 m2 g−1 and the pore volume (VP) was 0.551 cm3 g−1. Meanwhile, after TA was loaded by physical absorbing, the SBET and VP of 5TMS and 15TMS decreased to 642 m2 g−1 and 0.416 cm3 g−1 as well as 509 m2 g−1 and 0.365 cm3 g−1, respectively (Table 1). Comparatively, the SBET and VP of 15T-g-MS decreased dramatically to 65 m2 g−1 and 0.094 cm3 g−1 (Table 1). We think this might be caused by the closure of MS pores in the process of TA grafting, which was confirmed by TEM (Fig. 3D). The BJH pore diameter of 15T-g-MS really reflect the gap between the nanoparticles of 15T-g-MS because of the pore seal. From the above results, it can be concluded that there was a decrease in SBET and VP of the samples by both TA physical absorbing and chemical grafting. However, there was a more significant change on 15T-g-MS than on 15TMS. The difference between 15TMS and 15T-g-MS lies in the following respects: first, in the process of TA grafting, whereby MS was first functionalized with APS, which led to a partial decrease of SBET (Fig. S4†); second, the TA grafting layer of 15T-g-MS was more compact than the physical absorbing layer of 15TMS, which was confirmed by TEM (Fig. 3). The TEM results also showed that the loading or grafting of TA did not lead to the change of the ordered degree of MS.
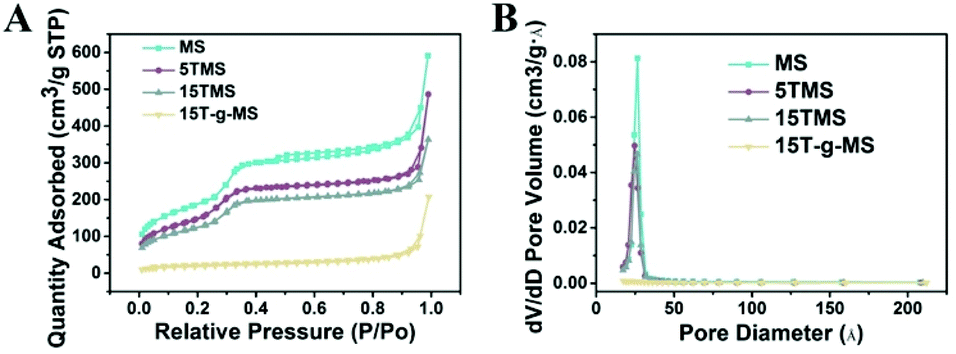 | ||
| Fig. 2 (A) N2 adsorption/desorption isotherms of the samples. (B) The corresponding pore-size distribution of the samples. | ||
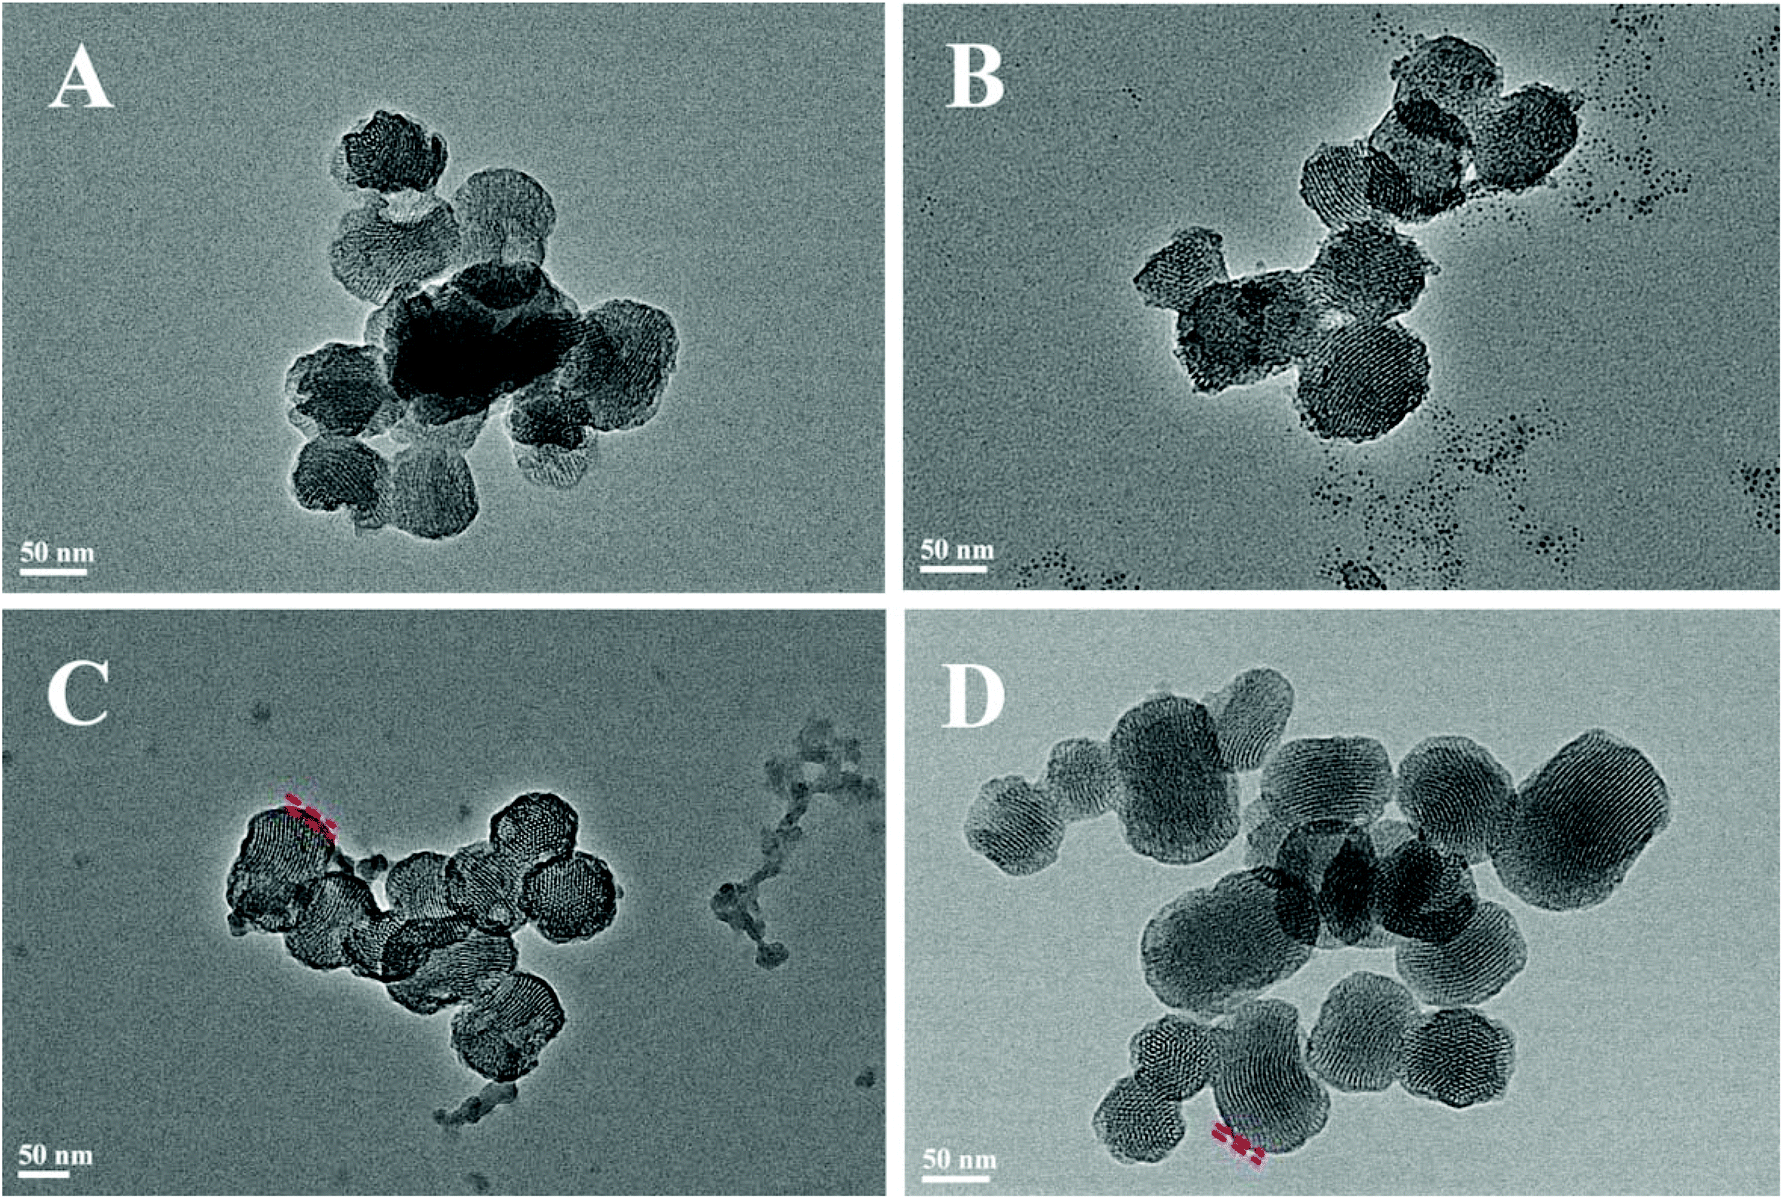 | ||
| Fig. 3 Characterization of the samples: (A) MS, (B) 5TMS, (C) 15TMS, (D) 15T-g-MS. | ||
| BET surface area (m2 g−1) | Pore volume (cm3 g−1) | Pore size (Å) | |
|---|---|---|---|
| MS | 767 | 0.551 | 36 |
| 5TMS | 642 | 0.416 | 50 |
| 15TMS | 509 | 0.365 | 45 |
| 15T-g-MS | 65 | 0.094 | 231 |
2.2 In vitro TA-release and functionality of BSA
The release profiles of the TA-loaded samples were measured in 0.01 M phosphate-buffered saline (PBS) solution with or without BSA at pH 5.0, 7.4, 9.0. As shown in Fig. 4A, in pure PBS solution, almost 100% TA was released in 5TMS and 15TMS at all pHs in 2 h, while almost no release of TA was observed in 15T-g-MS. In contrast, when the samples were immersed in PBS with BSA at different pHs (Fig. 4B), the release of TA in 5TMS decreased with the increasing pH, reaching 35.6% at pH 5.0, 11.6% at pH 7.4, and 2.3% at pH 9.0 in 24 h, respectively; the releasing percentage of TA in 15TMS exhibited the same trend as that of 5TMS, with about 48.9%, 23.2%, and 10.5% at pH 5.0, 7.4, and 9.0 in 24 h, respectively. But, similar to 15T-g-MS in pure PBS, almost no TA was released from 15T-g-MS within the pH range 5.0–9.0. From the above results, it can be inferred that TA release from 5TMS and 15TMS was pH-dependent in the presence of BSA protein. In acidic pH, the amino group of BSA and hydroxyl group of TAs in NH3+ and OH2+ forms were closely associated with positive charges, presenting a repulsive force, and causing more TA to be released at pH 5 for 5TMS and 15TMS. With the increase of pH, the protonation weakened, thus the release of TA decreased.33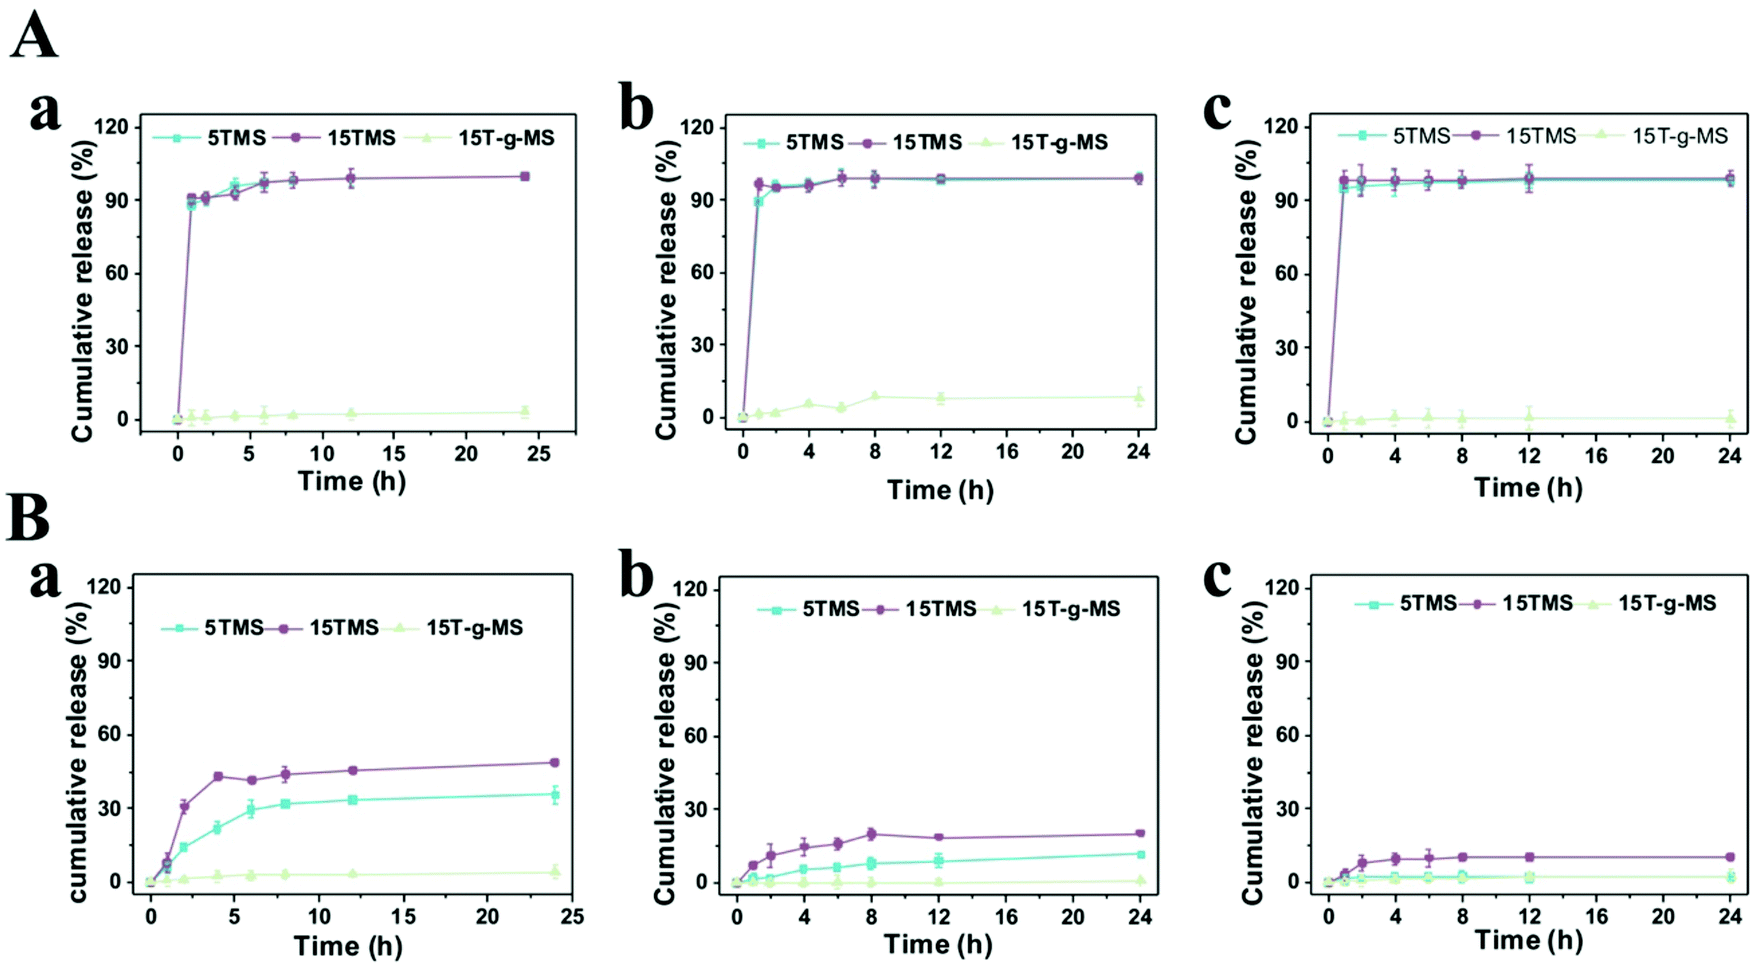 | ||
| Fig. 4 (A) TA release profile of TMS in pure PBS. (B) TA release profile of TMS in BSA PBS solution. (a) pH 5.0. (b) pH 7.4. (c) pH 9.0. | ||
The above results indicated that the BSA adsorption layer exerted an effect on TA release at different pHs. To further confirm the function of BSA, all the samples were collected after drug release at different pHs, and observed by TEM, as shown in Fig. 5A–C. The protein corona of MS and 15T-g-MS were not obviously varied with the increase in pH, while for 5TMS and 15TMS, the protein corona significantly increased with the increasing pH. Furthermore, it can be confirmed that the protein corona was not evidently changed between samples at pH 5.0, but at pH 7.4 and pH 9.0, the protein corona was significantly improved with the increase in mass loading of TA in the samples. However, 15T-g-MS, with the same mass loading of TA as 15TMS had a slightly smaller decrease than 15TMS. Meanwhile, the adsorption of BSA was measured by the Bradford method at pH 7.4. As shown in Fig. 5D, the capacity of BSA absorption was increased with the increase in TA loading, and slightly decreased in 15T-g-MS, which was similar to the TEM results at pH 7.4. As mentioned above, the TA grafting layer was relatively compact, and thus the TA molecules were confined to the surface of MS and were difficult to release. Consequently, all of the TA molecules were not available for further interaction with BSA by hydrogel bonds. Comparably, the TA adsorbed onto 15TMS exhibited a better adsorption capacity toward the BSA than the other groups. It could be concluded that 15TMS could have a great ability to absorb plasma protein.
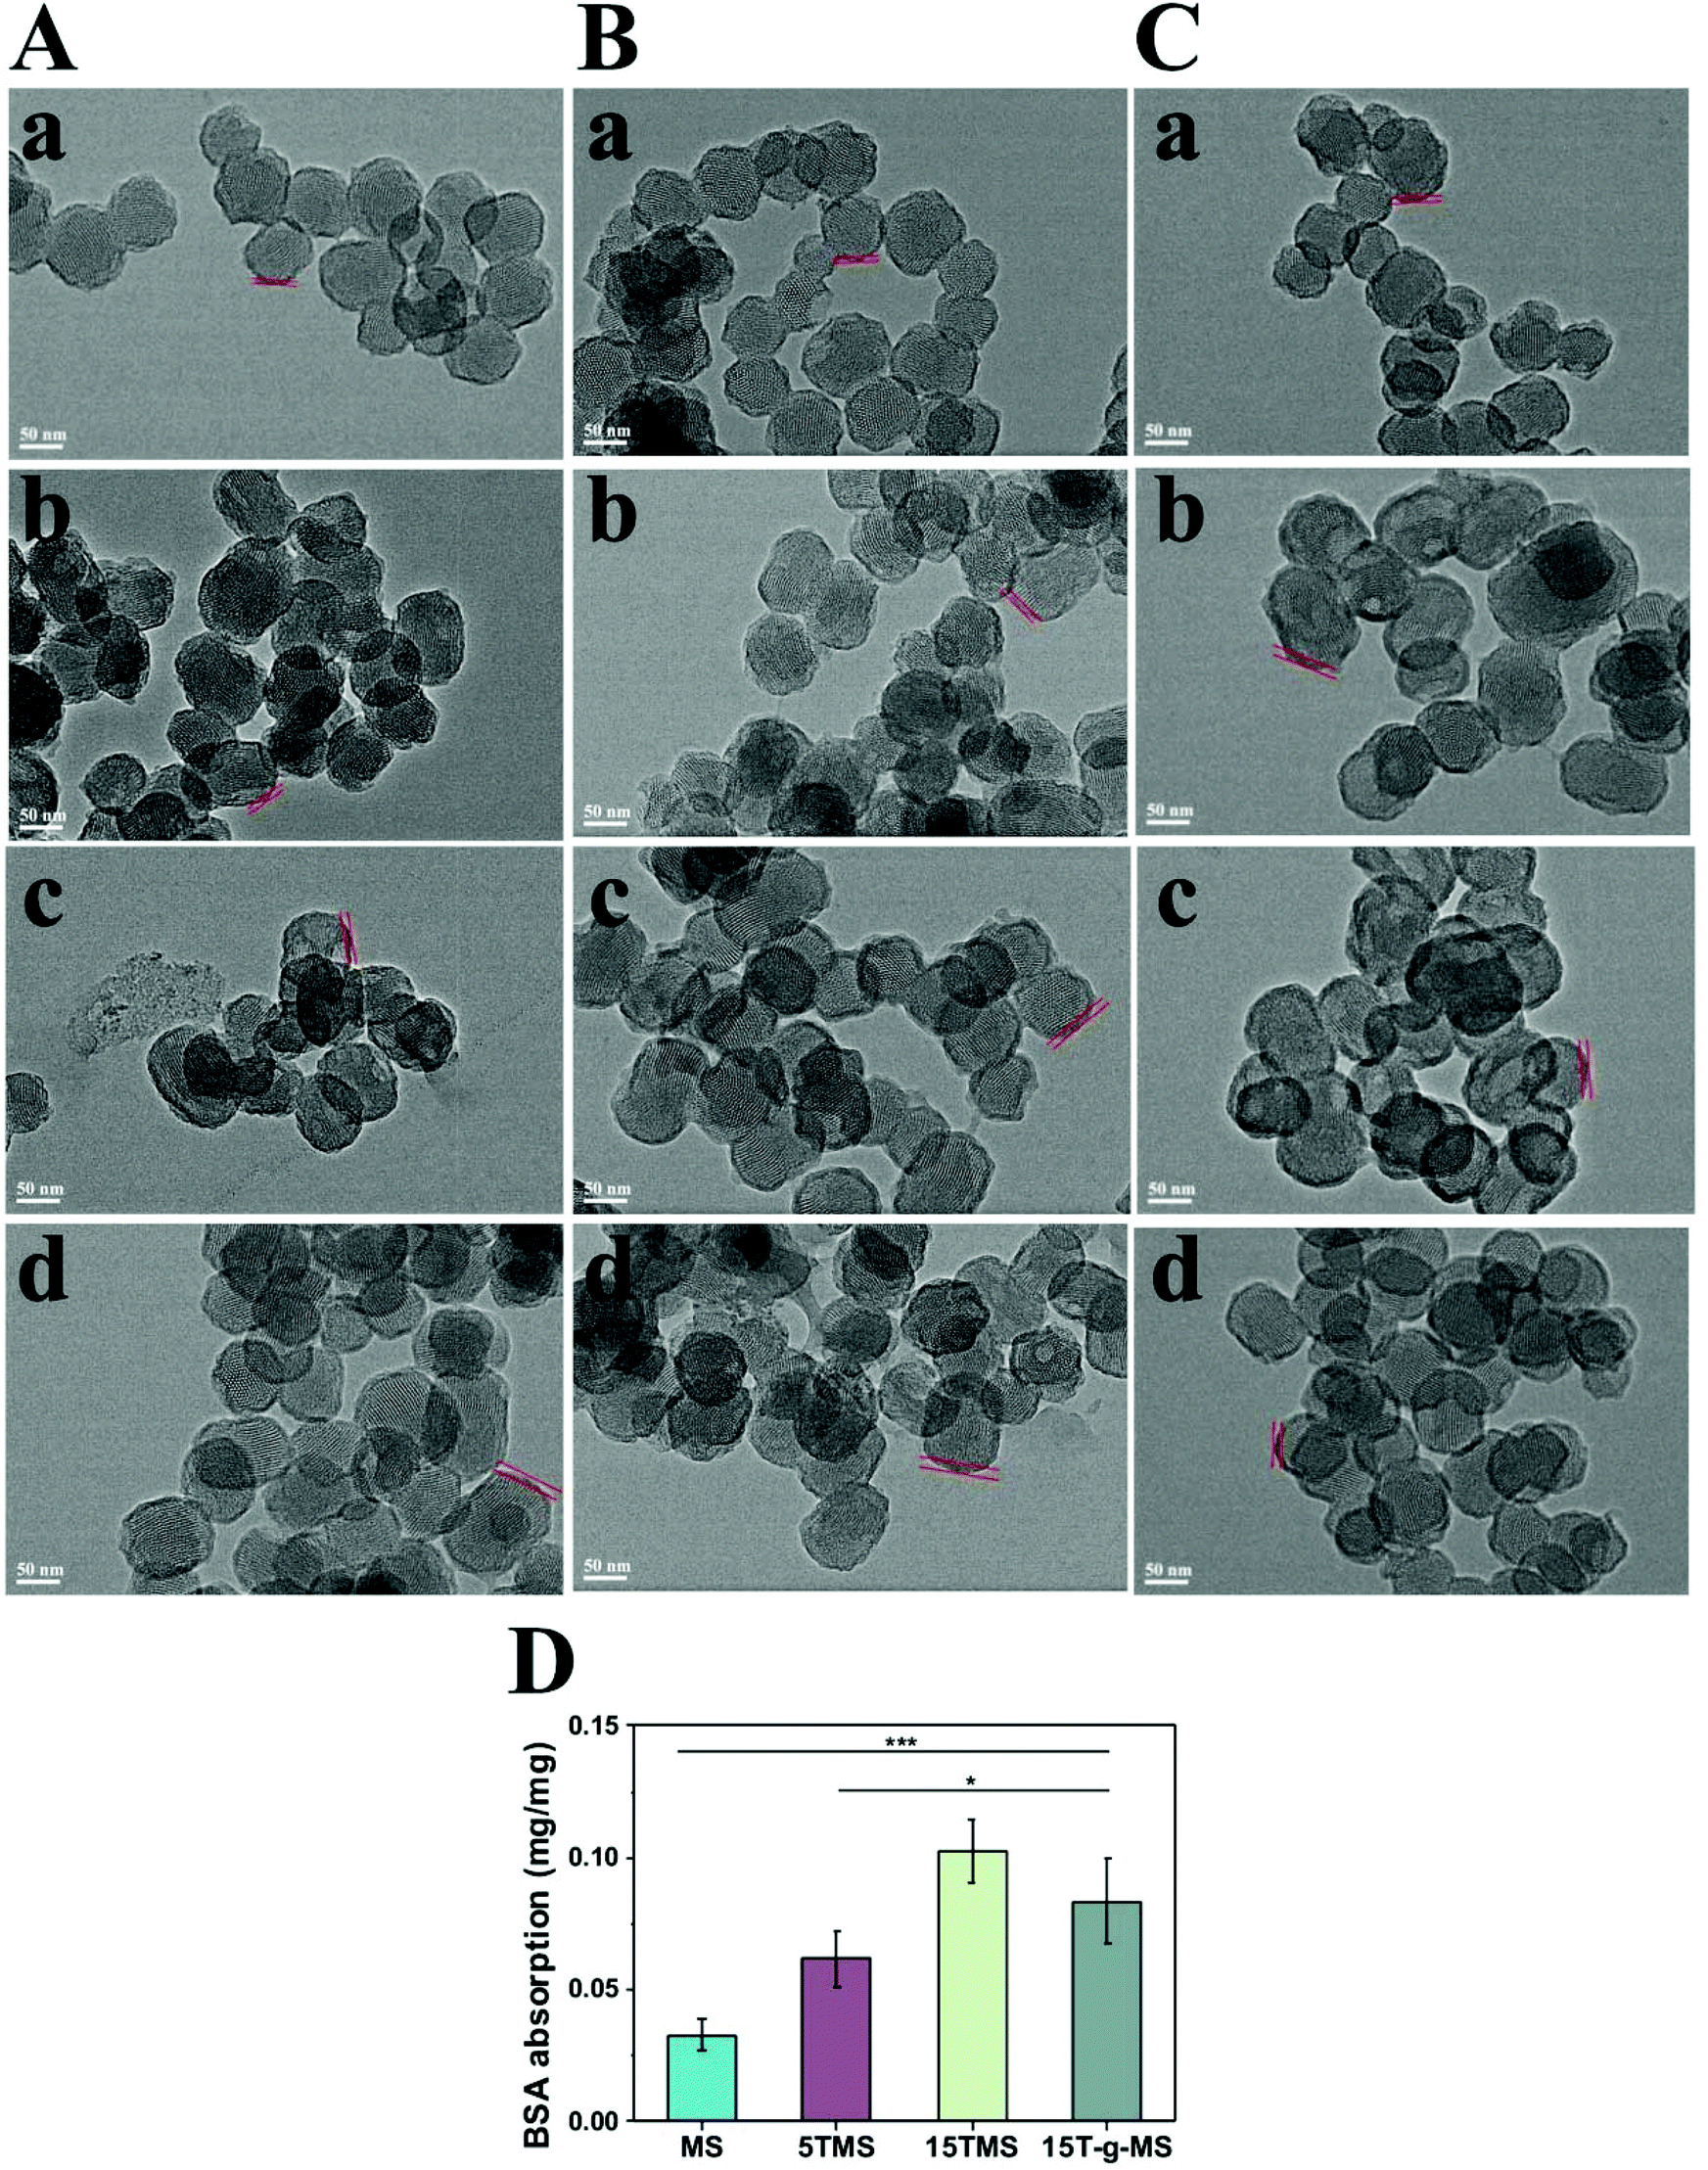 | ||
| Fig. 5 TEM characterization of BSA absorption: (A) pH 5.0, (B) pH 7.4, (C) pH 9.0, (a) MS, (b) 5TMS, (c) 15TMS, (d) 15T-g-MS. D Bradford method for BSA absorption (*, p < 0.05; ***, p < 0.001). | ||
2.3 Hemolysis and plasma contact efficiency
Hemostat should not cause hemolysis and should provide efficient contact in the treatment of bleeding trauma. Herein, a hemolysis assay was performed as an easy and trustworthy approach to evaluate blood compatibility of the materials.43Fig. 6A shows the hemolysis ratios of MS (25.47 ± 1.87%), 5TMS (25.47 ± 1.82%), 15TMS (0.50 ± 0.41%), and 15T-g-MS (0.49 ± 0.72%), respectively. It was found that TA could decrease the hemolysis ratio of MS. This may be explained by the following reason: as in the previous report, TA easily adhered on the surface of material, and was utilized as a crosslinking agent via a layer-by-layer (LbL) assembly.44 In this study, TA could easily adhere on the surface of MS, which reduced the contact between MS and RBC, thus decreasing the hemolysis potential of MS.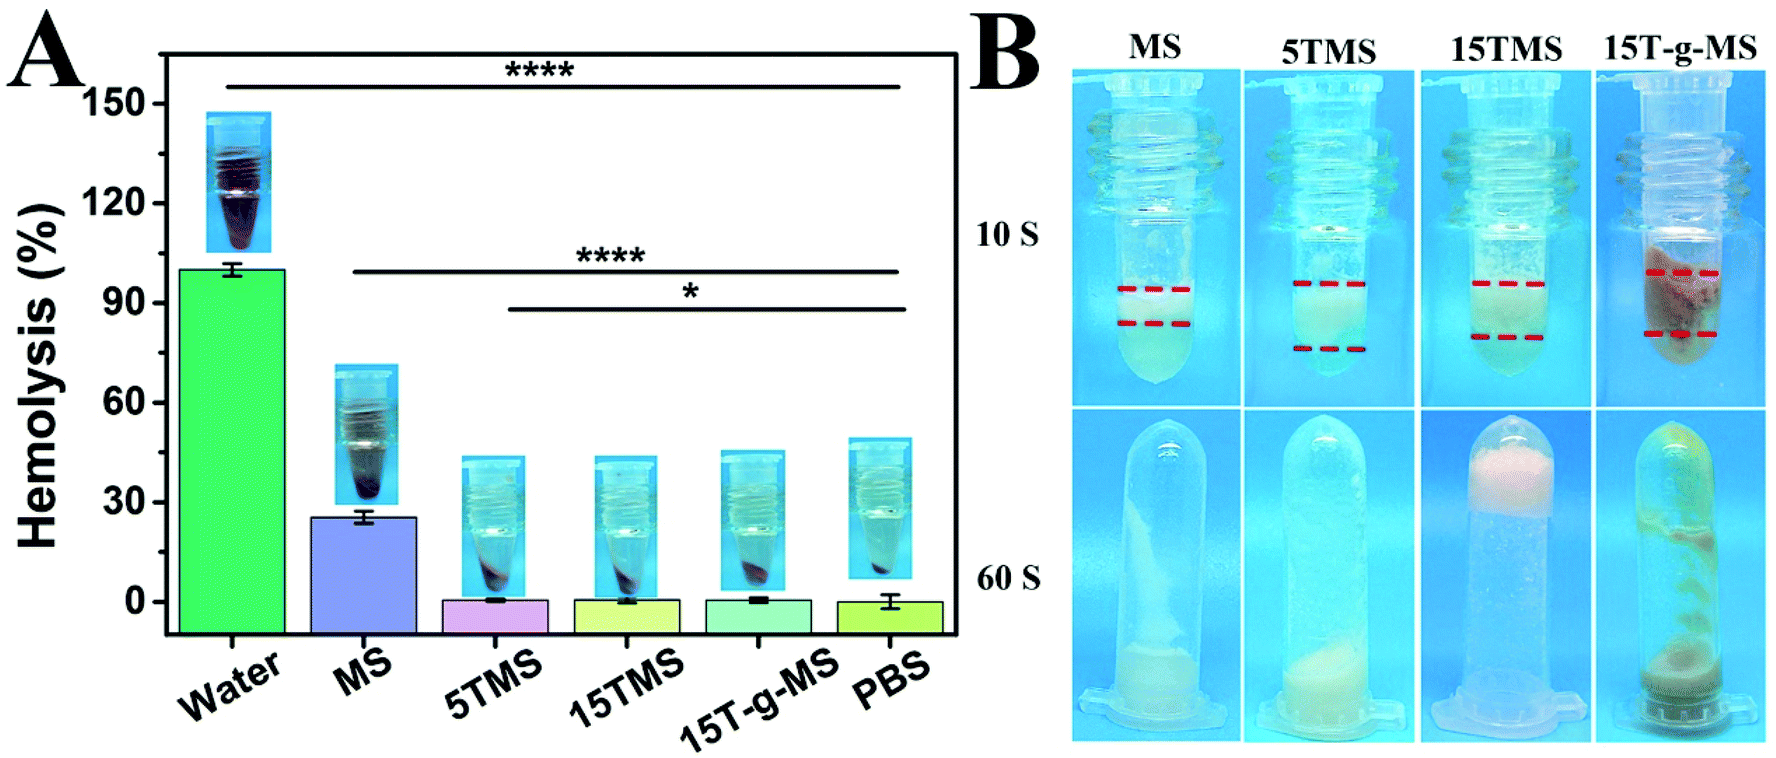 | ||
| Fig. 6 (A) Hemolysis ratio of the samples. (B) Plasma contact efficiency (*, P < 0.05; ****, P < 0.0001). | ||
Contact activation is also an important factor in the process of MS-based hemostatic, thus the contact efficiency of the TA-loaded MS was measured in this study and the results are shown in Fig. 6B. It was found that the contact efficiency of 5TMS, 15TMS, and 15T-g-MS were faster during the contact with plasma than that of pure MS after 10 s. It was noted that only the 15TMS group showed no plasma flowing when the tube was inverted after 60 s. It can be demonstrated that TA loading can accelerate contact efficiency and that the 15TMS group exhibited superior efficiency in stopping plasma flow. TA has a variety of phenolic hydroxyl groups, which can accelerate plasma contact; in other respects, as a protein deposit agent, TA can crosslink with plasma protein by strong physical interaction (hydrogen bond), and form a three-dimensional block to stop plasma flowing. Compared to 5TMS and 15T-g-MS, 15TMS can release more TA than the other two group, which can lead to more extensive physical crosslinking, which are favorable for fast hemostasis.
2.4 In vitro clotting capacity
Contact activation of the blood plasma coagulation cascade by the samples was investigated by aPTT and PT measurements. The experimental results showed that the measured aPTT values of MS, 5TMS, and 15TMS were significantly reduced compared with the negative control, while the aPTT value of 15T-g-MS could not be detected. However, the PT time were not all significantly changed. The great change of 15T-g-MS in aPTT may due to the reduction of the available silanols on the MS surface. As previously reported, MS, in contact with plasma, can lead to the activation of the intrinsic blood coagulation cascade by binding the clotting factor XII to a negatively-charged silanols surface via positively charged amino acids in its chain.8,45 For 15T-g-MS, the natural silanols on the surface of MS were substituted by an amino group of APS in the first modified process. What is more, silanols were also covered by the grafting of TA layer, and the pores of 15T-g-MS were sealed during the grafting process, obstructing the contact between the natural silanol group and coagulation factors.Clotting time (CT) is an intuitive method to evaluate a sample's hemostatic property. As shown in Table 2, the clotting times of MS, 5TMS, and 15TMS were significantly shorter than the blank control (680 ± 70 s). The CT of MS was approximately 336.67 ± 35.12 s and that of 5TMS and 15TMS were within 280 ± 50 s and 233.33 ± 32.15 s, respectively, faster than that of MS. But the CT of 15T-g-MS was more than 1200 s. These results were consistent with aPTT. From the above results, it can be seen that the physisorbed group led to a significant CT decrease. This phenomenon should be related to the quick contact with blood of the TMS and a rapid TA molecular diffusion into blood and then block forming. These results indicate that MS can lead to the activation of the intrinsic blood coagulation cascade.
| Control | MS | 5TMS | 15TMS | 15T-g-MS | |
|---|---|---|---|---|---|
| **, p < 0.01; ***, p < 0.001; significance from the control group. | |||||
| Clotting time (s) | 680 ± 70** | 336.67 ± 35.12** | 280 ± 50** | 233.33 ± 32.15** | >1200 |
| PT (s) | 13.37 ± 0.21 | 12.3 ± 1.39 | 13.43 ± 0.51 | 12.8 ± 0.52 | 11.57 ± 0.74 |
| aPTT (s) | 24.97 ± 2.46*** | 13.2 ± 0.06*** | 13.4 ± 0.20*** | 13.47 ± 0.46*** | — |
2.5 Rat-tail amputation
The in vivo hemostatic efficiency was investigated by rat-tail amputation. As shown in Fig. 7A, half of the rat-tail was cut, and treated with samples or standard gauze (SG) with manual compression. The bleeding time and blood loss before complete hemostasis in the different groups were recorded (Fig. 7C and D). The bleeding time for the SG-treated group was about 410 ± 14 s, and it was then reduced to 290 ± 28 s when MS was applied. Specifically, the 5TMS and 15TMS showed a significant reduction, to about 159.5 ± 13 and 123 ± 22 s, respectively, while the 15T-g-MS group was still about 273 ± 26 s, and the TA-treated group was about 190 ± 14 s. The blood loss of SG group was 1.93 ± 0.09 g and for the test groups of MS, 5TMS, 15TMS, 15T-g-MS, and TA, it was 1.52 ± 0.16 g, 1.30 ± 0.21 g, 1.05 ± 0.13 g, 1.42 ± 0.17 g, and 1.22 ± 0.035 g, respectively, demonstrating that the hemostatic efficacy of TMS used as the positive control was prominent.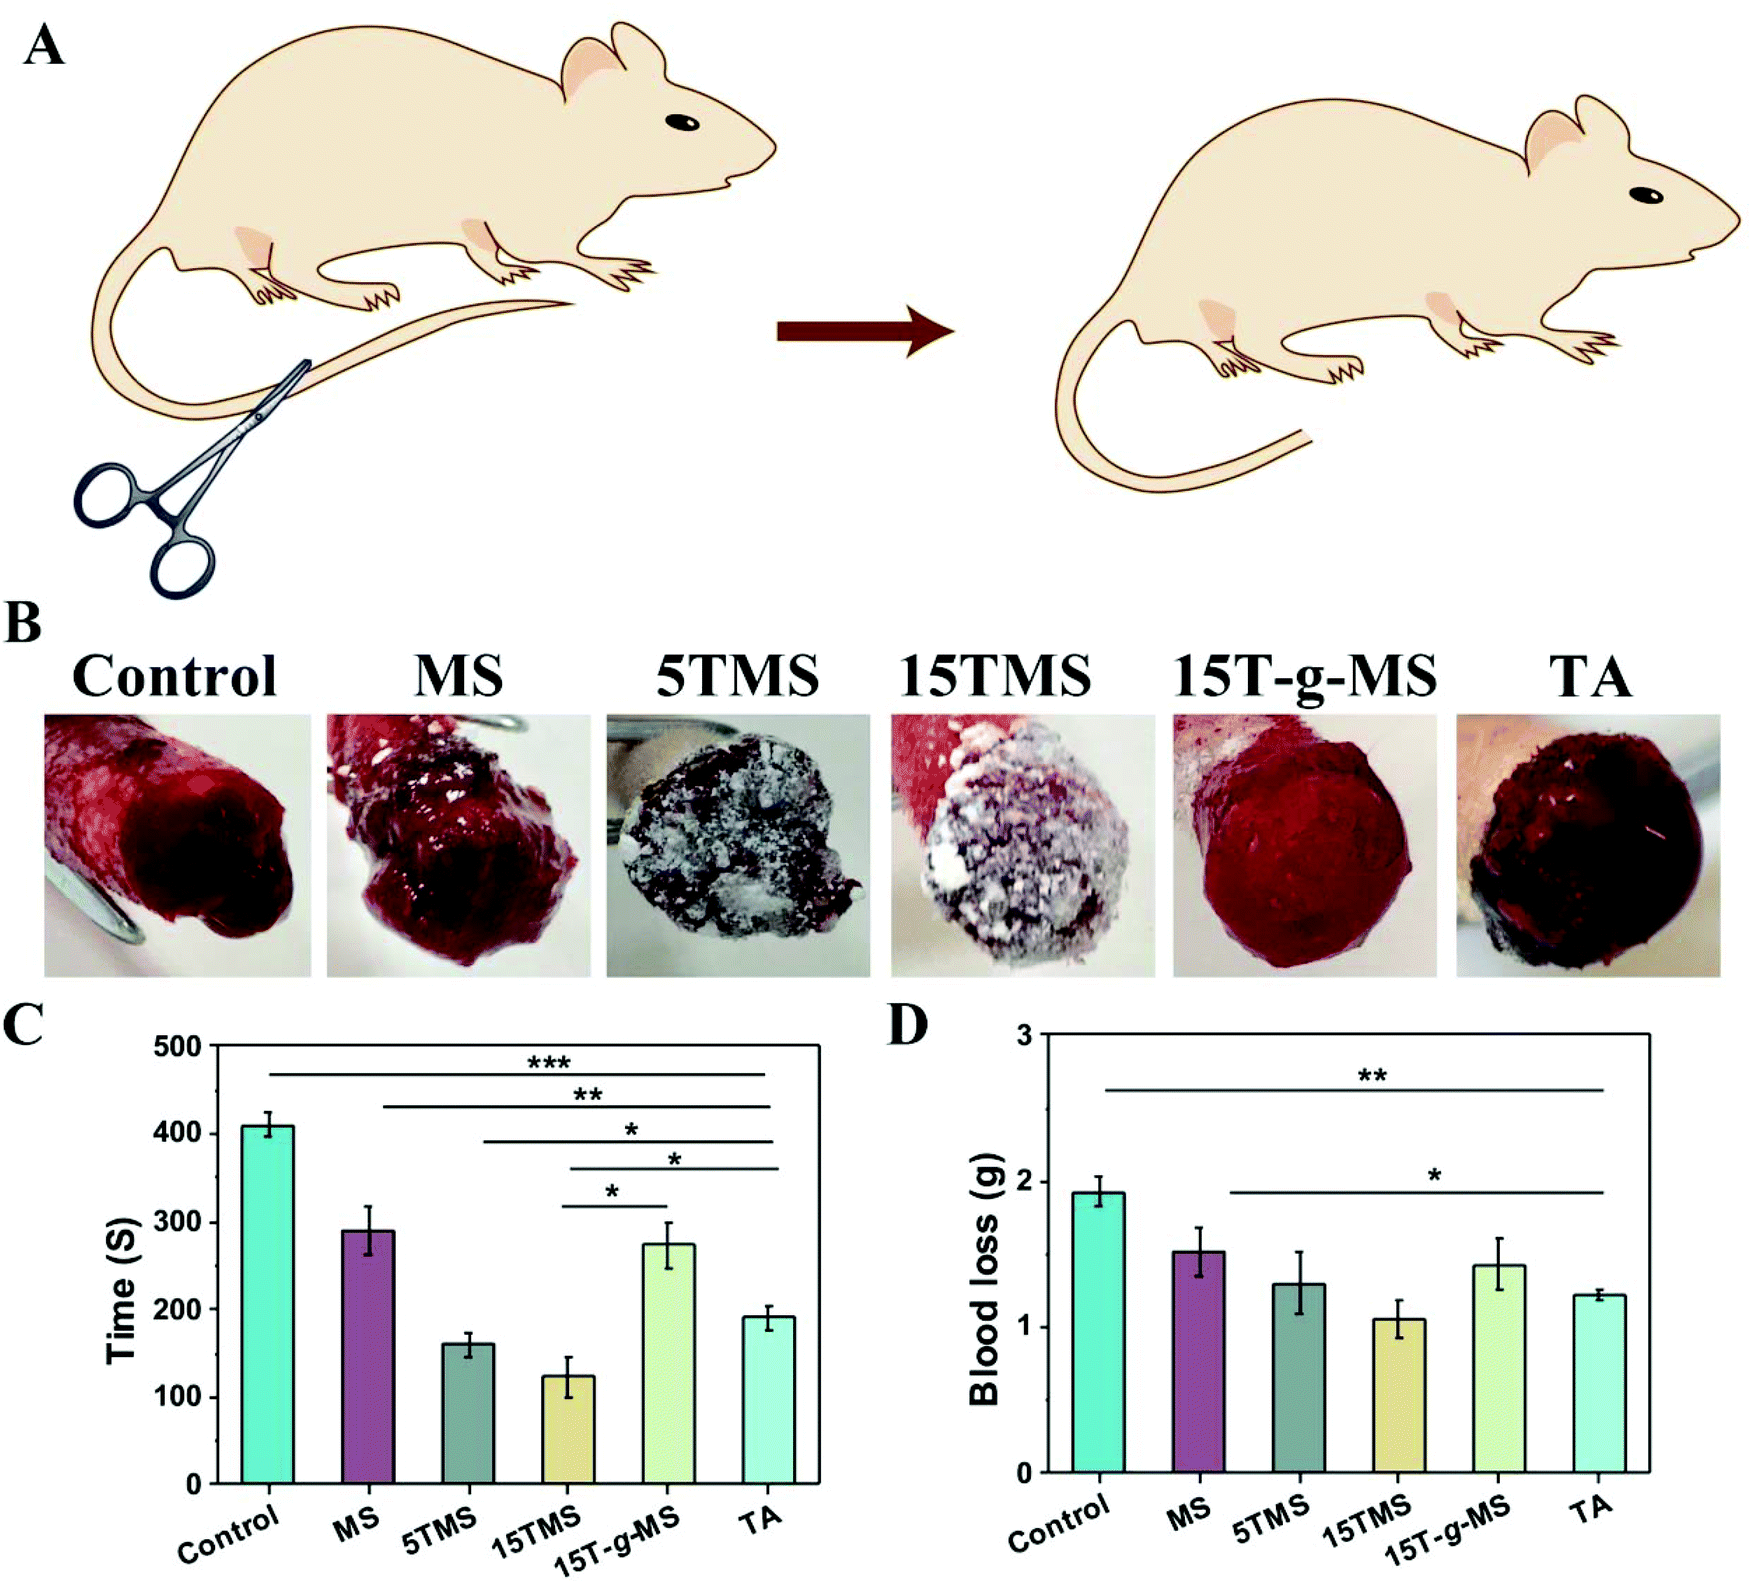 | ||
| Fig. 7 (A) Scheme of the hemostasis trials in the rat tail amputation model. (B) Digital images of the rat tail amputation models when bleeding stopped. (C) Hemostasis time in the rat tail amputation model. (D) Blood loss in the rat amputation model. (*, P < 0.05; **, P < 0.01; ***, P < 0.001). | ||
2.6 Antibacterial property
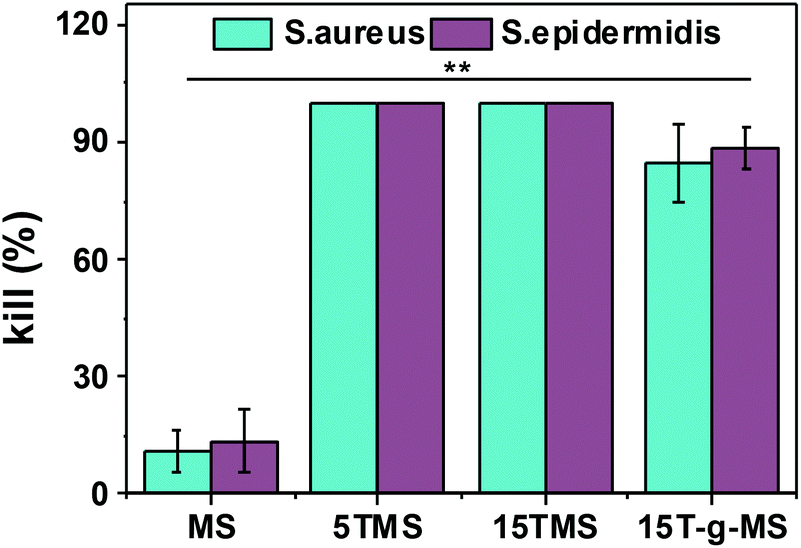
Here, the antibacterial properties were investigated. Different amounts of samples were co-cultured with bacterial for 6 h, then 10 μL co-culture media was pipetted on agar plates for another 18–24 h. From Fig. 8, it can be seen that MS had no influence on the growth of S. aureus and S. epidermidis, while the antibacterial property increased with increasing TA loading. However, 15T-g-MS's antibacterial property decreased significantly. Similar results can be seen in Fig. 9, and it could be confirmed that 5TMS and 15TMS possessed a 99% kill rate, while 15T-g-MS had a decreased rate at about 88%. According to previous reports, TA has better antibacterial behavior,20,22 and affects the expression of proteins involved in the bacterial cell wall/membrane synthesis.46 Compared the antibacterial property of 15TMS and 15T-g-MS, the decreasing antibacterial property of 15T-g-MS was because: first, TA was restricted on the surface of MS by chemical bond, which decreased the contact between TA molecules and the bacterial groups; second, in a previous report, it was shown that the hydroxyphenyl group was of great importance against bacterial groups.22 Herein, part of the phenolic hydroxyl groups was consumed in the process of grafting, leading to a weakening of the antibacterial property. | ||
| Fig. 8 The antibacterial properties images recorded after co-culture 6 h media pipetted on agar plates for 18–24 h. (The numbers in the picture represent the concentration of the sample, unit, mg mL−1). | ||
 | ||
| Fig. 9 Antibacterial activity of TA-loaded MS (**, p < 0.01). | ||
2.7 In vivo wound healing
S. aureus infected full-thickness wounds in vivo were established to determine the anti-infection and its effect on wound healing properties. Here, infected wounds without treatment represented the positive control, uninfected wounds without treatment the negative control, and the infected wounds treated with samples the test groups. The image of wounds at different time points was recorded (Fig. 10A), and the wound closure rate was also collected (Fig. 10B). From the images of the wounds at different time points, it can be confirmed that S. aureus infected full-thickness wounds were established; on day 5, the sizes of the wounds treated with or without samples showed no significant differences; on day 10, the sizes of 15TMS and 15T-g-MS treated group were distinctly smaller than the other groups; on day 15, the size of MS-treated group were not complete closed. Also, the statistics results of the wound closure rates demonstrated that the TA-containing samples promoted wound closure faster than the uninfected without treatment group, infected without treatment, and infected treated with MS. As a comparison, the TA-treatment group was also tested (Fig. S5†), and it could be confirmed that TA promoted wound healing in the earlier stage, but TA slowed up the wound recovering in the later stage. Furthermore, section tissues from the wounds on the rats at day 15 were collected and stained by hematoxylin and eosin (H&E) (Fig. 11). The results demonstrated that the TA-containing group decreased the inflammatory reaction. From the above results, it can be inferred that the TA-containing groups could kill S. aureus and promote wound healing. However, the TA-treated group recovered slowly in the later stage. The dosage of the TA-loaded samples and pure TA were different, as mentioned in previous reports that a high TA dosage can inhibit the collage synthesis and hinder wound healing process,26 which is probably the reason why the TA-treated group recovered slowly in the later stage.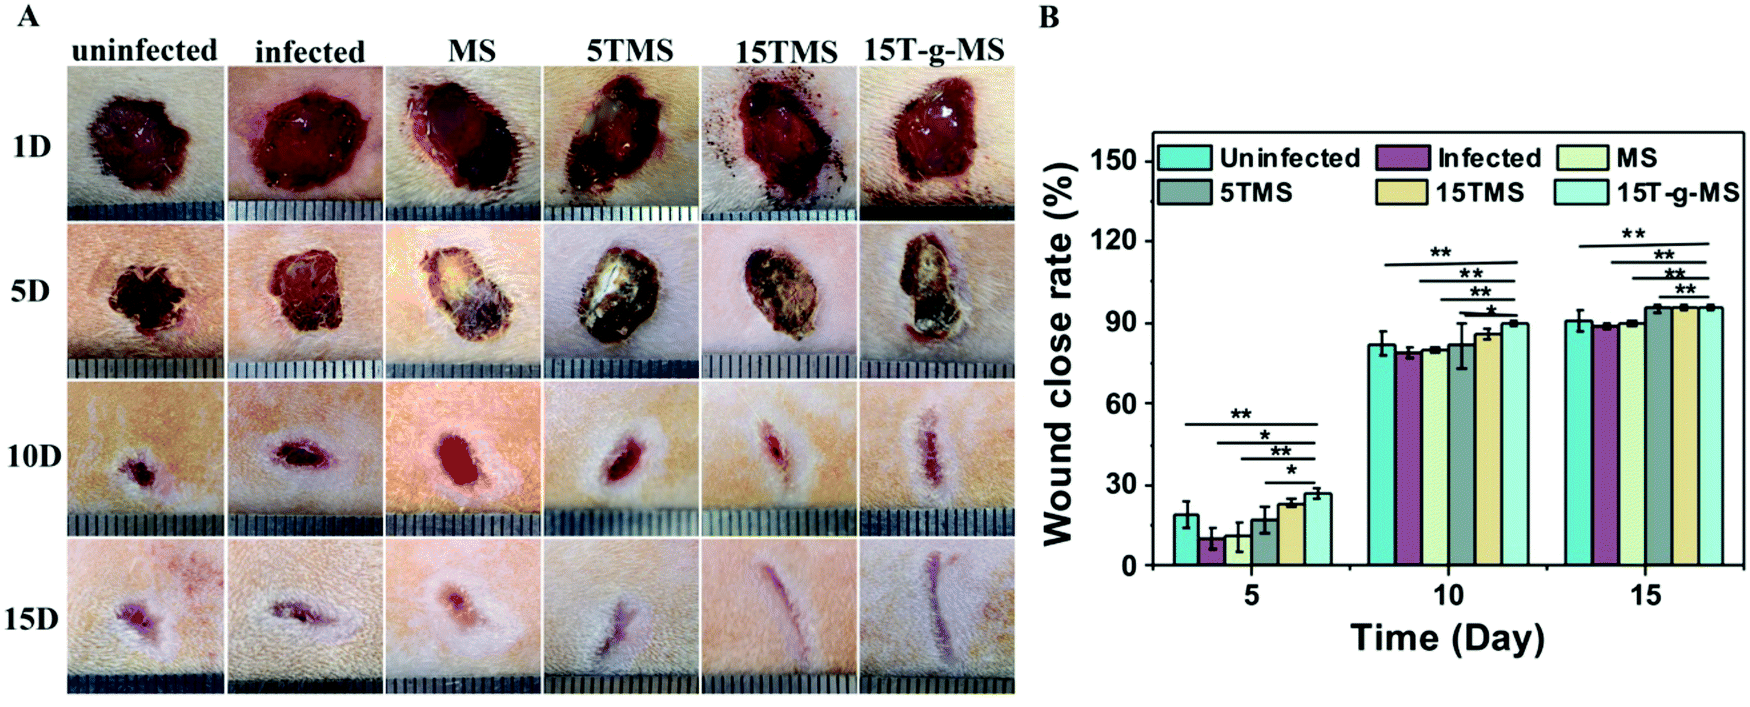 | ||
| Fig. 10 (A) Photographs of the appearance of different wounds on days 1, 5, 10, and 15 postoperation with the treatment of the samples. (B) The wound closure rate of TA treated on different days postoperation (*, P < 0.05; **, P < 0.01). | ||
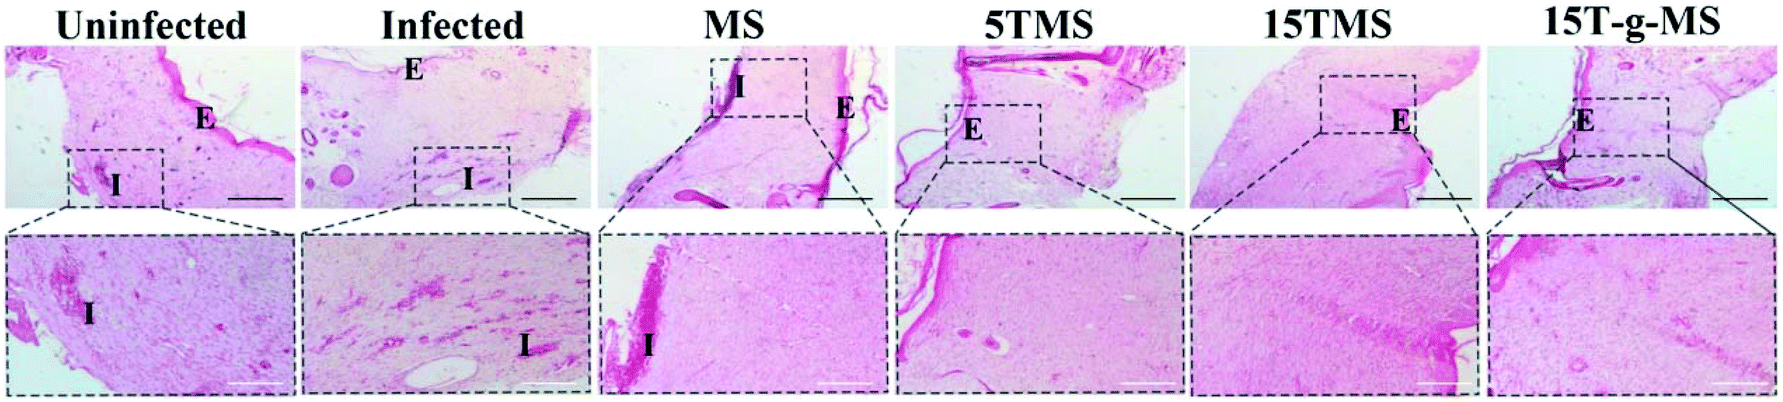 | ||
| Fig. 11 H&E staining of wound tissue (scale bar: black 200 μm; white 100 μm. E, epidermis; I, inflammation). | ||
2.8 Cell viability
To confirm the cytocompatibility of the samples, a live/dead assay was performed and observed via fluorescence microscopy. As shown in Fig. 12, the untreated group exhibited bright green fluorescence, suggesting most cells in the experimental group were alive. Furthermore, the number of dead cells was also demonstrated, and were considered to be in the normal range. The result confirmed that the samples were safe for cells.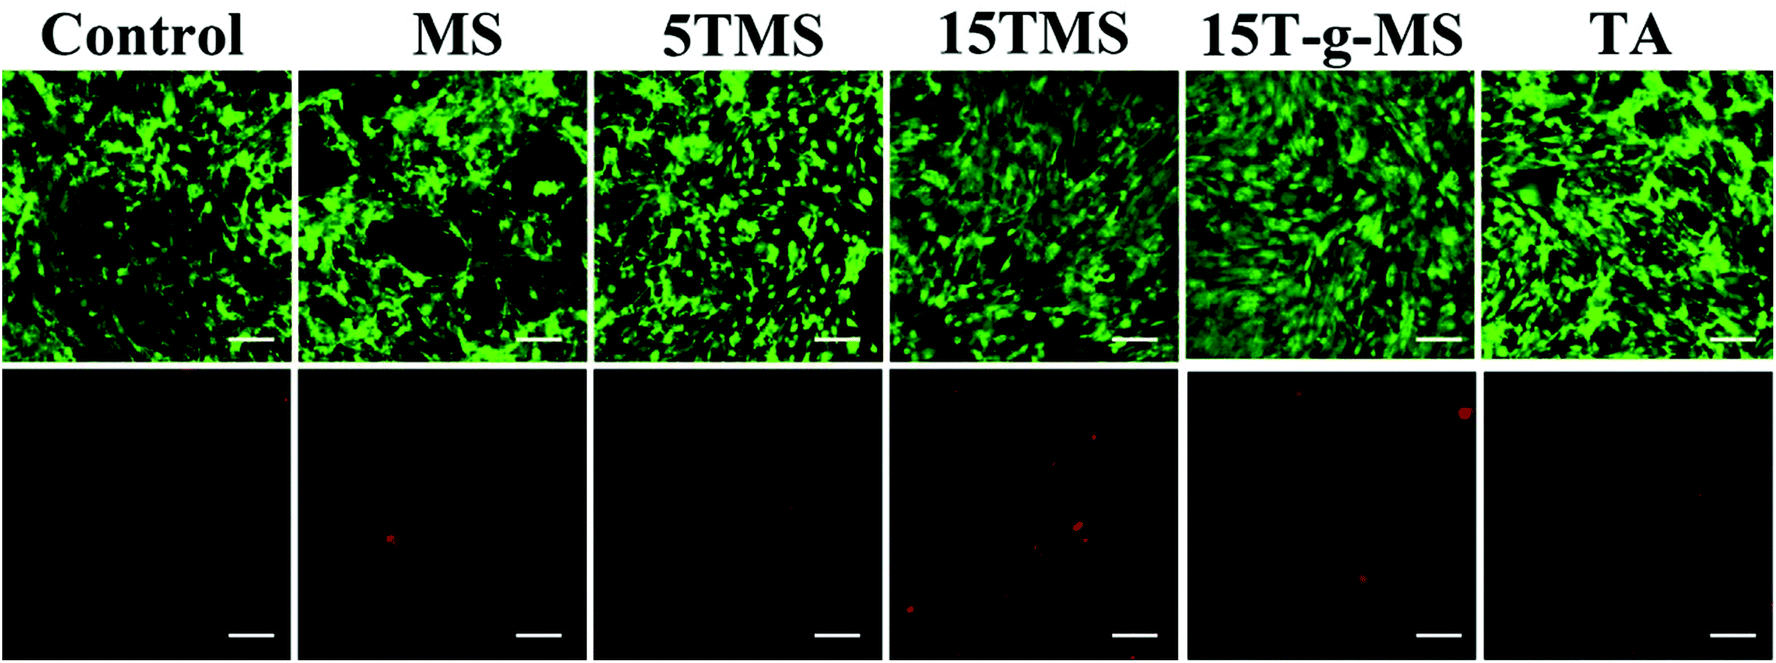 | ||
| Fig. 12 Live/dead cell assay of samples; the upper panels are the live cells showing green fluorescence and lower panels are dead cells showing red fluorescence. (Scale bar, 100 μm). | ||
In summary, the results above proved that the adsorption of TA onto MS could integrate the advantages of both materials and provide efficient hemorrhage control and excellent antibacterial property. Based on the previous reports and the current study findings here, it could be concluded that the superior hemostasis performance of 15TMS was mainly attributed to the following respects: (1) When 15TMS contacted with the wound site, fast blood contact was first strengthened by the hydrophilicity of the TAs. This process was then reinforced by the fluid absorption of MS and accelerated blood concentration. (2) TA, as a protein deposition agent, could be released from 15TMS and crosslinked with plasma protein, improving the ability of protein absorption of MS, and eventually increasing the probability of coagulation factors activation (Scheme 2). Additionally, the physically absorbed TA could be released from TMS and could kill bacterial groups. Moreover, the full-thickness skin infection wound model confirmed that TMS had the capability of anti-infection and could promote wound healing.
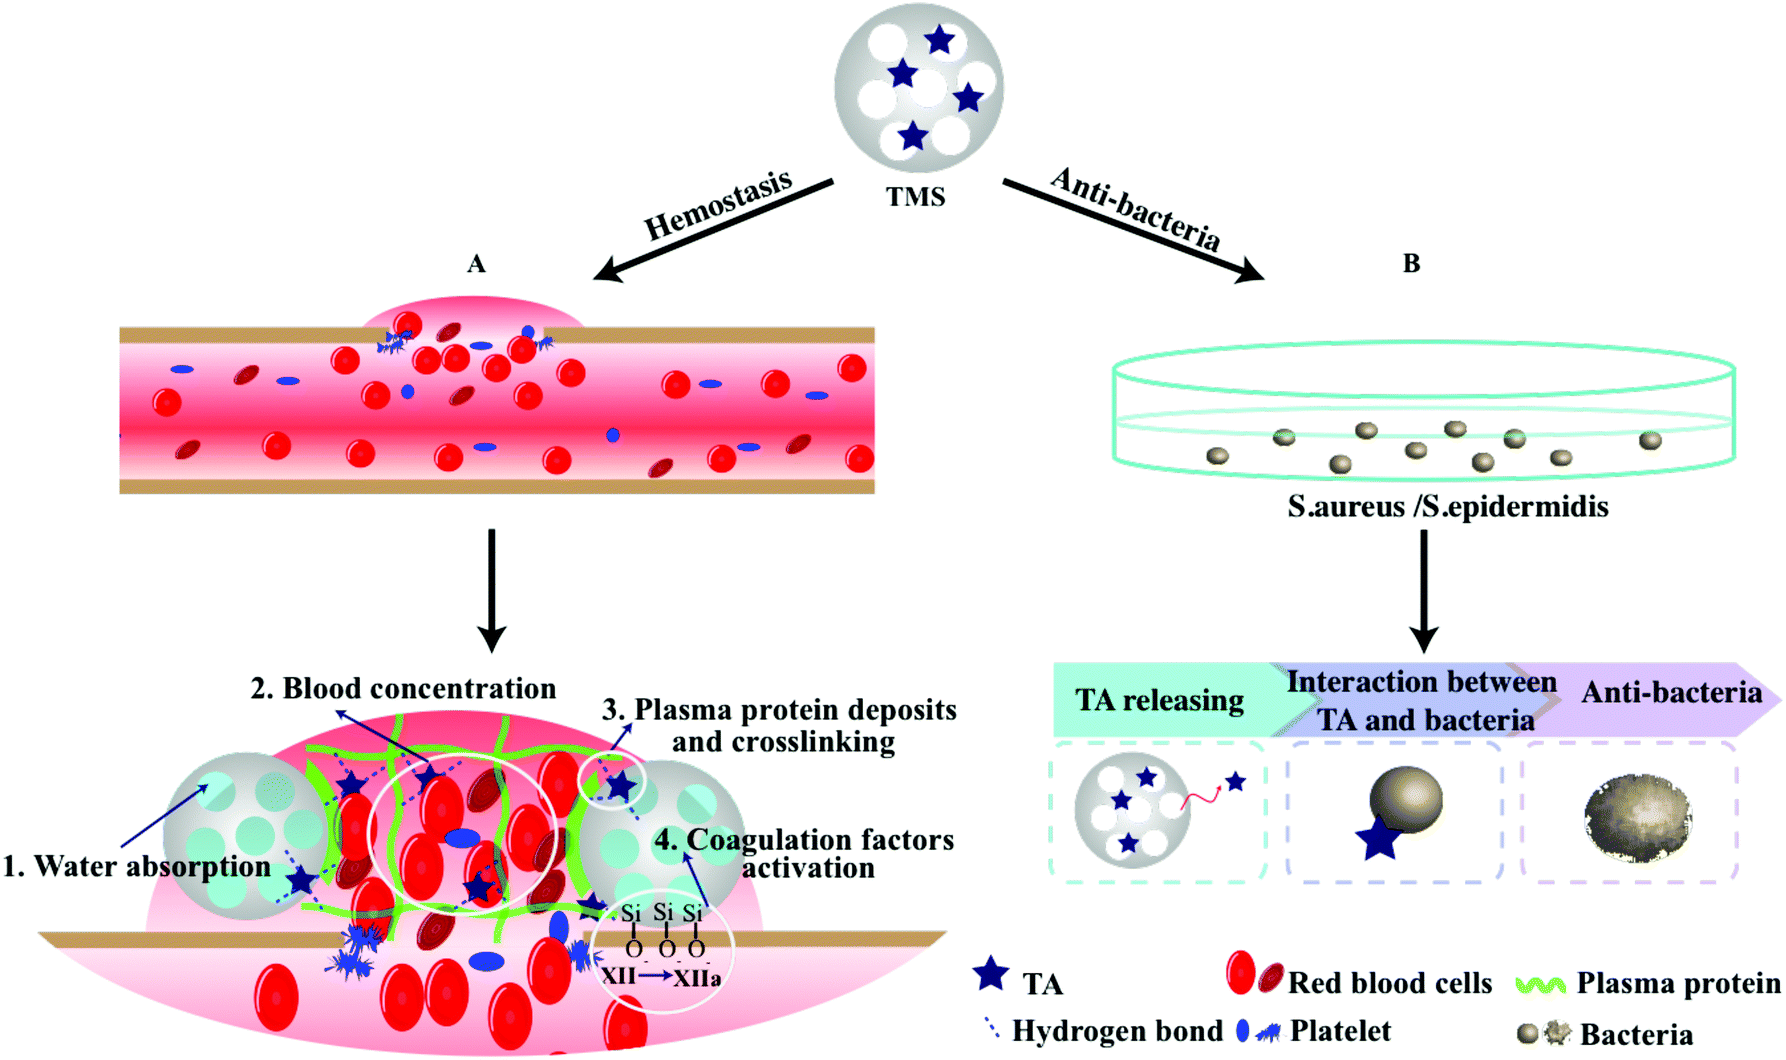 | ||
| Scheme 2 Schematic illustration of the TMS hemostasis process. (A) TMS facilitated rapid blood contact, which caused faster water absorption and blood components concentration, simultaneously. Followed by that, a certain amount of TA was released and further crosslinked with plasma protein, together with the activated coagulation factors by the negative-charged TMS, leading to accelerated clot formation. (B) The molecules of TA were released from TMS and exhibited excellent antibacterial properties. | ||
Furthermore, from the perspective of practical costs, the TMS preparation process is simple and time-saving, without enormous energy consumption and usage of expensive chemicals, compared with 15T-g-MS and other current commercial alternatives. Meanwhile, it is easy to achieve large-scale production without professional training. Thus, this study represents a step forward in the development of hemostatic material with immense clinical and commercial potential.
3. Materials and methods
3.1 Materials
Commercially available chemicals were used as received. Tannic acid was purchased from Aladdin Industrial Co. Ltd (Shanghai China). Cetyltrimethylammonium bromide (CTAB) and tetraethylorthosilicate (TEOS) were purchased from Shanghai Sinopharm Co. Ltd (Shanghai, China) and used for materials preparation. (3-Aminopropyl)-trimethoxysilane (APS) was purchased from Sigma Aldrich Chemicals and adopted as a coupling agent. Deionized water was used throughout this work and all other chemicals were of analytical grade. Standard strains of Staphylococcus aureus (S. aureus, ATCC 25923) and Staphylococcus epidermidis (S. epidermidis, ATCC 49134) were purchased from China General Microbiological Culture Collection Center.3.2 Mesoporous silica synthesis
Ordered mesoporous silica spheres were synthesized by a one-step basic catalyzed self-assembly process. In brief, 1.2 g of CTAB was dissolved in 535 mL water, followed by the addition of 15 mL of concentrated ammonium hydroxide, and the mixture was stirred to clear and heated to 60 °C. Then, 8 mL of TEOS was added slowly to obtain a homogeneous solution, which was stirred vigorously for another 4 h. The product was filtered and washed several times with ethanol and water, and dried at 80 °C overnight. Thereafter, the as-synthesized powder was calcined at 600 °C in air for 6 h at a rate of 1 °C min−1 in order to remove the structure-directing agent completely.3.3 Tannic acid loading
TA-grafted MS was prepared by the following procedure.32 First, 0.5 g of amino-funictionalized MS was dispersed into 20 mL deionized water containing a certain amount of TA under continuous stirring at 37 °C. After 2 h, 300 μL glutaraldehyde was added into the mixture, which was then stirred overnight at 37 °C. The product was then collected by centrifugation and washed several times by water. Finally, it was lyophilized and stored in a desiccator.
3.4 Characterization
The ordered mesoporous structure of the samples was confirmed by transmission electron microscopy (TEM, JEM-2100, JEOL, Japan). Surface analysis of MS was performed by N2 adsorption/desorption measurement on a Micromeritics ASAP2010 sorptometer (Micromeritics, USA). Prior to detection, the sample was degassed at 100 °C under vacuum for 4 h. The specific surface area was determined by the Brunauer–Emmett–Teller (BET) method and the pore parameters (pore volume and pore diameter) were obtained from the adsorption branch on the basis of the Barrett–Joyner–Halenda (BJH) model.The Fourier-transform infrared (FTIR) spectra were obtained using a PerkinElmer System 2000 spectrometer (Nicolet Magma-550 series II, Midac, USA) from KBr pellets at wavelengths ranging from 4000 to 400 cm−1 at a resolution of 1 cm−1 with an average of 64 scans. Thermogravimetry-differential scanning calorimetry (TG-DSC) thermograms were recorded with a Thermal Analysis (Nicolet Instrument Corporation, Madison, WI, USA).
Electrophoretic mobility measurements were performed to measure the surface charge (zeta potential) of the samples. The electrophoretic mobility assay was adapted from previous reports.10,29 The zeta potential was measured as a function of pH by titrating with 0.5 M HCl and NaOH at 25 °C. The sample was suspended in 0.1 mol L−1 of PBS (pH 7.4) and dispersed by sonication. Reverse titrations were performed to ensure chemical stability of the introduced surface function during the measurements.
3.5 In vitro TA-release study and protein absorption
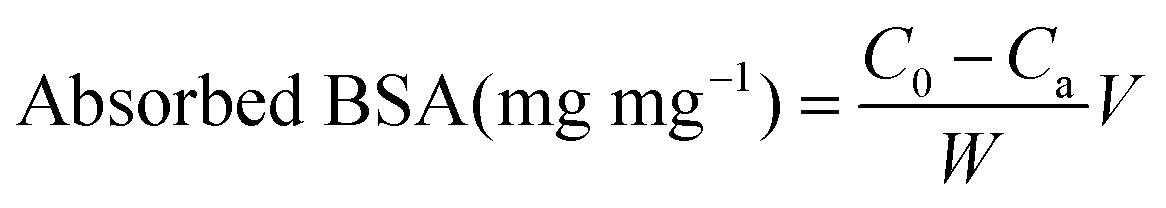
The TA-release profile was measured according to a previous report.19 Briefly, the experiment was carried out by adding dried sample to 10 mL of the phosphate buffer solution (PBS, 0.1 mol L−1) at different pH with or without BSA protein. This mixture was shaken in a rolling incubator (Kylin-Bell Lab Instruments Co., Ltd, Haimen) under room temperature and the released concentration as a function of time was analyzed by UV-visible spectroscopy at 285 nm in PBS. After that, the sample was collected by centrifugation and re-suspended in absolute ethanol, pipetted on to the copper mesh, and observed by TEM.The protein absorption was determined by the Bradford method.33 Briefly, 10 mg of TA loading sample was suspended in 1 ml of 0.2 wt% BSA solution (pH = 7.4), then shaken at 37 °C. After 1 h, the as-prepared supernatant was collected by centrifugation, and reacted with Bradford reagent for 5 min, and the residual BSA in solution was tested using an ultraviolet spectrophotometer at 595 nm. The amount of adsorbed protein (mg mg−1) was calculated according to the following equation:
3.6 In vitro blood clotting evaluation
![[thin space (1/6-em)]](https://www.rsc.org/images/entities/char_2009.gif) :1.
:1.
Red blood cells (RBCs) were isolated as packed RBCs from centrifugation of citrated whole blood samples at 3000 g for 15 min at room temperature, and washed three times. After cell washing, 200 μL of packed RBCs was diluted to 4 mL with PBS (5% hematocrit).
Platelet poor plasma (PPP) was isolated as the supernatant from the centrifugation of citrated whole blood samples at 3000 g for 15 min at room temperature.

APTT tests were performed by mixing 100 μL of aPTT reagent to 100 μL of citrated plasma. After incubation at 37 °C for 3 min, 100 μL of 25 mM CaCl2 and the sample were added in the test tube immediately and aPTT was measured simultaneously.
PT tests were performed by incubating 50 μL of citrated plasma, 100 μL of PT reagent and samples at 37 °C for 1 min, respectively. Then the PT reagent and sample were added to the plasma in the test tube and PT was measured. The tests for negative control were performed without samples.
3.7 Rat-tail amputation
Sprague-Dawley (SD) rats (weight of 200–250 g) were anesthetized by an intraperitoneal injection of 40 mg kg−1 sodium pentobarbital. Fifty percent length of the tail was cut by surgical scissors and then placed in air for 15 s to ensure normal blood loss. Subsequently, the wound was covered with 200 mg of sample. The clotting time (s) and blood loss (g) were recorded during the hemostatic process.36,393.8 In vitro antibacterial assay

3.9 In vivo anti-infective and wound-healing experiments
The in vivo anti-infective and wound-healing experiments were performed as previously reported with minor revision.41 Sprague-Dawley (SD) rats (weight of 200–250 g) were anesthetized by an intraperitoneal injection of 40 mg kg−1 sodium pentobarbital. After that, four full-thickness skin injures with a round section of dorsal flank skin (10 mm in diameter) were prepared and infected with 100 μL bacteria suspension (S. aureus, ∼1 × 10⁹ CFU mL−1) for 24 h. After 24 h, the samples were placed on the surface of the wound. At the same time, an uninfected wound with 10 mm in diameter was utilized as the negative control, and infected wound with 10 mm in diameter was utilized as the positive control. The wound regions were imaged 1, 5, 10, and 15 d postoperation. The rats were sacrificed on days 15 and the wound tissues postoperation were collected and treated with 4% paraformaldehyde solution to fix the samples. The pathological section of the wound tissue was analyzed by H & E staining. Histological images were taken using a microscope (NIKON, CI-S, Japan).All the above-mentioned experimental animals, including the New Zealand White Rabbits and SD rats, were cared for and treated in accordance with the NIH guidelines for the care and use of laboratory animals (NIH Publication No. 85e23 Rev. 1985) as approved by the Research Center for Laboratory Animal of Shanghai University of Traditional Chinese Medicine.
3.10 Live/dead viability assay of C2C12 cells
Cell viability was determined using live/dead staining. Briefly, C2C12 cells were seeded in a dish at a density of 1 × 10⁵ cells per dish, the incubated at 37 °C with normal growth media (Dulbecco's Modified Eagle's Medium (DMEM) with 0.11 g L−1L-glutamine, 2.2 g L−1 sodium bicarbonate, 10% fetal bovine serum, and 2% antibiotics (200 mg mL−1 penicillin and 200 mg mL−1 streptomycin)) in a 5% CO2 atmosphere. After incubation for 24 h, the medium was aspirated out and replaced with sample medium suspension (or solution). After another 24 h, the medium of each dish was removed and rinsed 5 times by PBS, stained by a Live/Dead Viability/Cytotoxicity Kit.3.11 Statistical analysis
All the experimental results are expressed as the mean ± standard deviation (SD). Statistical difference was analyzed using one-way analysis of variance (ANOVA). A value of P < 0.05 was considered to be statistically significant.4. Conclusions
The aim of this study was to prepare a novel mesoporous silica-matrixed hemostatic with enhanced hemostasis efficiency and antibacterial ability. The prepared 15TMS could not only quickly and effectively absorb fluid but also induced blood concentration. In addition, hemorrhage control in vitro and in vivo was achieved, which was attributed to MS contact activation and TA physical crosslinking. Furthermore, TMS showed excellent antibacterial ability and promoted wound healing. More importantly, TMS exhibited excellent biocompatibility; the hemolysis and cytotoxicity of the MS could be neglected after the modification by TA. We are convinced that this study provides an alternative approach for hemorrhage control.Conflicts of interest
There are no conflicts to declare.Acknowledgements
The authors wish to express their gratitude to the financial supports from the National Natural Science Foundation of China for Innovative Research Groups (No. 51621002), Science and Technology Commission Shanghai Municipality (16441902800), 111 Project (B14018), and the Fundamental Research Funds for the Central Universities (222201718002).Notes and references
- X. Yang, W. Liu, N. Li, M. Wang, B. Liang, I. Ullah, A. Luis Neve, Y. Feng, H. Chen and C. Shi, Biomater. Sci., 2017, 5, 2357–2368 RSC.
- C. J. Yan, T. H. Yang, S. K. Zhu and H. Wu, J. Mater. Chem. B, 2017, 5, 3697–3705 RSC.
- F. Cheng, C. Y. Liu, X. J. Wei, T. S. Yan, H. B. Li, J. M. He and Y. D. Huang, ACS Sustainable Chem. Eng., 2017, 5, 3819–3828 CrossRef CAS.
- T. A. Ostomel, Q. Shi and G. D. Stucky, J. Am. Chem. Soc., 2006, 128, 8384–8385 CrossRef CAS PubMed.
- R. Liu, L. Dai, C. Si and Z. Zeng, Carbohydr. Polym., 2018, 195, 63–70 CrossRef CAS PubMed.
- S. Pourshahrestani, E. Zeimaran, N. A. Kadri, N. Gargiulo, H. M. Jindal, S. V. Naveen, S. D. Sekaran, T. Kamarul and M. R. Towler, ACS Appl. Mater. Interfaces, 2017, 9, 31381–31392 CrossRef CAS PubMed.
- A. M. Behrens, M. J. Sikorski and P. Kofinas, J. Biomed. Mater. Res., Part A, 2014, 102, 4182–4194 CrossRef PubMed.
- X. Sun, Z. Tang, M. Pan, Z. Wang, H. Yang and H. Liu, Carbohydr. Polym., 2017, 177, 135–143 CrossRef CAS PubMed.
- Z. Chen, F. Li, C. Liu, J. Guan, X. Hu, G. Du, X. Yao, J. Wu and F. Tian, J. Mater. Chem. B, 2016, 4, 7146–7154 RSC.
- C. Dai, Y. Yuan, C. Liu, J. Wei, H. Hong, X. Li and X. Pan, Biomaterials, 2009, 30, 5364–5375 CrossRef CAS PubMed.
- C. Dai, C. Liu, J. Wei, H. Hong and Q. Zhao, Biomaterials, 2010, 31, 7620–7630 CrossRef CAS PubMed.
- H. Hong, C. W. Wang, Y. Yuan, X. Qu, J. Wei, Z. F. Lin, H. Y. Zhou and C. S. Liu, RSC Adv., 2016, 6, 78930–78935 RSC.
- H. Y. Zhou, C. W. Wang, H. Y. Niu, B. Duan, X. Y. Ma, H. Hong, Y. Yuan and C. S. Liu, J. Biomed. Nanotechnol., 2018, 14, 649–661 CrossRef.
- Y. Bu, L. Zhang, J. Liu, L. Zhang, T. Li, H. Shen, X. Wang, F. Yang, P. Tang and D. Wu, ACS Appl. Mater. Interfaces, 2016, 8, 12674–12683 CrossRef CAS PubMed.
- S. Pourshahrestani, E. Zeimaran, N. A. Kadri, N. Gargiulo, S. Samuel, S. V. Naveen, T. Kamarul and M. R. Towler, J. Mater. Chem. B, 2016, 4, 71–86 RSC.
- J. Hoque, B. Bhattacharjee, R. G. Prakash, K. Paramanandham and J. Haldar, Biomacromolecules, 2018, 19, 267–278 CrossRef CAS PubMed.
- K. Kim, M. Shin, M. Y. Koh, J. H. Ryu, M. S. Lee, S. Hong and H. Lee, Adv. Funct. Mater., 2015, 25, 2402–2410 CrossRef CAS.
- M. Shin, K. Kim, W. Shim, J. W. Yang and H. Lee, ACS Biomater. Sci. Eng., 2016, 2, 687–696 CrossRef CAS.
- N. Ninan, A. Forget, V. P. Shastri, N. H. Voelcker and A. Blencowe, ACS Appl. Mater. Interfaces, 2016, 8, 28511–28521 CrossRef CAS PubMed.
- E. Montanari, A. Gennari, M. Pelliccia, C. Gourmel, E. Lallana, P. Matricardi, A. J. McBain and N. Tirelli, Macromol. Biosci., 2016, 16, 1815–1823 CrossRef CAS PubMed.
- A. S. Glaive, T. Modjinou, D. L. Versace, S. Abbad-Andaloussi, P. Dubot, V. Langlois and E. Renard, ACS Sustainable Chem. Eng., 2017, 5, 2320–2329 CrossRef CAS.
- T. Taguri, T. Tanaka and I. Kouno, Biol. Pharm. Bull., 2004, 27, 1965–1969 CrossRef CAS.
- D. Payra, M. Naito, Y. Fujii and Y. Nagao, Chem. Commun., 2016, 52, 312–315 RSC.
- L. Pan, J. Liu, Q. He and J. Shi, Adv. Mater., 2014, 26, 6742–6748 CrossRef CAS PubMed.
- Y. Li and J. Shi, Adv. Mater., 2014, 26, 3176–3205 CrossRef CAS PubMed.
- Y. Zheng, Y. Liang, D. Zhang, X. Sun, L. Liang, J. Li and Y.-N. Liu, ACS Omega, 2018, 3, 4766–4775 CrossRef CAS PubMed.
- Z. Wang, H. J. Kang, W. Zhang, S. F. Zhang and J. Z. Li, Appl. Surf. Sci., 2017, 401, 271–282 CrossRef CAS.
- G. Yun, S. Pan, T. Y. Wang, J. Guo, J. J. Richardson and F. Caruso, Adv. Healthcare Mater., 2018, 7, 1700934 CrossRef PubMed.
- C. W. Wang, H. Hong, Z. F. Lin, Y. Yuan, C. S. Liu, X. Y. Ma and X. Y. Cao, RSC Adv., 2015, 5, 104283–104292 Search PubMed.
- A. M. El-Toni, M. A. Habila, M. A. Ibrahim, J. P. Labis and Z. A. Alothman, Chem. Eng. J., 2014, 251, 441–451 CrossRef CAS.
- Q. Zhang, K. G. Neoh, L. Xu, S. Lu, E. T. Kang, R. Mahendran and E. Chiong, Langmuir, 2014, 30, 6151–6161 CrossRef CAS PubMed.
- X. Liu, M. Liang, M. Liu, R. Su, M. Wang, W. Qi and Z. He, Nanoscale Res. Lett., 2016, 11, 440 CrossRef PubMed.
- F. Bazzaz, E. Binaeian, A. Heydarinasab and A. Ghadi, Adv. Powder Technol., 2018, 29, 1664–1675 CrossRef CAS.
- Y. Zhao, X. Sun, G. Zhang, B. G. Trewyn, I.I. Slowing and V. S. Lin, ACS Nano, 2011, 5, 1366–1375 CrossRef CAS PubMed.
- T. Yu, A. Malugin and H. Ghandehari, ACS Nano, 2011, 5, 5717–5728 CrossRef CAS PubMed.
- C. Feng, J. Li, G. S. Wu, Y. Z. Mu, M. Kong, C. Q. Jiang, X. J. Cheng, Y. Liu and X. G. Chen, ACS Appl. Mater. Interfaces, 2016, 8, 34234–34243 CrossRef CAS PubMed.
- A. K. Gaharwar, R. K. Avery, A. Assmann, A. Paul, G. H. McKinley, A. Khademhosseini and B. D. Olsen, ACS Nano, 2014, 8, 9833–9842 CrossRef CAS PubMed.
- R. K. Avery, H. Albadawi, M. Akbari, Y. S. Zhang, M. J. Duggan, D. V. Sahani, B. D. Olsen, A. Khademhosseini and R. Oklu, Sci. Transl. Med., 2016, 8, 365ra156 CrossRef PubMed.
- A. M. Behrens, M. J. Sikorski, T. Li, Z. J. Wu, B. P. Griffith and P. Kofinas, Acta Biomater., 2014, 10, 701–708 CrossRef CAS PubMed.
- J. B. Li, Y. Q. Qiao, Z. H. Ding and X. Y. Liu, Surf. Coat. Technol., 2011, 205, 5430–5436 CrossRef CAS.
- M. Zhu, P. Liu, H. Shi, Y. Tian, X. Ju, S. Jiang, Z. Li, M. Wu and Z. Niu, J. Mater. Chem. B, 2018, 6, 3884–3893 RSC.
- Q. Song, W.-J. Zhao, H.-X. Yin and H.-Z. Lian, RSC Adv., 2015, 5, 63896–63902 RSC.
- Z. H. Chen, F. Li, C. J. Liu, J. Guan, X. Hu, G. Du, X. P. Yao, J. M. Wu and F. Tian, J. Mater. Chem. B, 2016, 4, 7146–7154 RSC.
- A. Shukla, J. C. Fang, S. Puranam, F. R. Jensen and P. T. Hammond, Adv. Mater., 2012, 24, 492–496 CrossRef CAS PubMed.
- T. Yoshida, Y. Yoshioka, Y. Morishita, M. Aoyama, S. Tochigi, T. Hirai, K. Tanaka, K. Nagano, H. Kamada, S. Tsunoda, H. Nabeshi, T. Yoshikawa, K. Higashisaka and Y. Tsutsumi, Nanotechnology, 2015, 26, 245101 CrossRef PubMed.
- J. A. Curiel, H. Rodriguez, B. de Las Rivas, P. Anglade, F. Baraige, M. Zagorec, M. Champomier-Verges, R. Munoz and F. Lopez de Felipe, Mol. Nutr. Food Res., 2011, 55, 1454–1465 CrossRef CAS PubMed.
Footnote |
| † Electronic supplementary information (ESI) available. See DOI: 10.1039/c8bm00837j |
| This journal is © The Royal Society of Chemistry 2018 |