An ultrasensitive electrochemiluminescent D-alanine biosensor based on the synergetic catalysis of a hemin-functionalized composite and gold–platinum nanowires
Xia
Lin
ab,
Shu
Zhu
a,
Qiao
Xia
a,
Jiao
Ma
a and
Yingzi
Fu
 *a
*a
aKey Laboratory of Luminescence and Real-Time Analysis (Southwest University), Ministry of Education, School of Chemistry and Chemical Engineering, Southwest University, Chongqing 400715, China. E-mail: fyzc@swu.edu.cn; Fax: +86-023-68253195; Tel: +86-023-68252360
bSchool of Teacher Education, Xichang University, Sichuan 615000, China
First published on 24th November 2017
Abstract
Herein, an ultrasensitive and stereo-selective electrochemiluminescent (ECL) biosensor based on ECL signal amplification of luminol by the synergetic catalysis of a hemin-functionalized composite and gold–platinum nanowires (Au-PtNWs) has been designed for the detection of D-alanine (D-Ala). In the sensor design, D-amino acid oxidase (DAAO) was used to generate the ECL co-reactant (H2O2) for luminol in situ. The reduced graphene oxide-hemin-cysteine (rGO-H-Cys) composite and Au-PtNWs acted not only as amplification labels to amplify signals via synergetic catalysis, but also as an ideal nanocarrier to accelerate electron transfer. A great difference in ECL intensities toward D-Ala and L-Ala was obtained, and an obviously higher intensity was seen for D-Ala. Under optimal conditions, the ECL intensity had a linear relationship with the logarithm of the D-Ala concentration in the range from 1.0 × 10⁻⁹ to 5.0 × 10⁻³ M with a detection limit of 3.3 × 10⁻¹⁰ M (S/N = 3). This study provides a new method for the determination of D-Ala in food with high sensitivity, excellent selectivity, and good stability and reproducibility.
Introduction
Chirality is a fundamental chemical property in nature and plays a critical role in living systems.1 Chiral amino acids with different configurations may have different biological or physiological activities.2,3 Previous studies have indicated that D-amino acids (D-AAs) exist in unicellular organisms and bacterial cell wall.4–6 As a non-essential amino acid, D-alanine (D-Ala) amount in mammals has a close relation to schizophrenia and depression,7–10 and it is also an important index for food safety. Different methods including high-performance liquid chromatography (HPLC) and electrochemical methods are available for D-Ala detection.11–13 However, further developments of these methods are restricted by the expensive instruments and time-consuming sample preparations. Thus, a simple and applicable analytical method for D-Ala analysis is highly required.Electrochemiluminescence (ECL) has attracted extensive attentions in the food industry, clinical diagnostics, immunoassays, and DNA analysis due to its high sensitivity, good selectivity, wide linear range, simple instrumentation, and low background.14–19 Although enzyme-based catalysis methods for amino acid detection have been widely studied, the coupling of these approaches with the ECL technique for the detection of D-Ala is still at its infancy.20
As a classic organic ECL species, luminol possesses the inherent properties of inexpensiveness, nontoxicity, and high emission yields.21–23 To enhance the ECL signal of luminol, several reactive oxygen species (ROSs) such as superoxide anion (O2˙−) and hydroxyl radical (OH˙) have been extensively explored by accelerating the decomposition of H2O2.24–26 Bimetallic nanostructures combining the performances of two different metals are regarded as promising candidates with catalytic and sensory abilities.27–30 Typically, gold–platinum nanowires (Au-PtNWs) can be used as an excellent material to fabricate a biosensor in the luminol–H2O2 ECL system.
Hemin is a well-known natural metalloporphyrin and mimic peroxidase,31–33 which can be adsorbed on graphene-based materials by π–π stacking interaction. The hemin/graphene composite exhibits the advantages of large surface area, high conductivity, and great mechanical strength.34,35L-cysteine (L-Cys) can promote electron transfer and can be covalently linked to metallic nanomaterials with its amino and sulfhydryl groups.36,37 Therefore, a promising platform based on a reduced graphene oxide–hemin-cysteine composite (rGO-H-Cys) can be applied in ECL biosensors.
D-Amino acid oxidase (DAAO) is a flavoprotein that can catalyze the stereospecific oxidative deamination of D-AAs to generate H2O2 (D-amino acids + O2 + H2O DAAO α-keto acid + NH3 + H2O2).38,39 Accordingly, the levels of D-Ala can be evaluated indirectly through monitoring the ECL intensities of luminol–H2O2. In this study, we present a novel and sensitive ECL biosensor based on the specific catalysis of DAAO and the synergetic catalysis of an rGO-H-Cys composite and Au-PtNWs for the recognition and detection of D-Ala.
Experimental
Materials and reagents
D-Amino acid oxidase (DAAO) was obtained from porcine kidney (EC 1.4.3.3, 5.6 U mg−1 solid), and poly(ethyleneimine) (PEI), D-/L-alanine (D-/L-Ala, 98%), D-serine (D-Ser, 99%) and D-phenylalanine (D-Phe, 98%) were purchased from Sigma chemical Co. (St. Louis, MO, USA). Albumin was obtained from bovine serum (BSA, 98%), L-cysteine (L-Cys, 98%), D-glutamic acid (D-Glu, 99%), D-proline (D-Pro, 99%), and D-tryptophan (D-Trp, 99%) were obtained from J&K Chemical Co. (Beijing, China). Gold chloride tetrahydrate (HAuCl4·4H2O, 99.99%), chloroplatinic acid hexahydrate (H2PtCl6·6H2O, 37.5%), and D-arginine (D-Arg, 98%) were obtained from Aladdin Reagent Co. Ltd. (Shanghai, China). Graphene oxide (GO) was obtained from Nanjing xianfeng nano Co. (Nanjing, China). N-Hydroxy succinimide (NHS) and N-(3-dimethylaminopropyl)-N′-ethylcarbodiimide hydrochloride (EDC) were purchased from Shanghai Medpep Co. Ltd (Shanghai, China). Grape juice was received from the local market. Glycerol, N,N-dimethylformamide (DMF), potassium hydroxide (KOH), and ethylene glycol were purchased from Chemical Reagent Co. (Chongqing, China). Phosphate buffer solutions (PBS) were prepared with 0.1 M KH2PO4, Na2HPO4, and 0.1 M KCl as the supporting electrolyte. Other chemical reagents were of analytical grade and used without further purification. Double distilled water was used in all experiments.Apparatus
The ECL emission was monitored using a model MPI-A electrocheminescence analyzer (Xi'an Remex Electronicscience Technology Co. Ltd, China) with the voltage of the photomultiplier tube (PTM) set at 800 V. Cyclic voltammetry (CV) measurement was carried out using a CHI 604 D electrochemistry workstation (Shanghai Chenhua Instruments Co., China). A conventional three-electrode setup containing a modified glassy carbon electrode (GCE, 4.0 mm in diameter) as the working electrode, a platinum auxiliary electrode, and a Ag/AgCl (saturated KCl) reference electrode was adopted. The morphologies of the nanomaterials were determined by a scanning electron microscope (SEM, JSM-7800F, JEOL Ltd, Tokyo, Japan). UV-vis absorption spectra were obtained using a UV-2600 spectrometer (Shimadzu, Japan).Preparation of the rGO-H-Cys composite
At first, the preparation of rGO was performed according to the literature.40 In brief, 50 mL of homogeneous GO solution (0.5 mg mL−1) was mixed with 1.0 mL of PEI solution (3%) by ultrasonication for 30 min at room temperature. After heating under reflux at 135 °C for 3 h, the mixture was centrifuged and carefully washed with ultrapure water. Next, the hemin-functionalized rGO composite (rGO-H) was synthesized according to the following procedure:41 hemin solution (0.5 mg mL−1) was added to the previous rGO dispersion for ultrasonication about 4 h, and then, the reactant was rinsed with ultrapure water. Following this, the EDC/NHS (3![[thin space (1/6-em)]](https://www.rsc.org/images/entities/char_2009.gif) :
:![[thin space (1/6-em)]](https://www.rsc.org/images/entities/char_2009.gif) 1)-activated L-Cys solution (0.02 M, 0.1 M NaOH) was added to the rGO-H solution dropwise and stirred at room temperature overnight. Finally, the rGO-H-Cys composite was obtained by centrifugation at 12
1)-activated L-Cys solution (0.02 M, 0.1 M NaOH) was added to the rGO-H solution dropwise and stirred at room temperature overnight. Finally, the rGO-H-Cys composite was obtained by centrifugation at 12![[thin space (1/6-em)]](https://www.rsc.org/images/entities/char_2009.gif) 000 rpm and further washed to re-disperse in water.
000 rpm and further washed to re-disperse in water.
Synthesis of Au-PtNWs
The Au-PtNWs were prepared as previously described with slight modifications.42 Herein, 8.0 mL of ethylene glycol was first added to 12 mL of DMF solution under stirring. Then, 0.8 mL of H2PtCl6 solution (1 wt%), 0.8 mL of H2AuCl4 solution (1 wt%), and 1.0 g of KOH were added to the mixed solution. After stirring for 12 h, the homogeneous solution was transferred into a 50 mL autoclave to react at 170 °C for 5 h. The obtained black product was centrifuged at 12![[thin space (1/6-em)]](https://www.rsc.org/images/entities/char_2009.gif) 000 rpm and washed with ethanol and water and finally re-dispersed in 1.0 mL ultrapure water. When not in use, it was stored at 4 °C.
000 rpm and washed with ethanol and water and finally re-dispersed in 1.0 mL ultrapure water. When not in use, it was stored at 4 °C.
Construction of the biosensor
Prior to modification, the glassy carbon electrodes (GCE, Φ = 4.0 mm) were polished with 1.0, 0.3, and 0.05 μm alumina slurry and then cleaned by sonication in alcohol and water. Subsequently, the electrodes were coated with 10 μL of the rGO-H-Cys composite and dried at room temperature (rGO-H-Cys/GCE). After washing and drying, 10 μL of Au-PtNWs solution was casted on the modified electrodes for 2 h to form a new self-assembled film (Au-PtNWs/rGO-H-Cys/GCE). Finally, 8.0 μL of DAAO stock solution (1.0 U mL−1, pH 8.0) consisting of 10% of glycerol and 1% of BSA was dropped on the as-prepared electrodes (washing with PBS before use) and incubated at 4 °C overnight (DAAO/Au-PtNWs/rGO-H-Cys/GCE). The schematic for construction of the biosensor is shown in Scheme 1.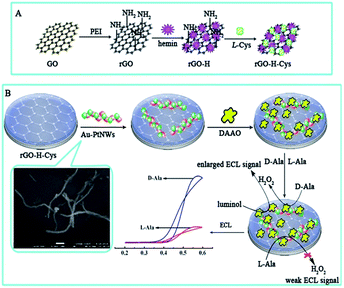 | ||
| Scheme 1 (A) The preparation process for the rGO-H-Cys composite. (B) Schematic of the stepwise fabrication of the biosensor for ECL detection of D-Ala. | ||
Measurement of Ala enantiomers
Before each experiment, the DAAO/Au-PtNW/rGO-H-Cys/GCE electrodes were maintained at 25 °C for 30 min for the activation of enzymes. After washing thoroughly with PBS (pH 8.0), the electrodes were immersed in 5.0 × 10⁻³ M D- or L-Ala (pH 8.0) solution containing 1.0 × 10⁻³ M luminol for detection, and the ECL responses were obtained. The scanning potential were set from 0.2 to 0.6 V under the photomultiplier tube (PMT) at 800 V and a scan rate of 100 mV s−1.Results and discussion
Formation of the rGO-H-Cys composite
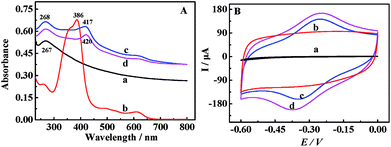
The UV-vis absorption spectrum was obtained to characterize the rGO-H-Cys composite. In Fig. 1A, the spectrum of rGO displayed a maximum absorption peak at 267 nm, ascribed to the π–π* transition of C![[double bond, length as m-dash]](https://www.rsc.org/images/entities/char_e001.gif) C bonds. A typically strong Soret band peak at 386 nm and a group of weak peaks between 450 and 650 nm (Q-bands) could be observed for hemin solution (curve b). Moreover, an absorption peak at 267 nm (rGO) and additional broad absorption peak at 417 nm were obtained for rGO-H (curve c), implying that hemin was conjugated to rGO. The absorbance intensity of rGO-H-Cys decreased with a minor red-shift (curve d); this suggested that L-Cys was linked to rGO-H.
C bonds. A typically strong Soret band peak at 386 nm and a group of weak peaks between 450 and 650 nm (Q-bands) could be observed for hemin solution (curve b). Moreover, an absorption peak at 267 nm (rGO) and additional broad absorption peak at 417 nm were obtained for rGO-H (curve c), implying that hemin was conjugated to rGO. The absorbance intensity of rGO-H-Cys decreased with a minor red-shift (curve d); this suggested that L-Cys was linked to rGO-H.
The electrochemical properties of different nanomaterials were also investigated by CV. It could be found in Fig. 1B that no redox peaks were obtained for bare GCE (curve a) and rGO/GCE (curve b) in PBS (pH 7.4) with the scanning potential in the range from −0.6 to 0 V. However, a pair of well-defined redox peaks could be clearly seen for rGO-H/GCE (curve c) due to the redox reactions of hemin with the Fe3+/2+ centers.33–35,43 Moreover, a larger current response was visible for the rGO-H-Cys/GCE (curve d) due to the excellent conductivity of L-Cys.
Fabrication process of the biosensor
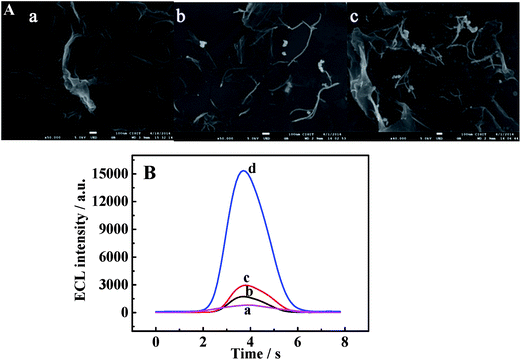
The morphologies of different modified films were determined by SEM. The rGO-H-Cys composite presented a typical wrinkle and very thin paper-like shape (Fig. 2a). In Fig. 2b, bright wires were distributed on the modified film, suggesting that Au-PtNWs were anchored on the rGO-H-Cys surface. Spherical particles were displayed on the whole surface after incubating DAAO with the abovementioned film (Fig. 2c), indicating that the Au-PtNWs/rGO-H-Cys film could provide a favorable environment for loading of DAAO.To gain a better understanding of the fabrication process of the proposed biosensor, the corresponding ECL-time profiles at each immobilization step were obtained in 5.0 × 10⁻³ M D-Ala (pH 8.0) containing 1.0 × 10⁻³ M luminol solution. As shown in Fig. 2B, the bare GCE exhibited a relatively low ECL signal (curve a), whereas the ECL signal increased for rGO-H-Cys/GCE (curve b). After Au-PtNWs were assembled on the modified electrode, further enhancement in the ECL signal was obtained because of its outstanding conductivity (curve c). When DAAO was incubated with the electrode (curve d), the ECL signal was dramatically amplified due to generation of the co-reactant (H2O2) for luminol in situ catalyzed by DAAO with the presence of D-Ala.
Enantioselective recognition of ala enantiomers
Fig. 3 depicts the ECL responses of DAAO/Au-PtNW/rGO-H-Cys/GCE electrodes in 5.0 × 10⁻³ M D- and L-Ala (pH 8.0) containing 1.0 × 10⁻³ M luminol solution. Different ECL signals could be observed, and a higher ECL signal was obtained for D-Ala (curve a), suggesting that the enzyme electrodes showed stereospecific interaction with D-Ala.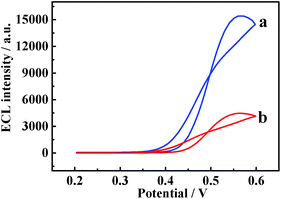 | ||
| Fig. 3 ECL signals of DAAO/Au-PtNW/rGO-H-Cys/GCE electrodes in 5.0 × 10⁻³ M (a) D-Ala and (b) L-Ala (pH 8.0) containing 1.0 × 10⁻³ M luminol. | ||
Possible mechanism for the amplification of the ECL signal
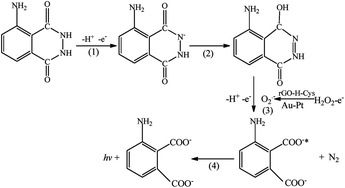
The synergetic catalysis effect of the rGO-H-Cys composite and Au-PtNWs in the luminol–H2O2 system was examined by carrying out a series of control experiments. Under the same conditions, the ECL intensities of 6547 a.u. and 8652 a.u. were obtained on DAAO/Au-PtNW/GCE (Fig. 4a) and DAAO/rGO-H-Cys/GCE (Fig. 4b) respectively, whereas the ECL signal with the value elevated to 15![[thin space (1/6-em)]](https://www.rsc.org/images/entities/char_2009.gif) 385 a.u was obtained on DAAO/Au-PtNW/rGO-H-Cys/GCE (Fig. 4c). The ROSs such as O2˙− and OH˙−, which generated from the decomposition of H2O2, could react with luminol to produce the excited state 3-aminophthalate dianion, resulting in light emission.44,45 Hemin possesses peroxidase-like activity to accelerate the decomposition of H2O2.46 Similarly, rGO and L-Cys can also facilitate the reduction of H2O2.47 Furthermore, the Au-PtNWs were active for electro-catalytic oxidation of H2O2.30 Consequently, the ECL signals of DAAO/Au-PtNW/rGO-H-Cys/GCE towards D-Ala were significantly enhanced. The corresponding ECL processes are provided as follows:
385 a.u was obtained on DAAO/Au-PtNW/rGO-H-Cys/GCE (Fig. 4c). The ROSs such as O2˙− and OH˙−, which generated from the decomposition of H2O2, could react with luminol to produce the excited state 3-aminophthalate dianion, resulting in light emission.44,45 Hemin possesses peroxidase-like activity to accelerate the decomposition of H2O2.46 Similarly, rGO and L-Cys can also facilitate the reduction of H2O2.47 Furthermore, the Au-PtNWs were active for electro-catalytic oxidation of H2O2.30 Consequently, the ECL signals of DAAO/Au-PtNW/rGO-H-Cys/GCE towards D-Ala were significantly enhanced. The corresponding ECL processes are provided as follows: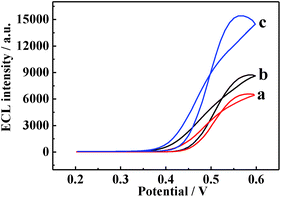 | ||
| Fig. 4 ECL intensity–potential curves of (a) DAAO/Au-PtNWs/GCE, (b) DAAO/rGO-H-Cys/GCE and (c) DAAO/Au-PtNWs/rGO-H-Cys/GCE in 5.0 × 10⁻³ M D-Ala (pH 8.0) containing 1.0 × 10⁻³ M luminol. | ||
Optimizing the detection conditions
The effect of luminol concentration on the ECL intensity of the proposed biosensor was investigated. The ECL signals increased with an increase in the luminol concentration in the range from 0 to 1.0 mM, but no further enhancement appeared when the concentration of luminol exceeded 1.0 mM (Fig. 5A). Consequently, the experimental concentration of luminol was selected at 1.0 mM.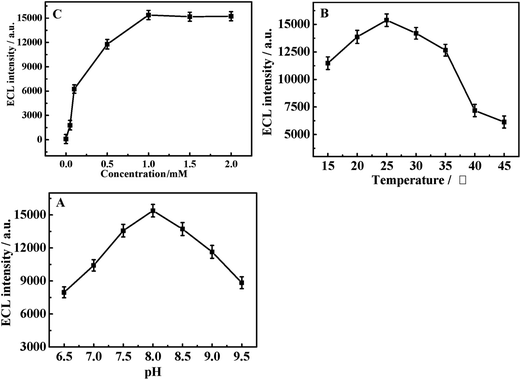 | ||
| Fig. 5 The effects of (A) luminol concentration, (B) temperature and (C) pH on ECL intensity of the proposed biosensor. | ||
Before determination, the DAAO/Au-PtNW/rGO-H-Cys/GCE electrodes were maintained at different temperatures for 30 min for activating the enzymes. The ECL value reached maxima (Fig. 5B) at 25 °C. Thus, 25 °C was chosen as the optimal temperature.
The pH of the buffer is an important factor for the activity of the enzymes that directly affects the sensitivity of the biosensor. The effect of the pH was investigated in the range from 6.5 to 9.5, and the maximum value of the ECL signal appeared at pH 8.0 (Fig. 5C). As a result, the buffer solution of pH 8.0 was selected for further experiments.
Analytical performance of the biosensor
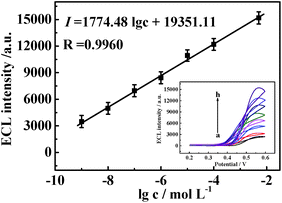
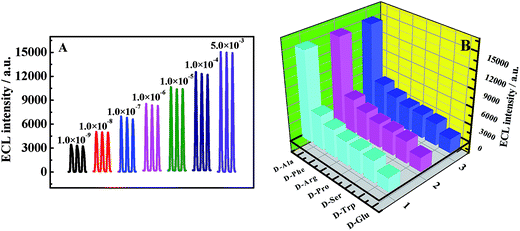
Under optimized experimental conditions, we examined the quantitative range of the biosensor for D-Ala detection. Fig. 6 revealed that the ECL intensity increased gradually with the increasing D-Ala concentrations from 1.0 × 10⁻⁹ to 5.0 × 10⁻³ M, and the ECL responses were linearly correlated to the logarithm of D-Ala concentration. The equation of the linear regression was I = 1774.48![[thin space (1/6-em)]](https://www.rsc.org/images/entities/char_2009.gif) lg
lg![[thin space (1/6-em)]](https://www.rsc.org/images/entities/char_2009.gif) c + 19
c + 19![[thin space (1/6-em)]](https://www.rsc.org/images/entities/char_2009.gif) 351.11 (where I was the ECL intensity and c was the D-Ala concentrations) with the correlation coefficient of R = 0.9960 and the detection limit of 3.3 × 10⁻¹⁰ M (S/N = 3).
351.11 (where I was the ECL intensity and c was the D-Ala concentrations) with the correlation coefficient of R = 0.9960 and the detection limit of 3.3 × 10⁻¹⁰ M (S/N = 3).
Different enzyme electrodes for the detection of D-Ala
Table 1 illustrates the comparison of different enzyme electrodes for D-Ala detection. The as-presented biosensor offered a new and simple synergetic catalysis approach for ultrasensitive bioassay of D-Ala with a wider liner range and lower detection limit.| Modified electrode | Linear range (mol L−1) | Detection limit (mol L−1) | Ref. |
|---|---|---|---|
| a Polyalinine. b Prussia blue. c Peroxidase. d Sodium pentacyano nitrosyl-ferrate(III) dihydrate. e 3,4,9,10-Perylenete-tracarboxylic dianhydride. f Polyindole-5-carboxylic acid/zinc sulphide nanoparticles. | |||
| DAAO/c-MWCNT/CuNP/PANIa/Au electrode | 1.0 × 10⁻⁶–1.0 × 10⁻³ | 2.0 × 10⁻⁷ | 12 |
| DAAOx/BSA/PBb/Nafion/SPE | 5.0 × 10⁻⁶–2.0 × 10⁻⁴ | 1.0 × 10⁻⁶ | 13 |
| DAAO/Au-PtNP/F-MWCNTs | 5.0 × 10⁻⁹–5.0 × 10⁻³ | 1.6 × 10⁻⁹ | 20 |
| DAAO/PODc/PVI[Fe(CN)5]d/GCE | 1.0 × 10⁻⁶–1.5 × 10⁻⁴ | 2.0 × 10⁻⁶ | 39 |
| DAAO/PTCAe/MWCNT/GCE | 1.0 × 10⁻⁸–1.0 × 10⁻³ | 3.3 × 10⁻⁹ | 48 |
| DAAO/Pin5-COOHf/ZnSNP/Au electrode | 1.0 × 10⁻⁶–2.0 × 10⁻³ | 1.0 × 10⁻⁶ | 49 |
| DAAO/Au-PtNW/rGO-H-Cys/GCE | 1.0 × 10⁻⁹–5.0 × 10⁻³ | 3.3 × 10⁻¹⁰ | This work |
Stability, repeatability, and selectivity of the biosensor
The stability of the biosensor was evaluated at various D-Ala concentrations. As exhibited in Fig. 7A, the ECL signals possessed a relatively stable curve at each concentration. When the modified electrodes were stored at 4 °C for 7 and 15 days, the ECL signals decreased to 97.2% and 90.2%, respectively; this confirmed the stability of the biosensor. Moreover, six modified electrodes were prepared independently under the same conditions and immersed in 5.0 × 10⁻³ M D-Ala (pH 8.0) containing 1.0 × 10⁻³ M luminol. Similar ECL responses were obtained with a relative standard deviation (RSD) of 3.4%, which indicated that the D-Ala biosensor had an acceptable reproducibility.The selectivity of the sensor for D-Ala was also evaluated against other interferent D-AAs. From the results shown in Fig. 7B, we could see that the ECL signals from other D-AAs were much lower than that of D-Ala; this might be caused by the sources and immobilization of DAAOs.50–52 Hence, the presented biosensor had a high selectivity for the recognition of D-Ala.
Real application of the biosensor
The standard addition method was utilized to estimate the recoveries of exogenously added D-Ala in food. As listed in Table 2, the recovery rates (from 86.7% to 101.5%) and the RSD (from 2.9% to 3.8%) were acceptable; this suggested that the biosensor could be used for D-Ala detection in food.| Sample | D-Ala added (mM) | D-AAs founded (mM) | Recovery (%) | RSD (%) |
|---|---|---|---|---|
| Grape juice | __ | 0.210 | __ | 3.2 |
| 5.0 × 10⁻⁴ | 0.211 | 90.2 | 2.9 | |
| 5.0 × 10⁻³ | 0.215 | 97.4 | 3.6 | |
| 5.0 × 10⁻² | 0.256 | 92.7 | 3.2 | |
| 0.30 | 0.471 | 86.7 | 3.4 | |
| 0.50 | 0.667 | 91.8 | 3.8 | |
| Milk | __ | 0.12 | __ | 3.3 |
| 5.0 × 10⁻⁴ | 0.121 | 101.5 | 3.7 | |
| 5.0 × 10⁻³ | 0.125 | 98.7 | 3.0 | |
| 5.0 × 10⁻² | 0.167 | 94.2 | 3.1 | |
| 0.30 | 0.40 | 93.3 | 3.8 | |
| 0.50 | 0.64 | 100.4 | 3.7 |
Conclusions
In conclusion, a novel enzymatic strategy was employed for the detection of D-Ala, in which signal amplification was based on the synergetic catalysis of the rGO-H-Cys composite and Au-PtNWs. The as-prepared D-Ala biosensor possessed wide linear range, outstanding sensitivity, acceptable reproducibility, and excellent stability. This strategy will pave the way for future development of other ECL biosensors to detect D-Ala in food.Conflicts of interest
There are no conflicts to declare.Acknowledgements
The authors are grateful for the financial support provided by the National Natural Science Foundation of China (21272188).References
- C. Z. Xuan, Q. Xia, J. J. Xu, Q. H. Wang, X. Lin and Y. Z. Fu, Anal. Methods, 2016, 8, 3564 RSC.
- Q. Han, Y. H. Wang, L. J. Guo, Y. H. Huang, Q. Zhang and Y. Z. Fu, Anal. Methods, 2013, 5, 1312 RSC.
- E. Rubenstein, W. A. Bonner, H. P. Noyes and G. S. Brown, Nature, 1983, 306, 118 CrossRef.
- M. Friedman and J. Agric, Food Chem., 1999, 47, 3457 CrossRef CAS.
- C. Tomlinson, M. Rafii, R. O. Ball and P. Pencharz, Metabolism, 2010, 59, 14 CrossRef CAS PubMed.
- I. Kolodkin-Gal, D. Romero, S. G. Cao, J. Clardy, R. Kolter and R. Losick, Science, 2010, 328, 627 CrossRef CAS PubMed.
- A. Morikawa, K. Hamase, T. Ohgusu, S. Etoh, H. Tanaka, I. Koshiishi, Y. Shoyama and K. Zaitsu, Biochem. Biophys. Res. Commun., 2007, 355, 872 CrossRef CAS PubMed.
- Y. Inaba, K. Mizukami, N. H. Sato, T. Kobayashi, C. Imada and E. Watanabe, Biosens. Bioelectron., 2003, 19, 423 CrossRef CAS PubMed.
- G. Tsai, P. Yang, Y. C. Chang and M. Y. Chong, Biol. Psychiatry, 2006, 59, 230 CrossRef CAS PubMed.
- S. D. D. Wadleigh and F. J. McMahon, Biol. Psychiatry, 2006, 60, 106 CrossRef PubMed.
- Y. Miyoshi, K. Hamase, Y. Tojo, M. Mita, R. Konno and K. Zaitsu, J. Chromatogr. B., 2009, 877, 2506 CrossRef CAS PubMed.
- S. Lata, B. Batra, P. Kumar and C. S. Pundir, Anal. Biochem., 2013, 437, 1 CrossRef CAS PubMed.
- M. Wcisło, D. Compagnone and M. Trojanowicz, Enantioselective screen-printed amperometric biosensor for the determination of D-amino acids, Bioelectrochemistry, 2007, 71, 91–98 CrossRef PubMed.
- Y. C. Wang, L. Xiao and M. R. Cheng, J. Chromatogr. A, 2011, 1218, 9115 CrossRef CAS PubMed.
- L. L. Yang, Y. Zhang, R. B. Li, C. Y. Lin, L. H. Guo, B. Qiu, Z. Y. Lin and G. A. Chen, Biosens. Bioelectron., 2015, 70, 268 CrossRef CAS PubMed.
- V. A. Zamolo, G. Valenti, E. Venturelli, O. Chaloin, M. Marcaccio, S. Boscolo, V. Castagnola, S. Sosa, F. Berti, G. Fontanive, M. Poli, A. Tubaro, A. Bianco, F. Paolucci and M. Prato, ACS Nano, 2012, 6, 7989 CrossRef CAS PubMed.
- F. Liu, W. P. Deng, Y. Zhang, S. G. Ge, J. H. Yua and X. R. Song, Anal. Chim. Acta, 2014, 818, 46 CrossRef CAS PubMed.
- H. B. Habtamu, M. Sentic, M. Silvestrini, L. D. Leo, T. Not, S. Arbault, D. Manojlovic, N. Sojic and P. Ugo, Anal. Chem., 2015, 87, 12080 CrossRef CAS PubMed.
- J. G. Lee, K. Yun, G. S. Lim, S. E. Lee, S. Kim and J. K. Park, Bioelectrochemistry, 2007, 70, 228 CrossRef CAS PubMed.
- Q. H. Wang, X. Lin, J. J. Xu, C. Z. Xuan, S. Zhu and Y. Z. Fu, J. Electrochem. Soc., 2016, 163, B373 CrossRef CAS.
- J. J. Zhang, J. T. Cao, G. F. Shi, K. J. Huang, Y. M. Liu and S. W. Ren, Talanta, 2015, 132, 65 CrossRef CAS PubMed.
- Y. L. Cao, R. Yuan, Y. Q. Chai, L. Mao, H. Niu, H. J. Liu and Y. Zhuo, Biosens. Bioelectron., 2012, 31, 305 CrossRef CAS PubMed.
- K. C. Lin and S. M. Chen, J. Electroanal. Chem., 2006, 589, 52 CrossRef CAS.
- X. Y. Jiang, Y. Q. Chai, R. Yuan, Y. L. Cao, Y. F. Chen, H. J. Wang and X. X. Gan, Anal. Chim. Acta, 2013, 783, 49 CrossRef CAS PubMed.
- B. Haghighi and S. Bozorgzadeh, Anal. Chim. Acta, 2011, 697, 90 CrossRef CAS PubMed.
- M. M. Richter, Chem. Rev., 2004, 104, 3003 CrossRef CAS PubMed.
- H. Y. Jia, P. C. Gao, H. M. Ma, D. Wu, B. Du and Q. Wei, Bioelectrochemistry, 2015, 101, 22 CrossRef CAS PubMed.
- Y. G. Sun and C. H. Lei, Angew. Chem., Int. Ed., 2009, 48, 6824 CrossRef CAS PubMed.
- B. Lim, M. J. Jiang, P. H. C. Camargo, E. C. Cho, J. Tao, X. M. Lu, Y. M. Zhu and Y. N. Xia, Science, 2016, 324, 1302 CrossRef PubMed.
- F. Ye, H. Liu, W. W. Hu, J. Y. Zhong, Y. Y. Chen, H. B. Cao and J. Yang, Dalton Trans., 2012, 41, 2898 RSC.
- G. F. Zhang and P. K. Dasgupta, Anal. Chem., 1992, 64, 517 CrossRef CAS.
- T. Xue, S. Jiang, Y. Q. Qu, Q. Su, R. Cheng, S. Dubin, C. Y. Chiu, R. Kaner, Y. Huang and X. F. Duan, Angew. Chem., Int. Ed., 2012, 51, 3822 CrossRef CAS PubMed.
- Z. T. Yang, J. Qian, X. W. Yang, D. Jiang, X. J. Du, K. Wang, H. P. Mao and K. Wang, Biosens. Bioelectron., 2015, 65, 39 CrossRef CAS PubMed.
- Y. J. Guo, L. Deng, J. Li, S. J. Guo, E. K. Wang and S. J. Dong, ACS Nano, 2011, 5, 1282 CrossRef CAS PubMed.
- H. Y. Song, Y. N. Nia and S. Kokot, Anal. Chim. Acta, 2013, 788, 24 CrossRef CAS PubMed.
- Y. Tian, L. Q. Mao, T. Okajima and T. Ohsaka, Anal. Chem., 2002, 74, 2428 CrossRef CAS PubMed.
- H. J. Wang, R. Yuan, Y. Q. Chai, Y. L. Cao, X. X. Gan, Y. F. Chen and Y. Wang, Biosens. Bioelectron., 2013, 43, 63 CrossRef CAS PubMed.
- E. Rosini, G. Molla, C. Rossetti, M. S. Pilone, L. Pollegioni and S. Sacchi, J. Biochem., 2008, 135, 377 CAS.
- C. H. Nieh, Y. Kitazumi, O. Shirai and K. Kano, Biosens. Bioelectron., 2013, 47, 350 CrossRef CAS PubMed.
- J. Li, P. P. Zhou, F. Li, R. Ren, Y. Liu, J. R. Niu, J. X. Ma, X. Y. Zhang, M. Tian, J. Jin and J. T. Ma, J. Mater. Chem. A, 2015, 3, 11261 CAS.
- J. J. Zhang, W. T. Wang, S. H. Chen, Y. Ruo, X. Zhong and X. P. Wu, Biosens. Bioelectron., 2014, 57, 71 CrossRef CAS PubMed.
- B. Y. Xia, H. B. Wu, Y. Yan, X. W. Lou and X. Wang, J. Am. Chem. Soc., 2013, 135, 9480 CrossRef CAS PubMed.
- Y. J. Guo, J. Li and S. J. Dong, Sens. Actuators, B, 2011, 160, 295 CrossRef CAS.
- H. R. Zhang, M. S. Wu, J. J. Xu and H. Y. Chen, Anal. Chem., 2014, 86, 3834 CrossRef CAS PubMed.
- X. Y. Jiang, Y. Q. Chai, H. J. Wang and R. Yuan, Biosens. Bioelectron., 2014, 54, 20 CrossRef CAS PubMed.
- Y. Xiao, V. Pavlov, T. Niazov, A. Dishon, M. Kotler and I. Willner, J. Am. Chem. Soc., 2014, 126, 7430 CrossRef PubMed.
- M. H. Zhang, R. Yuan, Y. Q. Chai, S. H. Chen, H. A. Zhong, C. Wang and Y. F. Cheng, Biosens. Bioelectron., 2012, 32, 288 CrossRef CAS PubMed.
- Q. Xia, Y. H. Huang, X. Lin, S. Zhu and Y. Z. Fu, Biochem. Eng. J., 2016, 113, 1 CrossRef CAS.
- S. Lata, B. Batra and C. S. Pundir, Process Biochem., 2012, 47, 2131 CrossRef CAS.
- V. I. Tishkov and S. V. Khoronenkova, Biochemistry, 2005, 70, 40 CAS.
- L. Pollegioni, G. Molla, S. Sacchi, E. Rosini, R. Verga and M. S. Pilone, Appl. Microbiol. Biotechnol., 2008, 78, 1 CrossRef CAS PubMed.
- X. X. Wu, B. J. V. Wie and D. A. Kidwell, Biosens. Bioelectron., 2004, 20, 879 CrossRef CAS PubMed.
| This journal is © The Royal Society of Chemistry 2018 |

