Lab on a tip: atomic force microscopy – photothermal infrared spectroscopy of atmospherically relevant organic/inorganic aerosol particles in the nanometer to micrometer size range†
Victor W.
Or
 a,
Armando D.
Estillore
 a,
Alexei V.
Tivanski
*b and
Vicki H.
Grassian
 *ac
*ac
aDepartment of Chemistry and Biochemistry, University of California San Diego, La Jolla, CA 92093, USA. E-mail: vhgrassian@ucsd.edu; Tel: +(858)-534-2499
bDepartment of Chemistry, University of Iowa, Iowa City, Iowa 52242, USA. E-mail: alexei-tivanski@uiowa.edu; Tel: +(319)-384-1865
cScripps Institution of Oceanography and Department of Nanoengineering, University of California, San Diego, La Jolla, CA 92093, USA
First published on 28th March 2018
Abstract
New developments in nanoscale analytical techniques have paved the way for detailed spectroscopic and microscopic measurements of substrate-deposited aerosol particles on a single particle basis. Atomic force microscopy based photothermal infrared (AFM-PTIR) spectroscopy is a technique that combines the nanometer spatial resolution of AFM with the chemical analysis capabilities of vibrational IR spectroscopy. Herein we demonstrate the capability of AFM-PTIR to investigate single and multi-component systems comprised of inorganic salts and organic compounds relevant to the atmosphere. Chemical and microscopic characterization of individual particles as small as 50 nm in diameter is shown. Moreover, single particle spectro-microscopic characterization as a function of relative humidity using this technique is shown for the first time. These new measurements as a function of relative humidity allow for the simultaneous and independent acquisition of photothermal IR spectra, contact resonance frequency shifts, and water uptake growth factors, providing insight on changes in the composition, stiffness, and size of the particles, respectively. These results lay the foundation for more detailed AFM-PTIR studies of multicomponent aerosol particles under a range of environmental conditions.
1. Introduction
Earth's atmosphere contains suspended liquid and solid particles called aerosols, which are directly emitted from a variety of sources (primary aerosols) or formed in the atmosphere through gas-to-particle conversion processes (secondary aerosols).1–3 The interaction of atmospheric aerosols with solar radiation is complex, and the quantitative impacts of aerosols on climate and environment have many uncertainties due to different physicochemical properties such as their size, reactivity, and affinity to interact with water vapor to form clouds.4–7 In addition, human exposure to aerosol particles have been linked to a variety of health effects.8–12Several recent field campaigns report variation in the chemical composition and morphology of individual particles, which reflects diversity in particle emission sources.13–17 A single aerosol particle typically consists of a mixture of components; with many aerosols containing both organic compounds and inorganic salts. The presence of organic compounds within inorganic salt aerosols in a mixed state can strongly alter the chemical reactivity and physical properties of the aerosol.18 Thus, increasing interest has been placed on studying the composition, morphology, and phase state of aerosol particles comprised of both organic compounds and inorganic salts. Adding to this complexity, the components within the particle can vary in mixing states, resulting in different internal and external morphologies and corresponding phase states.19–21 Morphology, phase, and chemical composition are the vital links to understanding the impacts of aerosol particles in the atmosphere, and there is a need for detailed studies of individual particles under realistic atmospheric conditions.
Atomic force microscopy (AFM) is an attractive and non-destructive method that permits visualization of the microscopic details of a particle with nanoscale spatial resolution at ambient conditions.22,23Table 1 summarizes some of the important recent advances by Tivanski, Grassian and co-workers in using AFM to investigate atmospherically relevant particles including accurate measurements of particle size, three-dimensional (3D) structure, morphology, phase, 3D growth factors, organic to salt volume fraction ratio for mixed particles, and surface tension force measurements as a function of relative humidity.24–27 While AFM can probe the structural detail and physicochemical properties of individual atmospheric particles, it cannot directly provide chemical information about the particle. What remains a grand challenge in aerosol research is the simultaneous measurements of the chemical composition, morphology, and properties of individual aerosol particle especially in the nanometer size range, a size regime important for atmospheric chemistry,28 health and climate.29,30
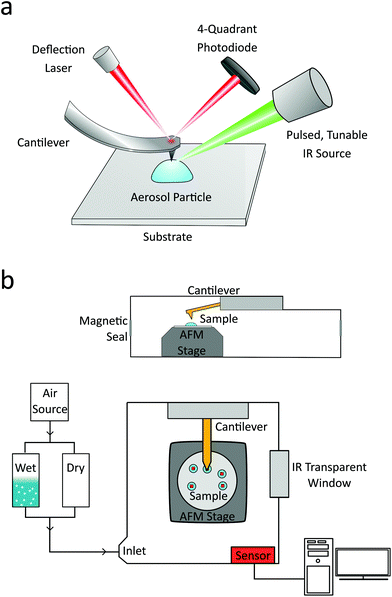
Atomic force microscopy based photothermal infrared (AFM-PTIR) spectroscopy is a photothermal induced resonance (PTIR) technique that combines the high spatial resolution of AFM with the chemical analysis capabilities of vibrational spectroscopy.31–33 Briefly, the technique converts thermal expansion which originates from the absorption of infrared radiation, into cantilever displacement, generating a signal proportional to the amount of IR light absorbed. Because the displacement measured is localized to the cantilever tip, AFM-PTIR allows chemical analysis with spatial resolution well below the diffraction limit. AFM-PTIR has been successfully employed in various fields, including polymers, life, medical, and material sciences.31 More recently, Bondy et al. have demonstrated AFM-PTIR spectroscopy to investigate atmospherically relevant aerosol particles, but noted issues such as low deflection signal from photothermal particle expansion, especially for small particles below 200 nm, and differing peak-to-peak ratios compared to Fourier Transform Infrared (FTIR) spectroscopy.34
Thus, there remains a need to further develop AFM-PTIR spectroscopy as a quantitative tool for analysing substrate-deposited aerosol particles. Herein, we use AFM-PTIR to measure the particle morphology and the associated chemical information of several model aerosol particles on a single particle basis. We present results for the infrared spectroscopic characterization of single component aerosol particles, including ammonium sulfate (AS) particles as small as 50 nm in diameter. Such small size range is important due to relatively high abundance of particles below 100 nm in the troposphere and their importance as cloud condensation nuclei and ice nucleators.29,35,36 In addition, we provide similar characterization of particles as large as 2.6 microns in diameter. Previous studies have shown supermicron sized particles contribute to a significant fraction of total ice nucleators (IN).35 To further demonstrate AFM-PTIR as a technique for studying particles comprised of components that vary in both chemical and physical properties, we present results for two component model aerosols comprised of an organic compound, (pimelic acid (PA) and glucose) and an inorganic salt, (sodium chloride and ammonium sulfate). These were selected as important model systems of tropospheric aerosol particles which are comprised of sea salt, inorganic sulfates, dicarboxylic acids, and saccharides. We also show results for collecting AFM-PTIR images and spectra of a single particle as a function of relative humidity for the first time. A summary table of the advancement in capabilities for aerosol studies using the AFM-PTIR method is provided in Table 1. When compared to a stand-alone AFM, AFM-PTIR spectroscopy gives information on the samples mechanical and spectroscopic changes that can be coupled with the imaging and tip-probe measurements from AFM to give a more complete picture of the behaviour of aerosol particles in the submicron size regime.
2. Experimental Methods
2.1. Materials
All chemicals used were purchased directly from the manufacturers, utilized without further purification, and included ammonium sulfate ((NH4)2SO4, >99%, Fischer Scientific), sodium chloride (NaCl, ≥99%, Fischer Scientific), glucose (C6H12O6, ≥99.0%, Sigma-Aldrich), sodium nitrate (NaNO3, ≥99%, Sigma-Aldrich), pimelic acid (C7H12O4, ≥99.0%, Sigma-Aldrich). Single component aerosol particles were generated from a 0.5 or 1% wt/v aqueous solution using ultrapure water prepared on site (Thermo, Barnsted EasyPure-II; ≥18.2 MΩ cm resistivity). Aqueous solutions of compounds (and 1![[thin space (1/6-em)]](https://www.rsc.org/images/entities/char_2009.gif) :
:![[thin space (1/6-em)]](https://www.rsc.org/images/entities/char_2009.gif) 1 wt% mixtures) listed above were atomized (TSI Inc., model 3076) to generate the aerosol particles. The aerosol particles were then sent through two diffusion dryers (TSI Inc., model 3062) at a flow rate of 1.5 lpm to reduce the RH to ca. 5% RH. Zinc sulfide (ZnS) and Si wafer sampling substrates (Ted Pella) were used to collect the aerosol particles by mounting the substrate in front of an electrostatic classifier (TSI Inc., model 3080) for 1–10 min. Due to the thickness of the ZnS substrate, samples could not fit in a MOUDI or CASCADE size selector. For relative humidity studies, hydrophobic substrates were prepared by cleaning Si wafer sampling substrates with isopropanol and coating in commercially available Rain-X.37,38
1 wt% mixtures) listed above were atomized (TSI Inc., model 3076) to generate the aerosol particles. The aerosol particles were then sent through two diffusion dryers (TSI Inc., model 3062) at a flow rate of 1.5 lpm to reduce the RH to ca. 5% RH. Zinc sulfide (ZnS) and Si wafer sampling substrates (Ted Pella) were used to collect the aerosol particles by mounting the substrate in front of an electrostatic classifier (TSI Inc., model 3080) for 1–10 min. Due to the thickness of the ZnS substrate, samples could not fit in a MOUDI or CASCADE size selector. For relative humidity studies, hydrophobic substrates were prepared by cleaning Si wafer sampling substrates with isopropanol and coating in commercially available Rain-X.37,38
2.2. Atomic force microscopy – photothermal infrared spectroscopy
Samples were analyzed using a commercial nanoIR2 microscopy system (Anasys Instruments, Santa Barbara, CA, USA). The instrument consists of an atomic force microscope integrated with a pulsed, tunable infrared optical parametric oscillator (OPO) laser source with repetition rate of 1 kHz, tuning range of 850 to 2000 cm−1 and 2235 to 3600 cm−1, and an average spectral resolution of 4 cm−1. The sample is irradiated with a pulsed IR laser radiation in a top-down fashion, as shown in Fig. 1a, with a spot size of ∼30 μm. The pulsed radiation is selectively absorbed by the sample, causing rapid and transient thermal expansion, which is locally detected by the resulting mechanical deflection change of the AFM probe. The deflection signal is divided by the background level of the IR source at each wavenumber to remove effects of power variation, and PTIR spectra are produced by plotting the resulting signal as a function of wavenumber. Under these typical conditions, acquiring a single PTIR spectrum over an individual particle takes approximately 10 minutes. For this study, to minimize damage to the particle, the OPO laser was operated at the lowest power that provided resolvable spectra, up to a maximum of 0.08 mW (0.9–3.0% power). Particle damage in a pure organic particle was not spectrally observable until the laser power reached 0.16 mW, as shown in Fig. S1 (see the ESI†).AFM imaging of the laboratory generated aerosol particles were conducted at T = 298 K, and relative humidity (RH) of ∼10–20% at ambient pressure. AFM images at a scan rate of 0.5 Hz using gold-coated silicon nitride probes (tip radius <30 nm) with 0.07–0.4 and 1–7 N m−1 spring constants, and 13 ± 4 and 75 ± 15 kHz resonant frequencies, in contact mode or tapping mode, respectively. Both probes have a lateral resolution of greater than 30 nm and allow for PTIR spectra acquisition, but vary in their imaging potential. In contact mode, the probe is left in contact with the sample and moved to a user-defined region, whereas in tapping mode, the probe is moved to a user defined location and then brought into contact with the sample. The probe is held in contact with the sample throughout the PTIR spectrum acquisition (loading force ∼0.3–6.0 nN.) The contact mode probe allows for chemical and contact frequency mapping, whereas the tapping mode probe generates phase images. Photo-thermal IR spectra were collected with a spectral resolution of at least 8 cm−1, averaging 128 laser pulses per wavenumber. All spectra shown were taken on a single point on the particle, without any averaging of spectra or smoothing filters applied. Unless denoted otherwise, spectra were collected at the highest point of the particle. Single wavenumber chemical maps are obtained by fixing the IR source to a single wavelength and irradiating the sample as the AFM raster scans. Chemical maps were collected at a scan rate of 0.05 Hz, averaging 16 times per pixel. For the water uptake measurements, the AFM head and the aerosol sample were contained within an environmental chamber system (Anasys Instruments, Santa Barbara, CA, USA) equipped with humidity and temperature sensor, a schematic of which is shown in Fig. 1b. The RH was adjusted by varying the ratio of wet and dry air controlled by a commercial dry air generator (Nano Purification Solutions, model NDC-600), across the range from 0 to 90% RH. RH sensor (Sensirion) inside the sample chamber was used to monitor the RH to within ±1%.
2.3. FTIR measurements: multi-analysis aerosol reactor
The FTIR extinction measurements of aerosol particles were performed on a Multi-Analysis Aerosol Reactor System (MAARS). Details of this apparatus have been described previously.39,40 Briefly, the instrument is equipped with an aerosol generator, RH sensors, an IR extinction chamber with a path length of 78 cm which is positioned along the path of the IR beam (Thermo-Nicolet spectrometer, Nexus Model 670) equipped with a nitrogen liquid cooled MCT-A detector.2.4. Volume equivalent diameters for substrate deposited particles and three-dimensional growth factors
To account for any particle deformation from impaction, aerosol particles sizes are reported as the diameter (D) of a sphere with equivalent volume (V).Following the method used by Morris et al.,41 volume growth factors determined by AFM were quantified by taking the ratio of the volume equivalent diameters for the particle at a particular RH to that of the dry particle.41
3. Results and discussion
3.1. Single-component
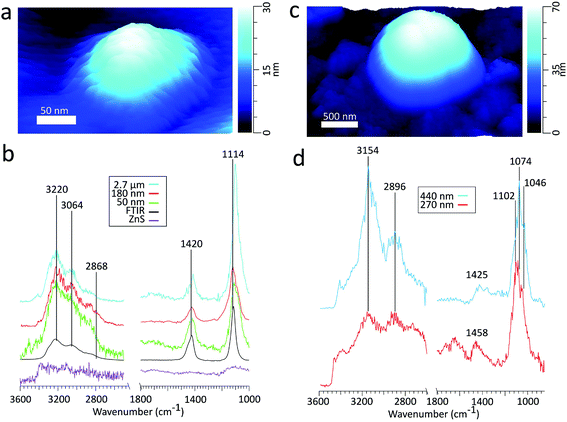 | ||
| Fig. 2 (a) 3D height image of an ammonium sulfate particle on ZnS substrate with a volume equivalent diameter of 50 nm (b) comparison of the spectra obtained by FTIR (black) to PTIR for particles with volume equivalent diameters of varying sizes and the ZnS substrate. The peak frequencies in the figure correspond to the 180 nm sized particle. There is some variability in the peak frequencies, detailed in Table 2. (c) 3D height image of a glucose particle on ZnS substrate with a volume equivalent diameter of 270 nm. (d) PTIR spectra of glucose particles of varying sizes, denoted by the volume equivalent diameter. | ||
| Vibration | ν (cm−1) | ||||
|---|---|---|---|---|---|
| PTIR | |||||
| 2.7 μm | 180 nm | 110 nm | 50 nm | FTIR | |
| ν 3(SO42−) | 1100 | 1120 | 1109 | 1112 | 1124 |
| ν 4(NH4+) | 1412 | 1424 | 1426 | 1420 | 1420 |
| ν 3(NH4+) | 2864 | 2868 | 2860 | 2860 | 2860 |
| 3074 | 3064 | 3074 | 3064 | 3036 | |
| 3224 | 3220 | 3224 | 3216 | 3230 | |
ν
4(NH4+)![[thin space (1/6-em)]](https://www.rsc.org/images/entities/char_2009.gif) : :![[thin space (1/6-em)]](https://www.rsc.org/images/entities/char_2009.gif) ν3(SO42−) ν3(SO42−) |
1![[thin space (1/6-em)]](https://www.rsc.org/images/entities/char_2009.gif) : :![[thin space (1/6-em)]](https://www.rsc.org/images/entities/char_2009.gif) 5.0 5.0 |
1![[thin space (1/6-em)]](https://www.rsc.org/images/entities/char_2009.gif) : :![[thin space (1/6-em)]](https://www.rsc.org/images/entities/char_2009.gif) 3.1 3.1 |
1![[thin space (1/6-em)]](https://www.rsc.org/images/entities/char_2009.gif) : :![[thin space (1/6-em)]](https://www.rsc.org/images/entities/char_2009.gif) 2.1 2.1 |
1![[thin space (1/6-em)]](https://www.rsc.org/images/entities/char_2009.gif) : :![[thin space (1/6-em)]](https://www.rsc.org/images/entities/char_2009.gif) 1.9 1.9 |
1![[thin space (1/6-em)]](https://www.rsc.org/images/entities/char_2009.gif) : :![[thin space (1/6-em)]](https://www.rsc.org/images/entities/char_2009.gif) 2.4 2.4 |
Table 2 compares peak intensity ratios between ν4(NH4+) and ν3(SO42−) vibrational modes across the various sized particles in PTIR and the FTIR spectra. The PTIR spectra for submicron particles yields ν4(NH4+)![[thin space (1/6-em)]](https://www.rsc.org/images/entities/char_2009.gif) :
:![[thin space (1/6-em)]](https://www.rsc.org/images/entities/char_2009.gif) ν3(SO42−) peak ratios of 1
ν3(SO42−) peak ratios of 1![[thin space (1/6-em)]](https://www.rsc.org/images/entities/char_2009.gif) :
:![[thin space (1/6-em)]](https://www.rsc.org/images/entities/char_2009.gif) 3.1, 1
3.1, 1![[thin space (1/6-em)]](https://www.rsc.org/images/entities/char_2009.gif) :
:![[thin space (1/6-em)]](https://www.rsc.org/images/entities/char_2009.gif) 2.1, and 1
2.1, and 1![[thin space (1/6-em)]](https://www.rsc.org/images/entities/char_2009.gif) :
:![[thin space (1/6-em)]](https://www.rsc.org/images/entities/char_2009.gif) 1.9 for the 180, 110, and 50 nm diameter particles, respectively. The ratios for the submicron particles (1
1.9 for the 180, 110, and 50 nm diameter particles, respectively. The ratios for the submicron particles (1![[thin space (1/6-em)]](https://www.rsc.org/images/entities/char_2009.gif) :
:![[thin space (1/6-em)]](https://www.rsc.org/images/entities/char_2009.gif) 2.4 ± 0.9) are comparable to the peak ratio of 1
2.4 ± 0.9) are comparable to the peak ratio of 1![[thin space (1/6-em)]](https://www.rsc.org/images/entities/char_2009.gif) :
:![[thin space (1/6-em)]](https://www.rsc.org/images/entities/char_2009.gif) 2.4 obtained for the FTIR spectra of an ensemble of particles. However, when examining the supermicron size regime, the 2.7 μm diameter particle gives a ν4(NH4+)
2.4 obtained for the FTIR spectra of an ensemble of particles. However, when examining the supermicron size regime, the 2.7 μm diameter particle gives a ν4(NH4+)![[thin space (1/6-em)]](https://www.rsc.org/images/entities/char_2009.gif) :
:![[thin space (1/6-em)]](https://www.rsc.org/images/entities/char_2009.gif) ν3(SO42−) peak ratio of 1
ν3(SO42−) peak ratio of 1![[thin space (1/6-em)]](https://www.rsc.org/images/entities/char_2009.gif) :
:![[thin space (1/6-em)]](https://www.rsc.org/images/entities/char_2009.gif) 5.0, much larger than that of the submicron sized particles. Because PTIR signal depends on both the sample thickness and the absorbed energy per unit area (Uabs),43 this deviation may be attributed to the nonlinearity of the PTIR technique beyond 1 μm in sample thickness and also differences in the power absorbed by the AS particle between the two wavelengths. Signal intensity at a given wavelength has been found to increase linearly with sample thickness up to ∼1200 μm, and continues to increase nonlinearly with increasing thickness until reaching a wavelength dependent maximum.44 The nonlinear behavior has been attributed to the exponentially decaying electric field in the sample at greater thicknesses. Additionally, in the supermicron particle, deviations in ν4(NH4+)
5.0, much larger than that of the submicron sized particles. Because PTIR signal depends on both the sample thickness and the absorbed energy per unit area (Uabs),43 this deviation may be attributed to the nonlinearity of the PTIR technique beyond 1 μm in sample thickness and also differences in the power absorbed by the AS particle between the two wavelengths. Signal intensity at a given wavelength has been found to increase linearly with sample thickness up to ∼1200 μm, and continues to increase nonlinearly with increasing thickness until reaching a wavelength dependent maximum.44 The nonlinear behavior has been attributed to the exponentially decaying electric field in the sample at greater thicknesses. Additionally, in the supermicron particle, deviations in ν4(NH4+)![[thin space (1/6-em)]](https://www.rsc.org/images/entities/char_2009.gif) :
:![[thin space (1/6-em)]](https://www.rsc.org/images/entities/char_2009.gif) ν3(SO42−) peak ratios may arise from differences between the Uabs by the two vibrational modes, where Uabs is expected to be greater at ν3(SO42−) mode due to a larger absorption coefficient and penetration depth relative to the ν4(NH4+) mode.45 Thus, even in the size regime where peak intensity growth is linear, the rate of growth may differ between the two vibrational modes. Comparing the relative intensities of these peaks with the ν3(NH4+) mode is less straightforward due to the difference in the pulsed laser sources used in the two different regions.
ν3(SO42−) peak ratios may arise from differences between the Uabs by the two vibrational modes, where Uabs is expected to be greater at ν3(SO42−) mode due to a larger absorption coefficient and penetration depth relative to the ν4(NH4+) mode.45 Thus, even in the size regime where peak intensity growth is linear, the rate of growth may differ between the two vibrational modes. Comparing the relative intensities of these peaks with the ν3(NH4+) mode is less straightforward due to the difference in the pulsed laser sources used in the two different regions.
Examining the PTIR spectrum for the 50 nm diameter AS particle, distinct peaks are present at ν3(NH4+)(3230, 3036, 2860 cm−1), ν4(NH4+) (1420 cm−1), and ν3(SO42−) (1112 cm−1). The high signal from all vibrational modes suggests that chemical characterization can be conducted for particles on the sub-50 nm scale. AFM-PTIR spectroscopy is highly suitable for morphological and chemical characterization of particles around the size regimes necessary for both cloud condensation nuclei (CCN) and IN studies, where we demonstrate the capability to image and characterize particles across several magnitudes of atmospherically relevant size ranges.
| Vibration | ν (cm−1) | |
|---|---|---|
| PTIR | Literature46 | |
| ν(CO) + ν (CC) | 1046, 1074, 1102 | 1025, 1050, 1111 |
| δ(CH2) + δ(OCH) + δ(CCH) | 1425, 1458 | 1382 |
| ν as (CH) | 2896 | 2913 |
| ν s (CH) | 2952 | 2944 |
| ν(OH) | 3144, 3408 | 3003, 3410 |
3.2. Two-component mixed organic compounds and inorganic salts
![[thin space (1/6-em)]](https://www.rsc.org/images/entities/char_2009.gif) :
:![[thin space (1/6-em)]](https://www.rsc.org/images/entities/char_2009.gif) 1 glucose
1 glucose![[thin space (1/6-em)]](https://www.rsc.org/images/entities/char_2009.gif) :
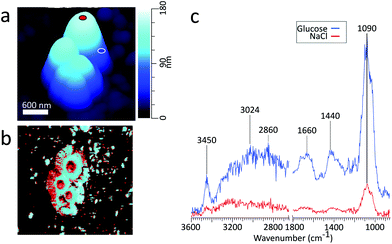
:![[thin space (1/6-em)]](https://www.rsc.org/images/entities/char_2009.gif) NaCl mass ratio.26Fig. 3c shows the PTIR spectra taken at two phase separated locations on the particle. The spectrum corresponding to the glucose-rich core corresponds well with the PTIR spectrum of the 270 nm glucose particle in Fig. 2d. Similar to the glucose particle, the broad peak at 1660 cm−1 is indicative of water content in the glucose-rich shell. The spectrum for the IR inactive NaCl-rich core shows significantly less intensity than that of the IR active glucose-rich shell. However, some signal from the core can be attributed to a thin layer of organic coating. Detection of thin organic coatings is possible, albeit less intense peaks are much less resolvable. While point spectra are useful for identifying species, it does not provide an explicit description of the spatial distribution of chemical species. AFM-PTIR provides single wavenumber chemical maps of materials with nanometer spatial resolution by irradiating the sample with the IR source tuned to a single wavelength throughout the AFM scan. Mapping wave numbers were selected by examining PTIR spectra for absorption frequencies exclusive or predominant for one region. A separate particle was imaged (Fig. 4a) and a chemical map was acquired at 1090 cm−1, shown in Fig. 4b. In the chemical map, a majority of the signal at 1090 cm−1 arises from the ν(CO) + ν(CC) modes of the organic-rich glucose crown of the particle, while the IR inactive ZnS substrate and sodium chloride rich core remain relatively inactive. Compared to single-point spectra, chemical maps have far lower S/N, which is due to the significantly lower co-averaging used in chemical mapping, and thus was unable to detect any thin film organic coating on the NaCl-rich core. To obtain monolayer level sensitivity, more sophisticated methods such as resonance-enhanced AFM-PTIR are required.47 AFM-PTIR chemical maps excel by providing nanoscale spatial distributions of chemical species. In previous studies, AFM analysis of organic volume fractions from AFM phase images operated under the assumption that the particle core is the inorganic component and the shell is the organic component.26 With chemical maps, we explicitly demonstrate the organic and inorganic richness of the core and partially engulfing shell respectively.
NaCl mass ratio.26Fig. 3c shows the PTIR spectra taken at two phase separated locations on the particle. The spectrum corresponding to the glucose-rich core corresponds well with the PTIR spectrum of the 270 nm glucose particle in Fig. 2d. Similar to the glucose particle, the broad peak at 1660 cm−1 is indicative of water content in the glucose-rich shell. The spectrum for the IR inactive NaCl-rich core shows significantly less intensity than that of the IR active glucose-rich shell. However, some signal from the core can be attributed to a thin layer of organic coating. Detection of thin organic coatings is possible, albeit less intense peaks are much less resolvable. While point spectra are useful for identifying species, it does not provide an explicit description of the spatial distribution of chemical species. AFM-PTIR provides single wavenumber chemical maps of materials with nanometer spatial resolution by irradiating the sample with the IR source tuned to a single wavelength throughout the AFM scan. Mapping wave numbers were selected by examining PTIR spectra for absorption frequencies exclusive or predominant for one region. A separate particle was imaged (Fig. 4a) and a chemical map was acquired at 1090 cm−1, shown in Fig. 4b. In the chemical map, a majority of the signal at 1090 cm−1 arises from the ν(CO) + ν(CC) modes of the organic-rich glucose crown of the particle, while the IR inactive ZnS substrate and sodium chloride rich core remain relatively inactive. Compared to single-point spectra, chemical maps have far lower S/N, which is due to the significantly lower co-averaging used in chemical mapping, and thus was unable to detect any thin film organic coating on the NaCl-rich core. To obtain monolayer level sensitivity, more sophisticated methods such as resonance-enhanced AFM-PTIR are required.47 AFM-PTIR chemical maps excel by providing nanoscale spatial distributions of chemical species. In previous studies, AFM analysis of organic volume fractions from AFM phase images operated under the assumption that the particle core is the inorganic component and the shell is the organic component.26 With chemical maps, we explicitly demonstrate the organic and inorganic richness of the core and partially engulfing shell respectively.
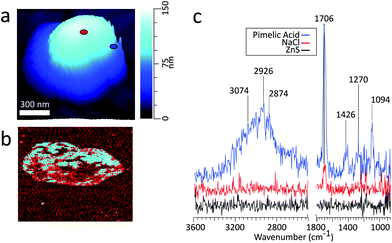
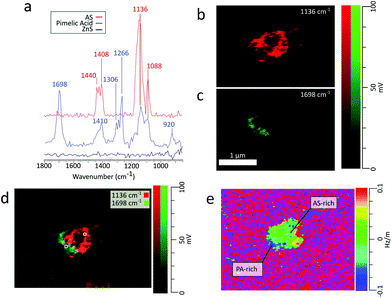
AFM-PTIR provides single wavenumber chemical maps of materials with nanometer spatial resolution by irradiating the sample with the IR source tuned to a single wavelength throughout the AFM scan. Mapping wavenumbers were selected by examining PTIR spectra for absorption frequencies exclusive or predominant for one region. The asymmetric sulfate stretch (1136 cm−1) and carbonyl stretch (1698 cm−1) were used to map for regions rich in pimelic acid and ammonium sulfate respectively, shown in Fig. 6b and c The most intensely absorbing regions arise from two distinct regions within the particle. This separation is more visible with an RGB overlay of the two maps in Fig. 6d which reveals a partially engulfed morphology. This chemical separation is consistent with cryo-TEM observations that observed phase separation between two species, but could not provide direct chemical distinction.49 Chemical maps provide information on the distribution of chemical species and morphological assemblies, giving chemical context to the morphological and physical properties observed in other microscopy techniques.32
Frequency maps are simultaneously collected with chemical maps, which plot the contact resonant frequency of the cantilever as a function of spatial position, giving insight into differences in viscoelastic properties across a single particle. The contact resonance frequency for a given oscillation mode is dependent on the sample's mechanical properties, shifting to higher values as the stiffness or viscosity of the sample increases.32 The dependency of these shifts on the sample's mechanical properties is similar to that of phase shifts in AFM tapping mode. Fig. 6e shows a ratio of the frequency to height images of the particle using the 1136 cm−1 frequency mapping. The ratio of the images was taken to show contrast the particle contact resonance frequency from the ZnS substrate. The ZnS substrate is IR transparent, so the substrate region shows no absorption features. Importantly, the collection of chemical and frequency maps is simultaneous and independent. Therefore, frequency maps can be compared directly with chemical maps to correlate chemical and mechanical properties. However, to obtain enough signal to extract physical properties from frequency mappings, the regions of interest must be IR active. Examining the frequency map acquired at 1698 cm−1, shown in Fig. S6 (see the ESI†), reveals contact resonant frequencies for only the pimelic acid region of the particle. The region corresponding to ammonium sulfate has no IR active vibrational modes around 1696 cm−1 and gives no spectral features.
3.3. Hygroscopic studies: growth factors and spectroscopic signatures for water uptake
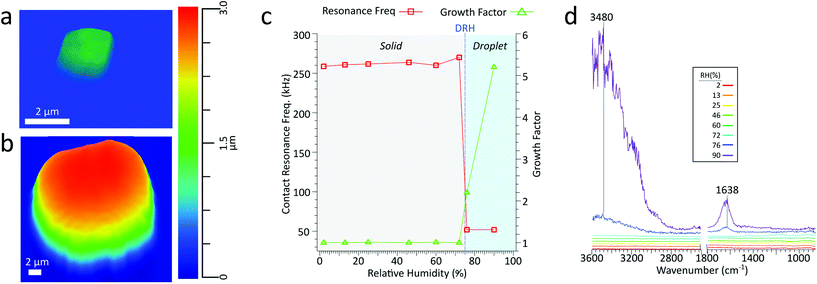
Extensive work has been done in measuring the water uptake of aerosol particles by using AFM to measure physical and morphological changes, such as surface tension, and growth factors. Currently, growth factors are the most straightforward metric for quantifying water uptake in AFM, where a single deposited particle is imaged at incrementally higher RH levels and the spherical diameter equivalent growth is calculated. NaCl is a well-studied system with a known deliquescence relative humidity (DRH) of 75.1 ± 1%.50 For inorganic salts such as NaCl, prior to deliquescence there is no uptake of water vapor, and subsequently, there should be no change in particle size. Upon deliquescing, the phase changes from solid particle to aqueous droplet and should be accompanied by a significant increase in size and a corresponding decrease in viscosity.Fig. 7a and b show a 1.3 μm dry volume equivalent diameter NaCl particle at 2% and 90% RH, respectively. Upon deliquescing, the particle grows in size and changes from a crystalline cubic solid to a droplet. Fig. 7c shows the growth factor and contact resonance frequency as a function of RH. Before the DRH, there is minimal change in growth factor and contact resonance frequency. However, above the DRH, a significant increase in the growth factor (1.0 to 2.2) and a concomitant decrease in the contact resonance frequency (260 to 52 kHz), respectively, indicating that the particle has significantly increased in size and decreased in viscosity. Particle growth continues with increased water uptake at higher RH levels, the growth factor increases to 5.2. However, from 76% to 90% RH, there is no decrease in contact resonance frequency. Fig. 7d shows the PTIR spectra taken at increasing RH. Prior to the DRH of NaCl, at 75%, there is no absorbance from the IR inactive NaCl. Above the DRH, we observe the growth of two prominent absorbance bands at 1638 and 3480 cm−1, the O–H bending and stretching modes, respectively, indicative of water absorption by the particle. In agreement with an increase in growth factor, the intensity of these two modes increases with increased water uptake at higher RH levels. Thus, we can conduct hygroscopic studies via single-particle measurements of particle size, stiffness, and chemical composition. While these results are for a supermicron sized NaCl particle, they lay the foundation for conducting similar studies in the submicron size regime, wherein, we can simultaneously observe changes in morphology, mechanical properties, and physical–chemical properties as a function of water vapor concentration.
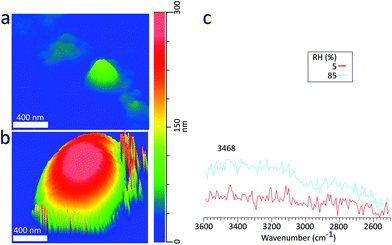
To demonstrate PTIR spectra acquisition for deliquescence studies involving submicron sized particles, Fig. 8c shows PTIR spectra taken on a sodium chloride with a 135 nm dry volume equivalent diameter at 5% (red) and 85% RH (blue), with corresponding height images in Fig. 8a and b respectively. Beyond the DRH of NaCl, we still observe the stretching (3468 cm−1) modes of the absorbed water. However, the lower intensity O–H bending mode was not discernible from noise. Similar to the supermicron-sized particle, at 85% RH we observe a 3D GF of 2.9, but no decrease in contact resonance frequency, which may occur due to the smaller particle size or contact with the substrate. The size dependence of this resonance frequency shift will be examined in more detail in future studies.
3.4. Sample interactions with an IR active substrate
As infrared irradiation is not selective only to the aerosol particles, whenever the particle of interest is irradiated, the substrate also interacts with the incoming light. With an IR inactive substrate such as ZnS, there are no spectral deformations from the substrate absorbing IR light, but this differs when working with IR active substrates. Substrate thermal diffusivity, substrate–sample interactions, and substrate–IR radiation interactions are all potential issues that could result in particle deformations and spectral distortions. These concerns are especially important when working with an IR active substrate and increasingly smaller substrate deposited aerosol particles, which can be tens of nanometers in thickness. With smaller and subsequently thinner particles, potential interferences from the substrate absorbing IR light may arise. The thickness threshold for these interferences can be expected to vary between particles (and substrates) comprised of different chemical compositions and physical properties. As a preliminary assessment, sodium nitrate particles were deposited on a silicon wafer, SiO2, which have a known absorbance around 1050 cm−1.51 Sodium nitrate has a known absorbance at roughly 1360 cm−1,52 and was chosen due to the absence of any vibrational modes near 1100 cm−1, making the presence of any substrate absorbances noticeably apparent.For a reference, Fig. 9a shows the PTIR spectra of NaNO3 in red and the substrate in black and Fig. 9b shows the PTIR spectra for particles of varying thickness. Below 200 nm thickness, there is a clear absorbance band from the substrate at 1100 cm−1. While these impacts may be negligible for larger particles, when probing smaller particles, interference from an IR active substrate can produce noticeable spectral defects via substrate absorbance modes. In the 100 nm thick particle, the intensity of substrate and particle modes are comparable. Interestingly, in the 50 nm thick particle, no signatures from the particle were detectable. These defects were avoided in this study due to use of one (or a combination) of the following – an IR transparent substrate (ZnS), particle thickness much greater than 200 nm, or irradiating in spectral regions excluding the substrate absorption modes.
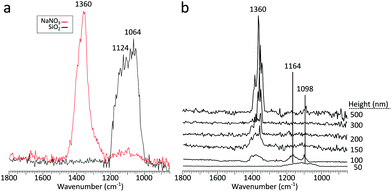 | ||
| Fig. 9 (a) PTIR spectra obtained on a NaNO3 particle (red) and silicon substrate (black), (b) PTIR spectra taken for particles of varying height. | ||
4. Conclusions
This study demonstrates AFM-PTIR spectroscopy to simultaneously measure the physicochemical and morphological properties of sub- and supermicron individual aerosol particles. The spectral information provided via single-particle AFM-PTIR spectroscopy is in a reasonably good agreement with traditional methods such as bulk FTIR. Moreover, we show that AFM-PTIR spectroscopy is a useful method to study multicomponent aerosol particles via chemical and frequency maps that provide high spatial resolution information on the spatial distribution of chemical species and their subsequent mechanical properties. We also show the chemical characterization of particles as small as 50 nm in diameter, as well as particles as large as 6.6 μm in diameter. The nanoscale resolution of AFM-PTIR allows us to study not only submicron sized particles interacting with water vapor but also interactions between water vapor and different regions within a single particle, which is vital for linking chemical composition to hygroscopic properties that describe the ability for an aerosol particle to act as effective CCN. Future hygroscopic studies with AFM-PTIR will focus on examining localized changes within a single multicomponent aerosol particle, wherein we can compare the behaviour of different components in response to reactive gas uptake and water vapor.Conflicts of interest
There are no conflicts to declare.Acknowledgements
The authors would like to thank Eoghan Dillon from Anasys Instruments and Professor Andrew Ault at the University of Michigan for helpful discussions. This work was supported by the National Science Foundation through the Centers for Chemical Innovation Program under Grant CHE1305427. The contents of this study do not necessarily reflect the official views of the National Science Foundation. NSF does not endorse the purchase of the commercial products used in this report.References
- U. Pöschl, Angew. Chem., Int. Ed., 2005, 44, 7520–7540 CrossRef PubMed.
- V. F. McNeill, Annu. Rev. Chem. Biomol. Eng., 2017, 8, 427–444 CrossRef CAS PubMed.
- M. Hallquist, J. C. Wenger, U. Baltensperger, Y. Rudich, D. Simpson, M. Claeys, J. Dommen, N. M. Donahue, C. George, A. H. Goldstein, J. F. Hamilton, H. Herrmann, T. Hoffmann, Y. Iinuma, M. Jang, M. E. Jenkin, J. L. Jimenez, A. Kiendler-Scharr, W. Maenhaut, G. McFiggans, T. F. Mentel, A. Monod, A. S. H. Prévôt, J. H. Seinfeld, J. D. Surratt, R. Szmigielski and J. Wildt, Atmos. Chem. Phys., 2009, 9, 5155–5236 CrossRef CAS.
- N. Mahowald, D. S. Ward, S. Kloster, M. G. Flanner, C. L. Heald, N. G. Heavens, P. G. Hess, J.-F. Lamarque and P. Y. Chuang, Annu. Rev. Environ. Resour., 2011, 36, 45–74 CrossRef.
- T. S. Bates, T. L. Anderson, T. Baynard, T. Bond, O. Boucher, G. Carmichael, A. Clarke, C. Erlick and H. Guo, Atmos. Chem. Phys., 2006, 6, 1657–1732 CrossRef CAS.
- N. Mahowald, D. S. Ward, S. Kloster, M. G. Flanner, C. L. Heald, N. G. Heavens, P. G. Hess, J.-F. Lamarque and P. Y. Chuang, Annu. Rev. Environ. Resour., 2011, 36, 45–74 CrossRef.
- M. O. Andreae, Nature, 2001, 409, 671–672 CrossRef CAS PubMed.
- A. Nel, Science, 2005, 308, 804–806 CrossRef CAS PubMed.
- M. Subramanian, Nature, 2016, 534, 166–169 CrossRef CAS PubMed.
- M. Shiraiwa, K. Ueda, A. Pozzer, G. Lammel, C. J. Kampf, A. Fushimi, S. Enami, A. M. Arangio, J. Fröhlich-Nowoisky, Y. Fujitani, A. Furuyama, P. S. J. Lakey, J. Lelieveld, K. Lucas, Y. Morino, U. Pöschl, S. Takahama, A. Takami, H. Tong, B. Weber, A. Yoshino and K. Sato, Environ. Sci. Technol., 2017, 51, 13545–13567 CrossRef CAS PubMed.
- K. Reinmuth-Selzle, C. J. Kampf, K. Lucas, N. Lang-Yona, J. Fröhlich-Nowoisky, M. Shiraiwa, P. S. Lakey, S. Lai, F. Liu, A. T. Kunert, K. Ziegler, F. Shen, R. Sgarbanti, B. Weber, I. Bellinghausen, J. Saloga, M. G. Weller, A. Duschl, D. Schuppan and U. Pöschl, Environ. Sci. Technol., 2017, 51, 4119–4141 CrossRef CAS PubMed.
- J. Schmale, D. Shindell, E. Von Schneidemesser, I. Chabay and M. Lawrence, Nature, 2014, 515, 335–337 CrossRef CAS PubMed.
- S. China, C. Mazzoleni, K. Gorkowski, A. C. Aiken and M. K. Dubey, Nat. Commun., 2013, 4, ncomms3122 Search PubMed.
- R. E. Cochran, O. Laskina, J. V. Trueblood, A. D. Estillore, H. S. Morris, T. Jayarathne, C. M. Sultana, C. Lee, P. Lin, J. Laskin, A. Laskin, J. A. Dowling, Z. Qin, C. D. Cappa, T. H. Bertram, A. V. Tivanski, E. A. Stone, K. A. Prather and V. H. Grassian, Chem, 2017, 2, 655–667 CAS.
- K. A. Prather, T. H. Bertram, V. H. Grassian, G. B. Deane, M. D. Stokes, P. J. DeMott, L. I. Aluwihare, B. P. Palenik, F. Azam, J. H. Seinfeld, R. C. Moffet, M. J. Molina, C. D. Cappa, F. M. Geiger, G. C. Roberts, L. M. Russell, A. P. Ault, J. Baltrusaitis, D. B. Collins, C. E. Corrigan, L. A. Cuadra-Rodriguez, C. J. Ebben, S. D. Forestieri, T. L. Guasco, S. P. Hersey, M. J. Kim, W. F. Lambert, R. L. Modini, W. Mui, B. E. Pedler, M. J. Ruppel, O. S. Ryder, N. G. Schoepp, R. C. Sullivan and D. Zhao, Proc. Natl. Acad. Sci. U. S. A., 2013, 110, 7550–7555 CrossRef CAS PubMed.
- P. K. Quinn, D. B. Collins, V. H. Grassian, K. A. Prather and T. S. Bates, Chem. Rev., 2015, 115, 4383–4399 CrossRef CAS PubMed.
- L. M. Russell, R. Bahadur and P. J. Ziemann, Proc. Natl. Acad. Sci. U. S. A., 2011, 108, 3516–3521 CrossRef CAS PubMed.
- M. O. Andreae and A. Gelencsér, Atmos. Chem. Phys., 2006, 6, 3131–3148 CrossRef CAS.
- N. O. A. Kwamena, J. Buajarern and J. P. Reid, J. Phys. Chem. A, 2010, 114, 5787–5795 CrossRef CAS PubMed.
- J. P. Darr, S. Q. Davis, Y. Kohno, K. McKenna and P. Morales, J. Aerosol Sci., 2014, 77, 158–167 CrossRef CAS.
- M. Song, C. Marcolli, U. K. Krieger, D. M. Lienhard and T. Peter, Faraday Discuss., 2013, 165, 289 RSC.
- G. Binnig, C. F. Quate and C. Gerber, Phys. Rev. Lett., 1986, 56, 930–933 CrossRef PubMed.
- V. H. Grassian, J. Phys. Chem. Lett., 2015, 6, 3880–3881 CrossRef CAS PubMed.
- X. Wang, C. M. Sultana, J. Trueblood, T. C. Hill, F. Malfatti, C. Lee, O. Laskina, K. A. Moore, C. M. Beall, C. S. McCluskey, G. C. Cornwell, Y. Zhou, J. L. Cox, M. A. Pendergraft, M. V. Santander, T. H. Bertram, C. D. Cappa, F. Azam, P. J. DeMott, V. H. Grassian and K. A. Prather, ACS Cent. Sci., 2015, 1, 124–131 CrossRef CAS PubMed.
- H. D. Lee, A. D. Estillore, H. S. Morris, K. K. Ray, A. Alejandro, V. H. Grassian and A. V. Tivanski, J. Phys. Chem. A, 2017, 121, 8269–8305 Search PubMed.
- A. D. Estillore, H. S. Morris, V. W. Or, H. D. Lee, M. R. Alves, M. A. Marciano, O. Laskina, Z. Qin, A. V. Tivanski and V. H. Grassian, Phys. Chem. Chem. Phys., 2017, 19, 21101–21111 RSC.
- H. D. Lee, K. K. Ray and A. V. Tivanski, Anal. Chem., 2017, 89, 12720–12726 CrossRef CAS PubMed.
- T. Hoffmann, R. J. Huang and M. Kalberer, Anal. Chem., 2011, 83, 4649–4664 CrossRef CAS PubMed.
- U. Dusek, G. P. Frank, L. Hildebrandt, J. Curtius, J. Schneider, S. Walter, D. Chand, F. Drewnick, S. Hings, D. Jung, S. Borrmann and M. O. Andreae, Science, 2006, 312, 1375–1378 CrossRef CAS PubMed.
- I. Riipinen, T. Yli-Juuti, J. R. Pierce, T. Petäjä, D. R. Worsnop, M. Kulmala and N. M. Donahue, Nat. Geosci., 2012, 5, 453–458 CrossRef CAS.
- A. Dazzi, C. B. Prater, Q. Hu, D. B. Chase, J. F. Rabolt and C. Marcott, Appl. Spectrosc., 2012, 66, 1365–1384 CrossRef CAS PubMed.
- A. Dazzi and C. B. Prater, Chem. Rev., 2017, 117, 5146–5173 CrossRef CAS PubMed.
- A. Centrone, Annu. Rev. Anal. Chem., 2015, 8, 101–126 CrossRef CAS PubMed.
- A. L. Bondy, R. M. Kirpes, R. L. Merzel, K. A. Pratt, M. M. Banaszak Holl and A. P. Ault, Anal. Chem., 2017, 89, 8594–8598 CrossRef CAS PubMed.
- P. J. DeMott, A. J. Prenni, X. Liu, S. M. Kreidenweis, M. D. Petters, C. H. Twohy, M. S. Richardson, T. Eidhammer and D. C. Rogers, Proc. Natl. Acad. Sci. U. S. A., 2010, 107, 11217–11222 CrossRef CAS PubMed.
- G. C. Roberts, D. A. Day, L. M. Russell, E. J. Dunlea, J. L. Jimenez, J. M. Tomlinson, D. R. Collins, Y. Shinozuka and A. D. Clarke, Atmos. Chem. Phys., 2010, 10, 6627–6644 CrossRef CAS.
- K. J. Baustian, M. E. Wise and M. A. Tolbert, Atmos. Chem. Phys., 2010, 10, 2307–2317 CrossRef CAS.
- H. S. Morris, V. H. Grassian and A. V. Tivanski, Chem. Sci., 2015, 6, 3242–3247 RSC.
- P. K. Hudson, E. R. Gibson, M. A. Young, P. D. Kleiber and V. H. Grassian, Aerosol Sci. Technol., 2007, 41, 701–710 CrossRef CAS.
- E. R. Gibson, P. K. Hudson and V. H. Grassian, J. Phys. Chem. A, 2006, 110, 11785–11799 CrossRef CAS PubMed.
- H. S. Morris, A. D. Estillore, O. Laskina, V. H. Grassian and A. V. Tivanski, Anal. Chem., 2016, 88, 3647–3654 CrossRef CAS PubMed.
- D. D. Weis and G. E. Ewing, J. Geophys. Res., 1996, 101, 709–720 Search PubMed.
- A. Dazzi, F. Glotin and R. Carminati, J. Appl. Phys., 2010, 107, 124519 CrossRef.
- B. Lahiri, G. Holland and A. Centrone, Small, 2013, 9, 439–445 CrossRef CAS PubMed.
- M. E. Earle, R. G. Pancescu, B. Cosic, A. Y. Zasetsky and J. J. Sloan, J. Phys. Chem. A, 2006, 110, 13022–13028 CrossRef CAS PubMed.
- M. Ibrahim, M. Alaam, H. El-Haes, A. F. Jalbout and A. De Leon, Ecletica Quim., 2006, 31, 15–21 CrossRef CAS.
- F. Lu, M. Jin and M. A. Belkin, Nat. Photonics, 2014, 8, 307–312 CrossRef CAS.
- K. Ito and H. J. Bernstein, Can. J. Chem., 1956, 34, 170–178 CrossRef CAS.
- D. P. Veghte, D. R. Bittner and M. A. Freedman, Anal. Chem., 2014, 86, 2436–2442 CrossRef CAS PubMed.
- I. N. Tang and H. R. Munkelwitz, Atmos. Environ., Part A, 1993, 27, 467–473 CrossRef.
- I. W. Boyd and J. I. B. Wilson, J. Appl. Phys., 1982, 53, 4166–4172 CrossRef CAS.
- R. Newman, J. Chem. Phys., 1952, 20, 444–446 CrossRef CAS.
Footnote |
| † Electronic supplementary information (ESI) available. See DOI: 10.1039/C8AN00171E. The data used to generate the figures and conclusions in this paper are included in a dataset hosted by the UCSD Library Digital Collections DOI: 10.6075/J0F47MBF |
| This journal is © The Royal Society of Chemistry 2018 |

