Improved water oxidation under visible light on oxyhalide Bi4MO8X (M = Nb, Ta; X = Cl, Br) photocatalysts prepared using excess halogen precursors†
Received
28th February 2018
, Accepted 27th March 2018
First published on 30th March 2018
Abstract
We herein report the synthesis of a series of Bi-based oxyhalides, Bi4MO8X (M = Nb, Ta; X = Cl, Br), via solid-state reaction at different calcination temperatures and using various precursor ratios to improve their photocatalytic activity for water oxidation under visible light. The calcination temperature employed had an influence on the crystallite sizes, morphologies, specific surface areas, and surface compositions. Interestingly, when stoichiometric precursors were heated at higher temperatures, the crystallite sizes of Bi4MO8X decreased with cleavage occurring along the in-plane direction. Elemental analysis indicated that the unusual trend in Bi4MO8X can be explained by the volatile nature of halogen at higher temperatures. The volatilization of the halogen species was minimized when an excess of the halogen precursor BiOX was employed. The Bi4MO8X samples prepared with excess BiOX exhibited considerably higher photocatalytic activities for water oxidation under visible light, due to the suppressed halogen defects at which recombination of photogenerated carriers can occur. These findings offer a useful insight into the preparation of active oxyhalide photocatalysts.
Introduction
Visible-light-induced water splitting using semiconductor photocatalysts has attracted significant attention due to the potential for clean hydrogen (H2) production using abundant solar light.1–3 Over the past decade, various mixed-anion compounds such as oxynitrides,4–7 oxysulfides,8 and oxyhalides9 have been studied extensively as promising photocatalyst materials for visible-light-induced water splitting since one can expect that the higher energy p-orbitals of non-oxide anions (e.g., N-2p, S-3p, Br-4p, and I-5p) elevate their valence band maximum (VBM) values and consequently decrease the bandgaps.10 However, the majority of these compounds suffer from self-oxidative deactivation during water oxidation, in which the photogenerated holes oxidize the non-oxide anions themselves (e.g., 2N3− + 6h+ → N2) instead of water molecules.11 A number of efforts have been made to circumvent such oxidative deactivation, but they mostly concern surface modifications such as loading some cocatalysts.12,13
Very recently, we have demonstrated that a series of oxyhalides, Bi4MO8X (Fig. 1, M = Nb, Ta; X = Cl, Br), with a Sillén–Aurivillius perovskite phase can function as stable O2-evolving photocatalysts under visible-light irradiation.14,15 It was revealed that the VBMs in Bi4MO8X consist mainly of O-2p orbitals, instead of Cl-3p or Br-4p, while their levels are located at much more negative positions than those of usual oxides or oxychlorides.14 DFT calculations have visualized a fairly strong hybridization between Bi-6s orbitals and O-2p orbitals, which explains why the O-2p orbitals are elevated in energy.15 A Madelung site potential analysis further revealed that the upward shift of the valence band lies in the oxygen site in the fluorite-based [Bi2O2] layer.16 Since O2− anions are relatively stable, photogenerated holes populated at the O-2p orbitals will not lead to self-decomposition but to the oxidation of water.
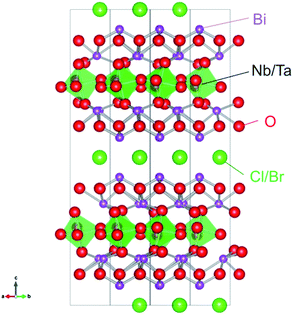 |
| | Fig. 1 Crystal structure of Bi4MO8X (M = Nb, Ta; X = Cl, Br). | |
It is well recognized that the rational design of photocatalyst surfaces, in addition to the tuning of bulk properties such as bandgaps, is of particular importance for achieving optimal photocatalyst activities.17–23 For example, the activity of perovskite-type oxide photocatalysts, i.e., MTaO3 (M = Li, Na, or K), for overall water splitting (i.e., simultaneous generation of H2 and O2) under UV light is greatly enhanced by the addition of excess (5–10%) alkaline precursor in the solid-state reaction at high temperatures, as this addition effectively produces a favorable surface morphology of particles for efficient charge separation and water oxidation.24 However, such attempts on oxyhalide particles have been limited. While some oxyhalides (e.g., BiOX) are prepared via soft-chemical methods in solution, the preparation of Bi4MO8X requires high temperature solid state reaction. In our previous study, Bi4MO8X particles were obtained by heating a stoichiometric mixture of precursors in a sealed quartz tube under vacuum at 1073 K. Neither detailed surface analysis nor morphology optimization for improving activity was examined.
Here we report the preparation of Bi4MO8X (M = Nb, Ta; X = Cl, Br) over a range of calcination temperatures and precursor ratios to understand the influence of the physicochemical properties such as surface morphology and composition on the photocatalytic activity. The aim of this study is to gain insight into the strategy for improving the activity of oxyhalide photocatalysts in general.
Experimental
Sample synthesis
Particulate samples of Bi4MO8X (M = Nb, Ta; X = Cl, Br) were prepared via solid state reactions,25,26 with stoichiometric precursors (denoted as BMOX) or with the addition of an excess of the halogen precursor (denoted as ex-BMOX). For the preparation of Bi4NbO8Cl and Bi4TaO8Cl with stoichiometric precursors (denoted as BNOC and BTOC, respectively), a stoichiometric mixture of Bi2O3 (Wako Pure Chemical Industries, Ltd., 99.99%), BiOCl (Wako Pure Chemical Industries, Ltd., 99.9%), and Nb2O5 (Wako Pure Chemical Industries, Ltd., 99.9%) for BNOC or Ta2O5 (Wako Pure Chemical Industries, Ltd., 99.9%) for BTOC was pelletized and evacuated in a quartz tube. The quartz tube was sealed with a high-temperature flame and then heated in an electrical furnace at a set temperature between 973 and 1173 K for 20 h. For the preparation of samples with an excess amount of a chloride precursor, 5, 10 or 15 mol% excess of BiOCl was added to the stoichiometric mixture, and the resulting mixture was pelletized and heated in a similar manner. The samples obtained from 5 mol% excess BiOCl will be denoted as ex-BNOC and ex-BTOC. The Bi4NbO8Br and Bi4TaO8Br samples were synthesized in a similar manner but by using home-made BiOBr particles prepared via a soft liquid deposition method as described elsewhere.24 Bi(NO3)3·5H2O (5 mmol, Wako Pure Chemical Industries, Ltd., 99.9%) was dissolved in ethanol (30 mL), and a solution of KBr (5 mmol, Wako Pure Chemical Industries, Ltd., 99.9%) dissolved in Milli-Q water (10 mL) was added to the above solution. The resulting solution was then stirred for 5 h at 298 K to give a precipitate, which was subsequently filtered, washed with water several times, and dried at 353 K for 5 h. The Bi4NbO8Br and Bi4TaO8Br samples prepared using a stoichiometric ratio will be denoted as BNOB and BTOB, respectively, while those prepared using 5 mol% excess of BiOBr will be denoted as ex-BNOB and ex-BTOB, respectively. For comparison, some samples were prepared by adding 5% excess of KCl, KBr or Bi2O3 in place of BiOCl or BiOBr.
Characterization
The prepared samples were characterized by powder X-ray diffraction (XRD; MiniFlex II, Rigaku, Cu Kα), scanning electron microscopy (SEM; NVision 40, Carl Zeiss-SIINT), UV-visible diffuse reflectance spectroscopy (V-650, Jasco), energy-dispersive X-ray spectroscopy (EDX; X-max, Oxford Instruments), and X-ray photoelectron spectroscopy (XPS; ESCA5500, ULVAC-PHI; Mg Kα). The XPS binding energies for each sample were corrected with reference to the C 1s peak of the carbon impurity (284.8 eV). Angle-resolved XPS (ARXPS) measurements were performed by controlling the take-off angle, which is defined as the angle between the plane of the surface and the analyzer axis. The lattice parameters were determined by Le Bail analysis using the Jana2006 program.27 The specific surface areas of the samples were determined by Brunauer–Emmett–Teller (BET) measurements (BELSORP-mini II, MicrotracBEL Corp.) at liquid nitrogen temperature.
Photocatalytic reactions
Photocatalytic O2 evolution was carried out using a Pyrex glass reactor. A portion of the photocatalyst powder (0.1 g) was suspended in a solution of AgNO3 (123 mL, 5 mM, without pH adjustment). Prior to starting the photocatalytic reaction, the suspension was purged with Ar gas for more than 30 min to remove the dissolved air. Then, the suspension was irradiated using a 300 W Xe lamp fitted with a cut-off filter (λ > 400 nm). The evolved O2 gas was detected by means of an on-line gas chromatograph (Agilent MicroGC 3000A) equipped with a thermal conductivity detector (TCD) and an MS-5A column. Ar was employed as the carrier gas.
Results and discussion
Influence of calcination temperature on Bi4MO8X particles
Fig. 2 and 3 show the XRD patterns of BMOX and ex-BMOX samples prepared at various temperatures. The solid-state reaction at 973–1173 K yielded an almost pure orthorhombic phase of Bi4MO8X with space group P21cn,25,26 while lower temperature reactions provided small unassignable peaks. In addition, no variation in lattice constants owing to changing calcination temperature was observed for the BMOX samples (Fig. S1†). As shown in Fig. 2a, upon increasing the calcination temperature to obtain BNOC, the intensity of the XRD peak corresponding to the (00l) reflection increased, indicating that BNOC adopts the preferred c-axis orientation following calcination at high temperatures. The ex-BMOX samples were also obtained as pure phases when reacted at 1073 and 1173 K (Fig. 2 and 3). Although excess BiOX (X = Cl, Br) was employed as the halogen precursor, no XRD peaks for BiOX were observed in ex-BMOX (i.e., the powder samples obtained by the pulverization of the pellet). As shown in Fig. S2,† white BiOX crystals were attached to the inner wall of the quartz-tube, along with a small amount of yellow Bi4MO8X particles.
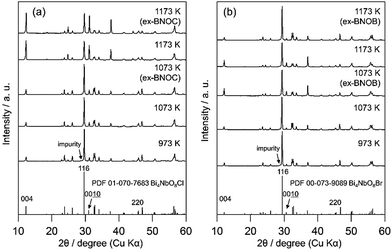 |
| | Fig. 2 XRD patterns of the (a) BNOC and ex-BNOC, and (b) BNOB and ex-BNOB samples calcined between 973 and 1173 K. | |
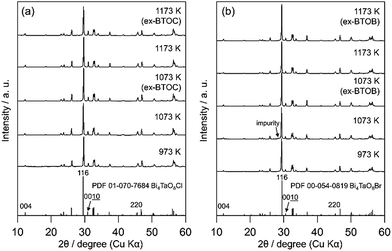 |
| | Fig. 3 XRD patterns of the (a) BTOC and ex-BTOC, and (b) BTOB and ex-BTOB samples calcined between 973 and 1173 K. | |
Fig. 4 summarizes the estimated crystallite sizes for layer (c-axis) and in-plane (ab-axis) directions, which were estimated on the basis of the Scherrer equation using diffraction peaks attributable to  and (220), respectively (eqn (1)).
| |  | (1) |
where
τ,
κ,
λ,
β and
θ indicate the crystallite size (nm), shape factor (0.94 assumed to be cubic particles), X-ray wavelength (nm), full width at half maximum (rad) and Bragg angle (degree), respectively. The estimated crystallite sizes of both BNOX and BTOX samples for the layer direction increased upon increasing the calcination temperature up to 1173 K. The estimated crystallite sizes for the in-plane direction also increased with increasing temperature up to 1073 and 1123 K for BNOX and BTOX, respectively. However, they decreased obviously at higher temperatures. Note that this decrease in the crystal size for the in-plane direction at higher temperatures was much more noticeable for niobium compounds, BNOX, than for tantalum ones, BTOX. The reduction in crystallite size upon increasing the calcination temperature is unprecedented. In metal oxides such as SrTiO
3 and WO
3,
17,28 the crystallite sizes basically increase with increasing calcination temperature due to crystal growth. The decreased crystallite sizes for the in-plane direction estimated from the (220) peaks, especially for BNOX samples at above 1073 K, suggest cleavage along the in-plane direction at high temperatures.
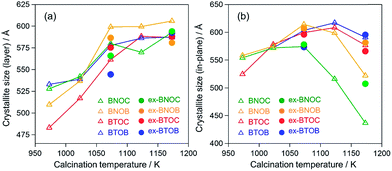 |
| | Fig. 4 Crystallite sizes for (a) layer and (b) in-plane directions estimated using the  and (220) peaks in the XRD patterns of the BMOX and ex-BMOX samples calcined between 973 and 1173 K. and (220) peaks in the XRD patterns of the BMOX and ex-BMOX samples calcined between 973 and 1173 K. | |
As seen in Fig. 5, the particle size of the dominant BNOC particles was obviously increased from several hundred nanometers to 1–2 μm with increasing temperature from 973 to 1073 K; however, a number of small and plate-like particles emerged after calcination at 1073 K. The fraction of such small particles increased considerably in the sample prepared at 1173 K, along with an appreciable reduction in size of dominant BNOC particles. The same tendency was observed for BNOB samples (Fig. S3†). Although such small particles at high temperatures were also observed for BTOX (see Fig. S4 and S5†), the effect was less prominent compared to BNOX (see Fig. 5). The change in the BET specific surface area (Table 1) also supports the destruction of particles at high temperatures. This phenomenon is not so simple because both growth and destruction of crystals should proceed simultaneously. Up to 1073 K, the specific surface areas of BNOX reduced slightly and then drastically increased at higher temperatures. On the other hand, such an effect was much less prominent in BTOX (Table 1). Note that the crystal growth along the c axis proceeds on both BNOX and BTOX particles as the temperature is increased, as seen in Fig. 4a where the crystallite sizes for the layer direction increased with increasing calcination temperature.
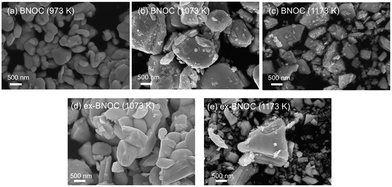 |
| | Fig. 5 SEM images of the BNOC samples calcined at (a) 973 K, (b) 1073 K, and (c) 1173 K, and the ex-BNOC samples calcined at (d) 1073 K and (e) 1173 K. | |
Table 1 BET specific surface areas of the Bi4MO8X samples calcined between 973 and 1173 K
| Temperature |
BET specific surface area/m2 g−1 |
| BNOC |
BNOB |
BTOC |
BTOB |
| 973 K |
1.2 |
1.1 |
1.0 |
0.9 |
| 1023 K |
1.2 |
1.1 |
1.1 |
0.9 |
| 1073 K |
1.4 |
0.6 |
0.9 |
0.9 |
| 1123 K |
1.8 |
1.2 |
0.8 |
1.1 |
| 1173 K |
2.7 |
2.6 |
0.9 |
1.5 |
Effect of addition of excess halogen precursor BiOX
As described above, the elevated calcination temperature of stoichiometric precursors (at above 1073 K) resulted in a reduced crystallite size of BMOX samples, specifically in BNOX ones. The observed trend is unusual since in general higher temperature calcination increases the crystallite size. Such a trend on BMOX may be explained by the volatile nature of the halogen at high temperatures. This speculation led us to employ an excess of the halogen precursor, BiOX, and we found that this effectively suppresses the cleavage of BNOX crystals during calcination at high temperatures, at least to some extent. As seen in Fig. 4b, the crystallite sizes for the in-plane direction of ex-BNOX prepared at 1173 K are considerably larger than those of BNOX. Although the crystallite sizes for the in-plane direction of ex-BNOX estimated by the Scherrer equation are comparable to those of BNOX at 1073 K (Fig. 4b), SEM images indicated that the addition of excess BiOX effectively suppresses the generation of small particles. As for BTOX, the addition of BiOX has a limited influence on the estimated crystallite sizes for the in-plane direction up to 1173 K; however, it actually suppresses the formation of small particles as clearly confirmed by their SEM images. This is supported by the BET surface areas of ex-BMOX compared to the stoichiometric BMOX (Tables 1 and 2). Thus, it can be concluded that the addition of excess BiOX precursor can effectively suppress the cleavage of crystals during calcination at high temperatures. As described in the previous section, no peaks corresponding to BiOX were observed in the XRD patterns of the main products of ex-BMOX, due to the volatile nature of BiOX, as seen on the inner wall of the quartz-tube (Fig. S2†).
Table 2 BET specific surface areas of the ex-BMOX samples calcined at 1073 and 1173 K
| Temperature |
BET specific surface area/m2 g−1 |
| ex-BNOC |
ex-BNOB |
ex-BTOC |
ex-BTOB |
| 1073 K |
1.1 |
0.8 |
1.1 |
1.0 |
| 1173 K |
2.4 |
2.0 |
0.7 |
1.4 |
Fig. 6 shows the UV-vis diffuse reflectance spectra of the BMOX and ex-BMOX samples calcined at 1073 K, where the absorption edges of the BMOX spectra shifted towards longer wavelengths in the order BTOB (∼470 nm) < BTOC (∼480 nm) < BNOB (∼485 nm) < BNOC (∼495 nm). These results are in good agreement with our previous report.15 The absorption edges of the ex-BMOX samples were similar to the corresponding BMOX samples, indicating that the addition of excess BiOX precursor does not interfere with the absorption properties of these materials.
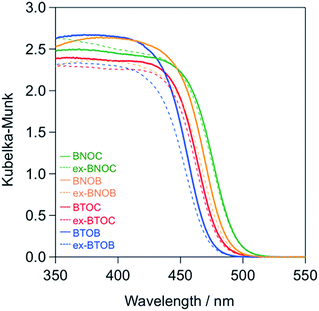 |
| | Fig. 6 UV-vis diffuse reflectance spectra of the BMOX and ex-BMOX samples calcined at 1073 K. | |
Tables 3 and 4 summarize the elemental ratios of halogen/bismuth (X/Bi) in the BMOX and ex-BMOX samples, respectively, as determined by XPS. As seen in Table 3, the X/Bi ratios of all BMOX samples decreased upon increasing the calcination temperature, due to volatilization of the halogen species. These results strongly suggest that the aforementioned changes in morphology and particle size upon increasing the calcination temperature were basically triggered by a release of halogen species. In contrast, the ex-BMOX samples exhibited slightly but appreciably higher X/Bi ratios compared to those of the BMOX samples, strongly suggesting that the use of excess BiOX compensates for the halogen volatilization. On the other hand, the Ta/Bi ratios were almost identical (e.g., Ta/Bi = 0.25 in BTOC samples synthesized at 1073 K with and without excess BiOCl). Although XPS analysis is basically sensitive to the elements that exist at the surface of specimens due to the short escape depth of photoelectrons, the obtained results often include information of the bulk near the surface to some extent. We carried out angle-resolved XPS (ARXPS) measurements to determine the X/Bi ratios near the surface accurately and to evaluate the effect of BiOX addition on the surface composition (i.e., X/Bi ratios). In ARXPS measurements, information from near the surface can be obtained more selectively by decreasing the take-off angle, which is defined as the angle between the plane of the surface and the analyzer axis. Since the ex-BTOC showed drastically improved activity compared to BTOC as will be shown and discussed in the next section, we selected the BTOC and ex-BTOC samples prepared at 1073 K, which respectively exhibited Cl/Bi ratios of 0.24 and 0.25 via normal XPS analysis, for further analysis by ARXPS. As shown in the ARXPS measurements presented in Fig. 7, the Cl/Bi atomic ratio in BTOC decreased significantly upon decreasing the take-off angle. In contrast, only a small decrease in the Cl/Bi ratio was observed in the ex-BTOC sample, suggesting that the surface defects caused by the halogen species were indeed suppressed. These results therefore indicate that volatilization of the halogen species was minimized when an excess of the halogen precursor (i.e., BiOX) was employed during solid-state reaction.
Table 3 Halogen/bismuth (Cl/Bi or Br/Bi) atomic ratios in the BMOX samples calcined between 973 and 1173 K, as determined by XPS
| Temperature |
Cl/Bi or Br/Bi |
| BNOC |
BNOB |
BTOC |
BTOB |
| 973 K |
0.31 |
0.27 |
0.27 |
0.27 |
| 1023 K |
0.31 |
0.27 |
0.25 |
0.26 |
| 1073 K |
0.26 |
0.25 |
0.24 |
0.24 |
| 1123 K |
0.25 |
0.24 |
0.24 |
0.25 |
| 1173 K |
0.24 |
0.22 |
0.20 |
0.23 |
Table 4 Halogen/bismuth (Cl/Bi or Br/Bi) atomic ratios in the ex-BMOX samples calcined at 1073 and 1173![[thin space (1/6-em)]](https://www.rsc.org/images/entities/char_2009.gif) K, as determined by XPS
K, as determined by XPS
| Temperature |
Cl/Bi or Br/Bi |
| ex-BNOC |
ex-BNOB |
ex-BTOC |
ex-BTOB |
| 1073 K |
0.29 |
0.26 |
0.25 |
0.26 |
| 1173 K |
0.27 |
0.23 |
0.25 |
0.24 |
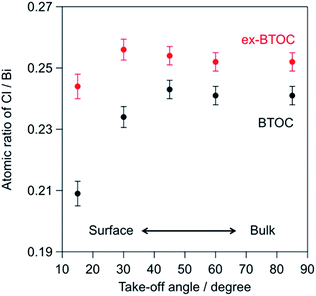 |
| | Fig. 7 Cl/Bi atomic ratios for the BTOC and ex-BTOC samples determined by angle-resolved XPS (ARXPS) measurements. | |
Photocatalytic activity of Bi4MO8X samples for water oxidation under visible light irradiation
Fig. 8 shows the initial rates of O2 evolution on BMOX and ex-BMOX in a 5 mM aqueous AgNO3 solution under visible light irradiation (λ > 400 nm). As for the BMOX samples prepared from stoichiometric precursors, the rates of O2 evolution increased with increasing calcination temperature from 973 to 1073 K, likely due to enhanced crystal growth (see Fig. 4). However, upon increasing the calcination temperature above 1073 K, the O2 evolution rate decreased to a lesser or greater degree; the decrease is more prominent in chloride-containing samples (BNOC and BTOC). The lower activity at higher temperatures is likely due to the formation of crystal defects attributed to volatilization of the halogen species and/or cleavage of crystals. Such crystal defects have been reported to trap photoexcited electrons and accelerate the recombination between electrons and holes, occasionally lowering the photocatalytic activity.29,30 Thus, the significant enhancement of photocatalytic activity occurred with a decrease of anion defects in the present BMOX samples, although the opposite phenomenon, i.e., defects accelerating photocatalytic reaction, also happens.31,32
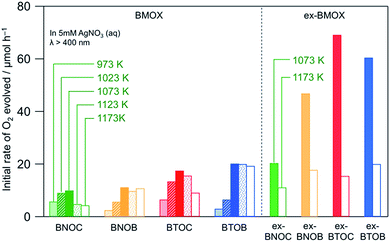 |
| | Fig. 8 Initial rates of O2 evolution over various BMOX and ex-BMOX samples in an aqueous AgNO3 solution (5 mM) under visible light irradiation (λ > 400 nm). | |
Importantly, all ex-BMOX photocatalysts, which were prepared with 5 mol% excess of BiOX, exhibited higher rates of O2 evolution than the corresponding BMOX samples when compared at each temperature (1073 or 1173 K). More specifically, the ex-BTOC sample calcined at 1073 K exhibited the highest activity, with the apparent quantum yield (AQY) for O2 evolution being ∼2.3% at 420 nm in an aqueous AgNO3 solution. This value was substantially higher than that of BTOC (∼0.8%) under the same reaction conditions. It was therefore assumed that the generation of halogen (and/or oxygen to some extent) defects was suppressed through the use of excess BiOX during preparation, thus enhancing the photocatalytic activity. O2 generation continuously proceeded as seen in an example of ex-BTOC (Fig. S6†). Although we note that the rate of O2 formation gradually decreased, this is likely due to light shading by Ag deposited via oxidation of Ag+ as previously reported.14 It was difficult to obtain reliable XPS data to estimate the Cl/Bi ratio after photocatalytic reaction with the Ag+ electron acceptor because Ag metal species coated the surface of BMOX. However, we previously investigated the photostability of BMOX using a photoelectrochemical method in Na2SO4 solution, where the Cl/Bi ratio remained almost unchanged.15 To gain further insight into the effect of an excess of the halogen precursor, the excess quantity of BiOCl was varied between 0 and 15 mol%, and the corresponding photocatalytic activities were measured, paying particular attention to the effect on the ex-BTOC sample calcined at 1073 K. Although the rates of O2 evolution increased upon increasing the excess halogen quantity from 0 to 5 mol%, the rate decreased slightly with a further increase from 5 to 15 mol% (Table S1†). In addition, analysis by XPS and EDX indicated almost no change in the Cl/Bi atomic ratio at excess quantities >5 mol% (Table S1†). Furthermore, other ex-BTOC samples were also synthesized using excess KCl to evaluate the effects of an alternative halogen precursor. As shown in Fig. S7,† BTOC prepared in the presence of excess KCl exhibited a higher rate of O2 evolution (26 μmol h−1) than the BTOC sample prepared using a stoichiometric halogen ratio (18 μmol h−1), although this rate was significantly lower than that of the BTOC sample prepared in the presence of excess BiOCl (69 μmol h−1). A similar trend was also observed for the BTOB sample prepared in the presence of excess KBr. On the other hand, the additional Bi2O3 precursor in the synthesis of BTOX samples did not increase the O2 evolution rate, strongly suggesting that the excess amount of Bi in the samples is not the main reason for the improved photocatalytic activity when using excess BiOX precursors. We can therefore conclude that the addition of excess halogen species during preparation enhanced the photocatalytic activity of these materials regardless of the halogen precursor, while the addition of BiOX is the most effective at present. Another important finding is that BTOX generally exhibited a higher photocatalytic activity than BNOX at any calcination temperature independent of the use of excess halogen precursor, in spite of the shorter absorption edges of BTOX compared to BNOX, implying that BTOX possesses greater potential as an efficient O2-evolving photocatalyst.
Conclusions
We reported the synthesis of a series of Bi-based oxyhalides (i.e., Bi4MO8X; M = Nb, Ta; X = Cl, Br) over a range of calcination temperatures and precursor ratios to examine the effect of these variables on the activity of oxyhalide photocatalysts for water oxidation under visible light. Following evaluation of the crystallite sizes, morphologies, specific surface areas, and surface compositions of the products, it was revealed that the photocatalytic activities of the various Bi4MO8X samples were significantly affected by the calcination temperature, likely due to the volatilization of halogen species present in these materials at high temperatures. Such volatilization results in the formation of defects on the surface and in the bulk, which can act as recombination centers of photogenerated carriers and consequently reduce the rate of O2 evolution. Thus, we found that ex-BMOX samples prepared using an excess of halogen precursors exhibited superior photocatalytic activities for the oxidation of water under visible light compared to the BMOX samples prepared using a stoichiometric ratio of precursors. Furthermore, the use of a suitable halogen precursor was essential to suppress the formation of halogen defects during calcination. The findings reported in the present study are expected to offer a useful insight into the preparation of active oxyhalide photocatalysts.
Conflicts of interest
There are no conflicts to declare.
Acknowledgements
This work was supported by CREST (JPMJCR1421) and JSPS KAKENHI (JP17H06439, JP16H06439, JP16H06441, and JP15H03849). The authors are also indebted to the technical division of the Institute for Catalysis, Hokkaido University for their help in building the experimental equipment. This work was partly supported by Japan Society for the Promotion of Science (JSPS) Core-to-Core Program (A) Advanced Research Networks.
Notes and references
- F. E. Osterloh, Chem. Mater., 2008, 20, 35–54 CrossRef CAS.
- R. Abe, J. Photochem. Photobiol., C, 2010, 11, 179–209 CrossRef CAS.
- A. Kudo and Y. Miseki, Chem. Soc. Rev., 2009, 38, 253–278 RSC.
- K. Maeda, K. Teramura, D. Lu, T. Takata, N. Saito, Y. Inoue and K. Domen, Nature, 2006, 440, 295 CrossRef CAS PubMed.
- Y. Lee, H. Terashima, Y. Shimodaira, K. Teramura, M. Hara, H. Kobayashi, K. Domen and M. Yashima, J. Phys. Chem. C, 2007, 111, 1042–1048 CAS.
- C. Pan, T. Takata, M. Nakabayashi, T. Matsumoto, N. Shibata, Y. Ikuhara and K. Domen, Angew. Chem., Int. Ed., 2015, 54, 2955–2959 CrossRef CAS PubMed.
- J. Xu, C. Pan, T. Takata and K. Domen, Chem. Commun., 2015, 51, 7191–7194 RSC.
- A. Ishikawa, T. Takata, J. N. Kondo, M. Hara, H. Kobayashi and K. Domen, J. Am. Chem. Soc., 2002, 124, 13547–13553 CrossRef CAS PubMed.
- J. Li, Y. Yu and L. Zhang, Nanoscale, 2014, 6, 8473 RSC.
- H. Kageyama, K. Hayashi, K. Maeda, J. P. Attfield, Z. Hiroi, J. M. Rondinelli and K. R. Poeppelmeier, Nat. Commun., 2018, 9, 772 CrossRef PubMed.
- A. Kasahara, K. Nukumizu, G. Hitoki, T. Takata, J. N. Kondo, M. Hara, H. Kobayashi and K. Domen, J. Phys. Chem. A, 2002, 106, 6750–6753 CrossRef CAS.
- R. Abe, M. Higashi and K. Domen, J. Am. Chem. Soc., 2010, 132, 11828–11829 CrossRef CAS PubMed.
- M. Higashi, K. Domen and R. Abe, J. Am. Chem. Soc., 2012, 134, 6968–6971 CrossRef CAS PubMed.
- H. Fujito, H. Kunioku, D. Kato, H. Suzuki, M. Higashi, H. Kageyama and R. Abe, J. Am. Chem. Soc., 2016, 138, 2082–2085 CrossRef CAS PubMed.
- H. Kunioku, M. Higashi, O. Tomita, M. Yabuuchi, D. Kato, H. Fujito, H. Kageyama and R. Abe, J. Mater. Chem. A, 2018, 6, 3100–3107 CAS.
- D. Kato, K. Hongo, R. Maezono, M. Higashi, H. Kunioku, M. Yabuuchi, H. Suzuki, H. Okajima, C. Zhong, K. Nakano, R. Abe and H. Kageyama, J. Am. Chem. Soc., 2017, 139, 18725–18731 CrossRef CAS PubMed.
- A. Kudo, J. Catal., 1988, 111, 296–301 CrossRef CAS.
- S. Ikeda, M. Hara, J. N. Kondo, K. Domen, H. Takahashi, T. Okubo and M. Kakihana, Chem. Mater., 1998, 10, 72–77 CrossRef CAS.
- H. Kato, K. Asakura and A. Kudo, J. Am. Chem. Soc., 2003, 125, 3082–3089 CrossRef CAS PubMed.
- K. Maeda, K. Teramura, T. Takata, M. Hara, N. Saito, K. Toda, Y. Inoue, H. Kobayashi and K. Domen, J. Phys. Chem. B, 2005, 109, 20504–20510 CrossRef CAS PubMed.
- K. Maeda and K. Domen, J. Phys. Chem. C, 2007, 111, 7851–7861 CAS.
- K. Maeda, N. Saito, Y. Inoue and K. Domen, Chem. Mater., 2007, 19, 4092–4097 CrossRef CAS.
- K. Maeda, H. Terashima, K. Kase, M. Higashi, M. Tabata and K. Domen, Bull. Chem. Soc. Jpn., 2008, 81, 927–937 CrossRef CAS.
- H. Kato and A. Kudo, J. Phys. Chem. B, 2001, 105, 4285–4292 CrossRef CAS.
- A. M. Kusainova, S. Y. Stefanovich, V. A. Dolgikh, A. V. Mosunov, C. H. Hervoches and P. Lightfoot, J. Mater. Chem., 2001, 11, 1141–1145 RSC.
- A. M. Kusainova, W. Zhou, J. T. S. Irvine and P. Lightfoot, J. Solid State Chem., 2002, 166, 148–157 CrossRef CAS.
- V. Petříček, M. Dušek and L. Palatinus, Z. Kristallogr. - Cryst. Mater., 2014, 229, 345–352 Search PubMed.
- M. Sadakane, K. Sasaki, H. Kunioku, B. Ohtani, R. Abe and W. Ueda, J. Mater. Chem., 2010, 20, 1811 RSC.
- N. Murakami, O. O. P. Mahaney, R. Abe, T. Torimoto and B. Ohtani, J. Phys. Chem. C, 2007, 111, 11927–11935 CAS.
- O.-O. Prieto-Mahaney, N. Murakami, R. Abe and B. Ohtani, Chem. Lett., 2009, 38, 238–239 CrossRef CAS.
- K. Maeda, N. Murakami and T. Ohno, J. Phys. Chem. C, 2014, 118, 9093–9100 CAS.
- F. Amano, M. Nakata, A. Yamamoto and T. Tanaka, J. Phys. Chem. C, 2016, 120, 6467–6474 CAS.
Footnote |
| † Electronic supplementary information (ESI) available: Lattice constants, XRD patterns, SEM images, atomic composition and photocatalytic activities. See DOI: 10.1039/c8se00097b |
|
| This journal is © The Royal Society of Chemistry 2018 |
Click here to see how this site uses Cookies. View our privacy policy here.  a,
Masanobu
Higashi
 a,
Osamu
Tomita
 a,
Hiroshi
Kageyama
 *ab and
Ryu
Abe
 *ab
*ab


 and (220), respectively (eqn (1)).

 and (220) peaks in the XRD patterns of the BMOX and ex-BMOX samples calcined between 973 and 1173 K.
![[thin space (1/6-em)]](https://www.rsc.org/images/entities/char_2009.gif) K, as determined by XPS
K, as determined by XPS


