
 Open Access Article
 This Open Access Article is licensed under a Creative Commons Attribution-Non Commercial 3.0 Unported Licence
Deformation of high density polyethylene by dynamic equal-channel-angular pressing†
Xiangji Wua,
Lin Pub,
Yunfei Xua,
Jinchun Shia,
Xiaoyi Liu a,
Zhengye Zhong*b and
Sheng-Nian Luo*ab
a,
Zhengye Zhong*b and
Sheng-Nian Luo*ab
aThe Peac Institute of Multiscale Sciences, Chengdu, Sichuan 610031, People’s Republic of China. E-mail: sluo@pims.ac.cn
bKey Laboratory of Advanced Technologies of Materials, Ministry of Education, Southwest Jiaotong University, Chengdu, Sichuan 610031, People’s Republic of China. E-mail: zyzhong@pims.ac.cn
First published on 20th June 2018
Abstract
The effect of high strain rate and large shear deformation on the orientation of crystallites in high density polyethylene (HDPE) was investigated with dynamic equal-channel-angular pressing (D-ECAP). The HDPE samples were processed by two loading routes, route A and route C. Grid lines were used to obtain macroscopic strain distributions, which were substantiated by finite element modeling. Owing to the strain rate effect, the number of D-ECAP processing passes has a minor effect on the shear strain accumulations compared to ECAP. D-ECAP leads to a decrease in the thickness of the crystalline stem, and the crystallinity. After route-A or route-C D-ECAP processing, a new monoclinic phase emerges, and two types of crystallographic c-axis orientations appear: the crystallographic c-axis is approximately parallel to the flow direction (FD), or is tilted at approximately 55° clockwise away from FD. However, only one type of crystallographic c-axis orientation is detected after 2 passes of route-C D-ECAP. It is viable to utilize D-ECAP to control the structure and orientation of crystalline polymers, as a complement to ECAP and other processing techniques.
1 Introduction
Over the last several decades, solid-state deformation of semicrystalline polymers has been of sustained interest for the fundamental understanding of deformation mechanisms and for industrial applications. The amorphous phase in semicrystalline polymers is generally believed to deform before its crystalline counterpart.1,2 Interlamellar shear, interlamellar separation, and lamellar stack rotation are the main deformation mechanisms proposed for the amorphous phase.2,3 The crystalline phase deforms as soon as the amorphous phase is fully strained. Crystallographic slip, twinning, and martensitic transformation are considered to be the basic mechanisms for deformation of the crystalline phase,4 among which the most important one is crystallographic slip.5–7 Crystallographic slip has been reported in several semicrystalline polymers.8,9 Twinning and martensitic transformation can facilitate crystallographic slip by changing the positions of crystallites.1Loading plays a key role in the deformation of polymers, especially the deformation rate.10–15 It should be noted that the above-mentioned findings were based on low strain rate deformations. High strain rate responses of polymers have been studied at a strain rate of dε/dt > 1000 s−1 via a split Hopkinson pressure bar, which induces a strain in the range of 0.05 < ε < 0.3.16,17 Here ε denotes strain and t is time. Taylor cylinder impact experiments and dynamic-tensile-extrusion tests can impose large strains (ε > 1) and higher strain rates (dε/dt > 10![[thin space (1/6-em)]](https://www.rsc.org/images/entities/char_2009.gif) 000 s−1) simultaneously in a controlled manner.18,19 However, for better understanding dynamic deformation of polymers, both larger strains and higher strain rates should be explored.
000 s−1) simultaneously in a controlled manner.18,19 However, for better understanding dynamic deformation of polymers, both larger strains and higher strain rates should be explored.
In addition, the above-mentioned investigations mainly focused on tensile and compressive loading. Shear deformation is a basic deformation mode which can produce highly preferred orientations in polymers.20–23 Mechanical properties can be altered considerably in highly textured polymers.24–27
Equal channel angular pressing (ECAP) is an effective way of inducing large shear deformation, and thus transforms coarse-crystalline structures into ultrafine-grained structures in metallic materials.28,29 In ECAP processing, the sample cross section remains constant, and it is possible to accumulate large shear strain via multiple passes. ECAP processing has been applied to many polymers such as PE (polyethylene), PP (polypropylene), PC (polycarbonate), and PET (polyethylene terephthalate) to generate large plastic deformations.20–23,30–33 ECAP can form a uniform morphological feature across the thickness of part of a sample.20,21,28 After ECAP, a large area with a reasonably constant shear strain was observed in the middle of a PP sample.23 Due to the severe shear deformation during ECAP, high shear field leads to either uniaxially or biaxially aligned molecules and micro-domains. At low shear strains (e.g., γ = 0–1.2), the initial spherulites change into ellipsoids during ECAP, but at higher strains (γ is close to 2.0), the spherulites are destroyed, and then macrofibrils aligned along the principal tensile axis are formed.23 X-ray diffraction measurements of high density polyethylene (HDPE), PP and PET showed a bimodal distribution of molecular c-axis and crystallite orientations after ECAP.21,23,32 The bimodal orientations were caused by simultaneous activation of interlamellar shear deformation and chain slip, each leading to the occurrence of a preferred orientation.
Recently, a new method for severe plastic deformation based on equal-channel angular pressing, i.e., dynamic equal-channel-angular pressing (D-ECAP), has been used to process metallic materials.34,35 The most important advantage of D-ECAP is the high strain rate during pressing, which can reach, for example, 10−4–106 s−1, compared to 10−4–10 s−1 for ECAP.34,35 Previous studies verified the high efficiency of the technique, since one or two D-ECAP passes can achieve the same degree of structure refinement as 6–8 ECAP passes.34,36,37 It is also possible to use D-ECAP to deform samples with cross sections larger than those in conventional pressing equipment.34,37 In addition, D-ECAP involves shock waves which may induce structural modifications. However, D-ECAP has been rarely used in the processing of polymers. Since deformation of most polymers depends on strain rate,10–13 the present study explores, as a first study, the deformation of HDPE under a high strain rate and a large shear strain via D-ECAP with different passes and routes.
2 Materials and methods
2.1 Sample preparation and the D-ECAP process
The HDPE raw material was purchased from Quadrant China Inc., and machined into 12 mm × 12 mm × 40 mm blocks in order to fit the D-ECAP or ECAP die.A miniature single-stage gas gun combined with an ECAP die was used for D-ECAP. D-ECAP was performed at room temperature in a 90° L-shaped ECAP die. The geometries of D-ECAP and the samples that underwent testing are described by the load direction (LD), the flow direction (FD), and the transverse direction (TD) (Fig. 1a). The velocity of the striker, measured with a magnetic induction system, was about 140 ms−1. To reduce the friction during pressing, samples were lubricated with dimethyl silicone. The route-A and route-C D-ECAP processes are schematically shown in Fig. 1b and c, respectively.
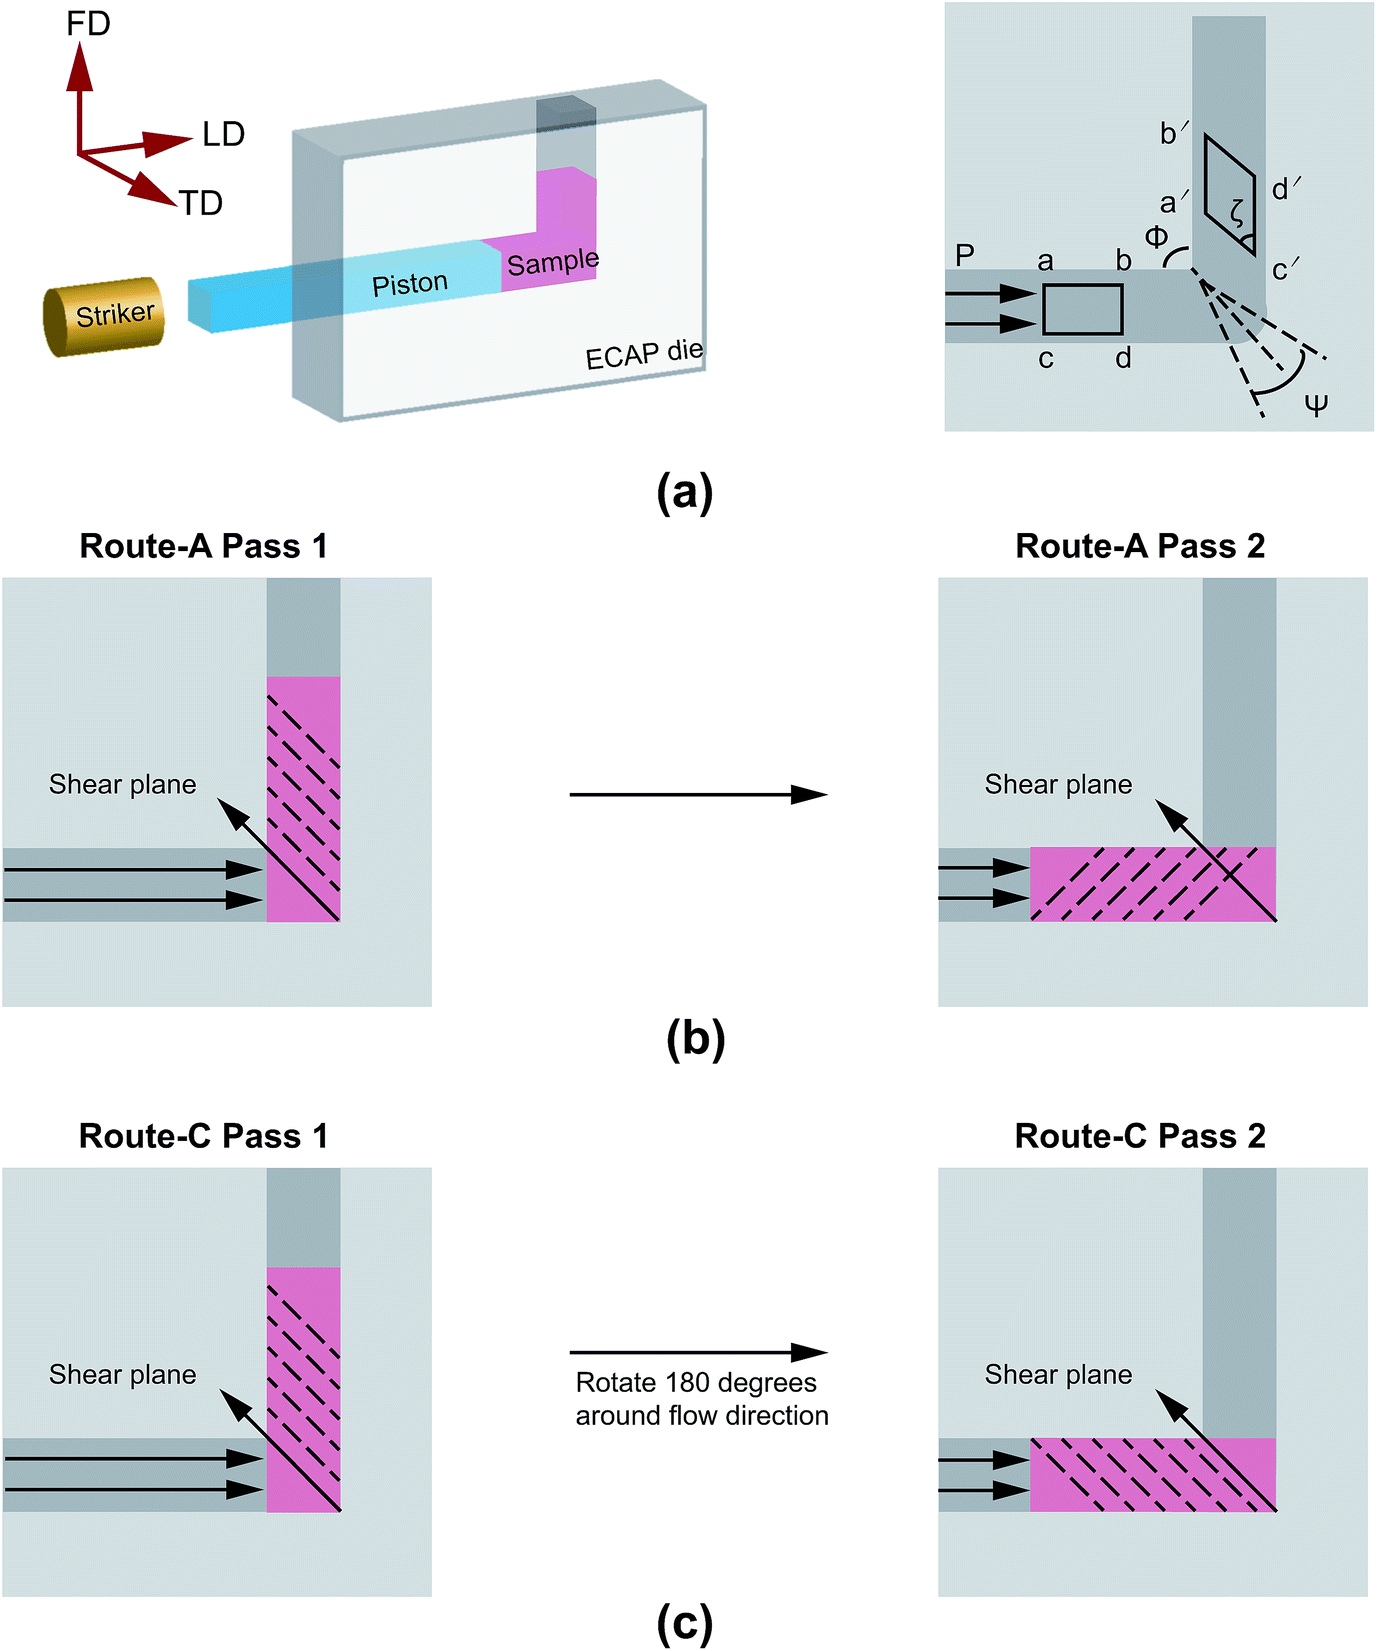 | ||
| Fig. 1 (a) Schematic experimental setup for D-ECAP. Φ is the angle between the two channels, and Ψ is the angle subtended by the arc of curvature at the point of intersection. LD: the loading direction, TD: the transverse direction, and FD: the flow direction. (b) Schematic of the route-A D-ECAP process. (c) Schematic of the route-C D-ECAP process. | ||
In route-A, samples are processed along the same direction at each pass. They experience a progressively increasing shear strain,  , where N is the number of passes, Φ denotes the angle between the channels, and Ψ denotes the angle subtended by the arc of curvature at the point of intersection (Fig. 1a). In route-C, samples are rotated by 180° around FD after the previous D-ECAP pass, the global shear strain experienced by the sample can be removed in principle, and thus the local molecular scale orientation can be preserved. In the following discussion referring to a specific sample, “Ref” stands for the initial sample (reference); “A” and “C” denote processing routes A and C, respectively; numbers “1” to “4” stand for the number of passes.
Because the glass transition temperature of HDPE is well below room temperature, the strain of amorphous region in HDPE is supposed to recover at room temperature. In order to remove amorphous regions,38 the samples with desired shear strains were kept at room temperature for 15 days. Then the central region of a sample with a homogeneous strain was selected for structural characterization.
2.2 Macroscopic observation
Screen printing was used to produce square grids (2 mm × 2 mm) on the LD-FD plane of the HDPE samples before D-ECAP. The square grids were used to characterize the macroscopic deformation23 of HDPE after D-ECAP.2.3 Differential scanning calorimetry (DSC)
The heat of fusion in the temperature range of 50–180 °C was measured at a heating rate of 10 °C min−1 with a differential scanning calorimeter (DSC; Mettler-Toledo DSC 3+). The crystallinity, XDSC, was calculated from ΔH/ΔH0, where ΔH is the heat of fusion of the tested sample, and ΔH0 is the fusion heat per unit mass of 100% crystalline PE (ΔH0 = 290 J g−1 (ref. 39)).To determine the thickness of the crystalline stem lc, the Gibbs–Thomson equations was used:
 | (1) |
2.4 X-ray diffraction (XRD)
Diffraction patterns were measured with a PANalytical Empyrean X-ray diffractometer with Ni filtered Cu Kα radiation (λ = 0.15406 nm) at 40 kV and 40 mA, and the diffraction angle 2θ was varied between 15° and 45° at an increment of 0.013°. Crystallographic texture analysis was conducted on the basis of the diffraction patterns.Incomplete pole figures of the (110), (200) and (020) planes of the orthorhombic phase were measured on a triple-axis stage, with α ranging from 0° to 75° and β from 0° to 360°. The steps for both α and β were 5°. α and β denote the polar angle and the azimuthal angle, respectively. The three pole figures were used as the input for ODF (orientation distribution function) analysis using MTEX 4.5.0.43–45 The complete pole figures were then recalculated from the ODF results.
2.5 Finite element modeling (FEM)
ABAQUS/Explicit was applied to model the shear strain of HDPE under route-A D-ECAP using the ideal plastic model (σ = Eε for ε < εp, and σ = Eεp for ε > εp) with the plane strain hypothesis,46 where σ is the stress, E is the modulus of elasticity, ε is the strain and εp is the initial yield strain. E = 2200 MPa and εp = 0.024 were used for the present work10 (see ESI† for details).3 Results
Fig. 2a shows the macroscopic deformation induced by D-ECAP. After route-A D-ECAP, the initial square grids were changed into parallelograms. Two sides of the parallelograms are tilted at an angle (ξ) away from FD while the other two are parallel to FD. The deformed grid lines show a relatively large area with uniform shear strain in the center of the sample, where ξ is approximately 45° for both the A2 and A4 D-ECAP processes. The shear strain (γ) can be quantified as γ = cotξ.47 There is no significant change after multiple route-A D-ECAP processes (Fig. 2a), which is also substantiated by FEM (Fig. 1S†).
 | ||
| Fig. 2 (a) Photographs of the reference, A2, A4 and C2 HDPE samples after the different D-ECAP processes. (b) Distribution of shear strain across sample A1 obtained from measurements and finite element modeling (FEM). | ||
Shear strain vs. distance across a typical sample after the A1 D-ECAP process was obtained from the deformed grid lines (Fig. 2b). The results show that the maximal shear strain of sample A1 was approximately 1.0. The results predicted by FEM show a similar changing trend as the distance from the bottom surface increases. However, the strains predicted by FEM are higher than the actual strains. This may be caused by friction or thermal effects, since friction and temperature significantly influence the homogeneity and the magnitude of the equivalent plastic strain in ECAP processed HDPE.48 However, the total shear strain is nearly removed completely for the C2 D-ECAP sample, where ξ ∼ 90°.
Large plastic deformation induced by D-ECAP can alter the crystal orientation and crystallinity, and induce defects in HDPE samples. DSC and X-ray diffraction were carried out to investigate the structural transformations of the processed HDPE samples. The DSC measurements are shown in Fig. 3 and Table 1. The DSC curves indicate that the characteristic melting temperatures of orthorhombic crystals of HDPE samples are in the range of 132–135 °C, and that the melting temperature, Tm, and heat of fusion ΔH are lowered by D-ECAP. In the case of route C, melting peaks are shifted to higher temperatures compared to route A. The crystallinity XDSC, estimated by ΔH and the thickness of the crystalline stem lc, are shown in Table 1. Crystallinity and lc also decrease after D-ECAP. However, the processing passes have a small effect on the DSC results of the HDPE samples (Table 1 and Fig. 2S†).
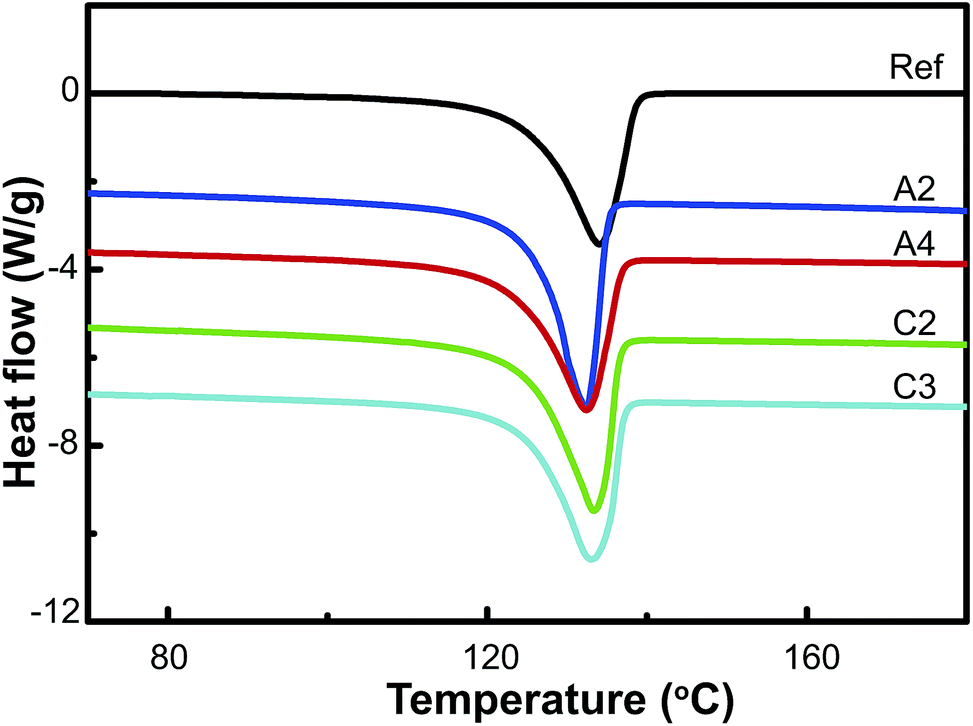 | ||
| Fig. 3 DSC curves of HDPE samples recovered after different D-ECAP processes. The curves are shifted vertically for clarity. | ||
XRD measurements (Fig. 4 and 3S†) were used to detect the (110), (200), (210), and (020) diffraction peaks. After D-ECAP, a new (010) diffraction peak belonging to the monoclinic HDPE was clearly observed; this peak intensifies at the expense of the intensities of the characteristic orthorhombic (110), (200) and (210) diffraction peaks. However, the intensity of the (020) diffraction peak increased while that of the (200) diffraction peak decreased, indicating that the orientation of the orthorhombic crystals had changed. In the case of route C, the intensity of the (010) diffraction peak was weaker than those for route A, whereas the (020) diffraction peak was stronger after route C than that after route A.
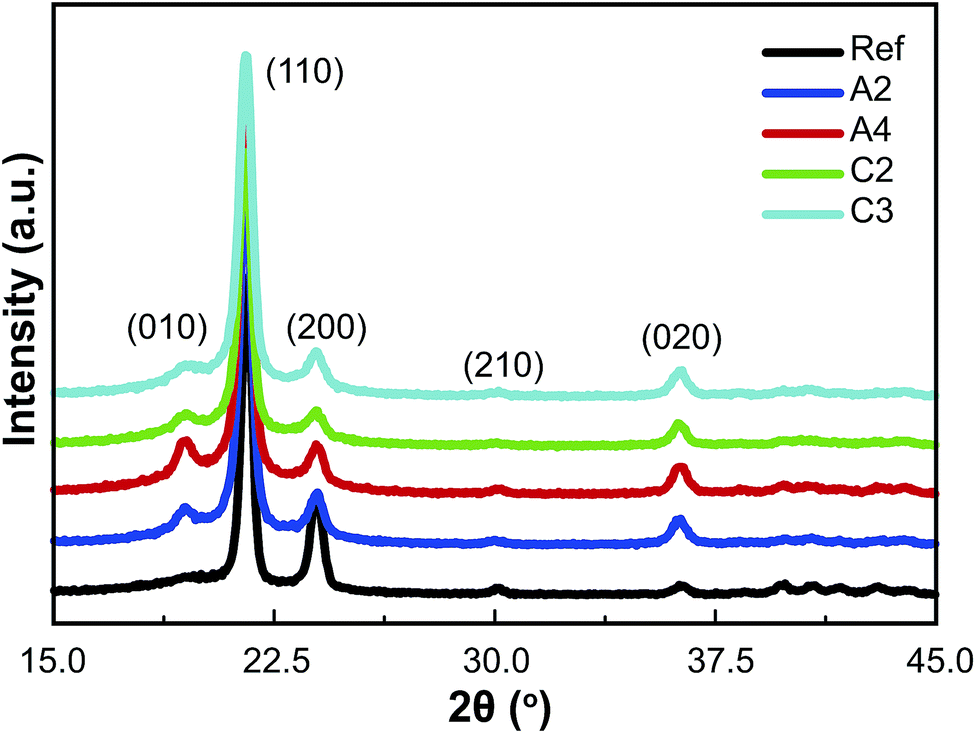 | ||
| Fig. 4 XRD curves of the HDPE samples recovered after the different D-ECAP processes. | ||
Fig. 5 shows the pole figures of HDPE samples after uniaxial tension, route-A ECAP 1 pass, and route-A D-ECAP 1 pass. In the case of uniaxial tension (Fig. 5a), the drawing direction is to the north of the pole figure. After uniaxial tension (ε = 10), the normals of the (002) planes rotate towards the drawing direction. Fig. 5b presents the pole figure collected from the HDPE sample after 1 pass of the route-A ECAP. In this case, two preferred crystallographic c-axis orientations are revealed, both of which are perpendicular to TD. One of the c-axis orientates towards FD, while the other one, in the direction 55° away from FD. Fig. 5c shows the pole figure collected from the route-A D-ECAP 1 pass sample, which displays similar features to those obtained from the route-A ECAP 1 pass sample. The difference between the textures of these two samples is mostly in their respective maximal pole densities. The maximal pole density of the (002) pole figure of the route-A ECAP 1 pass sample is higher than that of the D-ECAP counterpart.
 | ||
| Fig. 5 Pole figures for (002), (020), (200) and (110) planes of HDPE after (a) uniaxial tension along the north of the pole figures; (b) route-A ECAP, 1 pass; and (c) route-A D-ECAP, 1 pass. LD is to the right and FD is to the south of the pole figures, respectively, for ECAP and D-ECAP. | ||
Fig. 6 shows the (200), (020), (002) and (110) pole figures of the orthorhombic crystals in polyethylene. For better visualization of the orientations in all samples, the pole figures of individual samples are plotted with different color bars. In each pole figure, TD (see Fig. 1 for the definition of the coordinate system) is perpendicular to the projection plane, and LD and FD are marked by arrows. Before deformation, the c-axis of the reference sample is nearly random.
 | ||
| Fig. 6 Pole figures for (002), (020), (200) and (110) planes of the reference, A1, A2, A4, C2 and C3 samples. | ||
After the A1 processing, the normals of the (200) planes, i.e. the a-axis, become parallel to the LD–FD plane, and perpendicular to TD. The observed pole density maxima appear at two orientations. The maxima corresponding to the two orientations are strongly overlapped, appearing to be like a single orientation for the a-axis. Such a strong overlap of the pole density maxima in the pole figures38 is due to the closeness between the (200) and (110) diffraction peaks. The normals to the (020) planes, i.e. the b-axis, show a bimodal orientation distribution; both orientations point towards TD. This represents two kinds of crystallite orientations for the b-axis, crossing each other along TD.
Meanwhile, the evident bimodal orientations of the c-axis appear on the circumference of the (002) pole figure. One of the orientations, named orientation 1, is tilted about 5° FD clockwise. The other one, named orientation 2, is tilted about 55° FD clockwise. After A2 or A4 processing, the pole figures show similar features to those obtained from the A1 sample. The differences between the textures of these three samples lies mostly in the maximal pole densities. The maximal pole density increases with the increasing number of D-ECAP passes.
After the C2 process, the pole figures show totally different features for the route-A cases. The normals to the (200) planes tend to tilt about 60° away counter-clockwise from LD. At the same time, the normals to the (020) planes are parallel to TD. However, the pole figures of the C3 sample show similar features to those for the A1 sample.
Texture indices and volume percentages of the crystals with certain orientations are given in Table 2. With the increasing number of route-A D-ECAP passes, the texture index increases considerably, while the ratio of volume 1 to volume 2 decreases.
In order to visualize the orientations of the crystallites in the HDPE samples, pole density variations around the circumferences of the pole figures of A2, C2 and C3 samples are presented as a function of the azimuthal angle in Fig. 7. The azimuthal pole density distributions around the circumferences of the (002) pole figures are shown in Fig. 7a. The plot for the reference sample is approximately a straight line parallel to the x-axis, indicating that the crystallographic c-axis is randomly distributed in the LD–FD plane. The azimuthal pole density distributions of A2 and C3 samples exhibit similar bimodal features; one feature, of the maximal pole density, appears at about 95° while the other appears at 145°. After the C2 process, a single orientation distribution is observed.
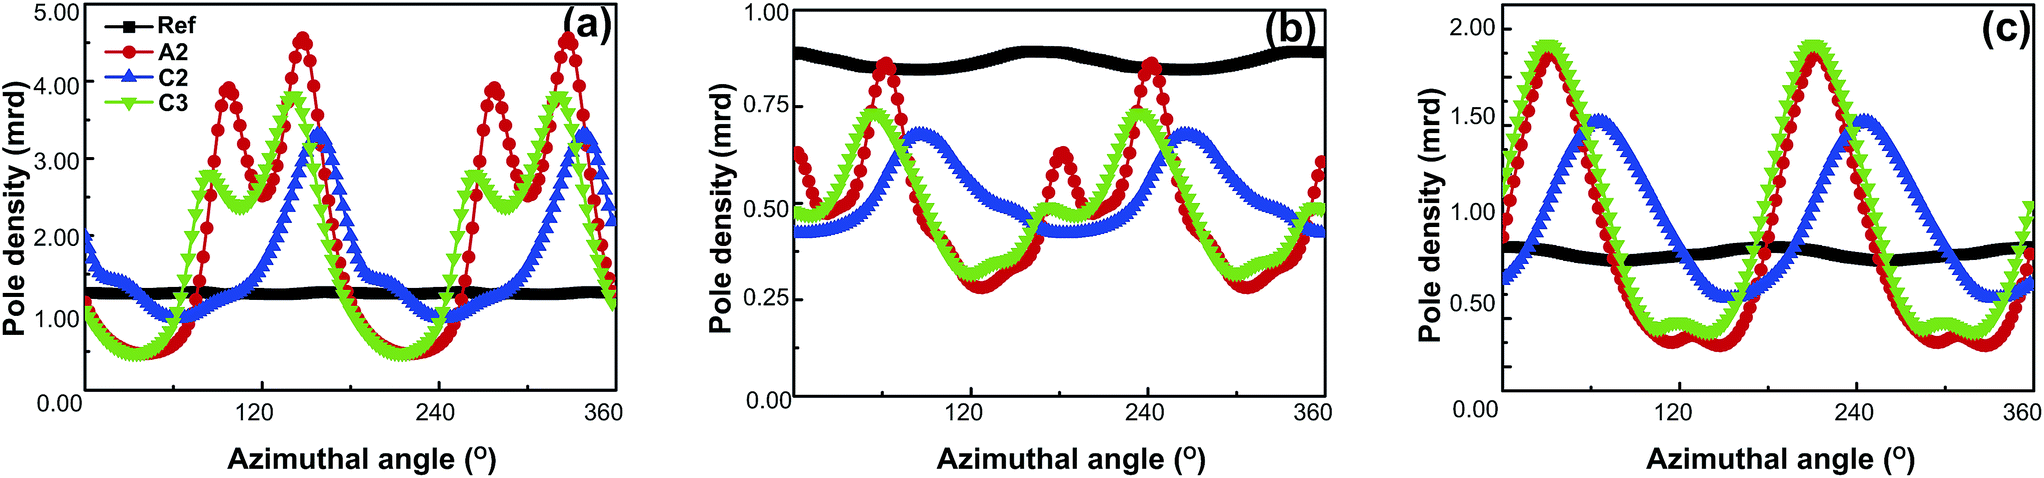 | ||
| Fig. 7 Azimuthal scanning curves for the (a) (002), (b) (020), and (c) (200) planes of the reference, A2, C2 and C3 samples. | ||
The azimuthal pole density distributions around the circumferences of the (020) pole figures are shown in Fig. 7b. The data for the reference sample suggests that it exhibits random orientations similar to that for (002). The (020) pole densities of the D-ECAP processed samples are lower than that of the reference sample, indicating that the molecular b-axis that is rotated away from the LD–FD plane is induced by D-ECAP.
The azimuthal distributions around the circumference of the (200) pole figures are shown in Fig. 7c. The (200) data for the reference sample also shows that it exhibits random orientations. The (200) azimuthal distributions of the A2 and C3 samples exhibit a single orientation distribution as a result of the two strongly overlapped orientations, as mentioned above.
4 Discussion
4.1 Macroscopic scale
Under the presented conditions, the macroscopic deformation angle (ξ) of the grid lines is approximately 45°; therefore, the induced shear strain after 1 pass of route-A D-ECAP is approximately 1.0. This value is well below the theoretical value of 2.0.49 This may be caused by the friction at the polymer–die interface, elastic bending around the 90° corner, temperature rise during D-ECAP, and relaxation of molecular chains after the process.32,50,51 The extrusion rate was found to affect the amount of induced shear strain during the ECAP process, and slow extrusion rates provided polymer chains more time to relax.32 High strain rates sharply reduce the shear strain of D-ECAP processed samples when compared to those of ECAP, as a result of thermal effects. After D-ECAP, the original rectangle, abcd, is deformed into the parallelogram, a′b′c′d′ (Fig. 1a). During the deformation, the two sides ab and cd conserve their lengths and spacing (ab = a′b′ and cd = c′d′), but the relative displacement between a′b′ and c′d′ along their flow direction causes the build up of D-ECAP shear strain (γ).47,49 When the material passes through the right angled region of the D-ECAP die, the shear strain (γ), being 45° counterclockwise from FD, induces sample deformation.32 A previous ECAP study23,52 showed that the strain increases with an increasing number of passes. However, in the present work, the variation in strain is not obviously linked to an increasing number of processing passes. It may be attributed to strain rate effect,10,53 where HDPE samples possess high hardness at high strain rates.10 Simultaneously, the front end was deformed into an arc that was shaped in the previous process, making the sample unable to fill the die corner. This is equivalent to being processed by a die with a chamfer at the corner, with Ψ > 0°. Since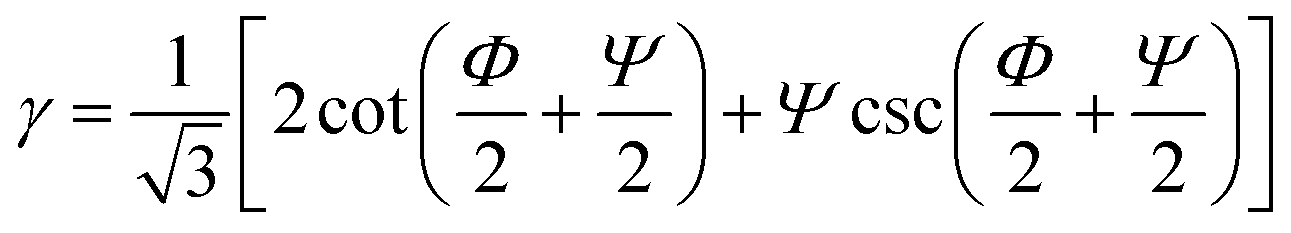 ,54 the theoretical shear strain decreases with an increase in Ψ (the angles are defined in Fig. 1). The FEM results confirmed this point (Fig 1S†).
4.2 Microscopic scale
The decrease of crystallinity in semicrystalline polymers after large shear deformation induced by ECAP has been reported.23,32,52 The crystallinity of samples decreases with an increasing number of ECAP passes. Intense shear deformation can crush the lamellae into small crystalline fragments, leading to amorphization. Fragmentation of lamellar blocks has been previously observed in isotactic polypropylene subjected to simple shear.1 D-ECAP, bringing about high strain rate and large shear deformation, also results in decreased crystallinity. However, the reduction of crystallinity after the D-ECAP process is smaller than that after the ECAP process, which is consistent with the strain results, mainly because of the short duration of loading and the strain rate effect.After D-ECAP, the monoclinic (010) diffraction peak is clearly observed, and its intensity increases with rising shear strain. Thus, martensitic transformation is an important deformation mechanism during shear deformation of HDPE, which is similar to a previous ECAP study.20
Shear deformation in HDPE involves such mechanisms as interlamellar shear, crystallographic slips, and associated crystal rotations.38 The symmetry of crystallographic planes is not maintained, as can be seen from the pole figures of D-ECAP processed samples; therefore, the rotation of crystals is caused either by crystallographic slip or by the rotation of lamellae. Fig. 6 shows that two molecular chain axis orientations are induced after the route-A and C3 processes. A similar phenomenon has also been found in ECAP of PET,23 uniaxial and biaxial rolling of polyoxymethylene,55,56 and plane strain compression of HDPE and PET.4,8,9 In the completely extruded region, one type of the molecular chain c-axis orientates approximately along FD, while the other one is tilted at an angle about 55° counter-clockwise away from FD (Fig. 6). Since chain slip occurs in the directions parallel or perpendicular to the molecular chain axis,57 the chain-folded lamellae which are not in these two directions remain unchanged.57 Similar to a previous observation,23 chain slip is more prone to occur in the lamellae with molecular chain axes parallel or perpendicular to the shear direction. Lamellae with planes initially aligning along the shear direction experience interlamellar shear before the tie molecules are completely stretched, and the lamellae rotate towards FD as a result. The other preferred orientation is attributed to the lamellae whose planes are initially orientated perpendicular to the shear direction. In this case, interlamellar shear is difficult to emerge, but coarse chain slip occurs at very small shear strains.23 This results in the rotation of the lamellae toward the direction which is tilted at an angle about 55° counter-clockwise away from FD.
The uniqueness of D-ECAP is that it provides a method to investigate structural variations in semicrystalline polymers induced by high strain rate, and large shear deformation. It also provides a method to control the orientations of the crystallites as ECAP does. However, due to the limited size of the experimental devices (loading and die), the recovered samples are small. Therefore, future work will include increasing the dimensions of the devices to produce larger samples for mechanical property tests.
5 Conclusions
In the present work, dynamic equal-channel-angular pressing, which can induce simultaneously high strain rate and large shear deformation, has been successfully applied to process semicrystalline HDPE. The corresponding structural changes induced by D-ECAP were analyzed by macroscopic strain analysis, differential scanning calorimetry, and X-ray diffraction. Moreover, finite element analysis was performed to calculate strain distribution.Macroscopic strain results indicated that a large shear strain (γ ≈ 1) is introduced into HDPE after route-A D-ECAP. The shear strain is inhomogeneously distributed along the loading direction, and reaches its maximum at the middle of the sample. Owing to strain rate effect, shear strain accumulation does not increases significantly with an increasing number of D-ECAP passes.
XRD results show that a new (010) diffraction peak belonging to the monoclinic HDPE emerges after D-ECAP. It suggests that martensitic transformation is a nonnegligible way of accommodating high strain rate shear deformation for HDPE.
DSC results show that the crystallinity decreases slightly after D-ECAP, and this indicates that the intense shear deformation partially destroys the crystalline structure.
The texture results suggest that two preferred molecular c-axis orientations are induced by route-A and C3 D-ECAP. One orientation is the crystallographic c-axis aligned approximately along FD, while the other one is tilted at about 55° clockwise away from FD. In contrast, only one molecular c-axis orientation is found after route-C2 D-ECAP. These results reveal that interlamellar shear, crystallographic slip, and associated crystal rotation are the main mechanisms for deformation in HDPE that is processed by D-ECAP.
Conflicts of interest
There are no conflicts to declare.Acknowledgements
This work was partially supported by the National Key R&D Program of China (No. 2017YFB0702002), the Scientific Challenge Project of China (TZ2018001), and the NSFC (No. 11627901).Notes and references
- G. Coulon, G. Castelein and C. G’sell, Polymer, 1999, 40, 95–110 CrossRef
.
- L. Lin and A. S. Argon, J. Mater. Sci., 1994, 29, 294–323 CrossRef
- I. L. Hay, T. Kawai and A. Keller, J. Polym. Sci., Polym. Symp., 1967, 2721–2731 CrossRef
- P. B. Bowden and R. J. Young, J. Mater. Sci., 1974, 9, 2034–2051 CrossRef
- B. J. Lee, A. S. Argon, D. M. Parks, S. Ahzi and Z. Bartczak, Polymer, 1993, 34, 3555–3575 CrossRef
- B. J. Lee, D. M. Parks and S. Ahzi, J. Mech. Phys. Solids, 1993, 41, 1651–1687 CrossRef
- S. Ahzi, B. J. Lee and R. J. Asaro, Mater. Sci. Eng., A, 1994, 189, 35–44 CrossRef
- H. H. Song, A. S. Argon and R. E. Cohen, Macromolecules, 1990, 23, 870–876 CrossRef
- A. Bellare, R. E. Cohen and A. S. Argon, Polymer, 1993, 34, 1393–1403 CrossRef
- E. N. Brown, C. P. Trujillo and G. T. Gray III, AIP Conf. Proc., 2007, 691–694 Search PubMed
- S. Glasstone, K. J. Laidler and H. Eyring, The theory of rate processes; the kinetics of chemical reactions, viscosity, diffusion and electrochemical phenomena, McGraw-Hill Book Company, technical report, 1941 Search PubMed
- P. A. O’connell and G. B. McKenna, Polym. Eng. Sci., 1997, 37, 1485–1495 CrossRef
- C. Siviour, S. M. Walley, W. G. Proud and J. E. Field, Polymer, 2005, 46, 12546–12555 CrossRef
- M. L. Williams, R. F. Landel and J. D. Ferry, J. Am. Chem. Soc., 1955, 77, 3701–3707 CrossRef
- J. Zhao, W. G. Knauss and G. Ravichandran, Mech. Time-Depend. Mater., 2007, 11, 289–308 CrossRef
- G. T. Gray and W. R. Blumenthal, Split-Hopkinson Pressure Bar Testing of Soft Materials, Mechanical Testing and Evaluation, Metals Handbook, American Society for Metals, Materials Park, Ohio, 2000, vol. 8, pp. 488–496 Search PubMed
- T. Choi, D. Fragiadakis, C. M. Roland and J. Runt, Macromolecules, 2012, 45, 3581–3589 CrossRef
- G. Taylor, Proc. R. Soc. London, Ser. A, 1948, 289–299 CrossRef
- G. T. Gray III, E. Cerreta, C. A. Yablinsky, L. B. Addessio, B. L. Henrie, B. H. Sencer, M. Burkett, P. J. Maudlin, S. A. Maloy and C. P. Trujillo, AIP Conf. Proc., 2006, 725–728 CrossRef
- H. J. Sue and C. K. Y. Li, J. Mater. Sci. Lett., 1998, 17, 853–856 CrossRef
- B. Campbell and G. Edward, Plast., Rubber Compos., 1999, 28, 467–475 CrossRef
- H. J. Sue, H. Dilan and C. K. Y. Li, Polym. Eng. Sci., 1999, 39, 2505–2515 CrossRef
- A. Phillips, P. w. Zhu and G. Edward, Macromolecules, 2006, 39, 5796–5803 CrossRef
- L. S. Thomas and K. J. Cleerema, SPE J., 1972, 28, 61 Search PubMed
- J. H. Southern and R. S. Porter, J. Appl. Polym. Sci., 1970, 14, 2305–2317 CrossRef
- A. M. Youssef, A. El-Gendy and S. Kamel, Mater. Chem. Phys., 2015, 152, 26–33 CrossRef
- T. Iwata, Macromol. Chem. Phys., 1999, 200, 2429–2442 CrossRef
- V. M. Segal, Izv. Ross. Akad. Nauk, Met., 2004, 1, 5–13 (Russ. Metall., 2004, 1, 2–9) Search PubMed
- R. Valiev, Metally, 2004, 15–21 Search PubMed
- C. Y. Li, Z. Y. Xia and H. J. Sue, Polymer, 2000, 41, 6285–6293 CrossRef
- Z. Y. Xia, H. J. Sue and A. J. Hsieh, J. Appl. Polym. Sci., 2001, 79, 2060–2066 CrossRef
- Z. Y. Xia, H. J. Sue and T. P. Rieker, Macromolecules, 2000, 33, 8746–8755 CrossRef
- Z. Y. Xia, H. J. Sue, A. J. Hsieh and J. W. L. Huang, J. Polym. Sci., Part B: Polym. Phys., 2001, 39, 1394–1403 CrossRef
- I. Khomskaya, V. Zel’dovich, N. Y. Frolova, E. Shorokhov, I. Zhgilev and A. Kheifets, Russ. J. Phys. Chem. B, 2007, 1, 630–634 CrossRef
- F. Zhao, L. Wang, D. Fan, B. X. Bie, X. M. Zhou, T. Suo, Y. L. Li, M. W. Chen, C. L. Liu, M. L. Qi, M. H. Zhu and S. N. Luo, Phys. Rev. Lett., 2016, 116, 075501 CrossRef PubMed
- V. Zel’dovich, E. Shorokhov, N. Y. Frolova, I. Zhgilev, A. Kheifets, I. Khomskaya and V. Gundyrev, Phys. Met. Metallogr., 2008, 105, 402–408 CrossRef
- I. Brodova, E. Shorokhov, I. Shirinkina, I. Zhgilev, T. Yablonskikh, V. Astaf’ev and O. Antonova, Phys. Met. Metallogr., 2008, 105, 594–601 CrossRef
- Z. Bartczak, A. S. Argon and R. E. Cohen, Polymer, 1994, 35, 3427–3441 CrossRef
- L. Hubert, L. David, R. Seguela, G. Vigier, C. Degoulet and Y. Germain, Polymer, 2001, 42, 8425–8434 CrossRef
- J. D. Hoffman, Polymer, 1982, 23, 656–670 CrossRef
- B. Wunderlich and G. Czornyj, Macromolecules, 1977, 10, 906–913 CrossRef
- J. D. Hoffman and R. L. Miller, Polymer, 1997, 38, 3151–3212 CrossRef
- G. Nolze and R. Hielscher, J. Appl. Crystallogr., 2016, 49, 1786–1802 CrossRef
- R. Hielscher and H. Schaeben, J. Appl. Crystallogr., 2008, 41, 1024–1037 CrossRef
- F. Bachmann, R. Hielscher and H. Schaeben, Solid State Phenom., 2010, 63–68 Search PubMed
- F. Zaïri, B. Aour, J. Gloaguen, M. Naït-Abdelaziz and J.-M. Lefebvre, Scr. Mater., 2007, 56, 105–108 CrossRef
- V. M. Segal, K. T. Hartwig and R. E. Goforth, Mater. Sci. Eng., A, 1997, 224, 107–115 CrossRef
- A. Mitsak and B. Aour, J. Braz. Soc. Mech. Sci. Eng., 2017, 39, 2055–2069 CrossRef
- V. M. Segal, Mater. Sci. Eng., A, 1995, 197, 157–164 CrossRef
- J. H. Nobbs, D. I. Bower and I. M. Ward, Polymer, 1976, 17, 25–36 CrossRef
- U. Göschel, Polymer, 1996, 37, 4049–4059 CrossRef
- T. L. Wang, S. C. Tang and J. D. Chen, J.
Appl. Polym. Sci., 2011, 122, 2146–2158 CrossRef
- S. Shadlou, B. Ahmadi Moghadam and F. Taheri, Mater. Des., 2014, 59, 439–447 CrossRef
- Y. Iwahashi, J. Wang, Z. Horita, M. Nemoto and T. G. Langdon, Scr. Mater., 1996, 35, 143–146 CrossRef
- D. Gezovich and P. Geil, J. Mater. Sci., 1971, 6, 531–536 CrossRef
- D. Gezovich and P. Geil, J. Mater. Sci., 1971, 6, 509–530 CrossRef
- T. Asano, F. J. B. Calleja, A. Flores, M. Tanigaki, M. F. Mina, C. Sawatari, H. Itagaki, H. Takahashi and I. Hatta, Polymer, 1999, 40, 6475–6484 CrossRef
Footnote |
| † Electronic supplementary information (ESI) available: FEM, XRD, DSC. See DOI: 10.1039/c8ra03366h |
| This journal is © The Royal Society of Chemistry 2018 |