DOI:
10.1039/C8RA02061B
(Paper)
RSC Adv., 2018,
8, 22592-22605
Hydrothermally grown CdS nanoparticles for photodegradation of anionic azo dyes under UV-visible light irradiation
Received
8th March 2018
, Accepted 14th June 2018
First published on 20th June 2018
Abstract
A CdS photocatalyst was synthesized successfully at low temperature via a catalyst-free hydrothermal technique which is simple, green and also easily controlled. The synthesized CdS photocatalyst showed hexagonal wurtzite structure with high crystallinity and excellent optical properties. The catalyst was used for degradation of two anionic azo dyes namely reactive red (RR141) and Congo red (CR) azo dyes. The catalyst showed very high efficiency of 99.8% and 99.0% toward photodegradation of RR141 and CR dye, respectively. The photodegradation reaction followed pseudo-first order kinetics. Chemical scavenger studies showed that direct photogenerated hole transfer from CdS to the azo dye was most likely the major pathway for photodegradation of the azo dye. The chemical structure of the CdS photocatalyst remained stable after photodegradation. The CdS photocatalyst retains its original efficiency even after the fifth cycle of reuse indicating the advantages of stability and reusability. The CdS nanostructures will be suitable for removal of highly toxic and hazardous organic materials in environmental protection.
1. Introduction
The presence of highly toxic and hazardous organic compounds in water and wastewater released from chemical industries is a major issue and challenge for water practitioners to ensure that the treated source waters meet environmental legislated water quality standards.1 Various types of dyes are being manufactured for use in the textile industries particularly in developing countries. These dyes are directly discharged into the aqueous environment. Azo dyes, the most common dyes in textile industries, cause public health problems. This is due to benzidine and aromatic rings contained within the structures. In addition, these dyes are stable and non-biodegradable. The dyes are very harmful due to their carcinogenicity and toxicity.2 Therefore, the improvement of purification methods for treatment of these dyes in wastewater is of high priority.
Various conventional techniques namely anaerobic reactor,3 adsorption,4 ultra-filtration membrane,5 biological treatment by using fungi,6 flocculation–coagulation,7 ozonation,8 bio-electro-Fenton,9 electro-Fenton process,10 electrochemical oxidation11 and sonocatalysis,12 have been used for degradation of the dyes from wastewaters. However, the complete removal of dyes from wastewater cannot be obtained by using these methods. Recently, the development of photocatalysts has become an interesting research topic. The organic dyes can be degraded in a short period of time by photocatalytic reaction. Heterogeneous photocatalysis based on semiconductor is a catalytic process which occurs at the photocatalyst surface under photo irradiation. Stable, inexpensive, non-toxic, and highly photo-catalytically active photocatalyst would be preferred for degradation of organic pollutants.13 Generally, oxide-based materials such as TiO2 and ZnO are the most utilized photocatalysts resulting from their promising photocatalytic efficiency and stability.14,15 However, these catalysts show excellent photoactivity only under UV light irradiation. Generally, it is known that the solar spectrum is composed of 5% UV light and about 43% visible light. In term of energy utilization, therefore, photodegradation of organic pollutants by using visible-light-driven photocatalyst looks much more promising.
Visible-light-driven photocatalyst based on CdS has been used for the removal of organic pollutants in water.16,17 A number of methods have been used to synthesize the CdS nanomaterials such as solvothermal and hydrothermal routes,18 chemical precipitation technique,19 a microwave-assisted heating method20 and metal–organic framework (MOF)-template technique.21 Out of these, a hydrothermal method is the most efficient synthetic method for preparation of CdS nanostructures. This is due to its simplicity, controllability and low cost. In addition, large-scale production can be achieved by using a continuous hydrothermal flow synthetic method. In principle, the product prepared by the hydrothermal method has a better crystalline quality in comparison to those obtained from other solution growth methods.22 The photodegradation efficiency of the CdS catalyst toward degradation of organic dyes such as malachite green, methylene blue (MB), methyl orange (MO), Acid Blue-29, reactive red (RR141), Congo red (CR), and Rhodamine B (RhB) has been investigated.15–17,19,20,23–27 The photocatalytic reaction of the dyes under visible light,28,29 UV light15 and natural solar light irradiation19 has also been studied.
In this research, we report the preparation of CdS nanoparticles via a hydrothermal technique without using any surfactant, organic solvent, or capping agent. The thermal and optical properties of the sample were investigated. The prepared CdS shows spherical morphology (SEM micrograph) with an average diameter of about 49 nm due to the assembly of many crystallites (size = 11 nm, from XRD technique). The photoactivities of CdS nanostructures were also studied. Two anionic azo dyes namely reactive red azo dye (RR141) and Congo red (CR) were used as model organic pollutants. The CdS semiconductor could be used as a stable photocatalyst for the degradation of anionic azo dye. The chemical structure of the catalyst remained stable after photodegradation. The CdS photocatalyst retains its original efficiency even after the fifth cycle of reuse. This indicates the advantages of stability and reusability. The prepared catalyst will be suitable for removal of highly toxic and hazardous organic materials for environmental protection.
2. Experimental sections
2.1 Materials
All analytical (AR) grade chemicals were used without further purification. De-ionized water was used. The reactive azo dye, C.I. Reactive Red 141 (RR141), obtained from DyStar Thai. Co. Ltd., and Congo red (CR) dye, obtained from RCI Labscan, were used. The chemical structures and properties of both anionic dyes are shown in Table 1.
Table 1 The Chemical structures, molecular weight and solubility of both anionic azo dyes namely reactive red 141 (RR141) and Congo red (CR) dye being used
| Azo dyes |
Structure |
λmax (nm) |
MW (g mol−1) |
Solubility (g L−1) |
| RR141 |
 |
544 |
1774 |
50 |
| CR |
 |
500 |
696.65 |
0.116 |
2.2 Preparation of CdS nanostructures
The CdS nanostructures were synthesized by using a hydrothermal method. In a typical procedure, 0.625 M cadmium acetate dihydrate (C4H6CdO4·2H2O) aqueous solution was prepared (about 6.6635 g of cadmium acetate dihydrate in 40 ml aqueous solution), followed by an addition of sodium hydroxide solution to adjust the pH of solution to about 10. After that an aqueous solution of 1.25 M thiourea (CH4N2S), about 3.8067 g of CH4N2S in 40 ml aqueous solution, was slowly dropped into the aforementioned solution under continuous stirring. The colour of the mixture changed to yellow and precipitation was observed. It was further stirred at room temperature for 1 h. The mixture was then transferred to a Teflon-line stainless steel autoclave. The autoclave was sealed and maintained in an oven at 120 °C for 24 h. After the system was cooled naturally to room temperature, the yellow precipitate was collected by vacuum filtration and then washed with ethanol and water alternately 3–4 times. After that it was dried at 80 °C for 6 h before further analysis.
2.3 Characterization
The Fourier transform infrared (FT-IR) spectrum was investigated on a Perkin Elmer Spectrum One FT-IR spectrophotometer using a KBr pellet. The Raman spectrum was determined by using Perkin Elmer Spectrum GX NIR FT-IR Raman spectrometer. The ultraviolet-visible (UV-vis) diffused reflectance spectrum was monitored on a Shimazu UV-VIS-NIR-3101PC scanning spectrophotometer. The crystal structure of the synthesized CdS powder was studied by a powder X-ray diffraction (XRD) pattern recorded on a PANalytical EMPYREAN diffractometer using monochromatic CuKα radiation. The morphology of the CdS sample was examined by FEI Helios NanoLab G3 CX Scanning Electron Microscope (FIB-SEM). Thermal analysis was carried out by determining the thermogravimetric (TG) curve using a HITACHI STA7200 instrument under N2 atmosphere by using a heating rate of 10 °C min−1. The room temperature photoluminescence (PL) spectrum was determined using a Shimadzu RF-5301PC spectrofluorometer (λexcitation = 355 nm).
2.4 Photocatalytic degradation of anionic azo dyes under UV-visible light irradiation
The photocatalytic performance of CdS nanoparticles was investigated by determining photodegradation of a reactive red azo (RR141) dye and Congo red (CR) dye under white light irradiation (a Panasonic cool daylight lamp, 15 W). In order to prepare reaction suspension, 50 mg of catalyst was added to 200 ml of each azo dye solution in natural condition (pH ∼ 6.87) with an initial concentration of 10 mg L−1. The aqueous solution was magnetically stirred for 20 min in the dark to verify the adsorption equilibrium of azo dye with the photocatalyst. Then the suspension was taken under photo irradiation. After the suspension was exposed to the irradiation, a 5 ml sample was collected at a specific time interval and then the sample was centrifuged in order to remove the catalyst from the sample. The centrifuged suspensions were analysed using the UV-vis spectroscopic method. The photocatalytic activity of the CdS sample was observed with regard to the absorbance variation at the maximum wavelength (λmax) of each azo dye (see Table 1) which was plotted based on the Beer–Lambert relation and the photodegradation efficiency (PE) of each azo dye is calculated using eqn (1):| | |
Photodegradation efficiency (%) = (1 − C/C0) × 100%
| (1) |
where C0 and C represents the concentration of the dye aqueous solution after magnetically stirring in the dark (concentration at time (t) = 0) and the concentration of the dye aqueous solution at different time (t) of photo irradiation, respectively.
In addition, in the case of CR azo dye photodegradation, the effect of some experimental parameters namely initial solution pH, catalyst content and initial dye concentration on photocatalytic degradation efficiency was also studied. The solution pH from 3 to 11 was used. The catalyst content of 25–75 mg was selected. The effect of the initial dye concentration from 5 to 20 ppm on the photocatalytic degradation efficiency was studied.
The stability of the CdS photocatalyst was also investigated. The experiment was repeated using the same procedures as above. After each run of the photodegradation study the photocatalyst was filtered, then washed with ethanol and water several times. The catalyst was dried at 80 °C for 6 h and then reused for the next run. Five cycles of the reused catalyst were investigated.
To understand the photocatalytic reaction mechanism regarding CR dye degradation, a series of inhibition experiments were carried out. Different scavenging reagents including 5 mM disodium ethylenediaminetetraacetate (EDTA-2Na), K2Cr2O7 and t-butanol were added as scavengers of hole (h+), electron (e−) and hydroxyl radical (˙OH), respectively.
3. Results and discussion
3.1 Phase structures
The phase and structure of CdS semiconductors were investigated by using the XRD technique. The powder XRD pattern (Fig. 1a) of CdS nanoparticles was well matched with the hexagonal wurtzite structure (JCPDS File no. 10–0454).30 The diffraction peaks were at 2θ = 25.07°, 26.54°, 28.16°, 36.76°, 43.96°, 48.03° and 51.98° corresponding to the reflection from (100), (002), (101), (102), (110), (103), and (112) planes, respectively. No impurity peak was observed. Furthermore, peak broadening was observed implying either the amorphous nature of the compound or the nanocrystalline behaviour of the sample. The crystallite size (D) of the CdS catalyst was calculated from the width of the most intense peak using Debye–Scherrer equation:| |
D = kλ/β![[thin space (1/6-em)]](https://www.rsc.org/images/entities/char_2009.gif) cosθ cosθ
| (2) |
where k is a constant (k = 0.9), λ is the wavelength of X-ray (0.15418 nm), β is the full-width at half maximum (FWHM), and θ is the diffraction angle. The average crystallite size of CdS sample was found to be 11 ± 0.0006 nm.
 |
| | Fig. 1 XRD pattern (a), SEM micrograph (b) and size distribution (c) of the as-synthesized CdS photocatalyst. | |
3.2 Morphological structures
The morphology and shape of the as-prepared CdS particles were investigated by using a scanning electron microscopy (SEM). The Image J program was used for calculating the average diameters of the CdS nanostructures. The grain size of about 49.60 nm was observed from CdS sample (see SEM micrograph in Fig. 1b). This may be due to the assembly of many crystallites (size of 11 nm from XRD technique).31 The size distribution of the CdS sample was also reported as a histogram which is shown in Fig. 1c. The SEM micrograph and XRD pattern do confirm phase structure and purity of the prepared CdS (Table 2).
Table 2 Summary of phase structure, crystallite size, morphology, % residue, band gap energy and PL peaks of the CdS photocatalyst
| Catalyst |
Phase structure |
Crystallite size (nm) |
Morphology/size |
% Residue at 800 °C |
Band gap energy (eV) |
PL peak (nm) |
| CdS |
Hexagonal |
11.10 |
Spherical (49 nm) |
92.51 |
2.20 |
543 |
| 631 |
| 647 |
The elemental composition of the prepared CdS nanoparticles was confirmed by an energy dispersive X-ray spectroscopy (EDX). The EDX spectrum presented in Fig. 2a indicates the existence of Cd and S. The weight% of Cd and S are 66.5% and 19.1%, respectively. The atomic% of Cd and S are 26.3% and 26.1%, respectively. This confirms the 1:1 stoichiometry of the synthesized product. The mapping study is also included. The SEM image of the mapping area is shown in Fig. 2b. Elemental colour mapping of CdS nanoparticles shows homogeneity of the particles, which supports the uniform distribution of cadmium (blue colour shown in Fig. 2c) and sulphur (red colour shown in Fig. 2d). This also indicates the high purity of the as-synthesized CdS nanoparticles.
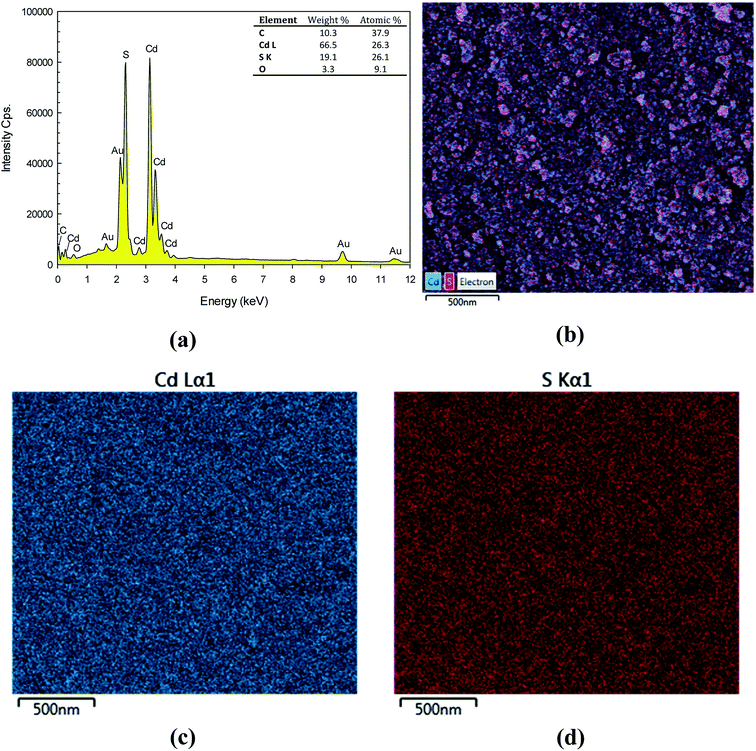 |
| | Fig. 2 EDX spectrum (a), SEM image of the mapping area (b), EDX elementary mapping of Cd (c) and S (d). | |
The growth mechanism involving in formation of the CdS nanoparticles can be explained as follows. Firstly, as the synthesis was initially carried out in an aqueous solution, thiourea acts as a bidentate ligand and forms the Cd–thiourea complex which is stable. Secondly, in the hydrothermal process, the temperature of the reaction mixture increases and this will end up with weakening of Cd–thiourea complex which in turn cause the Cd2+ ions to release slowly. Afterward, thiourea is attacked by O atom from water molecules, which is a strong nucleophile, leading to the weakening of S![[double bond, length as m-dash]](https://www.rsc.org/images/entities/char_e001.gif) C double bonds which are broken slowly to release S2− anions. Then, the released S2− anions will react with the pre-released Cd2+ to grow CdS nuclei which act as seeds for further growth process.20 After the initial nucleation, the formed CdS nuclei are preferentially grown to form spherical-like nanoparticles.
C double bonds which are broken slowly to release S2− anions. Then, the released S2− anions will react with the pre-released Cd2+ to grow CdS nuclei which act as seeds for further growth process.20 After the initial nucleation, the formed CdS nuclei are preferentially grown to form spherical-like nanoparticles.
3.3 Vibrational spectroscopy
The purity and functional group composition of the CdS nanoparticles were investigated by using a Fourier transform infrared (FT-IR) spectroscopy. The FT-IR spectrum (Fig. 3a) showed two broad bands at about 3417 and 1626 cm−1 corresponding to the O–H stretching and bending vibration of water on the surface of the CdS sample, respectively. The peak at 671 cm−1 is attributed to vibration of Cd–S bond.32 This confirms the purity and air stability of the CdS sample.
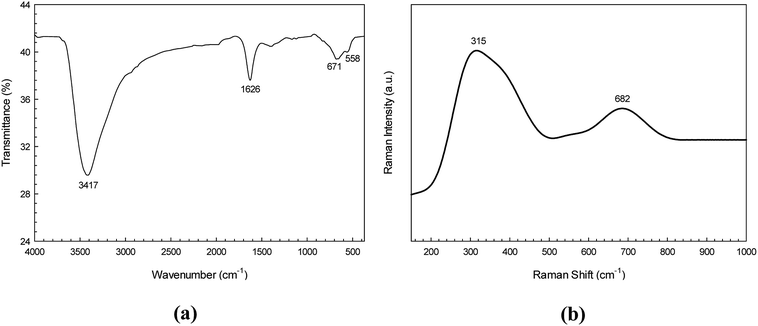 |
| | Fig. 3 FT-IR spectrum (a) and FT-Raman spectrum of the CdS photocatalyst (b). | |
Fig. 3b shows the Raman spectrum of the CdS sample. The Raman peaks found at 315 and 682 cm−1 are attributed to the first order, and second order longitudinal optical (LO) phonon modes found in CdS photocatalyst, respectively.33
3.4 UV-visible diffuse reflectance spectroscopy
The UV-vis diffused reflectance spectrum for the nanostructured CdS (Fig. 4a) shows sharp band edges absorption in the visible region close to 563 nm. This is due to the optical transition of the first excitonic state. The direct band gap energy (Eg) was approximated from a Tauc plot using the relationship:where hν is photon energy, A is a constant, α represents the absorption coefficient, α = 4πk/λ, (k is the absorption index), λ is the wavelength, and n = 1/2 for the allowed direct band gap. It can be clearly seen from Fig. 4b that the direct band gap value estimated by extrapolating the absorption edge is 2.30 eV.
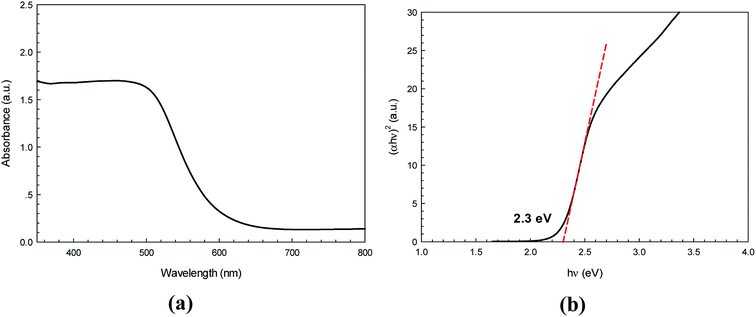 |
| | Fig. 4 Diffused reflectance spectrum (a) and Tauc plot for determination of energy band gap of the as-synthesized CdS photocatalyst (b). | |
3.5 Thermal properties
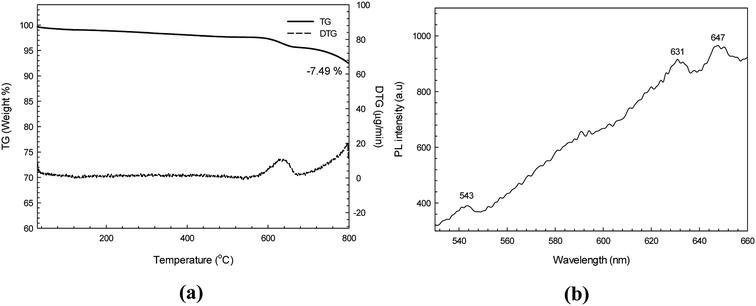
Fig. 5a shows the TG and DTG thermograms of the synthesized CdS nanoparticles. It was found that the CdS sample exhibited only one step of weight loss (about 7.49%) over the temperature range of 600–640 °C. This may be due to the oxidation of cadmium ions in the air atmosphere.34
 |
| | Fig. 5 TG thermogram (a) and PL spectrum (b) of the as-synthesized CdS using an excitation wavelength of 355 nm. | |
3.6 Photoluminescence study
The PL spectrum of CdS (using an excitation wavelength of 355 nm) is presented in Fig. 5b. In general, two emissions comprising excitonic and trapped photoluminescence are observed from semiconductor nanomaterials.21,31 In theory, the excitonic emission is sharp and found close to the absorption edge, while the trapped emission is broad and found at a longer wavelength. In this study the as-synthesized CdS showed the PL emission spectrum over the range of 540–660 nm. The small peak at 543 nm is due to the near band edge (NBE) emission peak as a consequence of electron–hole recombination. In contrast, the two emission peaks at around 631 and 647 nm indicate the contribution of radiative recombination due to surface defect states in the CdS sample. In theory, the NBE peak can be found in highly crystalline material.31 It should be noted that the XRD diffractogram and PL spectrum do support the high crystallinity of the synthesized CdS nanoparticles. Therefore, a high photocatalytic degradation efficiency of the hexagonal CdS photocatalyst would be expected.
3.7 Photocatalytic properties
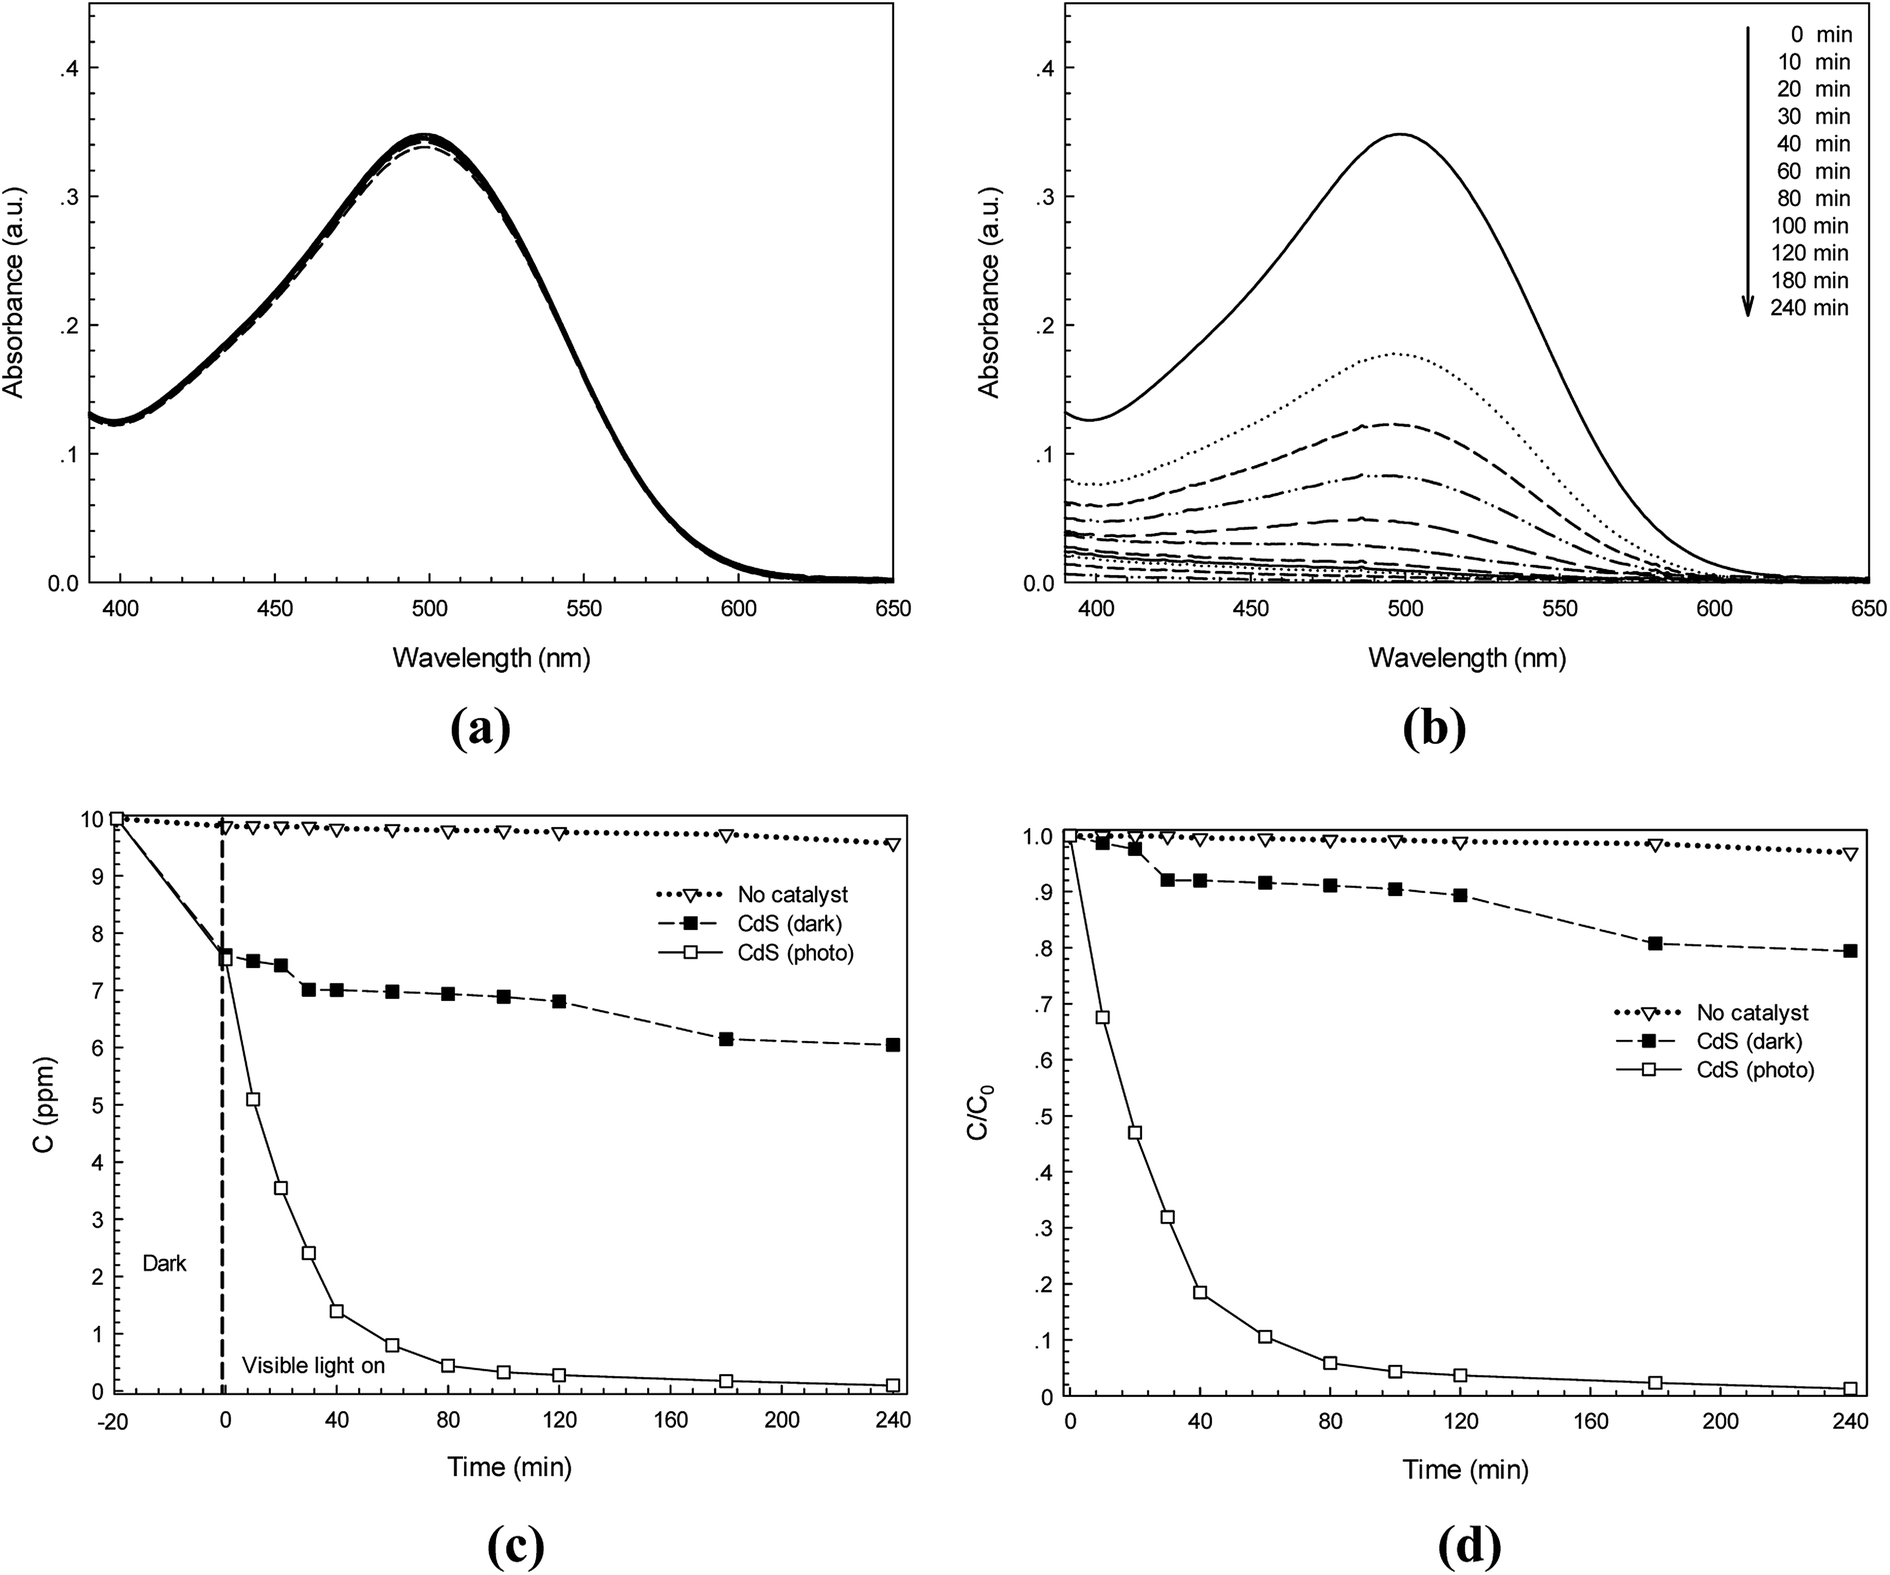
The photocatalytic activity of the synthesized CdS photocatalyst was studied. Two anionic azo dyes namely RR141 and CR dyes were used as model organic pollutants. The absorption spectra of the RR141 aqueous solution and the suspended CdS nanostructures in the dye solution under photo irradiation for 240 min are shown in Fig. 6a and b, respectively. The adsorption–desorption equilibrium between CdS nanoparticles and RR141 dyes was obtained after stirring in the dark for 20 min. The concentration of the RR141 dye after stirring is 9.29 ppm. An increasing irradiation time resulted in the decrease of absorbance (at the λmax = 544 nm) as shown in Fig. 6b. This is due to the photocatalytic activity of the CdS photocatalyst. Furthermore, a lowering of concentration (C) with an increasing irradiation time (t) is shown in Fig. 6c. The blank test (neat RR141 dye solution under photo irradiation, known as no catalyst process) showed a slow rate of RR141 photodegradation, i.e. the dye was hardly self-photodegraded. The azo dye solution with the CdS catalyst in the dark (contribution from adsorption process) provides C/C0 = 0.934 after 240 min (see Fig. 6d) corresponding to the dye concentration of 9.34 ppm. The result demonstrates a low contribution of dye removal due to the adsorption process. In the case of the photocatalytic process, however, a lowering of C/C0 from 1 to 0.12 was found after irradiation for only 120 min. The photodegradation efficiency for removal of RR141 (10 ppm) can be calculated. The photodegradation of RR141 dye improved remarkably in the presence of CdS photocatalyst under photo irradiation. The photodegradation efficiency of about 99.8% was observed after 240 min.
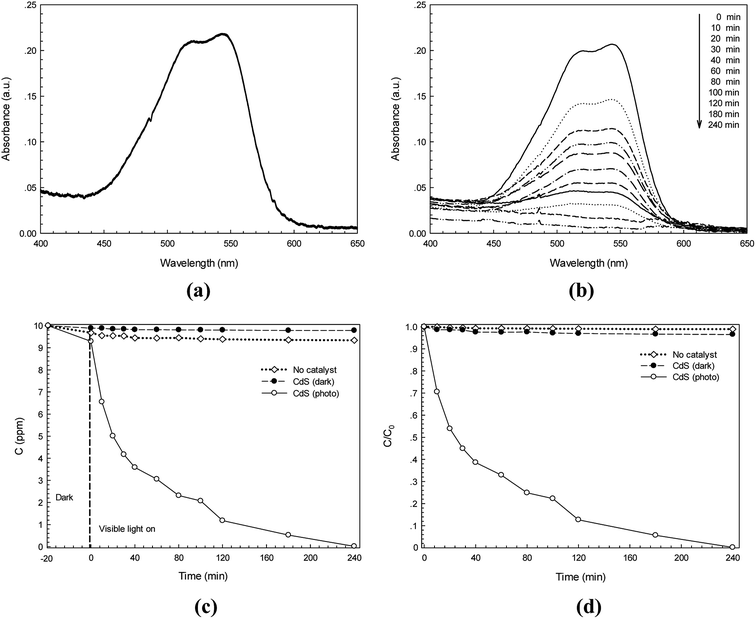 |
| | Fig. 6 Time-dependence absorption spectra of RR141 azo dye under white light irradiation without photocatalyst (a) and with CdS photocatalyst (b), lowering of RR141 dye concentration (C) with irradiation time (t) in the presence of CdS (c) and plot of C/C0 versus time over 240 min (d). | |
In addition, the photodegradation of Congo red (CR) dye was also investigated. Fig. 7a and b show the absorption spectra of neat CR dye (λmax = 500 nm) and suspended CdS in CR dye solution, respectively. The blank test confirms that the CR dye was also hardly self-photodegraded. The effect of photolysis was negligible. An adsorption experiment was also carried out and reduction in absorbance was observed. In this case the adsorption process made some contribution in removing of CR dye. The concentration of the CR dye after 240 min, under dark condition, was found to be 6.3 ppm. In addition, a lowering of the CR dye concentration (C) as a function of time was found (see in Fig. 7c). In the presence of CdS photocatalyst, the ratio of C/C0 decreased from 1 to 0.036 with irradiation for 120 min (see Fig. 7d).
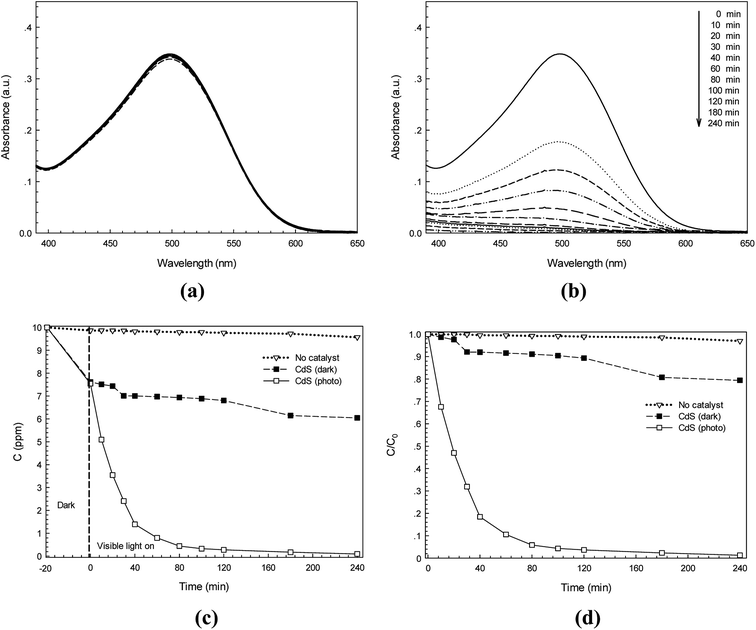 |
| | Fig. 7 Time-dependence absorption spectra of CR dye under white light irradiation without photocatalyst (a) and with CdS photocatalyst (b), lowering of CR dye concentration with irradiation time in the presence of CdS (c) and plot of C/C0 versus time over 240 min (d). | |
The photocatalytic efficiency for degradation of the CR azo dye (10 mg L−1) was also determined. The photodegradation of the CR dye improved remarkably in the presence of CdS photocatalyst under photo irradiation. Interestingly, an efficiency of 94.15% was achieved after irradiation for only 80 min. Up to 240 min, a photodegradation efficiency of about 98.73% was observed. It should be noted that the adsorption process made a contribution of the removal of 20.58% of CR dye after 240 min. The degradation of CR dye is due to the synergistic effect of both adsorption and photocatalysis. It should be noted that a significant improvement of CR dye degradation can be found in the presence of both catalyst and light.
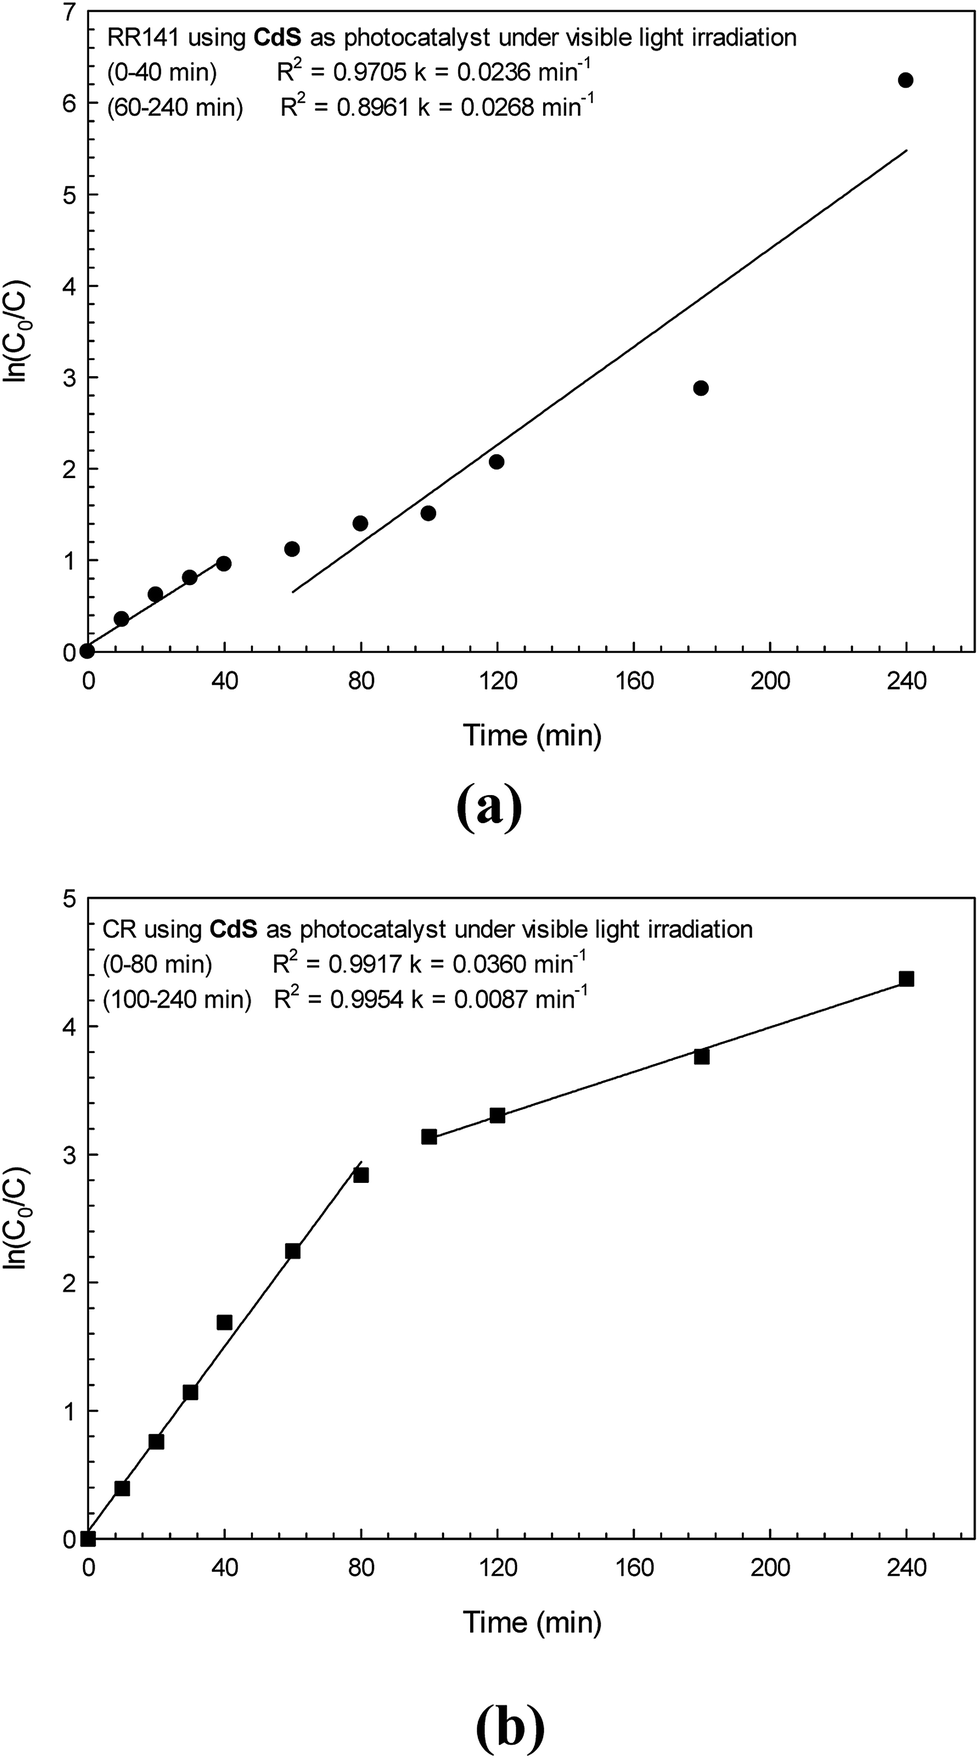
The photocatalytic performance of the CdS samples can also be determined from the photodegradation rate. The chemical kinetics of the photocatalytic reaction was investigated to better understand the photodegradation process. Photocatalytic degradation of organic pollutants, in general, obeys Langmuir–Hinshelwood (L–H) kinetics.32 This kind of pseudo-first order kinetics can be represented by the following equation:
where
k1 is the rate constant of the reaction.
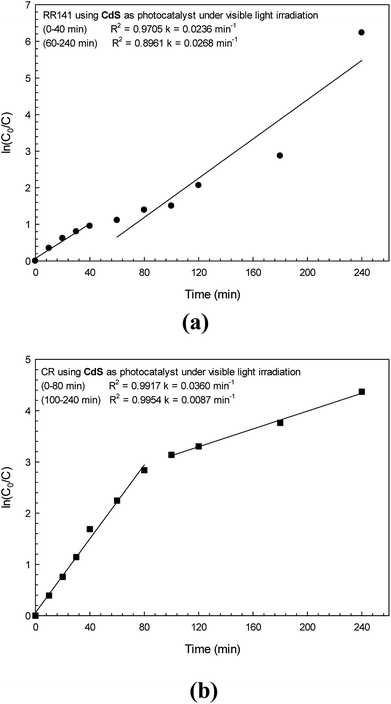
Plots of ln(C0/C) versus the time for the photodegradation of RR141 and CR dye are shown in Fig. 8a and b, respectively. The linear relationship between ln(C0/C) and time (t) was found in each plot indicating the pseudo-first order kinetics of the photodegradation reaction.19,32 The rate constant (k1) was calculated from a slope of ln(C0/C) vs. time. The photodegradation of RR141 dye provided a rate constant of 0.0236 min−1 (R2 = 0.9705). In the case of CR dye, the rate constant (k1) was found to be 0.0360 min−1 (R2 = 0.9917) after 80 min of irradiation. The high value of R2 (>0.95) did support the pseudo-first order kinetics of the photodegradation reaction.
 |
| | Fig. 8 A linear plot of ln(C0/C) vs. irradiation time for RR141 azo dye (a) and CR dye (b) photodegradation under white light irradiation. | |
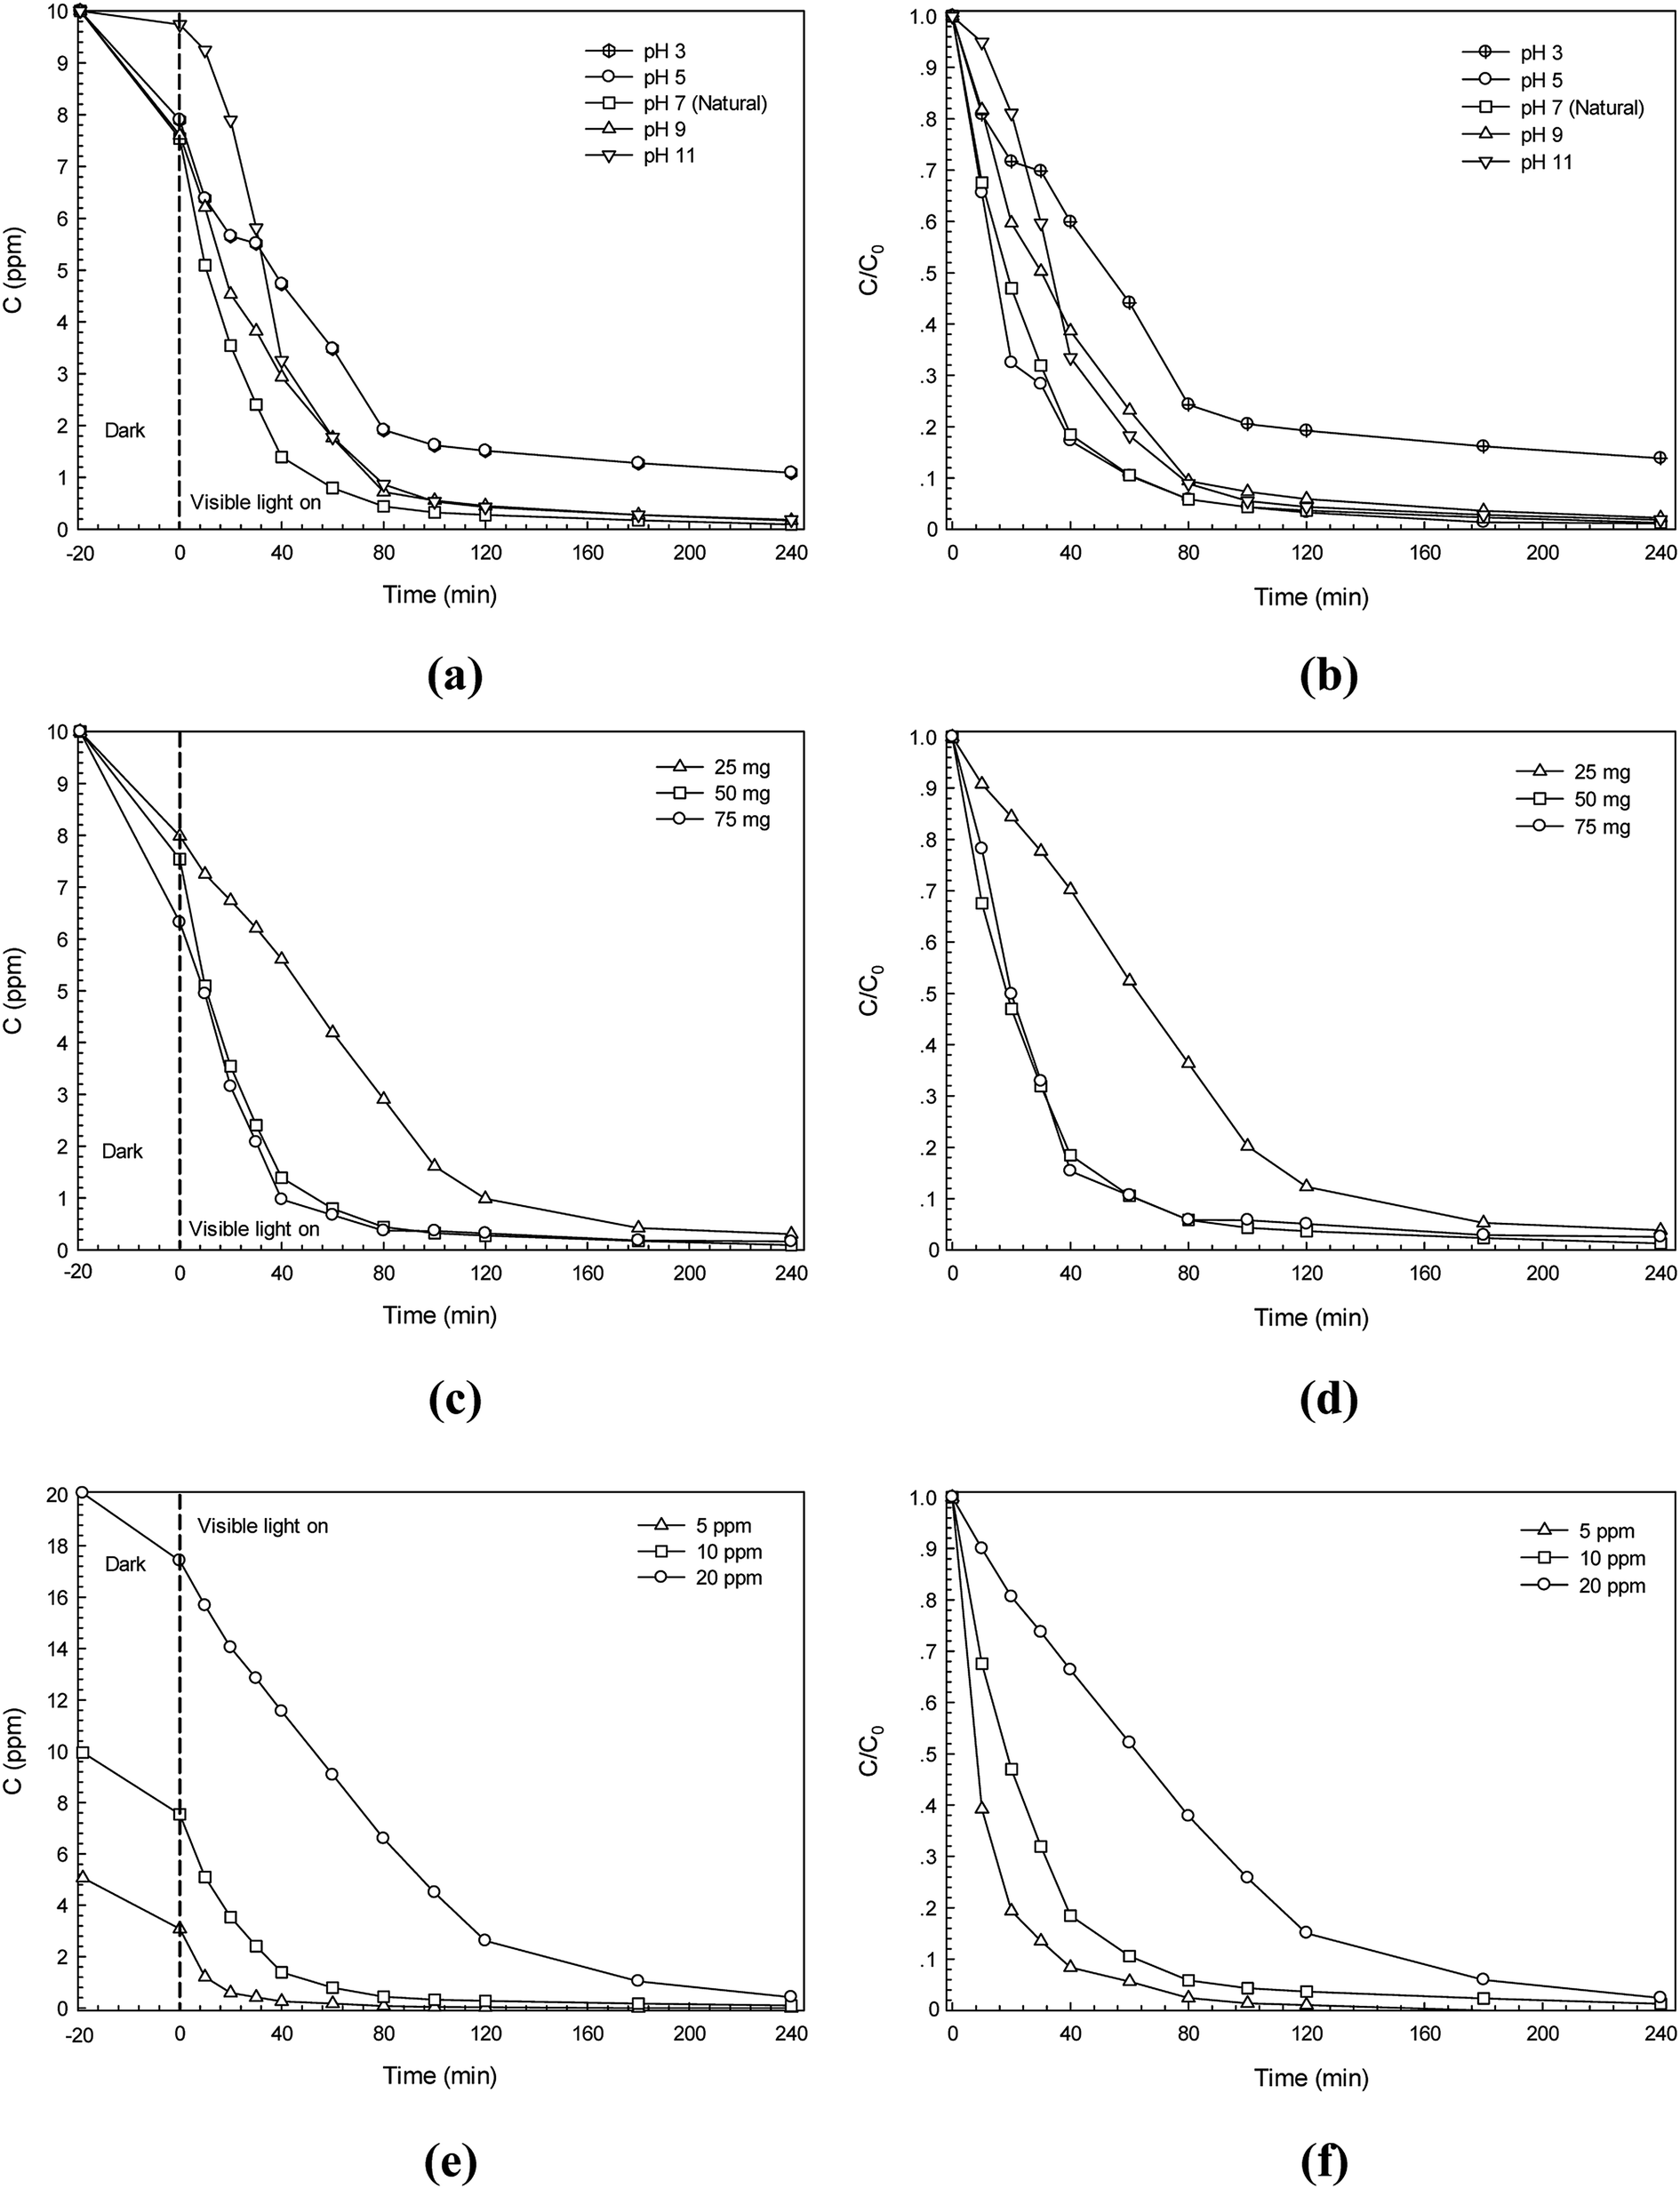
The effect of some experimental parameters namely initial solution pH, catalyst content and initial azo dye concentration on photodegradation efficiency was studied and is shown in Fig. 9. The CR dye was used. The effect of pH on the photocatalytic degradation of the dye was tested in the pH range of 3–11 and the results are presented in Fig. 9a and b. The pH of about 7 is the natural condition of the dye solution. The high degradation efficiency found in the pH range of 5–7 is due to the enhancement of anionic Congo red (CR) azo dye adsorption on the surface of CdS photocatalyst that carries a positive charge at this pH range.15,33 However, at a low pH of 3 (highly acidic condition), the CdS catalyst may undergo dissolution. This results in a sharp decrease of degradation efficiency. In the basic medium (pH 9–11), in contrast, the negative charge on surface of the CdS catalyst can be found and it repels the dye. This may decrease the adsorption of the anionic CR dye on the surface of the photocatalyst which in turn results in lowering of the photocatalytic performance. From the results, a further study regarding photodegradation of the dye will be performed without changing the initial solution pH from natural dye solution.
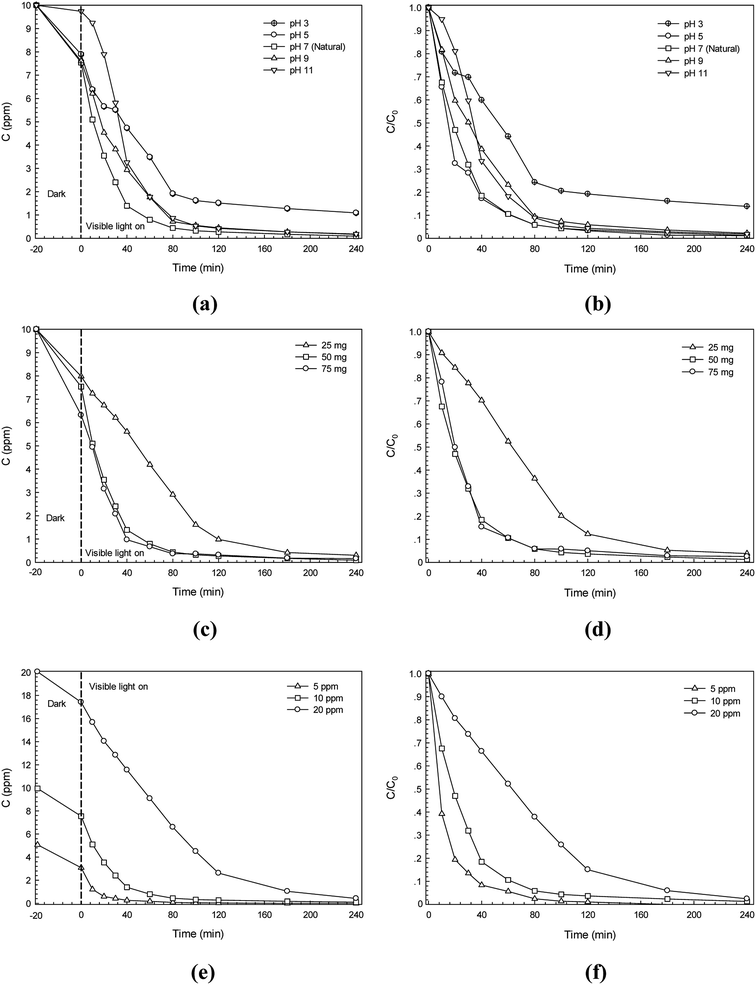 |
| | Fig. 9 The effect of experimental parameters on photodegradation of CR dye: (a) lowering of CR dye concentration with irradiation time at various initial solution pH, (b) plot of C/C0 versus irradiation time at various initial solution pH, (c) lowering of CR dye concentration with irradiation time at various CdS photocatalyst content, (d) plot of C/C0 versus irradiation time at various CdS photocatalyst content, (e) lowering of CR dye concentration (C) with irradiation time at various initial CR dye concentration, and (f) plot of C/C0 versus irradiation time at various initial CR dye concentration. | |
The effect of the photocatalyst content on photodegradation of Congo red azo dye has been examined. The results are shown in Fig. 9c and d. It is clearly seen that the addition of the catalyst content results in the enhancement of the photodegradation efficiency. This is due to the increase in the number of dye molecules adsorbed on the catalyst together with the enhancement of catalyst particle density in the area of illumination.15,33 In this study, increasing catalyst content from 25 mg to 50 mg showed a remarkable increase in the efficiency. However, after using up to 75 mg of the CdS photocatalyst only marginal improvement of the photodegradation efficiency was found. Therefore, a further study will be performed by setting the catalyst content at 50 mg.
The effect of the initial dye concentration on the photodegradation efficiency was also investigated. The results are shown in Fig. 9e and f. The initial dye concentration of 5–20 ppm was used. It can be observed that increasing the dye concentration results in the lowering of the photodegradation efficiency. By using a high dye concentration, a remarkable amount of light may be absorbed by the dye molecules in the solution rather than the catalyst. As a result, the reduced photo flux will reach the surface of the catalyst causing a decrease in the degradation efficiency.15,33 The highest initial dye concentration of 20 ppm provided the lowest CR dye degradation efficiency. Using initial dye concentration of either 5 or 10 ppm did not change photodegradation efficiency significantly over 240 min of irradiation. Therefore, the dye concentration was fixed at a high concentration of 10 ppm for further study.
The photocatalytic activity of the visible-light-driven photocatalysts including CdS for photodegradation of organic pollutants has been investigated by various research groups.28–30 In the present work, the CdS photocatalyst was used for degradation of RR141 dye (efficiency of 99.8%) and CR dye (efficiency of 98.7%). The photocatalytic activity of the present CdS catalyst in comparison with those obtained from other catalysts is included and summarized in Table 3. TiO2 and ZnO show high efficiency toward degradation of RR14 dye under UV light illumination.15,35 In contrast, it has been reported that the degradation of RR141 can be achieved by using CdS photocatalyst under visible light irradiation.21 However, it does take longer time, i.e., about 240 min to reach 95% degradation. Interestingly, the present work shows the complete degradation (about 100%) of RR141 by using hydrothermally grown CdS nanoparticles. In the case of CR dye degradation, doping ZnO-based photocatalyst with noble metal provides a high efficiency of about 98% within 60 min.36 The visible-light-driven photocatalyst such as W/TiO2 showed an efficiency of 90% after 180 min. The present work shows an enhanced photodegradation efficiency of 94% after irradiation for only 80 min. All in all, the hydrothermally grown CdS photocatalyst, in the present work, provides a high efficiency under photo irradiation without doping or modification.
Table 3 Comparison of azo dye degradation by using various photocatalysts
| Catalyst |
Dye |
Concentration |
Catalyst loading |
Light source |
Lamp |
Time (min) |
Degradation (%) |
Ref. |
| CdS |
Reactive red 141 |
10 mg L−1 |
50 mg |
Visible |
13 W |
240 |
95 |
17 |
| TiO2 |
Reactive red 141 |
30 mg L−1 |
— |
UV |
— |
90 |
90 |
35 |
| ZnO |
Reactive red 141 |
10 mg L−1 |
50 mg |
UV |
125 W |
240 |
95 |
15 |
| Pd/ZnO |
Congo red |
2.3 × 10⁻⁵ M |
50 mg |
UV |
100 W |
60 |
98 |
36 |
| W/TiO2 |
Congo red |
50 mg L−1 |
500 mg |
Visible |
250 W Halogen lamp |
180 |
90 |
29 |
| CdS |
Reactive red 141 |
10 mg L−1 |
50 mg |
Visible |
15 W |
240 |
100 |
This work |
| CdS |
Congo red |
10 mg L−1 |
50 mg |
Visible |
15 W |
80 |
96 |
This work |
The photocatalytic stability of CdS photocatalyst was also investigated by repeating the azo dye photodegradation experiment five times.15,21 Then the CdS solid was washed with water and then dried in oven. The photocatalytic azo dye degradation activity remained almost constant over 5 cycles as shown in Fig. 10a and b. In the case of RR141 dye, the lowering of the photodegradation efficiency from 99.8% (the virgin sample) to 90.2% (the fifth cycle) is acceptable (see the bar chart in Fig. 10c). In the case of CR dye, interestingly, the lowering of the photodegradation efficiency from 98.7% (the first run) to 94.2% (the fifth run) is very promising. This suggests a good cycling stability of the catalyst. In addition, confirmation of the chemical stability of the CdS catalyst after photodegradation of the azo dye is shown in Fig. 10d. The similar XRD patterns of the CdS sample from both before and after photodegradation for 240 min were reported. All in all, the results indicate the stability and the promising photocatalytic performance of the CdS photocatalyst which is crucial for practical application.
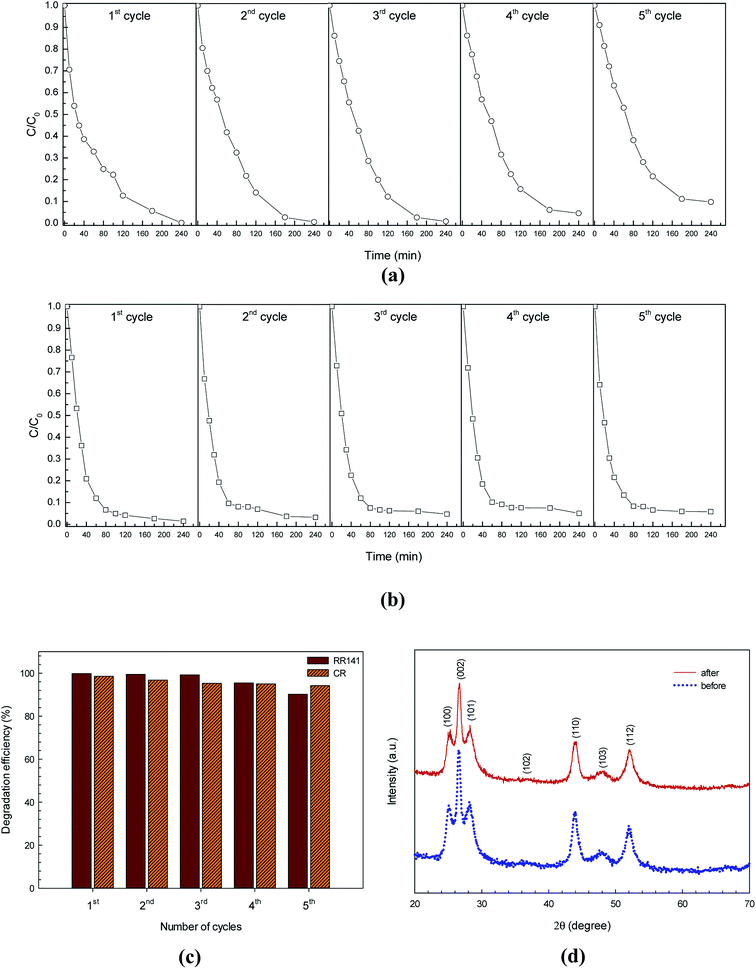 |
| | Fig. 10 Reusability of the CdS photocatalyst for photodegradation of RR141 azo dye (a) and CR dye (b) for five cycles under white light irradiation, bar chart of reusability of the CdS photocatalyst for both dyes (c) and XRD patterns of the CdS photocatalyst before and after photodegradation of azo dye (d). | |
Generally, it is known that Cd metal is toxic. Application of the CdS photocatalyst is based on its advantage of visible-light-driven photocatalytic performance. However, the stability of the CdS photocatalyst has to be taken into consideration as well. Therefore, the possibility of photocorrosion, found in the CdS photocatalyst toward photodegradation of the azo dye, was also studied. The Cd content in CdS photocatalyst before and after photodegradation was determined by using the atomic absorption spectroscopic (AAS) method. In addition, the concentration of Cd2+ in the azo dye solution was investigated as well. The results can be summarized as follows. Firstly, the wt% of Cd in the CdS sample before and after photodegradation was found to be 70% and 65%, respectively. Secondly, 10.70 ppm of Cd2+ in the azo dye solution was found after photodegradation for 240 min. The results indicate that there was a photocorrosion process of the CdS catalyst during photodegradation of azo dye. However, the amount of Cd2+ was quite low. The improvement could be achieved by the preparation of the catalyst with an anti-photocorrosion property such as surface modification of the CdS nanoparticles with a small amount of conjugated polymer,17 preparation of CdS/reduced graphene oxide composites,37 creation of a Z-scheme WO3/CDots/CdS heterostructure,38 and synthesis of the core–shell structure Ni2P@CdS photocatalyst.39 This suggests that it is worth further study.
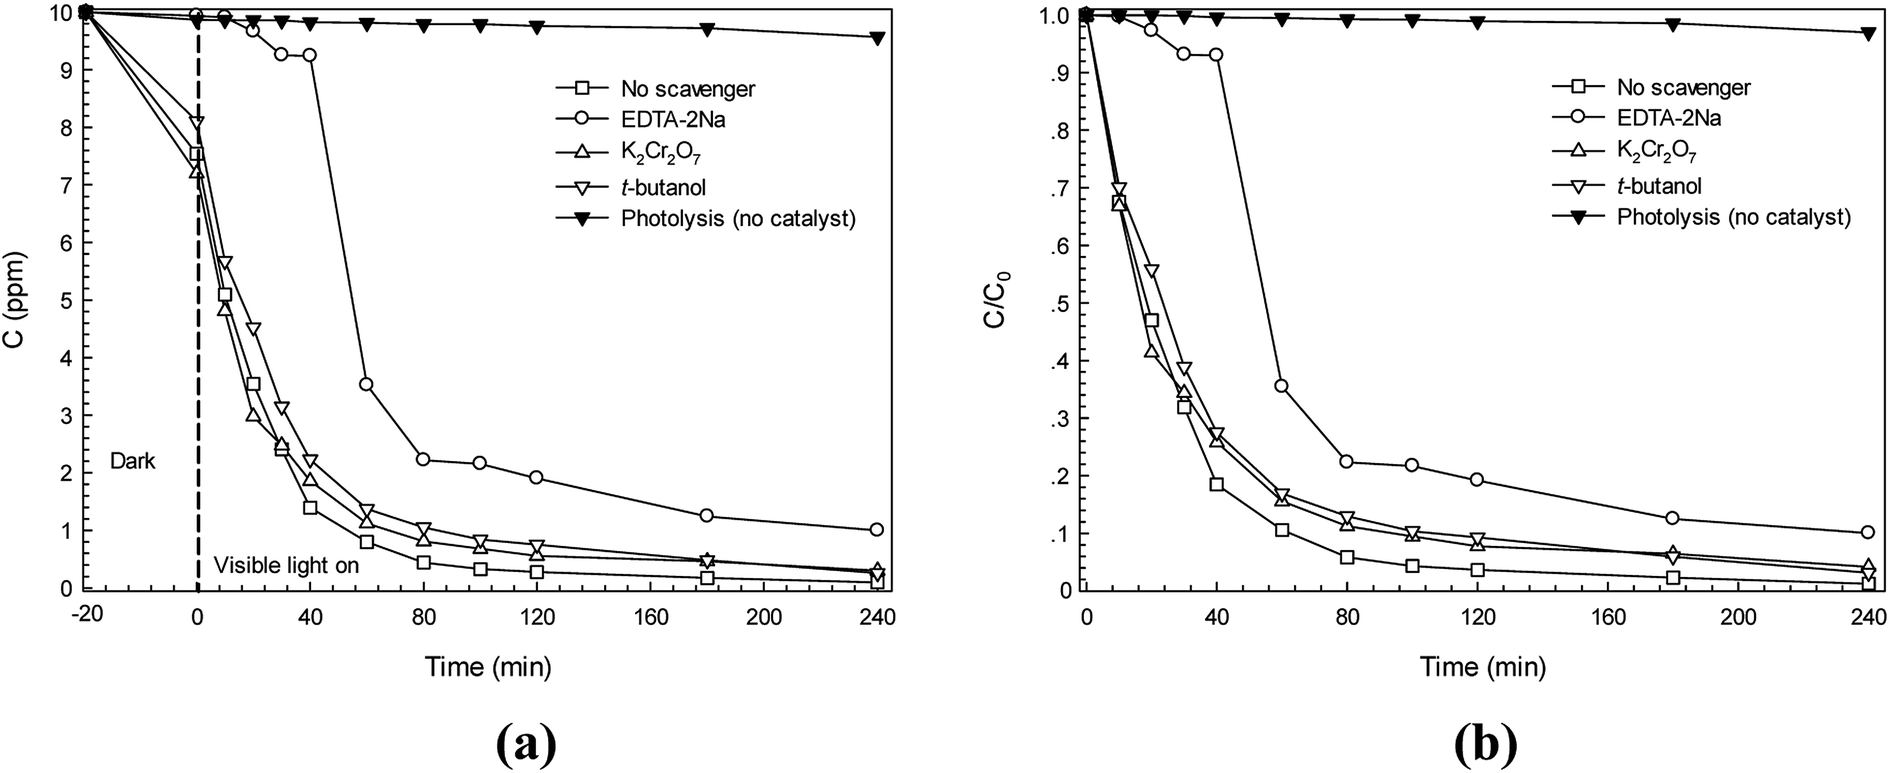
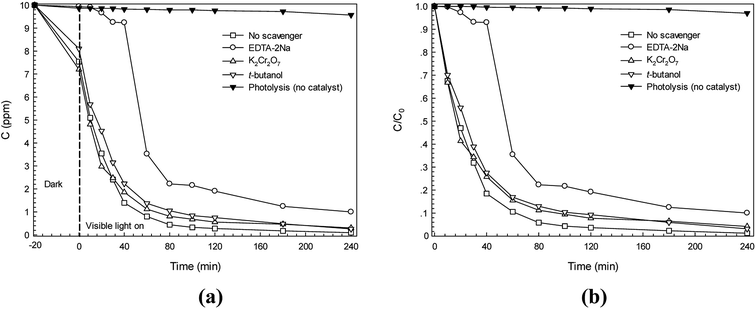
For better understanding of the photocatalytic reaction mechanism, several scavengers were used.15,19 In this study, K2Cr2O7 (electron scavenger), EDTA-2Na (hole scavenger), and t-butanol (˙OH scavenger) were incorporated in the Congo red (CR) dye degradation. It can be seen in Fig. 11a that when either K2Cr2O7 or t-butanol was added, the C0/C is close to that of the CR dye solution in the presence of the catalyst (the control experiment called no scavenger process). After addition of EDTA-2Na, however, a lowering of the photodegradation efficiency from 86.0% to 7.6% was observed after irradiation for only 40 min (see Fig. 11b). This suggests that the direct hole transfer from CdS played a major role in the photodegradation of CR dye. The rate constant for a process with no scavenger is 0.035 min−1 while the rate constant due to the presence of the hole scavenger is only 0.0021 min−1. Therefore, the rate constant also supported that the hole played the most important role in the photodegradation of CR dye. The results presented herein correlated well with the previous report regarding photodegradation of RR141 dye by the CdS photocatalyst which prepared by a chemical precipitation method.19 The reaction mechanism involving RR141 dye photodegradation can be modified. Thus, the promising reaction mechanism involving CR dye photodegradation can be given as
| | |
CdS + hν → CdS + e− + h+
| (6) |
| | |
˙O2− + 2H2O + e− → 2˙OH + 2OH−
| (8) |
| | |
˙O2− + CR dye → products
| (9) |
| | |
h+ + CR dye → products
| (10) |
 |
| | Fig. 11 Effect of some scavengers on photocatalytic degradation kinetics (a) and plot of C/C0 versus irradiation time due to the presence of some scavengers (b). | |
In theory, photocatalysis was based on the creation of charge carriers, holes (h+) in a valence band (VB) and electrons (e−) in a conduction band (CB), which will then react with absorbed species. Superoxide anion radicals (˙O2−) were a product from the reaction of photoelectrons and oxygen (O2). These radicals were then partially converted to hydroxyl radicals (˙OH) which can decompose azo dyes effectively. It should be noted that the hole played the most important role in the degradation of CR dye. The dye was broken down to carbon dioxide (CO2), water (H2O) and simple inorganic by-products.40
4. Conclusions
The highly stable CdS nanoparticles were fabricated by a facile and capping agent-free hydrothermal technique. Neither an expensive reagent nor an organic solvent was used. It is simple, green, catalyst-free and also easily controlled. The synthesized CdS belongs to the hexagonal wurtzite structure. It shows high crystallinity and excellent optical properties. The CdS semiconductor was further used as an effective photocatalyst for the degradation of RR141 and CR azo dyes. The catalyst provides high photodegradation efficiency of 99.8% and 99.0% toward degradation of reactive red azo dye (RR141) and Congo red (CR) dye, respectively. The chemical kinetics result indicates that the photocatalytic degradation of both azo dyes follows first-order kinetics. The photogenerated hole played the major role in photodegradation of the azo dye. The chemical structure of the CdS photocatalyst remained stable after photodegradation. The CdS photocatalyst retains its original efficiency after the fifth cycle of reuse. This indicates the advantages of stability and reusability. The CdS nanostructures will be suitable for the removal of highly toxic and hazardous organic materials in the environmental protection.
Conflicts of interest
There are no conflicts to declare.
Acknowledgements
We would like to thank Materials Chemistry Research Center, Department of Chemistry and Center of Excellence for Innovation in Chemistry (PERCH-CIC), Faculty of Science, Khon Kaen University for providing partial financial support and research facilities. Teeradech Senasu is grateful to Materials Chemistry Research Center for partial funding support. Suwat Nanan wishes to acknowledge Faculty of Science, Khon Kaen University for partial financial support.
References
- E. Topkaya, M. Konya, H. C. Yatmaz and K. Ozturk, J. Colloid Interface Sci., 2014, 430, 6–11 CrossRef PubMed.
- K. He, G. Chen, G. Zeng, A. Chen, Z. Huang, J. Shi, T. Huang, M. Peng and L. Hu, Appl. Catal., B, 2018, 228, 19–28 CrossRef.
- A. Dumbrava, G. Prodan, D. Berger and M. Bica, Powder Technol., 2015, 270, 197–204 CrossRef.
- X.-J. Jia, J. Wang, J. Wu, W. Teng, B. Zhao, H. Li and Y. Du, RSC Adv., 2018, 8, 1621–1631 RSC.
- E. Zuriaga-Agustí, E. Alventosa-deLara, S. Barredo-Damas, M. I. Alcaina-Miranda, M. I. Iborra-Clar and J. A. Mendoza-Roca, Water Res., 2014, 54, 199–210 CrossRef PubMed.
- M. S. Mahmoud, M. K. Mostafa, S. A. Mohamed, N. A. Sobhy and M. Nasr, J. Environ. Chem. Eng., 2017, 5, 547–554 CrossRef.
- Y. Y. Lau, Y. S. Wong, T. T. Teng, N. Morad, M. Rafatullah and S. A. Ong, Chem. Eng. J., 2014, 246, 383–390 CrossRef.
- S. Larouk, R. Ouargli, D. Shahidi, L. Olhund, T. C. Shiao, N. Chergui, T. Sehili and R. Roy, Chemosphere, 2017, 168, 1648–1657 CrossRef PubMed.
- X. Li, X. Jin, N. Zhao, I. Angelidaki and Y. Zhang, Bioresour. Technol., 2017, 228, 322–329 CrossRef PubMed.
- Z. Es' haghzade, E. Pajootan, H. Bahrami and M. Arami, J. Taiwan Inst. Chem. Eng., 2017, 71, 91–105 CrossRef.
- P. Aravind, H. Selvaraj, S. Ferro and M. Sundaram, J. Hazard. Mater., 2016, 318, 203–215 CrossRef PubMed.
- G. R. S. Andrade, C. C. Nascimento, E. C. S. Júnior, D. T. S. L. Mendes and I. F. Gimenez, J. Alloys Compd., 2017, 710, 557–566 CrossRef.
- X. Yan, Z. Wu, C. Huang, K. Liu and W. Shi, Ceram. Int., 2017, 43, 5388–5395 CrossRef.
- D. Ariyanti, M. Maillot and W. Gao, J. Environ. Chem. Eng., 2018, 6, 539–548 CrossRef.
- S. Kakarndee and S. Nanan, J. Environ. Chem. Eng., 2018, 6, 74–94 CrossRef.
- M. Kaur, S. K. Mehta and S. K. Kansal, J. Environ. Chem. Eng. DOI:10.1016/j.jece.2017.04.006.
- D. Wang, C. Bao, Q. Luo, R. Yin, X. Li, J. An and Z. Xu, J. Environ. Chem. Eng., 2015, 3, 1578–1585 CrossRef.
- Y. Wang, Y. Wu, Y. Qin, J. Rao, G. Chen, C. Lv and B. Liu, CrystEngComm, 2016, 18, 7523–7529 RSC.
- T. Senasu and S. Nanan, J. Mater. Sci.: Mater. Electron., 2017, 28, 17421–17441 CrossRef.
- H. Jin, L. Chen, A. Liu, L. Guan, D. Yin, P. Lin, S. Wang and W. Jiang, RSC Adv., 2016, 6, 28229–28235 RSC.
- X. Tang, J.-H. Zhao, Y.-H. Li, Z.-J. Zhou, K. Li, F.-T. Liu and Y.-Q. Lan, Dalton Trans., 2017, 46, 10553–10557 RSC.
- S. N. Jamble, K. P. Ghoderao and R. B. Kale, J. Phys. Chem. Solids, 2018, 114, 109–120 CrossRef.
- M. D. Rao and G. Pennathur, Mater. Res. Bull., 2017, 85, 64–73 CrossRef.
- N. Qutub, B. M. Pirzada, K. Umar and S. Sabir, J. Environ. Chem. Eng., 2016, 4, 808–817 CrossRef.
- R. S. Aliabadi and N. O. Mahmoodi, J. Cleaner Prod., 2018, 179, 235–245 CrossRef.
- A. Dumbrava, D. Berger, G. Prodan, F. Moscalu and A. Diacon, Mater. Chem. Phys., 2016, 173, 70–77 CrossRef.
- P. Sharma, D. S. Rana, A. Umar, R. Kumar, M. S. Chauhan and S. Chauhan, Ceram. Int., 2016, 42, 6601–6609 CrossRef.
- S. V. P. Vattikuti, C. Byon and I.-L. Ngo, Mater. Res. Bull., 2016, 84, 288–297 CrossRef.
- A. Mayoufi, M. F. Nsib and A. Hous, C. R. Chim., 2014, 17, 818–823 CrossRef.
- R. Elilarassi, S. Maheshwari and G. Chandrasekaran, Optoelectron. Adv. Mater., Rapid Commun., 2010, 4, 309–312 Search PubMed.
- S. Kakarndee, S. Juabrum and S. Nanan, Mater. Lett., 2016, 164, 198–201 CrossRef.
- Z. K. Heiba, M. B. Mohamed and N. G. Imam, J. Mol. Struct., 2015, 1094, 91–97 CrossRef.
- A. Phuruangrat, T. Thongtem and S. Thongtem, Powder Technol., 2013, 233, 155–160 CrossRef.
- N. R. Yogamalar, K. Sadhananham, A. C. Bose and R. Jayavel, RSC Adv., 2015, 5, 16856–16869 RSC.
- F. Sayilkan, S. Erdemoglu, M. Asilturk, M. Akarsu, S. Sener, H. Sayikan, M. Erdemoglu and E. Arpac, Mater. Res. Bull., 2006, 41, 2276–2285 CrossRef.
- N. Güy, S. Cakar and M. Özacar, J. Colloid Interface Sci., 2016, 466, 128–137 CrossRef PubMed.
- M. Huang, J. Yu, C. Deng, Y. Huang, M. Fan, B. Li, Z. Tong, F. Zhang and L. Dong, Appl. Surf. Sci., 2016, 365, 227–239 CrossRef.
- J. Zhang, Y. Guo, Y. Xiong, D. Zhou and S. Dong, J. Catal., 2017, 356, 1–13 CrossRef.
- W. Zhen, X. Ning, B. Yang, Y. Wu, Z. Li and G. Lu, Appl. Catal., B, 2018, 221, 243–257 CrossRef.
- Y. Y. Lau, Y. S. Wong, T. T. Teng, N. Morad, M. Rafatullah and S. A. Ong, Chem. Eng. J., 2014, 246, 383–390 CrossRef.
|
| This journal is © The Royal Society of Chemistry 2018 |
Click here to see how this site uses Cookies. View our privacy policy here. 
 Open Access Article
 This Open Access Article is licensed under a Creative Commons Attribution-Non Commercial 3.0 Unported Licence
 *a
*a