DOI:
10.1039/C8RA03117G
(Paper)
RSC Adv., 2018,
8, 20277-20286
Fast photocatalytic degradation of dyes using low-power laser-fabricated Cu2O–Cu nanocomposites
Received
22nd April 2018
, Accepted 28th May 2018
First published on 4th June 2018
Abstract
In this study, we report a simple method to controllably synthesize Cu2O–Cu nanocomposites by using a low-power CO2 laser, and application of these nanomaterials for photocatalytic degradation of methylene blue (MB). Our experiments demonstrate that efficient tailoring of the Cu2O–Cu nanocomposites can be realized by accurate control and optimization of the ambient parameters, such as laser energy and NaOH concentration. Compared to hydrothermally fabricated Cu2O–Cu catalysts, the laser-reduced composites exhibit better visible-light photocatalytic activity for MB degradation, which could be attributed to the formation of special catalytically active structures on the nanocomposite surface. Under the conditions of 10 mA laser irradiation and 5 M NaOH addition, the fabricated Cu2O–Cu composites had the highest catalytic activity. The degradation rate of MB is 90.10% after visible-light irradiation for 50 min under the optimum conditions. The as-synthesized Cu2O–Cu composites showed selective dye degradation, and exhibit relatively higher photocatalytic efficiency for positively charged dyes. This work could lead to facile synthesis of high-performance photocatalysts for fast removal of environmentally hazardous dyes from aqueous solution.
1. Introduction
Organic dyes are widely used in various industrial processes and discharged into the environment, resulting in them being common contaminants in wastewater. Most of the dyes are stable, recalcitrant, colorant, and even potentially carcinogenic and toxic. The deleterious effects of dyes on human health and ecosystems have driven researchers to develop facile and effective methods to treat dye wastewater.1 Semiconductor metal oxides have been utilized as photocatalysts due to their high photosensitivity and stability.2,3 Among the various semiconductor materials, titanium dioxide (TiO2) is the most widely used photocatalyst for the decomposition of organic pollutants.4 However, its limited activity under visible light and fast recombination of photoinduced charge carriers limit its practical application.5,6 There are mainly two approaches to promote the visible-light responsive capability of these metal oxide photocatalysts.7 One is to dope with other elements to modify their physical and chemical properties.8–11 Doong et al. prepared Cu, N-codoped titanate nanotubes and the surface normalized reaction rate constants for bisphenol A degradation were 4.3 and 1.5 times higher than those of Degussa P25 TiO2 under UV and visible light irradiation, respectively.12 Belver et al. synthesized Zr-doped TiO2 supported on delaminated clay materials which exhibited higher degradation rates than the undoped TiO2, and this work demonstrated the potential application of metal-doped anatase and delaminated clay photocatalysts.13 The other method is to develop new types of semiconductors with narrower band gap for visible-light-driven. Tai et al. reported the introduction of oxygen excess defects into the TiO2 lattice led to an upshift of VB maximum, causing the band gap to be reduced to 2.95 eV.14 Nur'aeni et al. produced a novel hybrid photocatalyst by attempting the mussel-inspired linking of β-FeOOH (akaganeite) on core Fe3O4 nanoparticles which with narrow band gap of 1.79 eV.15 H. Al-Kandari shown that the band gap energy for TiO2 was lowered from 3.11 to 2.96 eV when it was composited with rGO to form the rGOTi.16
Cuprous oxide (Cu2O) is a promising low-cost, narrow bandgap material in visible-light photocatalytic field. As a typical metal-deficient p-type semiconductor with a bandgap between 2.0–2.2 eV, the spectral absorptance of the naturally occurring copper oxide has a bulge at 600 nm and a plateau that falls off at about 700–800 nm, so Cu2O can absorb most of the visible light and the theoretical photoelectric conversion efficiency can reach 18%.17,18 Because of its wonderful absorbance, it has obtained wide application for photoelectrolytic cells and solar energy conversion with great performance.19–21 Alami et al. synthesized crystalline Cu2O, the relative directional spectral absorptance of all samples exhibit a wide inverted U-curve spanning the visible range and into near-IR which indicating a obviously enhancement of optical absorptance.22
There are many approaches to fabricate Cu2O micro- and nanocrystals, such as hydrothermal route, aqueous colloidal solution method, and chemical vapour deposition method.23–26 Cheng et al. prepared Cu2O–Cu composites with different coverage of Cu NPs, and the highest degradation rate of methyl blue (MB) was about 88% after visible-light irradiation for 60 min.4 Hong et al. fabricated Cu2O/Cu hollow microsphere with controllable shape by the one-pot solvothermal redox method. The degradation rate of methyl orange was about 90% after Xe arc lamp irradiation for 60 min.27 Deng et al. prepared Cu2O spherical crystals by hydrothermal method. The degradation rate of methyl orange was about 85% after visible-light irradiation for 90 min.28 All these results demonstrate that Cu2O catalyst fabricated by traditional chemistry route have well photocatalytic activity, but it always needs several hours to finish the reduced process by heated in stainless steel autoclave or ordinary beaker, and needs to keep stirring throughout this process.
In this study, we try to replace the heat process in traditional chemistry route by low energy laser irradiation with several minutes to gain the more efficient Cu2O photocatalyst.
The main objectives of this study are (1) to facilely and rapidly fabrication of Cu2O–Cu nanocomposites by using a low-power CO2 laser without any template and surfactant and (2) to evaluate the catalytic capabilities of Cu2O–Cu nanocomposites under visible light irradiation. Methylene blue (MB) was selected as the target compound in this work due to its wide applications in industry.
There have been many studies using high-power pulsed laser etching to synthesis nanomaterials. To the best of our knowledge, this is the first work that fabricates Cu2O–Cu nanocomposite with assistance of a low-energy CO2 laser which is more energy saving and environmental friendly. Our results will be beneficial to the application of laser-fabricated nanocomposites in photocatalysis of hazardous materials.
2. Materials and methods
2.1 Materials
Cupric sulfate (CuSO4·5H2O), ethylene glycol, sodium hydroxide, H2O2, D-glucose, benzoquinone (BQN) and isopropanol (IPA) were obtained from Yuanli Technology Co., Ltd. (Tianjin, China). All chemicals were of analytical grade and used without further purification. Aqueous solutions were prepared using deionized water.
2.2 Synthesis of Cu2O–Cu composites
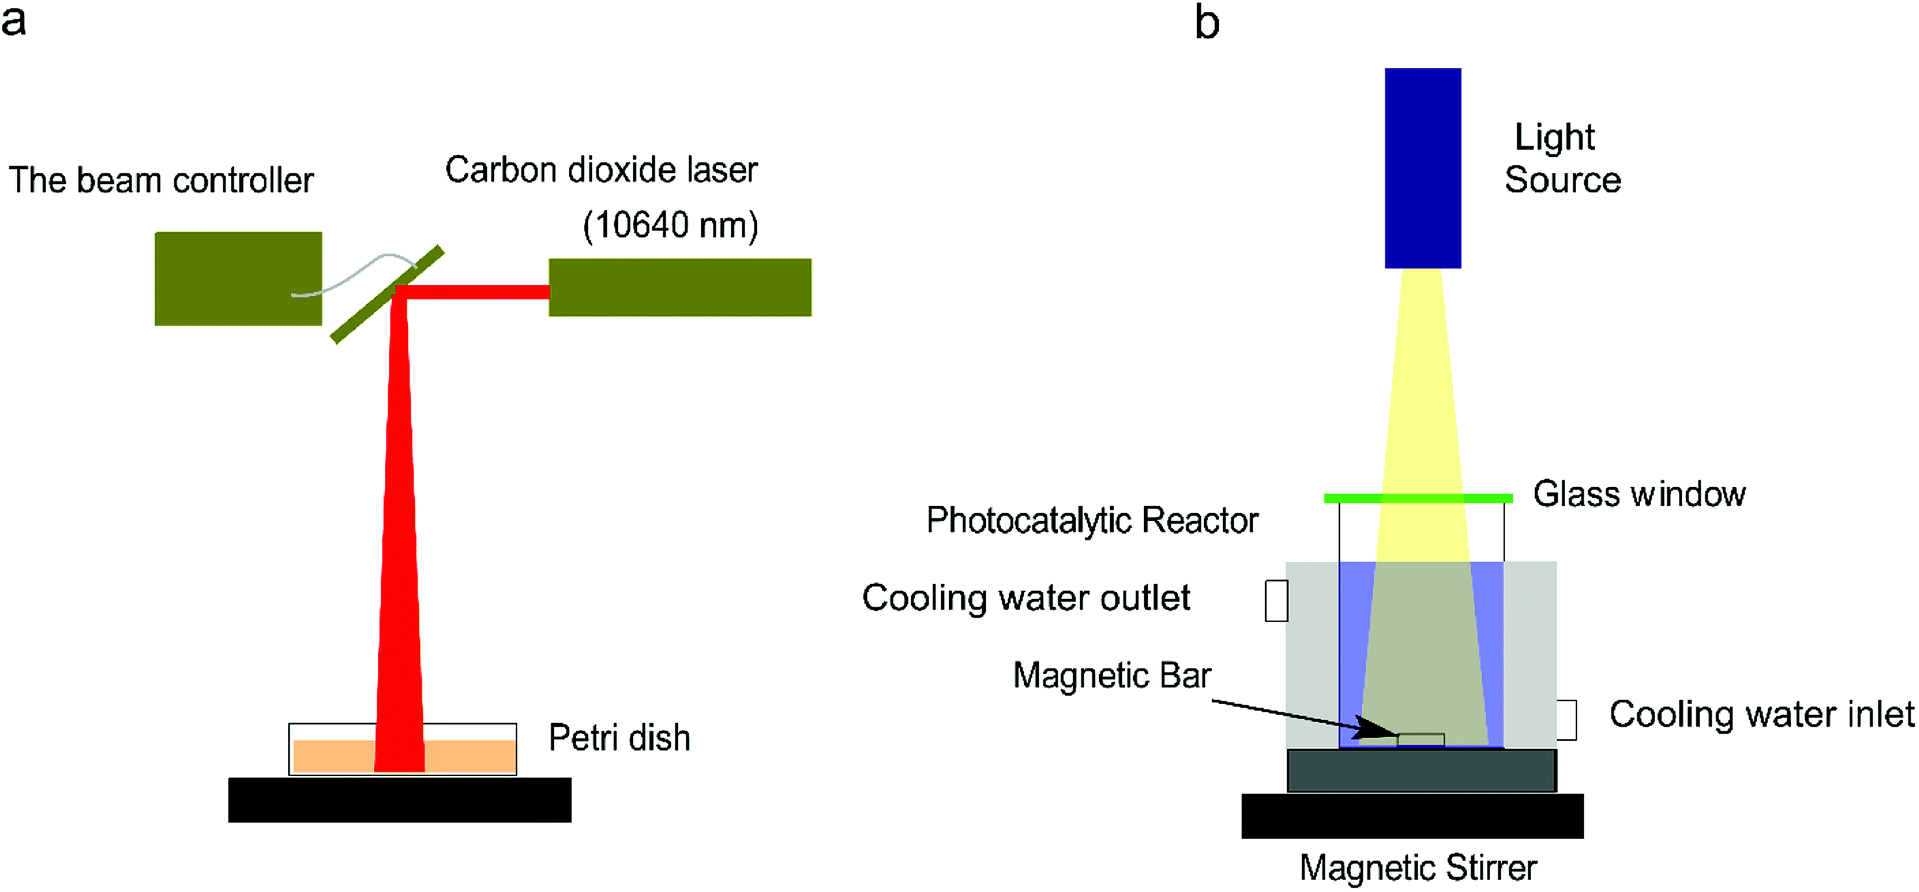
The fabrication setup for Cu2O–Cu composites is depicted in Fig. 1a. It mainly consists of a CO2 laser and a beam controller (Xinbang 3020, China). The Cu2O–Cu composites were synthesized following a simple laser redox procedure as follows:4 0.5 g of CuSO4·5H2O, 20 mL of ethylene glycol, and 10 mL of deionized water were added into a cylindrical beaker, and then the beaker was immersed in a 60 °C water bath with vigorously stir for 10 min till the mixture dissolved completely. Afterwards, 10 mL of NaOH solution (5 M) was added dropwise. After 5 min, 10 mL of D-glucose solution (1.1 M) was added into the mixture rapidly. The color of the suspension changed from blue to yellow immediately, and finally to orange. After the reaction, 30 mL of the suspension was transferred into a Petri dish (diameter: 10 cm, height: 1.5 cm) and irradiated by the CO2 laser with different energy. The position of the laser head was controlled by a laser controller to allow the laser beam irradiate onto the samples. The precipitate was collected by centrifugation at 11![[thin space (1/6-em)]](https://www.rsc.org/images/entities/char_2009.gif) 000 rpm for 5 min and washed by ethanol and deionized water for several times. The precipitate was dried in vacuum at 60 °C for 1 h.
000 rpm for 5 min and washed by ethanol and deionized water for several times. The precipitate was dried in vacuum at 60 °C for 1 h.
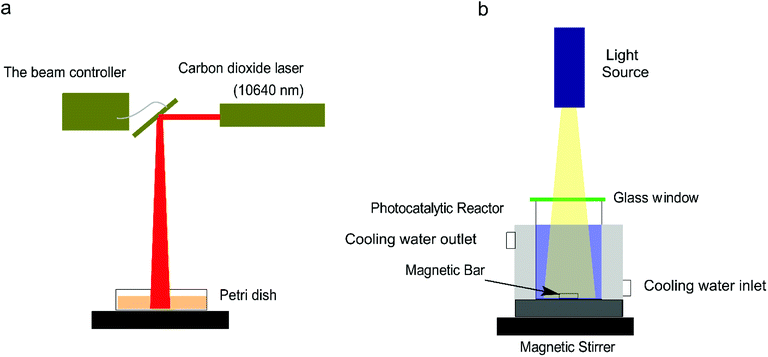 |
| | Fig. 1 Schematic diagram of the experimental setup for (a) Cu2O–Cu fabrication with different laser energy (10 mA, 20 mA, 30 mA) and different concentration of NaOH (5 M and 7 M) and (b) photocatalytic dye degradation. | |
2.3 Characterization
The as-prepared samples were determined by X-ray powder diffraction (XRD, D/max-2500, Rigaku co., Japan), using Cu Kα radiation (λ = 0.15406 nm, 18 kW). The morphology and microstructure of the samples were characterized by a scanning electron microscopy (SEM, S-4800, Hitachi Co., Japan). X-ray photoelectron spectroscopy (XPS) measurements were performed on a Thermo Escalib spectrometer (Thermo Electron Co, America) with Al Kα X-ray radiation as the X-ray source for excitation. UV-vis absorption spectra of organic dyes were measured by a Unico UV-Vis scanning spectrometer (Shanghai, China).
2.4 Photocatalytic degradation of MB
The photocatalytic activity experiments were conducted in a simple photocatalytic reactor equipped with a cooling water circulator to maintain the temperature of liquid at about 25 °C during the experiment. The light irradiation was performed using a halogen lamp (0.314 W cm−2) (Fig. 1b). In a typical procedure, 9 mg of Cu2O–Cu composites were well dispersed into 30 mL of MB solution (10 mg L−1) and stirred for 1 h in dark to reach adsorption–desorption equilibrium between the dye and the catalyst. A certain amount of H2O2 solution (30 wt%) was added into the suspension before turning on the halogen lamp. The samples were drawn from the reactor periodically to record their UV-vis spectra on the spectrophotometer. The degradation performance of catalyst with different MB initial concentrations (from 5 –25 mg L−1) and H2O2 addition were also investigated. The degradation rate of MB was calculated using the following equation (eqn (1)):| |
 | (1) |
where A is the value of absorbency of MB solution at 664 nm in different intervals and C is the concentration of the dyes in different intervals.
The kinetics of the photocatalytic degradation rate of MB was determined using the Langmuir–Hinshelwood kinetics model,29,30 as given in the following (eqn (2)):
| |
 | (2) |
where
C0 is the initial concentration of MB at
t = 0, and
C is the remained concentration of MB at any irradiation time
t (min).
kapp is the apparent first-order rate constant (min
−1), which can be calculated from the slope ln(
C0/
C)
versus irradiation time
t.
2.5 Effect of irradiation light wavelength
The light source was a 50 W halogen tungsten lamp which was vertically placed above a filter (450 nm, 600 nm) with a distance of 1 cm and the reaction beaker was placed under the filter with a distance of 0.5 cm. The cooling water was circulating during the reaction to maintain a constant temperature of the solution. 3 mg of Cu2O–Cu composites was dispersed into 10 mL of MB solution (10 mg L−1) and stirred for 1 h in dark to reach adsorption–desorption equilibrium. Then 0.01 mL of H2O2 solution (30 wt%) was added into the mixture solution, and the solution was irradiated for 50 min. The samples were drawn from the reactor to record their UV-vis spectra on the spectrophotometer.
2.6 Radical trapping experiment
To detect the mechanism of the photocatalytic degradation, the radical trapping experiments were performed. For testing ·O2−, 0.023 mM BQN (·O2− scavenger) was added in the typical degradation process. And for testing ·OH, 2 mM IPA (·OH scavenger) was added in the typical degradation process. The samples were drawn from the reactor to record their UV-vis spectra on the spectrophotometer.
3. Results and discussion
3.1 Characterization
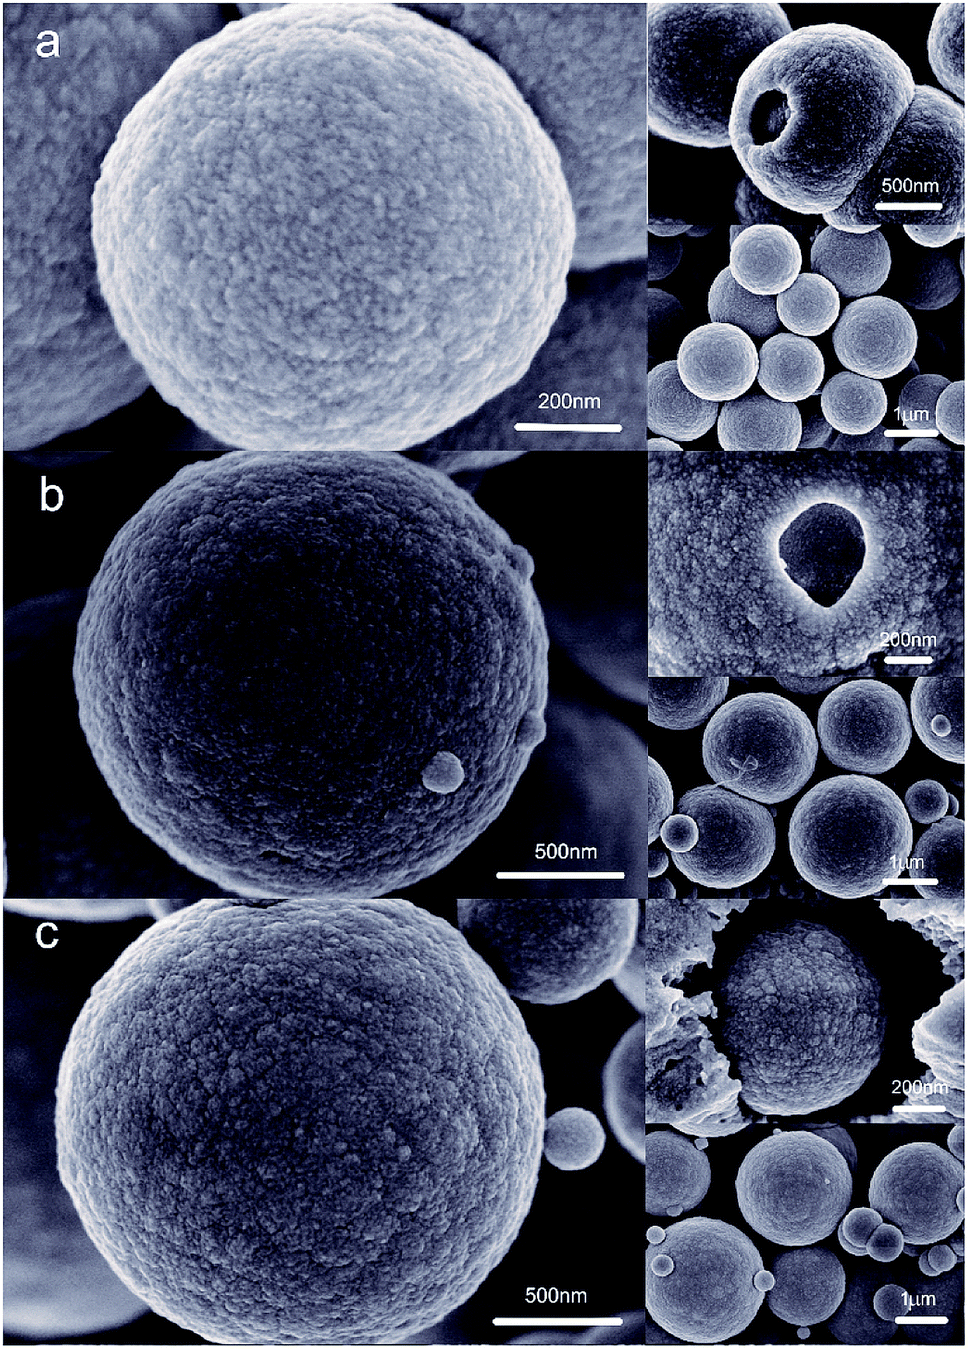
The morphologies of Cu2O–Cu composites synthesized under different laser power (10 mA, 20 mA, 30 mA) were characterized by SEM (Fig. 2). It can be seen the particles of all the samples are sphere-like in shape with distinct surface protrusions. The diameter of microspheres rises from about 1 μm to 3 μm with the increase of laser energy, and there are many small spherical particles on the surface of microspheres. In addition, with the increase of irradiation energy, the Cu2O–Cu spheres demonstrate typical core–shell structure. For the samples synthesized by laser irradiation with 10 mA, the diameters of the large particles and small spherical particles are about 1 μm and 50 nm, respectively. The corresponding energy-dispersive X-ray (EDX) spectrums suggest all the samples are composed of Cu2O and Cu crystals together. And the photocatalytic efficiency of particles fabricated by 10 mA laser irradiation present the best performance.
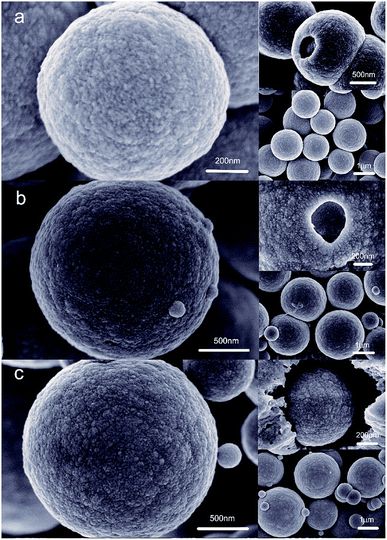 |
| | Fig. 2 SEM images of the Cu2O–Cu photocatalysts synthesized by (a) 10 mA laser, (b) 20 mA laser, (c) 30 mA laser. | |
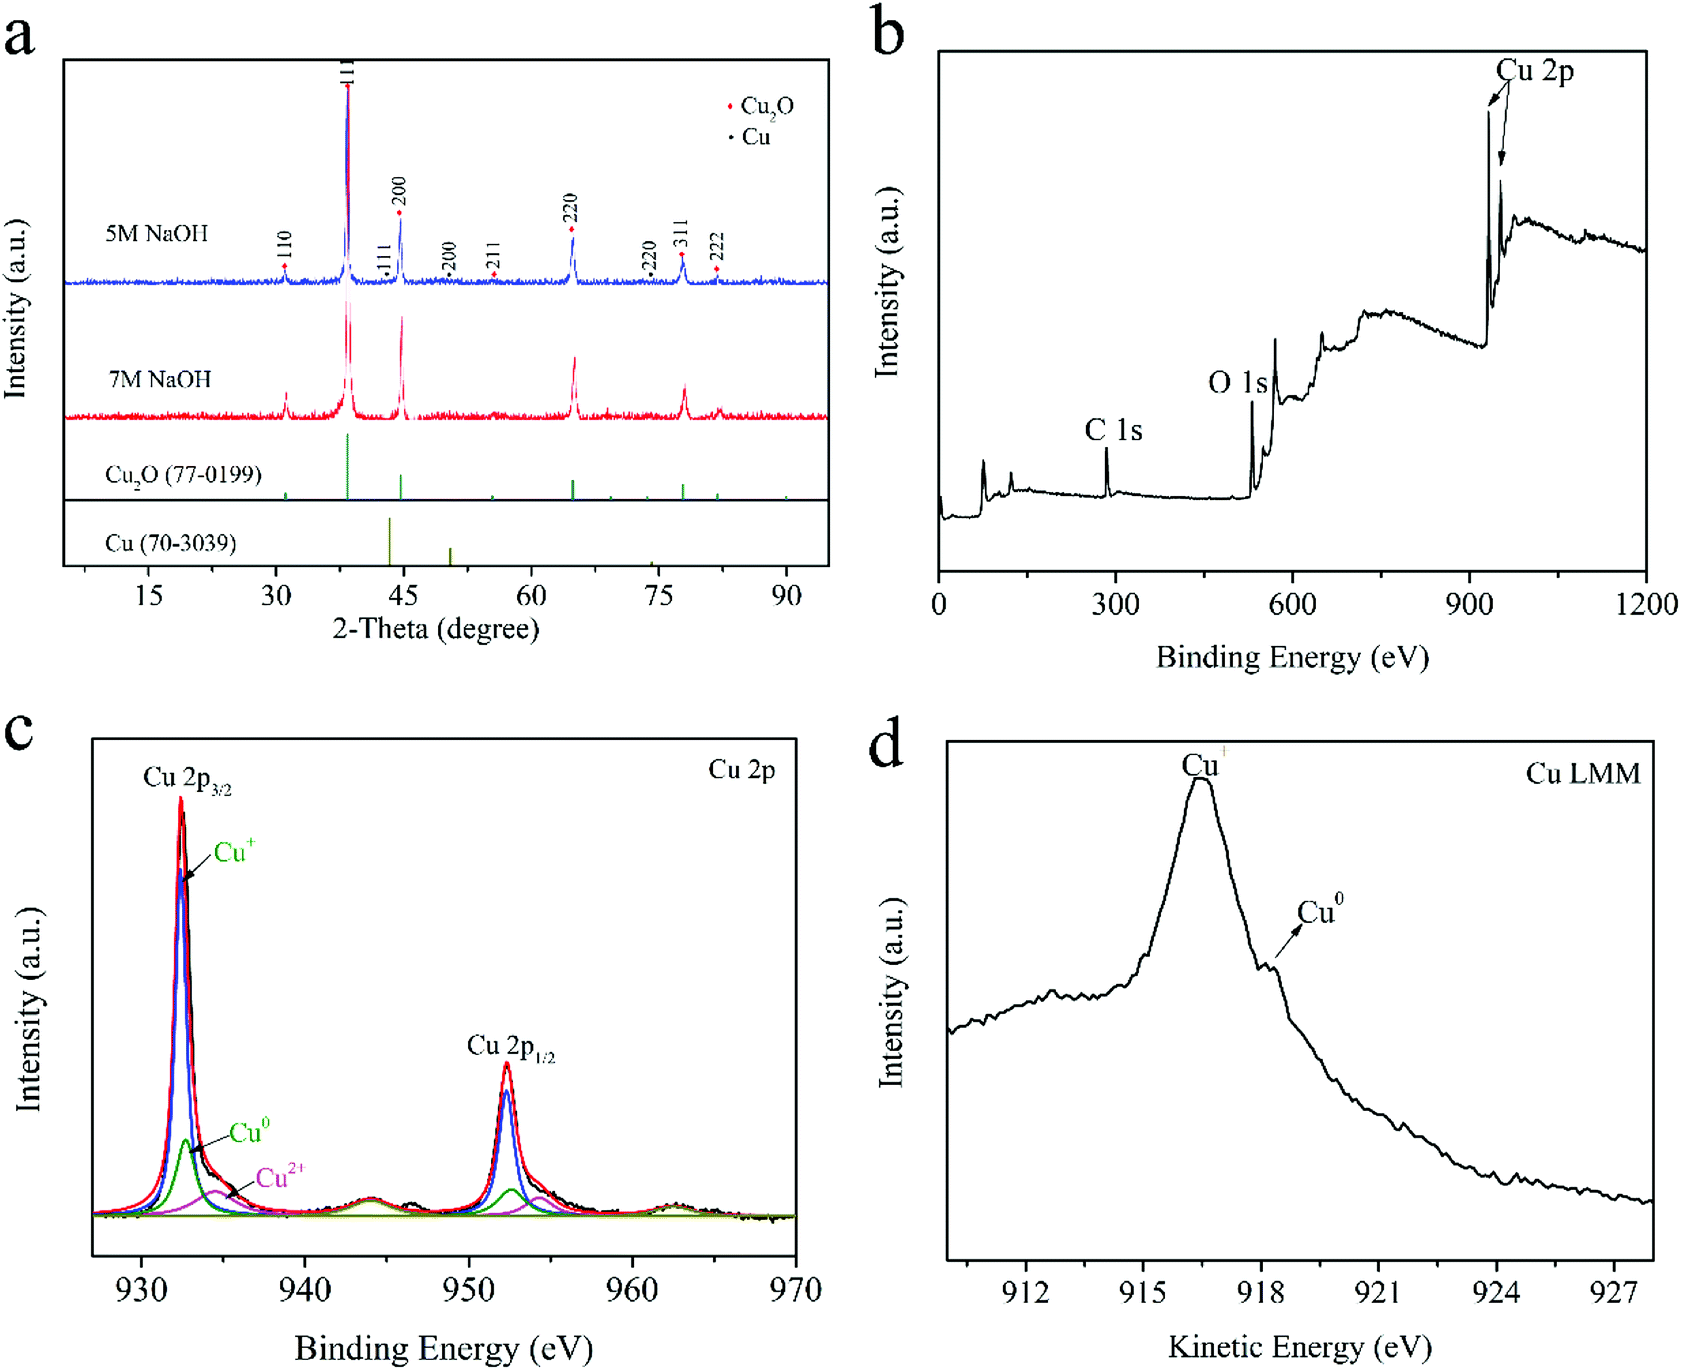
Fig. 3a shows the XRD patterns of Cu2O–Cu composites fabricated with different concentrations of NaOH solution. The diffraction peaks centered at 29.632, 36.502, 42.401, 52.579, 61.518 and 77.565 can be ascribed to those of primitive cubic Cu2O (JCPDS No.77-0199) and other peak at 43.341, 50.478, 74.172 are the typical diffraction from cubic Cu (JCPDS no.70-3039), which demonstrate that the as-prepared products are the composite of Cu2O and Cu, and Cu2O is dominant according to the relative intensities of both phase. The calculated adsorption energies for H2O2 on the Cu2O (111), Cu2O (110) surfaces are 4.27 and 0.60 eV, respectively. And, the (111) surface of Cu2O is generally regarded as a highly reactive facet.31 The presence of these two cubes makes the Cu2O–Cu composite exhibits well catalytic performance. The result also indicated both the samples had the same XRD patterns and the only difference between them is the intensity of cube peak. The contents of Cu2O and Cu compositions for S-5M NaOH (synthesized by using 5 M NaOH) are about 89.77 wt% and 10.23 wt%, respectively. For S-7 M NaOH (synthesized by using 7 M NaOH), these values are about 91.21 wt% and 8.79 wt%, respectively. It can be supposed that the better photocatalytic performance of sample S-5M NaOH may result from its higher Cu composition, producing stronger electronic conduction effect. In addition, the diffraction peaks of all cubes are sharp and have low noise, implying that it has high degree of crystallinity.
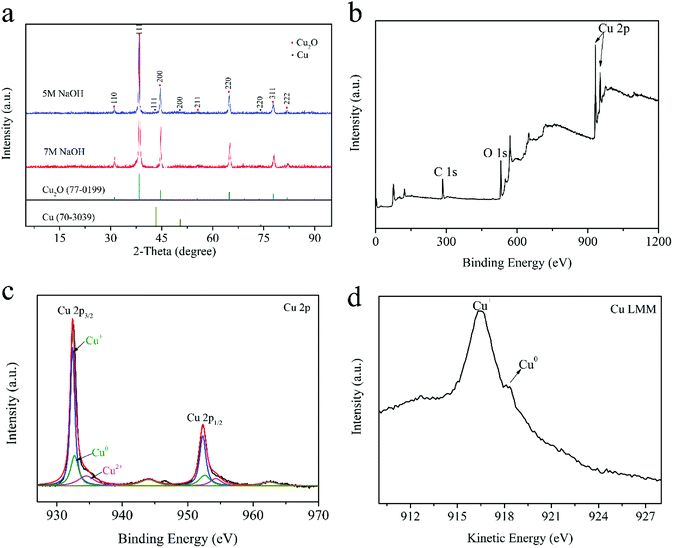 |
| | Fig. 3 XRD patterns of the Cu2O–Cu catalysts synthesized by using 5 M and 7 M NaOH, respectively (a); XPS spectra of the Cu2O–Cu catalyst synthesized under the optimum condition (5 M NaOH, 10 mA laser energy), including XPS full spectrum (b), Cu 2p spectrum (c), and Cu LMM Auger spectrum (d), respectively. | |
XPS measurement was carried out to investigate the element composition and the chemical valence of the prepared composites. The results are shown in Fig. 3b–d, the binding energies for C (1s), O (1s) and Cu (2p) are 284.8 eV, 531.0 eV, 932.6 eV, respectively, indicating the existence of Cu and O in the composites. In Fig. 3c, the peaks at 932.4 eV and 952.28 eV can be attributed to Cu 2p3/2 and Cu 2p1/2 of Cu2O or Cu0, respectively. It is difficult to identify the Cu+ or Cu0 in this spectrum for the overlap of its binding energy.32 Thus, the Cu LMM Auger spectra were collected to effectively distinguish the states of Cu. As shown in Fig. 3d, the peak located at 918.2 eV can be assigned to Cu0 state and the weak signal at about 916.32 eV comes from Cu+ state. Besides, the peak of Cu 2p3/2 and Cu 2p1/2 also related to Cu2+. It is inevitably appearing a small amount of CuO in the composites.33 We can deduce that the nano-sized Cu2O and Cu are distributed in mosaic form on the surface of big spheres. Based on the aforementioned results, we can propose the growth mechanism of Cu2O–Cu composites as follows:
| | |
OHCH2CH2OH → CH3COH + H2O
| (3) |
| | |
OH–CH2–CH2–OH + Cu2+ → [Cu(C2H6O)]2+
| (4) |
| | |
[Cu(C2H6O)]2+ + OH− → Cu(OH)2 + HOCH2CH2OH
| (5) |
| |
 | (6) |
| |
 | (7) |
| | |
Cu2O + CHO(CHOH)4COOH + O2 → Cu[HO(CHOH)4COO]2 + H2O
| (8) |
| | |
Cu + CHO(CHOH)4COOH + O2 → Cu[HO(CHOH)4COO]2 + H2
| (9) |
As mentioned in previous reports,34,35 spheres are easier to be formed according to the coordinate adsorption, oriented attachment and Oswald ripening route. In the presence of chelating reagent ethylene glycol (EG), Cu2+ can easily be converted into a relatively stable complex [Cu(C2H6O)]2+ (Reaction (4)). In the following nucleation separation and growth steps, the complex is slowly transformed into Cu(OH)2 precursors (Reaction (5)) due to the different stability constants and the sharp decrease of free Cu2+ ion concentration. Under the condition of laser radiation and the presence of glucose, Cu(OH)2 can be reduced to Cu2O and Cu (Reaction (6) and (7)). Driven by the minimization of interfacial energy, the freshly generated Cu2O and Cu irregularities are unstable and tend to assemble into oriented large spheres. As the laser energy increases, some inner Cu2O and Cu crystals will be dissolved again and generate Cu[HO(CHOH)4COO]2 (Reaction (8) and (9)), which can be used as a new copper source for forming small Cu2O–Cu composites spheres redeposited on the surface of sphere (Fig. 4a). Furthermore, the laser light can release a lot of heat to promote the above reactions. Therefore, the laser energy plays an important role in the control of compositions of products, and the concentration of NaOH also influence the morphology of products.
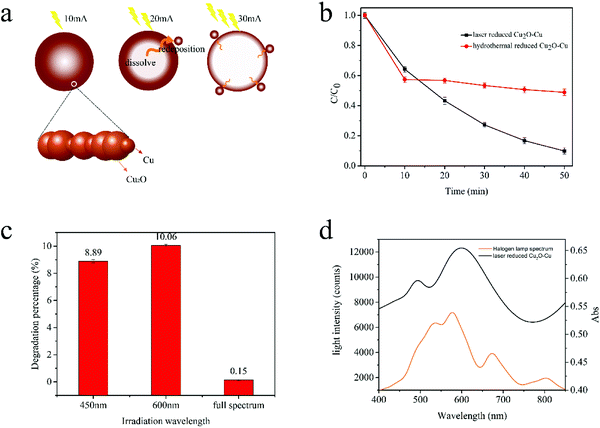 |
| | Fig. 4 (a) Proposed formation scheme of the Cu2O–Cu composite microspheres under the irradiation of different laser energy (10 mA, 20 mA, 30 mA); (b) photocatalytic degradation of MB in the presence of catalysts fabricated by laser-reduced reduction method and hydrothermal method, respectively; (c) typical absorbance spectra of MB dye after irradiation by 450 nm, 600 nm and full spectrum light; (d) UV-vis spectra of halogen lamp and catalysts fabricated by laser-reduced reduction method. | |
3.2 Photocatalytic performance of Cu2O–Cu catalyst
3.2.1 catalytic performance of Cu2O–Cu fabricated by different methods. Cu2O–Cu catalysts fabricated by laser reduced method and hydrothermal method were compared (Fig. 4b). In laser reduction method, the reaction was irradiated by CO2 laser for about 5 min. While in hydrothermal method, the entire reaction was treated by 60 °C water bath for 40 min (the best reaction condition which is confirmed by previously report).The photocatalytic performance of the products was compared in a typical photocatalysis experiments. As shown in Fig. 4b, the catalyst fabricated by hydrothermal method demonstrated well catalytic efficiency in the first 10 minutes, but the catalytic ability decreased significantly after 10 minutes, and the degradation rate was only 51.12% after irradiating for 50 min. While the catalyst fabricated by laser reduced method can degrade 90.10% of MB under the same reaction condition. According to previous reports,28 the catalysts prepared by different methods can have great differences in the structure and morphology including shape, size and exposed crystalline facet, and the photocatalytic activities could be strongly affected by these factors. The photocatalytic activity of Cu2O (111) facet is better than that of its (110) and (100) facets, which is due to Cu2O (111) has more Cu dangling keys than (110) and (100) facets.36 The XRD results illustrated that the Cu2O fabricated by laser reduced method exposed more (111) facet, thus showed superior catalytic performance.
3.2.2 Effect of irradiation light wavelength. To gain further insights into the light response of laser reduced Cu2O–Cu catalysts, the comparative experiments were carried out under irradiation of lights with different wavelength (Fig. 4c). It was found that the sample irradiated with 600 nm light exhibited the best photocatalytic efficiency and the sample irradiated with full spectrum light had the lowest performance. Thus, the as-prepared Cu2O–Cu catalysts is significantly enhancing the red-light-driven photocatalytic performance, indicating its potential application in wastewater treatment. As is known, the optical absorption property of photocatalyst is recognized as the key factor in determining its photocatalytic activity, which is relevant to its electronic structure feature. To see the effectiveness of Cu2O–Cu composite on the adsorption of light emitted from halogen tungsten lamp, UV-vis absorption spectra of catalysts and tungsten-halogen lamp spectrum are compared in Fig. 4d. The laser reduced photocatalyst exhibits two strong adsorption peaks around 500 nm and 610 nm, which enhance the visible-light adsorption. These results indicated the prepared Cu2O–Cu composite is an appropriate catalyst candidate for visible light photocatalysis.
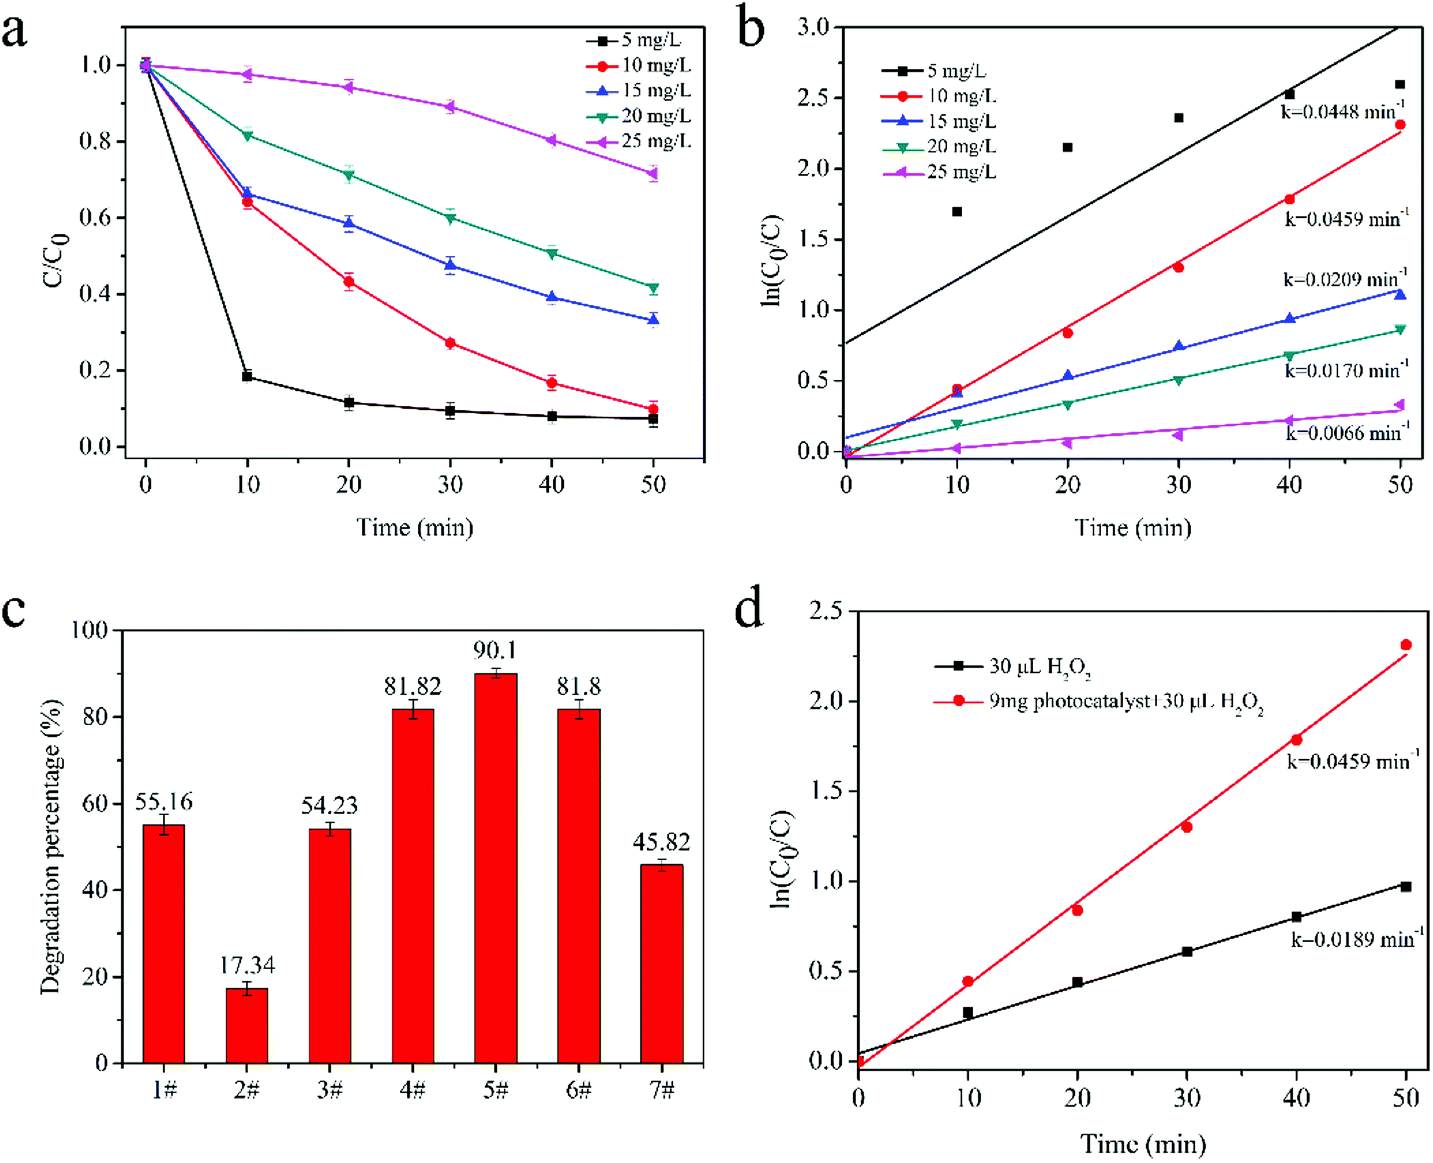
3.2.3 Effect of initial dye concentration. The effect of initial dye concentration under irradiation with a 300 W halogen tungsten lamp was investigated by varying the initial MB concentration from 5 mg L−1 to 25 mg L−1 with 9 mg catalyst. Fig. 5a indicates that the lower concentration of MB solutions have the higher degradation rates. After irradiation for 50 min, the degradation efficiency of 5 mg L−1, 10 mg L−1, 15 mg L−1, 20 mg L−1 and 25 mg L−1 MB reached 92.55%, 90.10%, 66.85%, 58.08% and 28.33%, respectively.
 |
| | Fig. 5 (a) Photocatalytic activity and (b) ln(C0/C) vs. time plot for photodegradation of MB with different concentration from 5–25 mg L−1; (c) photocatalytic degradation percentage of MB with different amount of H2O2 (1#, 0.03 mL H2O2; 2#–7#, 9 mg Cu2O–Cu with 0, 0.01 mL, 0.02 mL, 0.03 mL, 0.04 mL, 0.05 mL H2O2, respectively); (d) ln(C0/C) vs. time plot for MB photodegradation with 30 μL H2O2 only, 30 uL H2O2 and photocatalyst. | |
The explanation of this phenomenon is as follows. Firstly, the MB molecules can adsorb light and decrease the light transmittance, which is unfavourable for the catalysts to absorb light energy. Secondly, excessive MB molecules will adsorb on the surface of the catalyst. Their adsorption will suppress other substrates, such as H2O2, OH− and H2O, to react with the catalyst, and the production of highly reactive species is inhibited. In the low concentration range (less than 20 mg L−1 MB), the degradation process was in accord with L-H mode (Fig. 5b), informing that laser reduced Cu2O–Cu catalysts' photocatalytic process follow pseudo-first-order. However, when the MB solution is too low (5 mg L−1), the high degradation efficiency of the catalyst will make 80% MB molecules removed in initial 20 min. Hence, its degradation performance wasn't in accord with L-H model in the whole 50 min process.
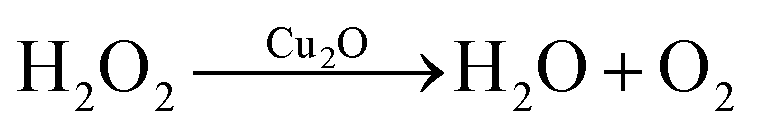
3.2.4 Effect of H2O2 amount. H2O2 is another crucial factor that determine the photocatalytic performance of Cu2O–Cu catalyst. The influence of H2O2 amount was systematically studied through series of comparative tests. As shown in Fig. 5c and d, the degradation efficiency of MB was increased when the amount of H2O2 were increased from 0 mL to 0.03 mL. However, when the amount of H2O2 increased further, the photocatalytic activities were inhibited. The highest degradation rate of 90.10% was obtained with 0.03 mL H2O2. The degradation rates were 55.16% and 17.34% for samples that only using H2O2 or Cu2O–Cu, respectively. The high degradation rate may be attributed to the fact that H2O2 molecules can act as electronic trap to react with photo-generated electrons, and the generated ·OH radicals can further react with MB and enhanced the dye degradation. Previous experiment37 reported that H2O2 molecule is only dissociated on the Cu2O(111) surface and the main dissociation products of H2O2 on the Cu2O(111) surface are ˙OH radicals which is in good agreement with our degradation and XRD results.For the photoexcited Cu2O–Cu system without H2O2, the top valance band of Cu2O is higher than the oxidation potential of H2O, so the photo-generated electron cannot react with H+ (from H2O) and h+ can't react with OH− (from H2O) to form ˙OH which is crucial for degradation process. In addition, the composite structure of Cu2O–Cu raise the valance band of Cu2O because the work function of Cu is smaller than Cu2O. For the photoexcited system of Cu2O–H2O2, positive Cu2O with holes cannot provide electrons for H2O2 dissociation to generate ˙OH.30 For the system of Cu2O–Cu–H2O2, the photo-generate electron is captured by Cu to generate ˙OH with H2O2 molecules on the surface of Cu. Meanwhile, H2O2 molecules can also be dissociated by holes to generate ˙OOH. However, if the amount of H2O2 exceeds the optimum value, it may result in the photochemical reaction between Cu2O and H2O2 as follows (eqn (10) and (11)):
| |
 | (10) |
| | |
Cu2O + H2O2 → CuO + H2O
| (11) |
These reactions will lead to the degradation of Cu2O and H2O2.
3.2.5 Radical trapping experiment. In this study, IPA and BQN were used as scavengers for hydroxyl and peroxy radicals in order to investigate the photocatalytic mechanism of the degradation of MB.As shown in Fig. 6a, the degradation process of MB is similar to the typical degradation process without BQN, implying that ·O2− contributes less to the MB photodegradation process. However, when IPA was added to quench the ·OH radicals, the photocatalytic degradation was inhibited remarkably (Fig. 6b), indicating that the ·OH radicals plays a crucial role for MB photocatalytic degradation.
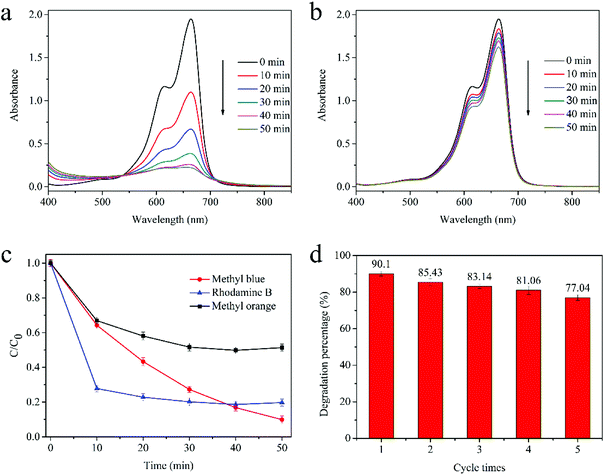 |
| | Fig. 6 Typical absorbance spectra of MB dye after addition of (a) BQN, (b) IPA; (c) selective degradation for different dyes; (d) cycling degradation of MB by Cu2O–Cu fabricated by laser reduced method. | |
3.2.6 Selective degradation for different dyes. Different types of dyes including positively charged RhB, MB and negatively charged MO were adopted as target dyes to assess the photocatalytic performance of the as-prepared Cu2O–Cu composition, as shown in Fig. 6c. Under the same reaction conditions, the removal efficiency of MB, RhB and MO is 90.10% 80.30% and 48.65% after irradiation of 50 min, respectively. The experiment results indicate that the as-synthesized Cu2O–Cu has selective dye degradation, which exhibit relatively higher photocatalytic efficiency for RhB and MB. It is supposed that the surface charge of Cu2O–Cu make them preferentially photodegrade RhB and MB, which are positively charged molecules.
3.2.7 Stability of the catalyst. The stability and recyclability of the photocatalysts were also investigated through the degradation of MB under visible light. Each cycle lasted for 50 min with fresh MB solution. The catalyst was recycled by centrifugation and then washed with ethanol and deionized water, followed by drying at 60 °C for 1 h without any further treatment. As shown in Fig. 6d, the photocatalytic efficiency of Cu2O–Cu presents only a slight decline in the recycle experiments, which may be attributed to the little loss and the deactivation of the catalyst in the cycling experiment, indicating its high stability and durability.
3.2.8 Mechanism of photocatalytic activity for Cu2O–Cu composites. Table 1 lists recently published performance parameters obtained with Cu2O photocatalysts. For comparison, results obtained from present work are also shown. The results shows that our work has excellent performance compared with other catalysts, especially in the range of visible light. Furthermore, the simple and easy control process, and low cost of raw materials justify an effort to conduct further research for practical applications.
Table 1 Comparison of degradation efficiency for different photocatalysts
| photocatalyst |
Additive amount (mg) |
MB concentration (mg L−1) |
Degradation rate (%) |
Irradiation time (min) |
Degradation rate constant (min−1 gcat−1) |
Light source |
| This study |
9 |
10 |
90 |
50 |
5.095 |
300 W tungsten lamp (λ > 350 nm) |
| Au/Cu2O nanospheres38 |
15 |
5 |
85 |
120 |
2.860 |
300 W Xe lamp (λ > 420 nm) |
| Cu@Cu2O nanocomposite39 |
10 |
10 |
96.5 |
50 |
6.705 |
300 W UV light (100 < λ < 450) |
| Hierarchical Cu2O (ref. 40) |
25 |
10 |
55 |
120 |
0.266 |
200 W Hg–Xe arc lamp (λ > 420 nm) |
| Cu2O{111}-rGO (ref. 41) |
15 |
10 |
72 |
120 |
0.723 |
400 W metal halide lamp (λ > = 420 nm) |
| Ag/Cu2O (ref. 42) |
20 |
10 |
96.5 |
120 |
1.365 |
500 W xenon lamp (λ > 400 nm) |
| Cu2O/ZnWO4 (ref. 43) |
100 |
10 ppm |
90 |
90 |
1.054 |
300 W Xe lamp (λ > 420 nm) |
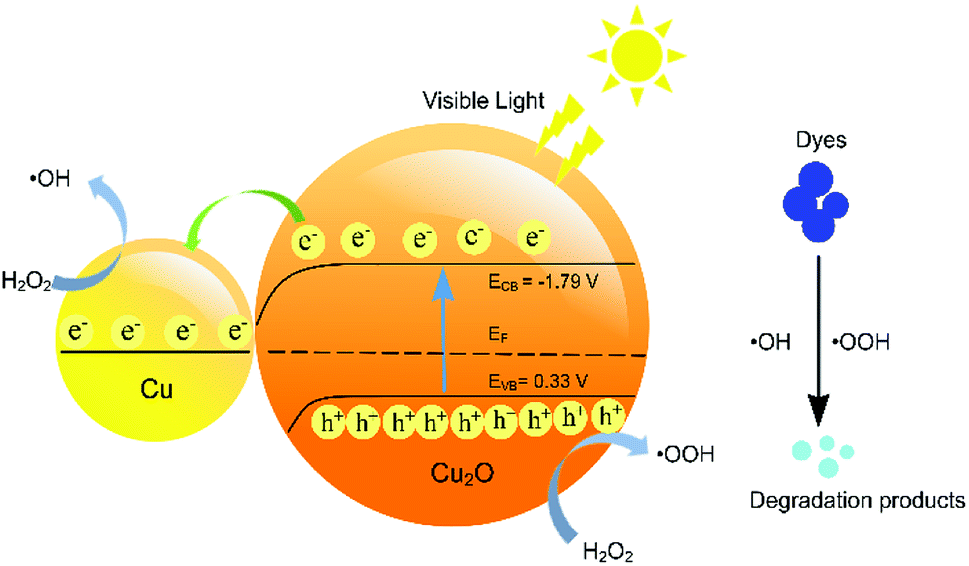
The excellent photocatalytic activity of the Cu2O–Cu composites for MB degradation can be summarized by the following equations, schematically shown in Fig. 7.
| | |
Cu2O + hν → e−(CBCu2O) + h+(VBCu2O)
| (12) |
| | |
MB + ˙OH (or ˙OOH) → degradation products
| (15) |
 |
| | Fig. 7 Proposed photocatalytic mechanism of Cu2O–Cu photocatalyst under visible light. | |
According to the previous reports, the conduction band (CB) and the valence band (VB) potentials of Cu2O are −1.79 Vsce and 0.33 Vsce, respectively, exhibiting indirect band gap transition of 2.12 eV.44 Under visible-light irradiation (the incident energy is greater than 2.12 eV), Cu2O can absorb photons and the electrons are excited from VB to CB.45 In the Cu2O–Cu composites, the hole–electron pairs are separated by the electric field developed across the depletion layer. The presence of Cu promotes the photocatalysis due to its low work function and good conductive ability. The photogenerated electrons can easily transfer to the Cu to decrease the recombination of the photogenerated electrons and holes. During the photocatalysis, since the top of VB is higher than the oxidation potential of the H2O, the forming of the ˙OH through H2O directly is forbidden. Therefore, the adding of H2O2 is necessary because it can react with photogenerated electrons directly to form ˙OH. H2O2 can also reacted with holes to produce ˙OOH. Finally, the MB molecule were oxidized into inorganic or nontoxic products by ˙OH and ˙OOH. The quenching experiments confirmed that the ˙OH radicals contribute to the MB photodegradation.
4. Conclusions
We have successfully fabricated Cu2O–Cu composite photocatalyst by using a low-power laser reduction approach. The particle size of composites can be tailored by accurate controlling laser energy and NaOH concentration. Compared to hydrothermally fabricated Cu2O–Cu catalysts, the laser-reduced composites exhibit better visible-light photocatalytic activity for MB degradation, which could be attributed to the formation of special catalytically active structures on the nanocomposite surface. Our experiments showed that Cu2O–Cu composites prepared under the conditions of 10 mA laser irradiation and 5 M NaOH addition had the highest catalytic activity. The possible mechanism of photocatalysis over Cu2O–Cu catalyst was proposed. It was demonstrated that mainly ˙OH radicals contribute to the degradation during the photocatalytic process. Overall, on the basis of widely used commercial low-energy CO2 laser, the laser-reduced fabrication method has great potential to improve the manufacturing process of high-performance photocatalyst for various occasions.
Conflicts of interest
There are no conflicts of interest to declare.
Acknowledgements
This study was founded by the Natural Science Foundation of Tianjin City [Grant No. 15JCYBJC21400].
Notes and references
- S.-M. Lam, J.-C. Sin, A. Z. Abdullah and A. R. Mohamed, Desalin. Water Treat., 2012, 41, 131–169 CrossRef.
- S. Ahmed, M. G. Rasul, W. N. Martens, R. Brown and M. A. Hashib, Desalination, 2010, 261, 3–18 CrossRef.
- X. Zhao, H. Yang, Z. Cui, R. Li and W. Feng, Mater. Technol., 2017, 32, 870–880 CrossRef.
- Y. Cheng, Y. Lin, J. Xu, J. He, T. Wang, G. Yu, D. Shao, W. H. Wang, F. Lu and L. Li, Appl. Surf. Sci., 2016, 366, 120–128 CrossRef.
- L. Di, H. Yang, T. Xian and X. Chen, Materials, 2017, 10, 1118 CrossRef PubMed.
- F. Wang, H. Yang and Y. Zhang, Mater. Sci. Semicond. Process., 2018, 73, 58–66 CrossRef.
- J. T. Dr, Z. Z. Dr and J. Y. Dr, Angew. Chem., 2004, 43, 4463–4466 CrossRef PubMed.
- R. Asahi, T. Morikawa, T. Ohwaki, K. Aoki and Y. Taga, Science, 2001, 293, 269–271 CrossRef PubMed.
- X. Chen and S. S. Mao, Cheminform, 2007, 38, 2891 Search PubMed.
- L. Xiao, P. Liu, M. Yu, M. Xing and J. Zhang, Appl. Catal., B, 2015, 164, 352–359 CrossRef.
- Z. Zhao, H. Tan, H. Zhao, Y. Lv, L. J. Zhou, Y. Song and Z. Sun, Chem. Commun., 2014, 50, 2755–2757 RSC.
- R. A. Doong and C. Y. Liao, J. Hazard. Mater., 2017, 322, 254–262 CrossRef PubMed.
- C. Belver, J. Bedia and J. J. Rodriguez, J. Hazard. Mater., 2017, 322, 233–242 CrossRef PubMed.
- J. Y. Tai, K. H. Leong, P. Saravanan, A. A. Aziz and C. S. Lan, J. Mater. Sci., 2017, 52, 1–13 CrossRef.
- Nur'aeni, A. Chae, S. Jo, Y. Choi, B. Park, S. Y. Park and I. In, J. Mater. Sci., 2017, 52, 8493–8501 CrossRef.
- H. Al-Kandari, A. M. Abdullah, A. M. Mohamed and S. Al-Kandari, J. Mater. Sci., 2016, 51, 8331–8345 CrossRef.
- M. Hara, T. Kondo, M. Komoda, S. Ikeda, J. N. Kondo, K. Domen, M. Hara, K. Shinohara and A. Tanaka, Chem. Commun., 1998, 3, 357–358 RSC.
- A. Roos, T. Chibuye and B. Karlsson, Sol. Energy Mater., 1983, 7, 467–480 CrossRef.
- F. Gao, X. Wang and D. Wu, Sol. Energy Mater. Sol. Cells, 2017, 168, 146–164 CrossRef.
- M. Rokhmat, E. Wibowo, Sutisna, Khairurrijal and M. Abdullah, Procedia Eng., 2017, 170, 72–77 CrossRef.
- R. P. Wijesundera, L. K. A. D. D. S. Gunawardhana and W. Siripala, Sol. Energy Mater. Sol. Cells, 2016, 157, 881–886 CrossRef.
- A. H. Alami, A. Allagui and H. Alawadhi, Renewable Energy, 2015, 82, 21–25 CrossRef.
- H. S. Jang, S. J. Kim and K. S. Choi, Small, 2010, 6, 2183–2190 CrossRef PubMed.
- G. Liu, F. He, X. Li, S. Wang, L. Li, G. Zuo, Y. Huang and Y. Wan, J. Mater. Chem., 2011, 21, 10637–10640 RSC.
- K. Suzuki, N. Tanaka, A. Ando and H. Takagi, J. Am. Ceram. Soc., 2011, 94, 2379–2385 CrossRef.
- Y. Zhao, W. Wang, Y. Li, Y. Zhang, Z. Yan and Z. Huo, Nanoscale, 2013, 6, 195–198 RSC.
- T. Hong, F. Tao, J. Lin, W. Ding and M. Lan, J. Solid State Chem., 2015, 228, 174–182 CrossRef.
- X. Deng, Q. Zhang, Q. Zhao, L. Ma, M. Ding and X. Xu, Nanoscale Res. Lett., 2015, 10, 8 CrossRef PubMed.
- I. M. Arabatzis, T. Stergiopoulos, D. Andreeva, S. Kitova, S. G. Neophytides and P. Falaras, J. Catal., 2003, 220, 127–135 CrossRef.
- J. Li, D. Luo, C. Yang, S. He, S. Chen, J. Lin, L. Zhu and X. Li, J. Solid State Chem., 2013, 203, 154–159 CrossRef.
- Y. Zhang, B. Deng, T. Zhang, D. Gao and A. W. Xu, J. Phys. Chem. C, 2010, 114, 5073–5079 Search PubMed.
- Q. Wei, Y. Wang and H. Qin, Appl. Catal., B, 2018, 227, 132–144 CrossRef.
- J. He, D. W. Shao, L. C. Zheng, L. J. Zheng, D. Q. Feng, J. P. Xu, X. H. Zhang, W. C. Wang, W. H. Wang and F. Lu, Appl. Catal., B, 2017, 203, 917–926 CrossRef.
- S. K. Li, C. H. Li, F. Z. Huang, Y. Wang, Y. H. Shen, A. J. Xie and Q. Wu, J. Nanopart. Res., 2011, 13, 2865–2874 CrossRef.
- X. Liu, R. Hu, S. Xiong, Y. Liu, L. Chai, K. Bao and Y. Qian, Mater. Chem. Phys., 2009, 114, 213–216 CrossRef.
- W. Zhang, L. Shi, K. Tang and S. Dou, Eur. J. Inorg. Chem., 2010, 2010, 1103–1109 CrossRef.
- F. Diao, F. Tian, W. Liang, H. Feng and Y. Wang, Phys. Chem. Chem. Phys., 2016, 18, 27967–27975 RSC.
- Y. Shang, Acta Phys.-Chim. Sin., 2013, 29(8), 1819–1826 Search PubMed.
- L. Xu, C. Srinivasakannan, J. Peng, M. Yan, D. Zhang and L. Zhang, Appl. Surf. Sci., 2015, 331, 449–454 CrossRef.
- S. Kumar, C. M. A. Parlett, M. A. Isaacs, D. V. Jowett, R. E. Douthwaite, M. C. R. Cockett and A. F. Lee, Appl. Catal., B, 2016, 189, 226–232 CrossRef.
- W. Zou, Z. Lei, L. Liu, X. Wang, J. Sun, S. Wu, D. Yu, C. Tang, G. Fei and D. Lin, Appl. Catal., B, 2016, 181, 495–503 CrossRef.
- Y. Sun, L. Cai, X. Liu, Z. Cui and P. Rao, J. Phys. Chem. Solids, 2017, 111, 75–81 CrossRef.
- L. Tian, Y. Rui, K. Sun, W. Cui and W. An, Nanomaterials, 2018, 8, 33 CrossRef PubMed.
- N. Helaïli, Y. Bessekhouad, A. Bouguelia and M. Trari, J. Hazard. Mater., 2009, 168, 484–492 CrossRef PubMed.
- Z. Cui, H. Yang and X. Zhao, J. Mater. Sci. Eng. B, 2018, 229, 160–172 CrossRef.
Footnote |
| † Both authors contributed equally to this work. |
|
| This journal is © The Royal Society of Chemistry 2018 |

 Open Access Article
 This Open Access Article is licensed under a Creative Commons Attribution-Non Commercial 3.0 Unported Licence
 *a,
Li Yanga,
Jie Dinga,
Feng Donga,
Yang Lia,
Muhammad Irfana and
Pingping Zhang*b
*a,
Li Yanga,
Jie Dinga,
Feng Donga,
Yang Lia,
Muhammad Irfana and
Pingping Zhang*b