 Open Access Article
Creative Commons Attribution 3.0 Unported Licence
Predicted energy–structure–function maps for the evaluation of small molecule organic semiconductors†
Josh E.
Campbell
 ,
Jack
Yang
and
Graeme M.
Day
 *
*
Computational Systems Chemistry, School of Chemistry, University of Southampton, Highfield, Southampton, SO17 1BJ, UK. E-mail: G.M.Day@soton.ac.uk
First published on 4th July 2017
Abstract
The computational assessment of materials through the prediction of molecular and crystal properties could accelerate the discovery of novel materials. Here, we present calculated energy–structure–function maps based on crystal structure prediction for a series of hypothetical organic molecular semiconductors, to demonstrate their utility in evaluating molecules prior to their synthesis. Charge transfer in organic semiconductors relies on the degree of π-conjugation and overlap of the π-systems of neighbouring molecules in the solid state. We explore the effects of varying levels of nitrogen substitution on the crystal packing and charge transport properties of aza-substituted pentacenes, in which C–H⋯N hydrogen bonding is predicted to favour co-planar molecular packing in preference to the edge-to-face herringbone packing seen for pentacene. The charge mobilities of predicted structures in the energy range of expected polymorphism were calculated, highlighting the important balance between intra- and intermolecular properties when designing novel organic semiconductors. The use of predicted landscapes to rank molecules according to their likely properties is discussed.
1 Introduction
A broad goal of crystal engineering is the design of crystalline materials with targeted properties. In the domain of molecular crystals, advances in this field rely on our understanding of structure-directing intermolecular interactions and on the relationship between a material's crystal structure and its properties. Crystal structure prediction (CSP) has been developing rapidly over the past decade as a computational tool for crystal engineering, with the aim of accurately predicting the possible crystal structures available to a given molecule.When supplemented by the prediction of properties, CSP becomes an integrated tool for computer guided material design, and can be used to investigate the sensitivity of materials' properties to changes in molecular structure. Since no experimental input is required for either crystal structure or property prediction, the methods can be used in advance of molecular synthesis, to help prioritise a set of possible synthetic targets. Here, we investigate the use of predictive calculations to evaluate a series of previously proposed N-heteroacenes1 as possible n-type semiconductors. This is achieved by calculating energy–structure–function (ESF) maps for each molecule. The ESF map represents the predicted landscape of possible crystal structures, their associated lattice energies and predicted properties – in this case, the electron mobilities predicted using Marcus theory. The ESF mapping approach was recently demonstrated by its use in the discovery of a series of highly porous molecular crystals with potential for gas storage or selective adsorption.2
Organic field effect transistors (OFETs) are a driving force behind the development of organic electronics. The ability to deposit organic films on a wide variety of substrates has led to flexible displays, printable circuits and plastic solar cells.3,4 Organic semiconductors can be broadly split into two categories: conjugated polymers and small molecules. Organic molecular semiconductors typically contain extended π-conjugated systems, which allow effective charge delocalisation, leading to good charge transport properties. Furthermore, the availability of high energy HOMO or low energy LUMO orbitals allows for injection of charge into the semiconductor across hetero-interfaces. Thus, polycyclic aromatic hydrocarbons (PAHs) and their derivatives have been widely studied. The sensitivity of charge mobility to the fine details of molecular arrangement in crystals makes design of small molecule organic semiconductors an attractive target for the application of structure and property prediction methods.
Within the Marcus theory model of charge transport, the charge carrier hopping rate between molecules i and j, kij, is modeled as
 | (1) |
Therefore, from eqn (1) we see that the design of organic molecular semiconductors with high charge carrier mobilities relies on the simultaneous optimisation of the molecular electronic properties (λ) and the arrangement of molecules in their crystal structure, which dictates the transfer integrals, t. Predictive computational methods can facilitate the optimisation of materials properties systematically by exploring the chemical and crystal packing landscapes of different PAHs. In this way, the potential risks of material discovery based on laborious trial-and-error laboratory synthesis can be minimised.
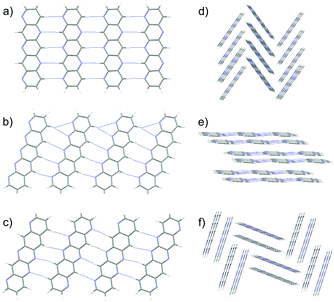
Pentacene is one of the most widely studied of the PAHs, whose promising electronic properties7–9 have been attributed to its small λ. Pentacene crystallises in a herringbone arrangement,10 which is characterised by tilted edge-to-face C–H⋯π interactions (Fig. 1a). However, the electronic coupling between molecules is known to vary strongly with the interplanar angle and is maximised in a co-facial molecular arrangement.11 Thus, the herringbone packing seen in many PAHs is not optimal for charge transport and there have been efforts to modify molecular packing by introducing substituents to pentacene.12 As well as herringbone packings, the crystal packing of PAHs is usually discussed in terms of three other packing types10 (see Fig. 1): sandwich herringbone, in which pairs of co-facial molecules make up the herringbone motif; γ, a flattened herringbone featuring stacks of parallel, translationally related molecules; and sheet-like packing of molecules, sometimes referred to as the β packing type.
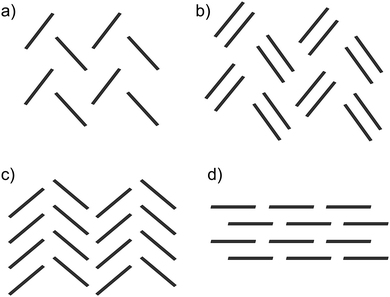 | ||
| Fig. 1 The four main packing types seen in crystal structures of polycyclic aromatic hydrocarbons: (a) herringbone; (b) sandwich herringbone; (c) γ and (d) sheet (β). | ||
Electronegative substituents open up the possibilities of modifying the crystal packing of pentacene by replacing the edge-to-face C–H⋯π interactions with other intermolecular interactions that could enhance the overlap between molecular wavefunctions. Many substitution schemes have been investigated, such as halogenation,13,14 the use of large spacer moieties15 and heteroatom substitution,16 which allows for the possibility of hydrogen bonded networks. Azaacenes offer a way to favourably modify electronic properties and crystal packing. In particular, the possibility to form N⋯H–C hydrogen bond networks, which could promote sheet-like packing in the crystal phase. Interest in azaacenes has increased over recent years due to this potential control and intriguing theoretical results.17–20
In a 2012 review8 of π-conjugated systems, n-type semiconductors were greatly outnumbered by p-type semiconductors (such as pentacene) which have been easier to obtain and thus extensively researched.21 However, electron transporters are required for complementary circuit design and the production of p–n junctions.22,23 Chen and Chao24 investigated a series of azaacenes as n-type semiconductors, focused on lowering the internal reorganisation energy. They showed that too much nitrogen substitution (10N substituted pentacene) increased λ− due to perturbation of the LUMO, increasing its non-bonding character. This leads to stronger orbital interactions between neighbouring atoms, resulting in a larger geometry change when the molecule accepts an electron. However, deca-aza (10N) substitution did result in a large increase in electron affinity (a property needed for a good n-type material22) so penta-aza (5N) substitution was also investigated and showed good (0.149–0.167 eV) λ− that was tunable through the substitution pattern. Winkler and Houk1 also examined a series of azapentacenes, calculating reorganisation energies for varied levels and patterns of nitrogen substitution, including 5N where their λ values agree with those of Chen and Chao. There have also been promising results with N substitution into already 6,13-substituted pentacene derivatives, although thorough examination of the crystal packing was not performed.25
While the reorganisation energy can be calculated from gas phase optimisations of the molecule, calculation of the transfer integral requires a knowledge of the crystal structure of a given molecule, which is unavailable for newly proposed molecules. In their theoretical study, Winkler and Houk stated that ‘A most interesting question is how substitution of CH by N modifies the solid-state structures (and hence transfer integrals) of azaoligoacenes’; this is the central focus of our present work. CSP allows the possible crystal structures of a molecule to be predicted by searching the lattice energy landscape for local minima. From here, by calculating the transfer integrals for a range of predicted crystal structures, the energy–structure–function map can be produced for each molecule under investigation.
In this paper, six hypothetical azapentacene molecules, each with different numbers and/or patterns of N-atom substitutions were investigated as potential semiconducting materials in the crystalline phase. For each molecule studied in this paper, CSP methods are applied to understand the influence of N-substitution on packing preferences of the molecules. The relationship between charge mobility and crystal structure is explored by the calculation of charge mobilities on low energy structures. This method allows the assessment of hypothetical molecules as novel organic semiconductors before synthesis, as a tool to guide synthetic priorities. Our results show that the low-energy landscapes of all six molecules studied here are dominated by γ and/or sheet-like packings, whereas the distributions of charge mobilities showed large variations even within a type of crystal packing. This demonstrates the necessity of acquiring detailed atomistic structures of molecular crystals (for instance, via experiments or CSP) in order to achieve accurate predictions of charge mobilities in crystalline organic semiconductors.
2 Models and methodologies
2.1 Choice of molecules
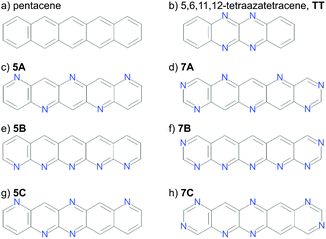
Calculations have been performed on a total of eight molecules. Two molecules with known crystal structures (pentacene and 5,6,11,12-tetraazatetracene, hereafter referred to as TT, Fig. 2a and b) were chosen for validating our underlying methodologies. Pentacene exists in several known polymorphs, three of which have had their structures determined. These are often referred to as the “bulk”26,27 “single crystal”28 and thin film29 forms, differing in their d(001) spacing – the distance between herringbone layers.30 The first two of these, which we will refer to as PI (bulk) and PII (single crystal) are most important for validation of the CSP methodology; the “thin film” (PIII) phase is not stable as a bulk phase29 and does not correspond to a separate local minimum on the lattice energy surface.31TT is an n-channel semiconductor characterised in 2012,32 which we include to verify our structure prediction methods and energy models on aza-substituted acenes.
The aim of this work is to demonstrate the ESF mapping approach on a series of hypothetical azapentacenes (Fig. 2c–h). A number prefix (5/7) in our molecular labelling refers the number of nitrogen atoms in the molecule, while the letter refers to the substitution pattern. Four of these (5A, 5B, 7A, 7B) were taken from Winkler and Houk1 to investigate the effects of differing amounts and arrangements of nitrogen substitution on crystal packing and properties. The two long edges of each of these molecules have complementary arrangements of N and C–H, which is expected to facilitate hydrogen bonding into sheet-like packing, providing co-facial molecular arrangements between sheets. To explore less regular substitution patters, we include molecules 5C and 7C, whose long edges lack complementarity, so were expected to less readily pack into sheet-like structures. 7A/B were explicitly designed to have an electron affinity above 3.0 eV,1 at the expense of a slight increase in electron reorganisation energy compared to pentacene (0.131 to 0.18–0.2 eV). This is an ideal test case to see if high reorganisation energy in molecules could be compensated by co-facial packing to achieve higher charge mobility.
2.2 Crystal structure prediction
CSP involves the global exploration of the lattice energy surface of the molecule to locate all possible crystal structures. The geometry of each molecule was kept rigid throughout the crystal structure calculations, at the optimised structure from a density functional theory (DFT, B3LYP33/6-311G**) calculation using Gaussian09.34 Trial crystal structures were then generated in a wide range of space groups, considering 1 and 2 molecules in the asymmetric unit (Z′ = 1 or 2), using a quasi-random sampling of the crystal packing variables (unit cell lengths and angles, molecular positions and orientations). Searches were performed using the Global Lattice Energy Explorer (GLEE) software.35 4000 lattice energy minimised crystal structures were generated in each of the 23 most commonly adopted space groups for organic molecules36 (P21/c, P41212, P212121, P21212, P![[1 with combining macron]](https://www.rsc.org/images/entities/char_0031_0304.gif) , Pc, P21, P31, Pbca, P41, C2/c, Fdd2, Pna21, Pccn, Cc, P2/c, C2, P61, Pca21, I41/a, P1, R
, Pc, P21, P31, Pbca, P41, C2/c, Fdd2, Pna21, Pccn, Cc, P2/c, C2, P61, Pca21, I41/a, P1, R![[3 with combining macron]](https://www.rsc.org/images/entities/char_0033_0304.gif) , Pbcn), all with one molecule in the asymmetric unit (Z′ = 1). For Z′ = 2, 10
, Pbcn), all with one molecule in the asymmetric unit (Z′ = 1). For Z′ = 2, 10![[thin space (1/6-em)]](https://www.rsc.org/images/entities/char_2009.gif) 000 structures were generated in each of 12 space groups (P21/c, C2/c, P212121, P1, Pca21, P
000 structures were generated in each of 12 space groups (P21/c, C2/c, P212121, P1, Pca21, P![[1 with combining macron]](https://www.rsc.org/images/entities/char_0031_0304.gif) , Pna21, P21, C2, Pbca, Pc, Cc) – a larger number due to the higher dimensionality of the Z′ = 2 energy landscape. Thus, a total of 212
, Pna21, P21, C2, Pbca, Pc, Cc) – a larger number due to the higher dimensionality of the Z′ = 2 energy landscape. Thus, a total of 212![[thin space (1/6-em)]](https://www.rsc.org/images/entities/char_2009.gif) 000 trial structures were lattice energy minimised for each molecule; each of these is a unique starting structure, but leads to a smaller number of unique crystal structures after optimisation and removal of duplicates (see below and ref. 35).
000 trial structures were lattice energy minimised for each molecule; each of these is a unique starting structure, but leads to a smaller number of unique crystal structures after optimisation and removal of duplicates (see below and ref. 35).
All lattice energy minimisations were performed in DMACRYS,37 using the W9938 exp-6 model potential for all intermolecular atom–atom interactions. Electrostatic interactions were described using atomic multipoles derived from a distributed multipole analysis39 of the calculated molecular electron density. Ewald summation was used for charge–charge, charge–dipole and dipole–dipole interactions, while all higher order electrostatics and repulsion–dispersion interactions were summed to a 25 Å cutoff. Lattice energy minimisation was initially performed within the space group of the generated structure. The stability of all structures was assessed from the Hessian eigenvalues. In cases where a saddle point was reached, lattice energy minimisation was continued after removing the space group symmetry operators that allowed minimisation from the saddle point. This process led to some structures of higher Z′ in the final structure sets.
Clustering was performed to identify and remove duplicate crystal structures. An initial screen was performed using the clustering method described in ref. 35 within individual space groups. An overall clustering across all space groups was then performed using the COMPACK40 method.
Schematics of the four main packing types are shown in Fig. 1. The set of rules used for classification should be good enough to uncover trends in properties between these broad families of packing types. The classification of borderline cases would be affected by a change in the angle bounds, which were taken from an initial analysis of crystal structures by eye. Faster and more rigorous methods of classifying predicted crystal structures into structural families would facilitate the analysis of crystal energy landscapes, and are currently being developed.
2.3 Transport property calculations
Charge carrier hopping rates were modeled via Marcus theory [eqn (1)]. Nearest-neighbour molecular dimer electronic coupling matrix elements were calculated using subsystem DFT41 as implemented in the Amsterdam Density Functional42 (ADF) package, in which the monomer densities were calculated at the PW9143/DZ level of theory, and the non-additive kinetic energies were modeled with PW91k/DZ. For each molecule, we extracted all unique predicted crystal structures within 7 kJ mol−1 of the global minimum. 95% of known polymorph pairs are separated by approximately 7 kJ mol−1 or less, so we take this as the relevant energy range on our predicted energy landscapes;44 higher energy structures are unlikely to be observed.For each crystal structure, the nearest-neighbouring dimers were extracted based on the criterion that at least one intermolecular atom–atom distance was less than the sum of van der Waals radii plus 1.5 Å. Where the energy minimized crystal structures contain more than one symmetrically inequivalent molecule, the nearest-neighbour dimers were extracted for each independent molecule. In this way, we ensured that all dimers with contributions to the electron transport properties in a given crystal structure have been included. To reduce the total number of DFT calculations required, coupling matrix elements for equivalent molecular dimers in a given crystal were not calculated explicitly. Duplicate dimers were identified based a root-mean-squared-deviation (RMSD) of atomic positions between two dimers being less than 0.1 Å, and allowing for translation or rotation of the dimer. Reorganisation energies were calculated for the isolated molecules using Gaussian0934 at the B3LYP/6-31G** level of theory.
The Einstein relationship was used to calculate the charge carrier mobilities at T = 300 K:
 | (2) |
 | (3) |
 | (4) |
3 Results and discussion
3.1 CSP
For comparison with the predicted structures, the experimentally determined polymorphs were lattice energy minimised using the same energy model and molecular geometry used in the CSP calculations. Comparison of these lattice energy minimised structures to the CSP structures shows that PI corresponds to the global lattice energy minimum – the lowest energy predicted crystal structure of pentacene. PII was also located in the CSP set, as a low energy predicted structure ∼6 kJ mol−1 above the global minimum. The experimental and predicted versions of PI and PII are compared in Table 1, which shows excellent geometric agreement of the predictions with experimental structures. This is also shown in Fig. 3a – an overlay of the predicted global minimum and the structure of polymorph PI.
| Crystal structure | Cell lengths/Å | Cell angles/degrees | RMSD30/Å | |||||
|---|---|---|---|---|---|---|---|---|
| a | b | c | α | β | γ | |||
| PI (bulk, PENCEN, room temp.) | Expt | 6.060 | 7.900 | 14.884 | 96.74 | 100.54 | 94.20 | — |
| Pred | 5.889 | 8.215 | 14.847 | 97.87 | 99.10 | 93.64 | 0.393 | |
| PII (single crystal, PENCEN04, T = 90 K) | Expt | 6.239 | 7.636 | 14.330 | 76.98 | 88.14 | 84.42 | — |
| Pred | 5.973 | 8.015 | 15.219 | 77.11 | 83.93 | 86.22 | 0.526 | |
| TT (P21/c, YEBMEZ) | Expt | 4.710 | 14.910 | 7.652 | 90.00 | 94.70 | 90.00 | |
| Pred | 4.881 | 14.328 | 7.841 | 90.00 | 96.32 | 90.00 | 0.355 | |
As observed by Della Valle and co-workers,31 we found that both the bulk (PI) and thin film (PIII) phases converge to the same structure upon energy minimisation. This observation highlights the fact that PIII is a distorted version of the bulk phase and is in agreement with the observation that PIII is a substrate-induced structure that is only observed at thin film thicknesses (<50 nm at 300 K) near the substrate.29
The tetracene azaderivative TT adopts a γ crystal packing arrangement in space group P21/c. So far, no further polymorphs have been discovered. The experimentally observed crystal structure for TT was located as the global minimum from CSP, and the geometric agreement between predicted and experimental structures is shown in Fig. 3b and Table 1.
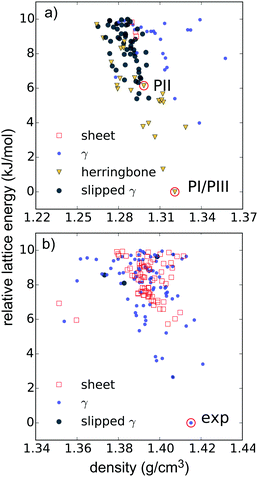
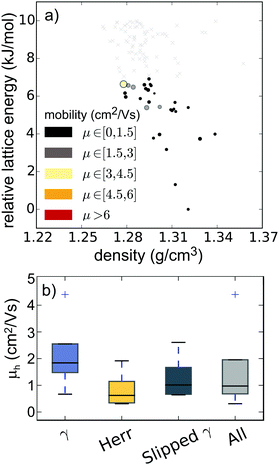
The low-energy regions of the lattice energy landscapes for both validation molecules are shown in Fig. 4a and b. It is clear that the favoured packing types are different for these two molecules. As expected, herringbone packing dominates the low energy region of the pentacene landscape (Fig. 4a). Pentacene structures with γ packing occur at 4 kJ mol−1 above the global minimum and sheet-like packing is particularly disfavoured, occuring at 9 kJ mol−1 or higher above the global minimum energy packing. Furthermore, these sheet-like packings are not perfectly planar and might be better described as flattened herringbone packing. Isolated cases of sandwich herringbone packings are found on the pentacene landscape, albeit at even higher lattice energies.
In contrast, the low energy predicted structures of TT all have γ packing up to about 6 kJ mol−1 from the global minimum, above which sheet-like packing is found (Fig. 4b), and herringbone packing is clearly disfavoured. These differences in structural landscapes clearly demonstrate the impact of nitrogen substitution on PAH packing.
The insight provided by the comparing the entire landscapes of available structures for each molecule demonstrates the value of CSP in evaluating the impact of chemical changes on crystal packing preferences. Furthermore, the results from the validation studies are encouraging for applying CSP to the hypothetical molecules in this paper. The global minima of both validation searches match a known experimental structure and the observed structures are reproduced accurately (Table 1 and Fig. 3).
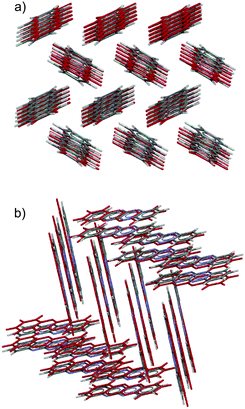
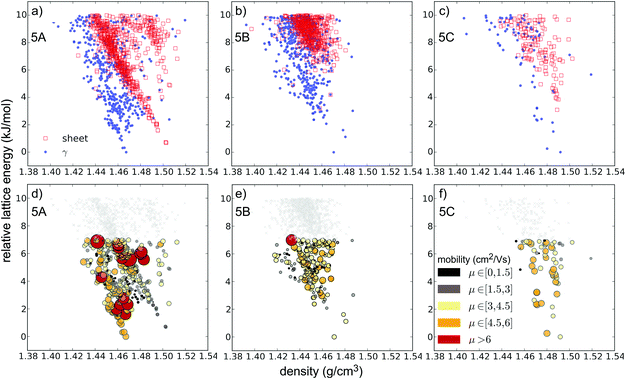
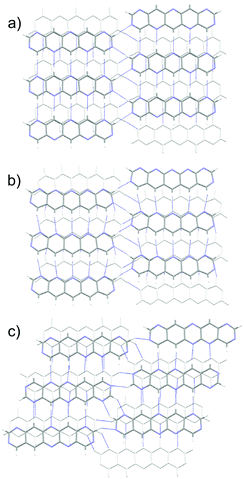
Substitution of pentacene with five nitrogens has a marked impact on the crystal energy landscapes. Herringbone packing – the dominant packing arrangement for pentacene – is completely absent from the low energy regions of the landscapes of all three 5N molecules studied here, leaving landscapes dominated by γ and sheet packings (Fig. 5). This change in packing preference with respect to unsubstituted pentacene results from the formation of C–H⋯N hydrogen bonds between the long edges of the molecules, replacing the C–H⋯π edge-to-face interactions in the favoured herringbone structures of pentacene. The complementary long edges of molecules 5A and 5B allow these interactions to repeat, forming infinite hydrogen bonded tapes (Fig. 6a and b) which are present in all of the low energy structures for both 5A and 5B. The lack of strongly directional interactions at the short edge of the molecules allows these tapes to arrange into γ packing (Fig. 6d and f) or into sheets (Fig. 6e). Either type of packing leads to substantial π–π overlap between neighbouring molecules along the direction of the stack (in γ structures) or perpendicular to the sheets, which could lead to high electron mobilities. Somewhat surprisingly, we found that 5C also reliably formed hydrogen bond tapes (Fig. 6c), despite the reduced complementarity of the long edges of the molecules.
The crystal landscapes of the three 5N pentacenes are broadly similar: while sheet-like packing leads to slightly higher density structures, the lowest energy crystal structures have γ packing for all three molecules. However, the balance between sheet and γ packing depends on the arrangement of aza-substitution. The energetic difference between sheet-like and γ packing is predicted to be less than 1 kJ mol−1 for 5A, but over 3 kJ mol−1 for 5B and 5C.
The 7N substituted pentacenes have the same substitution patterns as the 5N molecules, with the addition of two nitrogens at the ends of the molecules. The predicted landscapes of crystal structures (see Fig. S1, ESI†) show that these additional nitrogen atoms have a dramatic influence on the expected crystal packing of these molecules. The landscapes of all three 7N azapentacenes feature almost exclusively sheet-like packing with only a few γ structures far above the global minima. The predominance of sheet-like packing is due to the hydrogen bonds formed by the additional nitrogen atoms, linking the tapes that were seen in the 5N pentacenes into 2-D sheets; the sheets found in the global minima predicted crystal structures of 7A–C are shown in Fig. 7.
3.2 Energy–structure–function maps
The predictions for pentacene and the hypothetical azapentacenes demonstrate that hetero-atom substitution has an important impact on crystal packing. However, the packing motif itself is not a target property in the development of new organic semiconductors; charge carrier mobility is the key parameter, which depends in turn on both the intermolecular electronic couplings (which are determined by crystal packing) and the intrinsic molecular properties (reorganisation energies of individual molecules). Thus, each possible crystal structure of each molecule encodes an electron mobility, which we approximate here using Marcus theory. The result of combining the predicted structures, their calculated relative energies and predicted mobilities is an energy–structure–function (ESF) map (Fig. 8a for pentacene, Fig. 5 and Fig. S1, ESI† for the 5N and 7N azapentacenes, respectively), which displays the likely properties that could result from each molecule. We can interpret these maps using the basic assumption of lattice energy based CSP – that the most likely observable structures are those with the lowest energies. Indeed, due to their cost, we restricted mobility calculations to structures within the expected energetic range of polymorphism.44While our calculated reorganisation energy, λ+, for hole transport in pentacene (0.096 eV) is in good agreement with previous calculations and experiment,45 the fragment-orbital approach used here with a GGA DFT functional is known to underestimate the intermolecular coupling relative to higher level calculations by between 28–37%.46,47 Given the quadratic dependence of hopping rates on intermolecular coupling, it is unsurprising that our calculated hole mobility of the bulk form (PI) of pentacene (0.636 cm2 V−1 s−1) is very low. Nevertheless, the approach has been shown to correctly produce relative values for the electronic coupling when comparing different geometries and different molecules.46,47
The results for pentacene (Fig. 8) show that significant variations in charge mobility can be observed within a given packing type. Nevertheless, we see the expected trends between packing types (Fig. 8b): γ structures have the highest mobilities due to extensive π–π overlap in one direction; slipped-γ structures have reduced π–π overlap and lower mobilities and herringbone structures show the lowest mobilities. The highest mobility structure, with γ packing, has a predicted mobility ∼7× that of the global energy minimum (polymorph PI).
Table 2 summarises the gas-phase electron reorganisation energies for all six azapentacene molecules investigated. The increase in λ− of approximately 30 meV from the 5N to 7N azapentacenes is just over kBT at room temperature; without considering differences in intermolecular electronic couplings, this increased reorganisation energy would lead to a ∼25% decrease in the electron hopping rates (eqn (1)) of the 7N substituted azapentacenes relative to the 5N counterparts. This is borne out in the electron mobility calculations: μ is almost universally lower in the ESF maps of the 7N azapentacenes than for 5N azapentacenes.
| Molecule | λ − | μ GM | μ max | ΔE(μmax) | 〈μ〉 |
|---|---|---|---|---|---|
| 5A | 0.151 | 5.36 | 11.44 | 5.62 | 3.27 |
| 5B | 0.165 | 3.98 | 6.12 | 7.00 | 2.87 |
| 5C | 0.157 | 3.78 | 5.97 | 4.68 | 4.24 |
| 7A | 0.180 | 2.10 | 4.22 | 4.69 | 2.52 |
| 7B | 0.198 | 0.62 | 6.56 | 6.05 | 1.82 |
| 7C | 0.184 | 2.01 | 3.16 | 5.98 | 1.92 |
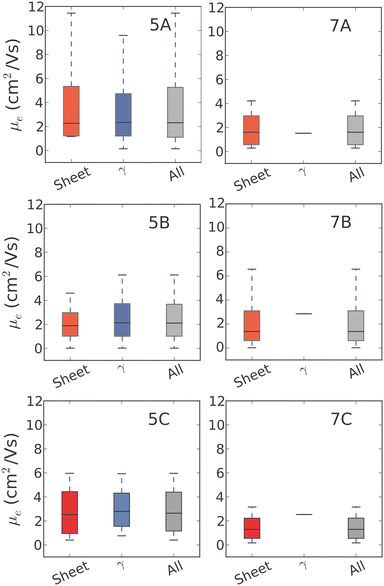
For 5N-substituted pentacenes, sheet-like and γ are the two competing crystal packings in the low lattice energy regions of the landscapes. Both packing types exhibit π–π stacking and the range of predicted charge mobilities for these two packing types are comparable (Fig. 9). The variability of predicted electron mobility within each packing type is large and most likely related to the lateral offset of co-facial molecules between sheets or along the γ stack.
3.3 Ranking of molecules
The azapentacenes results illustrate how a set of potential synthetic targets can be assessed in silico by combining crystal structure and property predictions. These combine to produce ESF maps which provides a means of assessing a series of molecules for their likely properties. This assessment can be made using a knowledge of the likely lattice energy range for observable crystal structures and the variation in calculated charge carrier mobilities within this range. In this way, a user can make a molecule-by-molecule assessment of a library of candidates. The approach has previously been applied in the area of porous molecular crystals, leading to the discovery of the least dense molecular crystal known to date.2ESF maps could be used, for example, in the manual assessment of small sets of candidates or for high-throughput automated screening studies. In either case, it is valuable to assign a single measure to each molecule as an assessment of its promise for leading to the target materials property. We examine several options for calculating the measure of molecular fitness.
The simplest approach to ranking molecules is to trust the CSP methods to provide a perfect ranking of the predicted structures and assume that the molecule will crystallise with the global energy minimum crystal structure. Thus, molecules can be compared based on the predicted charge mobility, μGM, in their global lattice energy minimum structure. However, a perfect, error-free model for lattice energies does not exist48 and the effects of entropy that have been ignored can lead to mis-ranking of structures.49 Furthermore the existence of polymorphs demonstrates that other low energy predicted structures may correspond to synthesisable materials. Therefore, an alternative approach is to compare the maximum charge mobility, μmax, for each molecule from its predicted crystal structures within the known energetic range of polymorphism.44Table 2 lists μGM and μmax for each of the azapentacenes, along with the energy of the structure with the highest charge mobility relative to the global lattice energy minimum, ΔE(μmax). The crystal structure with the highest charge mobility does not correspond to the global lattice energy minimum for any of the molecules studied (Fig. 5, Fig. S1 (ESI†) and Table 2). This is understandable: dimers with the largest electronic couplings are those with co-facial π-stackings with good spatial overlap between the interacting molecular orbitals, the energetic stabilities of which could be penalised by the relatively large exchange–repulsion intermolecular interaction.
The ranking of the six hypothetical azapentacenes is similar based on either μGM or μmax; molecule 5A has the global energy minimum crystal structure with largest electron mobility as well as the highest μmax. Thus, μGM and μmax are both highest for the molecule with the lowest reorganisation energy. The high predicted electron mobility of the global lattice energy minimum of 5A makes this a promising synthetic target, especially considering the known, systematic underestimation of charge transfer rates with the methods used here.
The largest discrepancy between the two rankings is for molecule 7B, which has the lowest μGM of all six molecules, but the second highest μmax. The high value of μmax for 7B shows that the high penalty to electron hopping rates caused by reorganisation energy of can be overcome by favourable crystal packing.
The results for 7B illustrate the danger of assessing a molecule's fitness based on a single predicted crystal structure – there are over 100 distinct crystal structures for 7B within 7 kJ mol−1 of the global lattice energy minimum structure and a very wide range of predicted electron mobilities amongst these structures (Fig. 9). All of these structures are energetically feasible, so there is a large uncertainty in the electron mobility that will be obtained for this moelcule.
Thus, we suggest that a more probabilistic approach should be taken to the development of a ranking of hypothetical molecules, considering the calculated properties of the whole ensemble of low energy structures. A possibility is a Boltzmann-like average over the calculated electron mobilities of the predicted structures:
 | (5) |
In effect, 〈μ〉 assigns a probability to each structure based on its energy with respect to the global minimum on its landscape and takes into account the calculated mobilities of all of the low energy predicted structures. We find that this measure provides quite a different ordering of the molecules compared to μGM or μmax. Molecule 5C comes out as the molecule with the highest likelihood of producing a crystal structure with the highest electron mobility of the six azapentacene molecules investigated in the present study (Table 2).
4 Conclusions
We have demonstrated the use of CSP to evaluate the effect of small chemical changes on crystal packing and its knock-on influence on charge mobility in a set of azapentacenes that are proposed as potential molecular organic semiconductors. We find that the substitution of nitrogen atoms into the pentacene ring system has a dramatic effect on the entire crystal energy landscape. The resulting C–H⋯N hydrogen bonds favour crystal packing motifs with co-facial π-stacking, which is expected to lead to high charge mobilities. 5N azapentacenes show a disruption of the typical herringbone packing of pentacene with γ being the most favourable type of crystal packing. The higher level of substitution in 7N azapentacenes leads almost exclusively to sheet-like crystal packing in which all edge-to-face interactions are disrupted and replaced by C–H⋯N hydrogen bonds.The charge transport properties were approximated using Marcus theory and the calculated mobilities, combined with the relative stabilities of the predicted crystal structures, were combined to produce energy–structure–function maps of the set of azapentacenes, as well as pentacene itself. These maps provide a visual representation of the spread in the target property within the low energy potential crystal structures of each molecule. A large range in electron mobility is found amongst the low energy crystal structures for all molecules studied here, demonstrating the important impact of crystal packing on charge transport properties. This can be partly understood in terms of differences between packing motifs: herringbone crystal packing typically leads to lower mobilities than either γ or sheet-like packing (Fig. 8). However, the variability in mobility within each structural class is very large – the fine details of the intermolecular arrangement are critical in determining to the resulting mobility. Thus, the ability to predict crystal structures with high accuracy could accelerate the development of organic molecular semiconductors by enabling in silico screening of synthetic targets. The reliability of structure prediction methods is developing rapidly, particularly with increased use of periodic50 or fragment-based51 electronic structure methods and free energy calculations49 for structure ranking.
With in silico screening in mind, we discuss various measures to rank the molecules based on the calculated properties of their predicted crystal structures. In terms of maximum charge mobilities, 5A was found the be the best performing molecule – its landscape contains the crystal structure with the highest electron mobility of all molecules studied. However, 5A's landscape also contains many low-mobility crystal structures. Taking a more probabilistic view, we suggest a weighted average over the calculated mobilities of low energy crystal structures which, of the azapentacenes studied here, suggests molecule 5C as the most promising target. Given that the deliberately chosen asymmetric N-substitution pattern in 5C leads to a more favourable property landscape than the more symmetric azapentacenes that were previously suggested as promising molecules, it is clear that the computer-guided design of novel organic semiconductors would benefit from a wider search of chemical space, using either high-throughput or evolutionary methods, where the computer could explore chemical changes and evolve the molecular structure to optimise the targeted property – in this case, charge mobility. The work presented here provides a basis for further developments towards computational screening of organic solids with targeted properties.
Conflicts of interest
There are no conflicts of interest to declare.Acknowledgements
We thank the European Research Council for funding under grant no. 307358, ERC-StG-2012-ANGLE. We acknowledge the use of the IRIDIS High Performance Computing Facility, and associated support services at the University of Southampton.References
- M. Winkler and K. Houk, J. Am. Chem. Soc., 2007, 129, 1805–1815 CrossRef CAS PubMed.
- A. Pulido, L. Chen, T. Kaczorowski, D. Holden, M. A. Little, S. Y. Chong, B. J. Slater, D. P. McMahon, B. Bonillo, C. J. Stackhouse, A. Stephenson, C. M. Kane, R. Clowes, T. Hasell, A. I. Cooper and G. M. Day, Nature, 2017, 543, 657–664 CrossRef CAS PubMed.
- S. R. Forrest, Nature, 2004, 428, 911 CrossRef CAS PubMed.
- M. Muccini, Nat. Mater., 2006, 5, 605 CrossRef CAS PubMed.
- J. L. Brédas, J. P. Calbert, D. A. da Silva Filho and J. Cornil, PNAS, 2002, 99, 5804–5809 CrossRef PubMed.
- J. E. Norton and J.-L. Brédas, J. Am. Chem. Soc., 2008, 130, 12377–12384 CrossRef CAS PubMed.
- J. E. Anthony, Angew. Chem., Int. Ed., 2008, 47, 452–483 CrossRef CAS PubMed.
- C. Wang, H. Dong, W. Hu, Y. Liu and D. Zhu, Chem. Rev., 2012, 112, 2208–2267 CrossRef CAS PubMed.
- M. Kitamura and Y. Arakawa, J. Phys.: Condens. Matter, 2008, 184011 CrossRef.
- G. R. Desiraju and A. Gavezzotti, Acta Crystallogr., Sect. B: Struct. Sci., 1989, 45, 473–482 CrossRef.
- E. F. Valeev, V. Coropceanu, D. A. da Silva Filho, S. Salman and J.-L. Brédas, J. Am. Chem. Soc., 2006, 128, 9882–9886 CrossRef CAS PubMed.
- M. Mas-Torrent and C. Rovira, Chem. Rev., 2011, 111, 4833–4856 CrossRef CAS PubMed.
- Y. Sakamoto, T. Suzuki, M. Kobayashi, Y. Gao, Y. Fukai, Y. Inoue, F. Sato and S. Tokito, J. Am. Chem. Soc., 2004, 126, 8138–8140 CrossRef CAS PubMed.
- H.-Y. Chen and I. Chao, Chem. Phys. Lett., 2005, 401, 539–545 CrossRef CAS.
- C. D. Sheraw, T. N. Jackson, D. L. Eaton and J. E. Anthony, Adv. Mater., 2003, 15, 2009–2011 CrossRef CAS.
- J. E. Anthony, Chem. Rev., 2006, 106, 5028–5048 CrossRef CAS PubMed.
- U. H. F. Bunz, Chemistry, 2009, 15, 6780–6789 CrossRef CAS PubMed.
- U. H. F. Bunz, J. U. Engelhart, B. D. Lindner and M. Schaffroth, Angew. Chem., Int. Ed., 2013, 52, 3810–3821 CrossRef CAS PubMed.
- U. H. F. Bunz, Acc. Chem. Res., 2015, 48, 1676–1686 CrossRef CAS PubMed.
- Q. Miao, Adv. Mater., 2014, 26, 5541–5549 CrossRef CAS PubMed.
- V. Coropceanu, J. Cornil, D. A. da Silva Filho, Y. Olivier, R. Silbey and J.-L. Brédas, Chem. Rev., 2007, 107, 926–952 CrossRef CAS PubMed.
- C. Newman, C. D. Frisbie, D. A. da Silva Filho, J.-L. Brédas, P. C. Ewbank and K. R. Mann, Chem. Mater., 2004, 16, 4436–4451 CrossRef CAS.
- M. Stolar and T. Baumgartner, Phys. Chem. Chem. Phys., 2013, 15, 9007–9024 RSC.
- H. Chen and I. Chao, ChemPhysChem, 2006, 7, 2003–2007 CrossRef CAS PubMed.
- X.-K. Chen, J.-F. Guo, L.-Y. Zou, A.-M. Ren and J.-X. Fan, J. Phys. Chem. C, 2011, 115, 21416–21428 CAS.
- R. B. Campbell, J. M. Robertson and J. Trotter, Acta Crystallogr., 1961, 14, 705–711 CrossRef CAS.
- R. B. Campbell, J. M. Robertson and J. Trotter, Acta Crystallogr., 1962, 15, 289–290 CrossRef CAS.
- D. Holmes, S. Kumaraswamy, A. J. Matzger and K. P. C. Vollhardt, Chem. – Eur. J., 1999, 5, 3399–3412 CrossRef CAS.
- S. Schiefer, M. Huth, A. Dobrinevski and B. Nickel, J. Am. Chem. Soc., 2007, 129, 10316–10317 CrossRef CAS PubMed.
- C. M. Christine, B. D. Anne, B. Jacob, T. O. Gert, M. Auke, L. d. B. Jan and T. M. P. Thomas, Synth. Met., 2003, 138, 475–481 CrossRef.
- R. G. Della Valle, A. Brillante, E. Venuti, L. Farina, A. Girlando and M. Masino, Org. Electron., 2004, 5, 1–6 CrossRef CAS.
- K. Isoda, M. Nakamura, T. Tatenuma, H. Ogata, T. Sugaya and M. Tadokoro, Chem. Lett., 2012, 41, 937–939 CrossRef CAS.
- A. D. Becke, J. Chem. Phys., 1993, 98, 5648 CrossRef CAS.
- M. J. Frisch, G. W. Trucks, H. B. Schlegel, G. E. Scuseria, M. A. Robb, J. R. Cheeseman, G. Scalmani, V. Barone, B. Mennucci, G. A. Petersson, H. Nakatsuji, M. Caricato, X. Li, H. P. Hratchian, A. F. Izmaylov, J. Bloino, G. Zheng, J. L. Sonnenberg, M. Hada, M. Ehara, K. Toyota, R. Fukuda, J. Hasegawa, M. Ishida, T. Nakajima, Y. Honda, O. Kitao, H. Nakai, T. Vreven, J. A. Montgomery, Jr., J. E. Peralta, F. Ogliaro, M. Bearpark, J. J. Heyd, E. Brothers, K. N. Kudin, V. N. Staroverov, R. Kobayashi, J. Normand, K. Raghavachari, A. Rendell, J. C. Burant, S. S. Iyengar, J. Tomasi, M. Cossi, N. Rega, J. M. Millam, M. Klene, J. E. Knox, J. B. Cross, V. Bakken, C. Adamo, J. Jaramillo, R. Gomperts, R. E. Stratmann, O. Yazyev, A. J. Austin, R. Cammi, C. Pomelli, J. W. Ochterski, R. L. Martin, K. Morokuma, V. G. Zakrzewski, G. A. Voth, P. Salvador, J. J. Dannenberg, S. Dapprich, A. D. Daniels, O. Farkas, J. B. Foresman, J. V. Ortiz, J. Cioslowski and D. J. Fox, Gaussian 09, 2009 Search PubMed.
- D. H. Case, J. E. Campbell, P. J. Bygrave and G. M. Day, J. Chem. Theory Comput., 2015, 910–924 Search PubMed.
- C. P. Brock and J. D. Dunitz, Chem. Mater., 1994, 6, 1118–1127 CrossRef CAS.
- S. L. Price, M. Leslie, G. W. A. Welch, M. Habgood, L. S. Price, P. G. Karamertzanis and G. M. Day, Phys. Chem. Chem. Phys., 2010, 12, 8478–8490 RSC.
- D. E. Williams, J. Comput. Chem., 2001, 22, 1154–1166 CrossRef CAS.
- A. Stone and M. Alderton, Mol. Phys., 2002, 100, 221–233 CrossRef.
- J. A. Chisholm and S. Motherwell, J. Appl. Crystallogr., 2005, 38, 228–231 CrossRef.
- M. Pavanello and J. Neugebauer, J. Chem. Phys., 2011, 135, 234103 CrossRef PubMed.
- G. te Velde, F. M. Bickelhaupt, E. J. Baerends, C. Fonseca Guerra, S. J. van Gisbergen, J. G. Snijders and T. Ziegler, J. Comput. Chem., 2001, 22, 931 CrossRef CAS.
- J. P. Perdew, J. A. Chevary, S. H. Vosko, K. A. Jackson, M. R. Pederson, D. J. Singh and C. Fiolhais, Phys. Rev. B: Condens. Matter Mater. Phys., 1992, 46, 6671–6687 CrossRef CAS.
- J. Nyman and G. M. Day, CrystEngComm, 2015, 17, 5154 RSC.
- W.-Q. Deng and W. A. Goddard III, J. Phys. Chem. B, 2004, 108, 8614–8621 CrossRef CAS.
- A. Kubas, F. Hoffmann, A. Heck, H. Oberhofer, M. Elstner and J. Blumberger, J. Chem. Phys., 2014, 140, 104105 CrossRef PubMed.
- A. Kubas, F. Gajdos, A. Heck, H. Oberhofer, M. Elstner and J. Blumberger, Phys. Chem. Chem. Phys., 2015, 17, 14342 RSC.
- A. M. Reilly, R. I. Cooper, C. S. Adjiman, S. Bhattacharya, A. D. Boese, J. G. Brandenburg, P. J. Bygrave, R. Bylsma, J. E. Campbell, R. Car, D. H. Case, R. Chadha, J. C. Cole, K. Cosburn, H. M. Cuppen, F. Curtis, G. M. Day, R. A. DiStasio Jr, A. Dzyabchenko, B. P. van Eijck, D. M. Elking, J. A. van den Ende, J. C. Facelli, M. B. Ferraro, L. Fusti-Molnar, C.-A. Gatsiou, T. S. Gee, R. de Gelder, L. M. Ghiringhelli, H. Goto, S. Grimme, R. Guo, D. W. M. Hofmann, J. Hoja, R. K. Hylton, L. Iuzzolino, W. Jankiewicz, D. T. de Jong, J. Kendrick, N. J. J. de Klerk, H.-Y. Ko, L. N. Kuleshova, X. Li, S. Lohani, F. J. J. Leusen, A. M. Lund, J. Lv, Y. Ma, N. Marom, A. E. Masunov, P. McCabe, D. P. McMahon, H. Meekes, M. P. Metz, A. J. Misquitta, S. Mohamed, B. Monserrat, R. J. Needs, M. A. Neumann, J. Nyman, S. Obata, H. Oberhofer, A. R. Oganov, A. M. Orendt, G. I. Pagola, C. C. Pantelides, C. J. Pickard, R. Podeszwa, L. S. Price, S. L. Price, A. Pulido, M. G. Read, K. Reuter, E. Schneider, C. Schober, G. P. Shields, P. Singh, I. J. Sugden, K. Szalewicz, C. R. Taylor, A. Tkatchenko, M. E. Tuckerman, F. Vacarro, M. Vasileiadis, A. Vazquez-Mayagoitia, L. Vogt, Y. Wang, R. E. Watson, G. A. de Wijs, J. Yang, Q. Zhu and C. R. Groom, Acta Crystallogr., Sect. B: Struct. Sci., Cryst. Eng. Mater., 2016, 72, 439–459 CAS.
- J. Nyman and G. M. Day, Phys. Chem. Chem. Phys., 2016, 18, 31132–31143 RSC.
- L. Kronik and A. Tkatchenko, Acc. Chem. Res., 2014, 47, 3208–3216 CrossRef CAS PubMed.
- G. J. O. Beran and K. Nanda, J. Phys. Chem. Lett., 2010, 1, 3480–3487 CrossRef CAS.
Footnote |
| † Electronic supplementary information (ESI) available: CIF files of predicted crystal structures of all molecules studies; calculated energies and properties of predicted crystal structures; crystal structure and ESF landscapes for 7N azapentacenes; fitting of weighting for weighted average mobility calculations. See DOI: 10.1039/c7tc02553j |
| This journal is © The Royal Society of Chemistry 2017 |

