
 Open Access Article
 This Open Access Article is licensed under a Creative Commons Attribution-Non Commercial 3.0 Unported Licence
Relating polymer chemical structure to the stability of polymer:fullerene solar cells†
Nutifafa Y.
Doumon
 a,
G.
Wang
b,
Ryan C.
Chiechi
ab and
L. Jan Anton
Koster
*a
a,
G.
Wang
b,
Ryan C.
Chiechi
ab and
L. Jan Anton
Koster
*a
aZernike Institute for Advanced Materials, University of Groningen, Nijenborgh 4, NL-9747 AG, Groningen, The Netherlands. E-mail: l.j.a.koster@rug.nl
bStratingh Institute for Chemistry, University of Groningen, Nijenborgh 4, NL-9747 AG, Groningen, The Netherlands
First published on 21st June 2017
Abstract
The design of novel polymers has brought more attention to bulk heterojunction polymer:fullerene solar cells in the past decade. A typical example is the synthesis, through chemical structure engineering, of the benzodithiophene-co-thieno[3,4-b]thiophene (BDT-TT) polymers leading to power conversion efficiency of over 10%. In this work, we study the stability for a set of PBDT-TT polymers. We conduct a systematic UV-degradation study on the solar cells. Most importantly, the paper shows clearly the effect of polymer chemical structure on the UV-degradation pathway of the solar cells. We find that based on the polymer chemical structure, solar cells of polymers with alkoxy side chains are more stable (<20% loss in PCE) than those with alkylthienyl side chains (∼48% loss in PCE) over the period of study. These findings pave the way for new materials that yield efficient as well as stable organic solar cells.
Introduction
With the incessant increase in energy demands coupled with population growth and the pressing need to diminish or halt global warming, there is a worldwide effort to make available sustainable and environmentally friendly energy sources. One of these renewable sources is solar energy. The last decade has seen tremendous advances in polymer:fullerene blend solar cell (PSC) technology. Two factors fuelled this drive. First, the PSC technology offers a wide range of possibilities: mechanical flexibility with adequate tuneable colour and transparency (flexible devices/displays), relatively easy and cost effective device fabrication (processing from solution), high throughput, compatibility with large area (ease of production scalability on large area), ultra-thin and lightweight devices (ease of transportation), and truly green technology (no toxic materials in the clean production process and in the end-product).1 Next, the main drive behind these breakthroughs is innovation in materials, especially the donor materials (polymer). The extensively used acceptors, fullerene derivatives in this case, are phenyl-C61-butyric acid methyl ester – [60]PCBM and phenyl-C71-butyric acid methyl ester – [70]PCBM. For over two decades, they have become the benchmark for the blend active layer in bulk heterojunction solar cells, partly helping to improve their efficiency over time. A typical example is the poly(3-hexylthiophene) P3HT:[60]PCBM blend yielding 4.4%.2Recently, the power conversion efficiency (PCE) of the PSC, barely 1% fifteen years ago, has reached above 10%.3–7 This progress is mainly due to chemical structure engineering, giving access to novel donor materials. A typical example is the synthesis of the benzodithiophene-co-thieno[3,4-b]thiophene (BDT-TT) backbone based polymers leading currently, to improved solar cells PCE.8–13 The current record efficiency is 11.5% for a single junction device14,15 and 13.2% for a tandem device.1 Among these polymers (Fig. 1a), PTB7 with alkoxy (R–O) side chains is the benchmark polymer.16–18 Other BDT-TT unit polymers are PBDTTT-C and PBDTTT-E. Additionally, polymers of the same family with the R–O side chains replaced by alkylthienyl groups (R–T) were synthesized. These are PTB7-Th, also known as PBDTT-FTTE (or PBDTTT-EFT), PBDTTT-C-T, PBDTTT-ET. This change in substitution of side chains generally enhanced the performance of the optimized devices roughly by 1%, in all three cases.9,12,13,19–22 What does performance of solar cell mean? Is it only PCE? So far, the individual reports from various groups on the enhancement of the performance of solar cells11,16,19,21,22 when moving from R–O to R–T side chains, were mainly on PCE, with focus on device architecture and the use of additives. There is a lack of studies on degradation mechanisms23,24 in general and in devices, thus, very little was done on the degradation and stability of this class of materials25–27 and much less on the degradation and stability of their devices.28,29
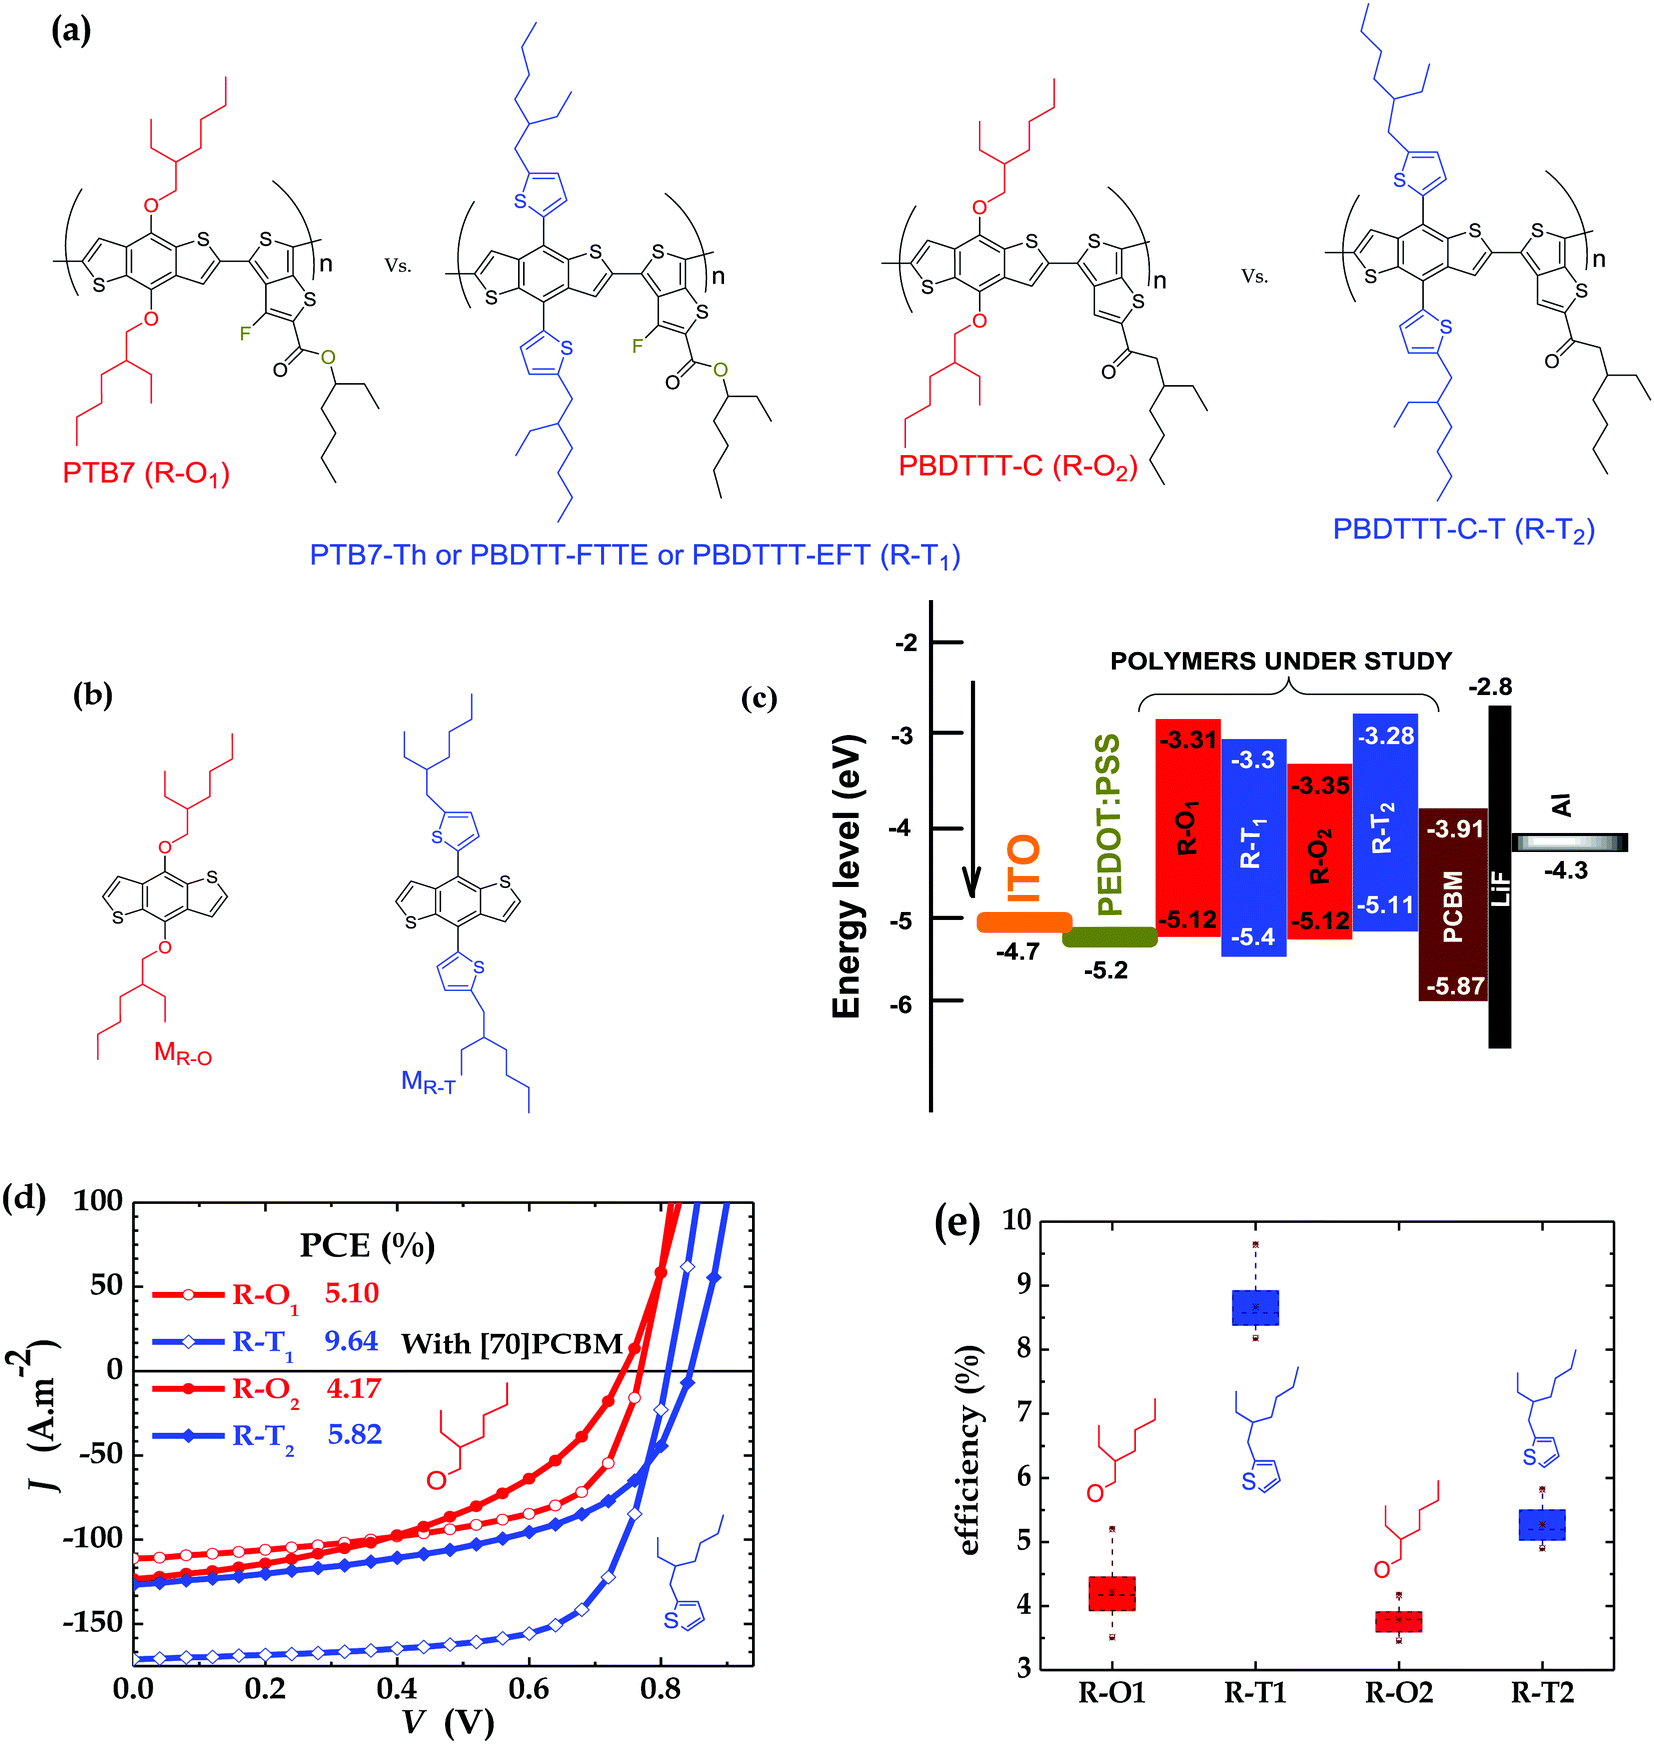 | ||
| Fig. 1 Molecular structures of (a) donor polymers and (b) monomers (M); (c) HOMO–LUMO levels; (d) current–voltage curves of PSCs of polymers blended with [70]PCBM; and (e) efficiency of PSCs (with the brown points representing the maximum and minimum values (outside the boxes), and the mean values within the boxes; average values are shown in Table S1, ESI†). Device thickness: R–O1 ∼ 100 nm, R–T1 ∼ 100 nm, R–O2 ∼ 130 nm, and R–T2 ∼ 110 nm. | ||
Semiconducting polymers generally degrade, especially under visible light illumination, resulting in steady buildup of free radical species as shown by Frolova et al.30 with studies on PTB7 and PBDTTT-CF. It is also shown that the presence of additives, in particular DIO, in the active layer of organic solar cells accelerates the degradation mechanism31 in these devices. The reports on the impact of the additives on the stability of the devices are few and the mechanism behind this negative impact is still unclear. Assuming that [70]PCBM plays the same role in the mixture with these BDT-TT based polymers, the radical species of the different polymers could act as deep traps and, based on their chemical structures, have different effects on the performance of the conjugated polymers in organic solar cells in terms of stability. Lately, studies have also stressed that side chains negatively influence polymer photochemical stability.32–34 Manceau et al.35 suggested that replacing a single part of the polymer strongly affects the photochemical stability of the material. However, there has been little research on this chemical structure–stability relationship especially for the BDT-TT polymer solar cells.
This work investigates the effects of substituting the R–O groups on the BDT-units of these polymers (PTB7 and PBDTTT-C) with the R–T groups (PTB7-Th and PBDTTT-C-T) on PCE and device stability under illumination. Initially, we thought the R-ester-thiophene or the R-ketone-thiophene moieties on the TT-units would have made a difference on the degradation pathway. It quickly turned out that their effects were either similar if one compared R–O devices to R–T ones or very minimal if one compared the R–O devices and R–T ones among themselves. The focus is to study the effect of the polymer chemical structure on the UV-stability of conventional devices. To arrive at this goal in a reliable way, we first achieve reasonable PCEs for these two classes of polymers in conventional solar cell devices processed without an additive, in this case, DIO. DIO is known to be a rapid degradation agent, so we avoided their use in this work in order to eliminate their bearing on our findings. Then, to ensure that the fabricated solar cells worked under optimal condition (performance, PCE), we also simultaneously processed as a control, conventional devices with additive. We examined both device PCE and stability under UV-irradiation for this set of polymers (Fig. 1a), and also observed the effect of an additive on performance of the solar cells. We also conducted charge transport and NMR experiments on the polymers (and blends with [70]PCBM) and the substituted BDT-unit monomer (Fig. 1b) solutions respectively, in an attempt to understand the observed degradation pathway in the solar cells made of these novel polymers. The results showed that even though R–T side chains improve PCE as compared to the R–O side chains, they are worse performers with regards to degradation and stability. We showed that R–T groups accelerate UV degradation in the PSC over the same period of exposure.
Results and discussion
Performance of polymer solar cells
Comparative efficiency studies were carried out as a control on all four polymers each time devices were fabricated in order to check reproducibility and to achieve the purpose of the work in a reliable way. The main experiments were conducted on conventional structure devices without additives and fabricated under the same conditions to ensure there were no differences in processing and environmental conditions. The active layers are blends of either R–O or R–T polymers of two classes of BDT-TT polymers, shown in Fig. 1a, with [70] PCBM dissolved in 1,2-dichlorobenzene (oDCB). As expected, the PSCs of polymers with the R–T side chains outperformed those with R–O groups. The best cell based on PTB7 (R–O1) had a PCE of 5.10% with a short circuit current (JSC) of 11.12 mA cm−2, an open circuit voltage (VOC) of 769 mV and a field factor (FF) of 59.6%. The overall best-performing cell was PTB7-Th (R–T1) which exhibited a PCE of 9.64% with improved JSC of 17.09 mA cm−2, VOC of 811 mV and FF of 69.6%. A similar trend was observed for PSCs of PBDTTT-C (R–O2) and PBDTTT-C-T (R–T2), with PCEs of 4.17% and 5.82% respectively. The better photovoltaic performance of the R–T devices is attributed to their slightly lower HOMO (see Fig. 1c especially for R–T1); to their slightly broadened absorption band, with the onset slightly red-shifted (Fig. S1a and b, ESI†), eventually reflected in increase of JSC (Fig. 1d); and to their improved charged carriers mobility, explained by better surface morphology of blend. Detailed parameters of the best-performing solar cells are shown in Fig. 1d while Fig. 1e gives the PCE spread for all four polymer solar cells.As a quick check, to ensure that the devices were working under optimal conditions, devices were fabricated with and without diiodoctane (DIO) as an additive. Table S1 (ESI†) clearly shows that the addition of 3% DIO to oDCB at a v/v ratio of (97![[thin space (1/6-em)]](https://www.rsc.org/images/entities/char_2009.gif) :3) resulted in a substantial improvement of the device performance. There was an increase in device parameters in general, except for slight decrease in VOC as expected and reported elsewhere.12,33–37 For example, as clearly shown in Fig. S2a (ESI†), in the case of R–O1 the PCE increased from 4.54% to 7.07%, amounting to a jump of 56%. In effect, when DIO was added, 56%, −3%, 37% and 43% enhancement in PCE were recorded respectively for R–O1, R–T1, R–O2 and R–T2. These findings can be better observed graphically in the J–V curves of the cells (Fig. S2b, ESI†) and the detailed parameters shown in Table S1 (ESI†). The observed enhancements in the three cases are attributed to better active layer morphology31,37–40 in the case of the DIO additive, resulting in an efficient charge separation in the bulk heterojunction, and thus, a low charge recombination in the bulk.
:3) resulted in a substantial improvement of the device performance. There was an increase in device parameters in general, except for slight decrease in VOC as expected and reported elsewhere.12,33–37 For example, as clearly shown in Fig. S2a (ESI†), in the case of R–O1 the PCE increased from 4.54% to 7.07%, amounting to a jump of 56%. In effect, when DIO was added, 56%, −3%, 37% and 43% enhancement in PCE were recorded respectively for R–O1, R–T1, R–O2 and R–T2. These findings can be better observed graphically in the J–V curves of the cells (Fig. S2b, ESI†) and the detailed parameters shown in Table S1 (ESI†). The observed enhancements in the three cases are attributed to better active layer morphology31,37–40 in the case of the DIO additive, resulting in an efficient charge separation in the bulk heterojunction, and thus, a low charge recombination in the bulk.
Device stability
The stability tests were conducted in a glovebox on each device (kept at room temperature 295 K by active cooling) in an inert environment (with <0.1 ppm H2O and <0.1 ppm O2) under continuous simulated sunlight for 2 hours. The spectrum (black line) of the lamp used is shown in Fig. S7 (ESI†).41 All shown results are for the best-performing cells, and all mentioned devices were fabricated under the same conditions to ensure differences in the UV-degradation pathway are not due to processing. Reports in this paper are based on the best-performing devices. As shown in the literature,31 devices with DIO showed accelerated (UV)-degradation (Fig. S2c (ESI†) shows R–O1 as an example). Fig. 2a shows the decay/degradation pathway of the R–O based devices compared to R–T ones. A decay in PCE within the limit of ∼10% of its initial PCE was observed for the R–O1 device over 2 hours continuous illumination, while the R–T1 device decayed over the same period by ∼35%. This observation seems rather surprising as alkoxy side chains are known to negatively impact polymer stability.42 That is not the case here for UV-stability. Even under thermal stability it is not entirely clear if that is the case in view of our observation (figure not shown here). Similarly the R–O2 device recorded a ∼16% decay of its initial value compared to R–T2 with ∼48% decay. Details of the decay rate of other parameters of the PSCs of both groups are shown in Fig. 2b–d. Here, clearly, while VOC decreased, JSC remained almost constant for all blends. The FF, however, decreased for R–T devices, but remained almost constant for R–O devices. To further examine the extent of degradation in both type of devices, in terms of stability, their lifetime, T80, was determined. T80 is the time at which a device degrades by 20% from its initial PCE irrespective of the testing conditions.43 The lifetime of the R–T1 device was found to be <15 min while that of R–T2 device was <20 min. For the R–O devices, we could only assume a minimum possible lifetime of 2 hours since the devices did not degrade to 80% of their PCE over the duration of the measurements.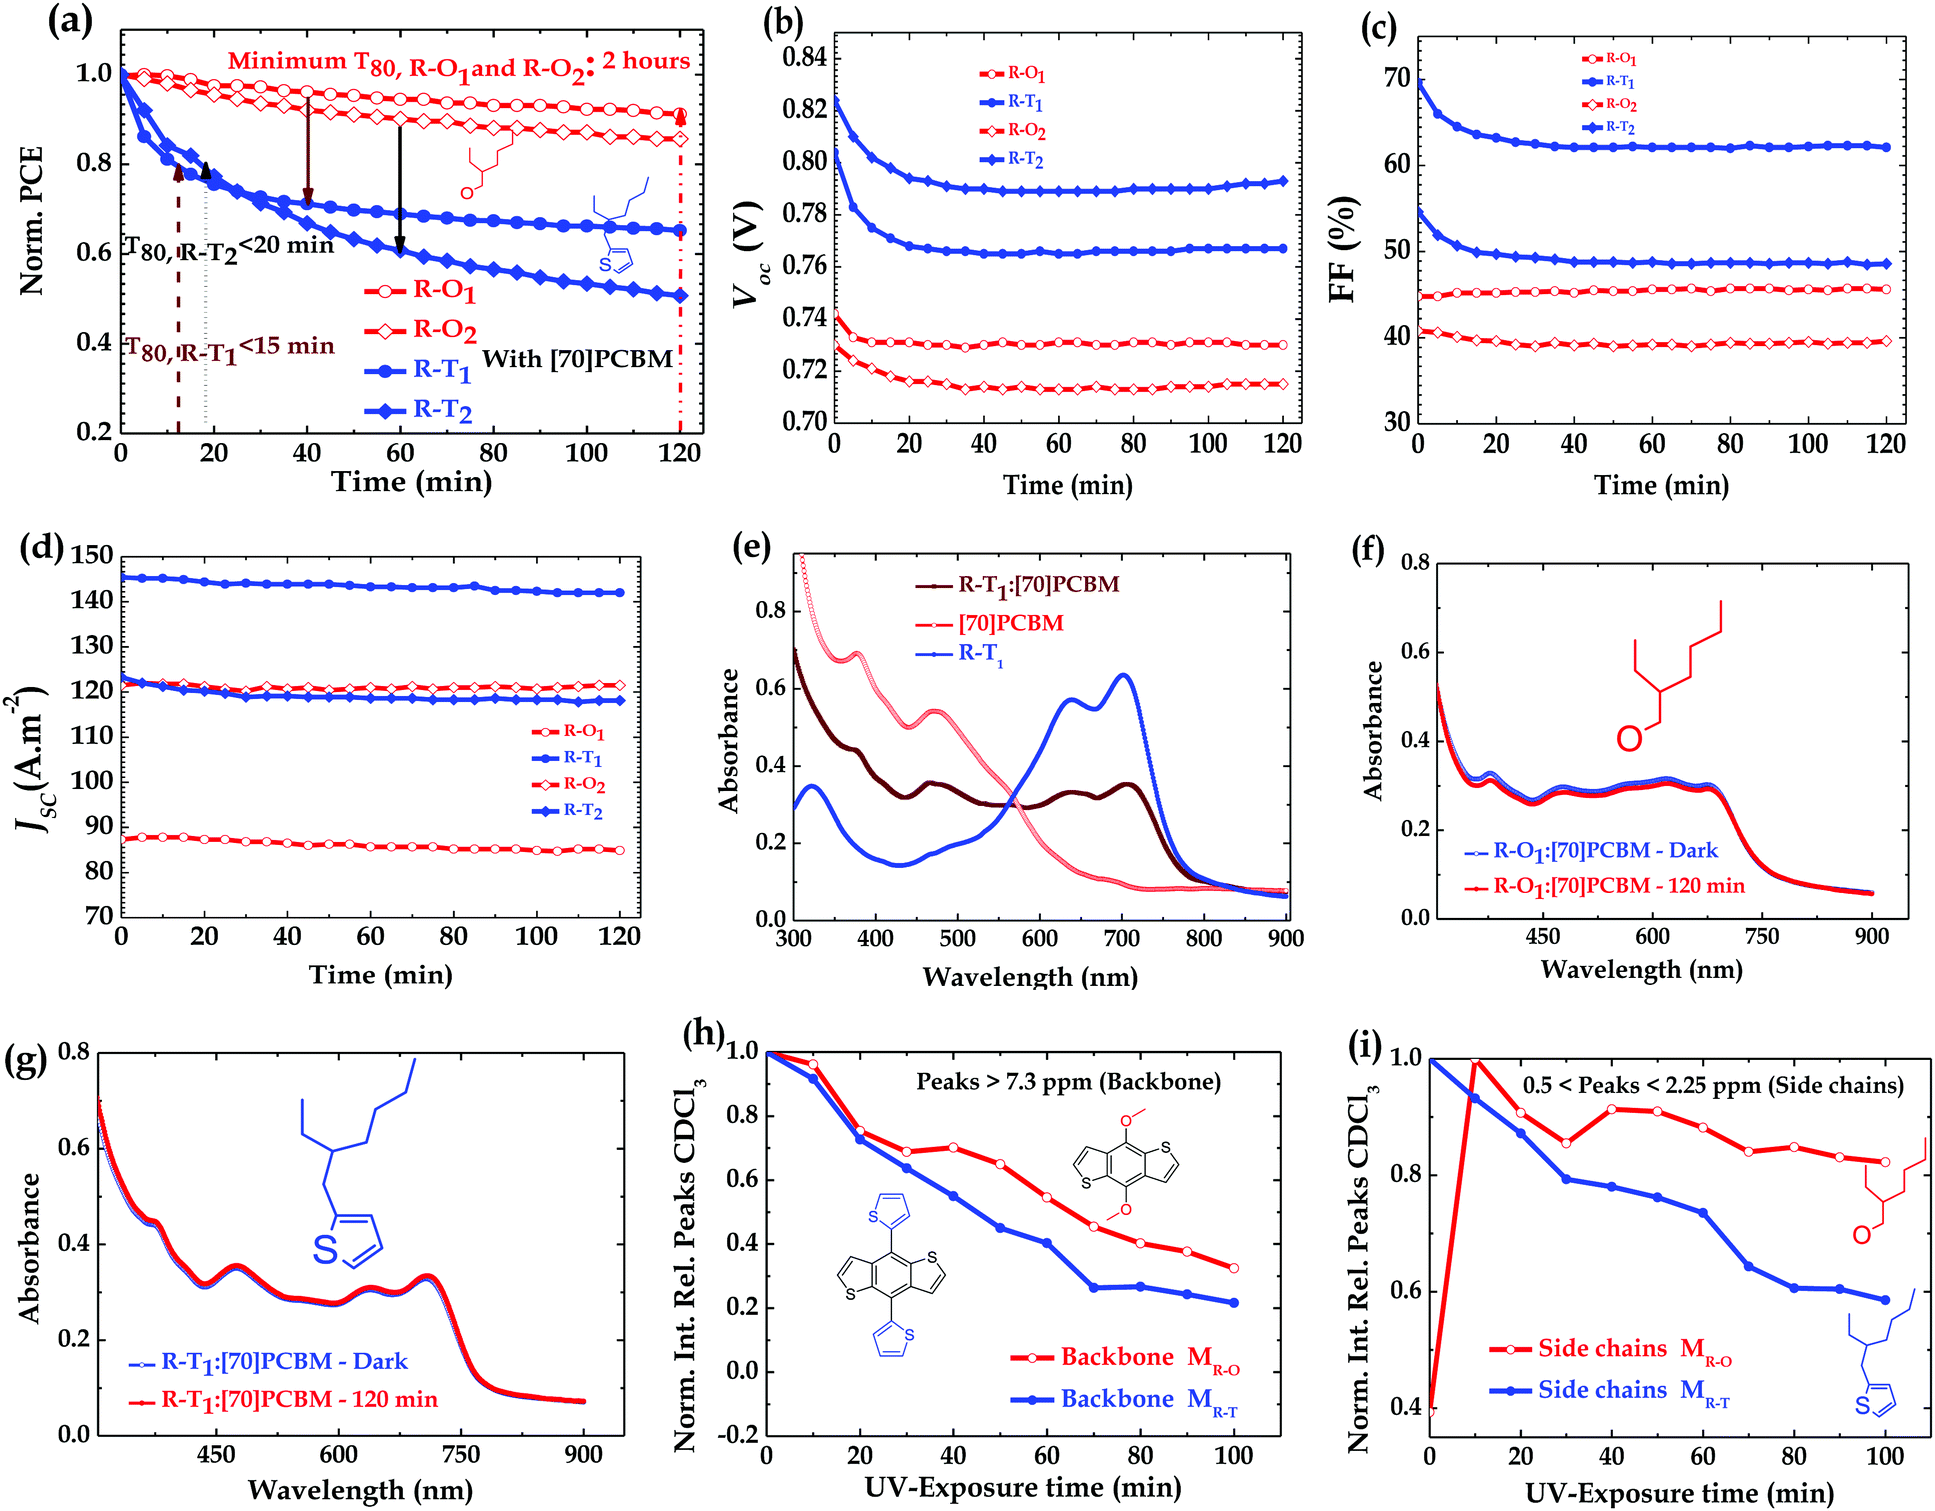 | ||
| Fig. 2 Normalized PCE degradation over time of (a) R–O (red) compared to R–T (blue) polymer devices; (b–d) evolution of VOC, FF and JSC over time; absorption spectra of (e) films of R–T1 polymer-of [70]PCBM-of blend with [70]PCBM, and of exposed (red) and unexposed (blue) blend films of (f) R–O1 polymer (g) R–T1 polymer; and normalized integrated relative peaks to solvent (CDCl3) of 1H NMR of R–O (red curve) and R–T (blue curve) monomer solutions in sealed NMR tubes vs. UV-exposure time in an inert atmosphere (h) backbone characteristic peaks and (i) side chains characteristic peaks. | ||
To determine if the observed degradation in the devices could be due to photobleaching, absorption spectra of the blends were taken before and after 2 hours exposure to light. As can be observed in Fig. 2e, both the polymer and [70]PCBM absorbs from UV (300–425 nm), so if any significant change is observed in any of the devices compared to the others, it could be attributed to that particular polymer. The spectra of all components looked similar to the one depicted in Fig. 2e, with notable differences in the polymer and blend spectra. As shown in Fig. 2f, g and Fig. S1c, d (ESI†) the interesting observation, however, was that there was no apparent change in spectra before and after exposure. Hence, the observed UV-degradation cannot be attributed to photobleaching.
Additionally, despite being a very good hole transporting layer (HTL), PEDOT:PSS has been found to be unfavourable for device stability, thus researchers have tried to replace it with metal oxides either in conventional or in inverted structure for improved device stability.44–48 It is believed that the acidic nature of PEDOT:PSS means it could react more with the R–T polymers in the blends and therefore could explain the accelerated degradation of these types of devices. To confirm this hypothesis, conventional devices were fabricated on one hand without the PEDOT:PSS layer (with the structure ITO/Blend/LiF/Al) and on the other hand with a pH-neutral PEDOT:PSS layer (with the structure ITO/pH-neutral PEDOT:PSS/Blend/LiF/Al). Furthermore, there were also concerns about Li diffusion into the active layer of the device and therefore could be the major factor in the degradation observed. To check this effect, we made devices with the following structure ITO/PEDOT:PSS/Blend/Ca/Al. All three types of devices were illuminated under the same conditions as the original ones. To our surprise, as stated earlier, again in these three cases similar trends were observed as depicted in Fig. S3 (ESI†): R–T devices degraded faster than R–O devices. Also, AFM images of as cast and exposed blend films showed no notable differences in features. Fig. S8 (ESI†) shows the case of PTB7:[70]PCBM blend films. Thus, the degradation cannot be attributed to morphology change or pronounced phase separation upon illumination. We therefore attributed the rapid decay in the R–T devices to the alkylthienyl side chain decomposition products or free radical species that could form from the rapid and pronounced photochemical reactions of the alkylthienyl side chains activated by the UV-light exposure. These species could form big decomposition products and subsequently act as impurities or deep traps which could hamper the stability of the R–T devices more than the R–O free radical species do to the R–O devices.
To further investigate the formation of the decomposition products which we ascribed to be the cause of the observed degradation, an 1H NMR study was conducted on dissolved BDT-monomers, MR–O and MR–T, shown in Fig. 1b. The 1H NMR were carried out in an inert environment using air-tight/sealed NMR tubes with solutions prepared in a glovebox. The results shown in Fig. 2h, i and 3 confirm our hypothesis. There was a rapid decline (as shown in Fig. 3b and Fig. S4b, ESI†) in the integrated intensity of the peaks corresponding to the monomers relative to the solvent (CDCl3) peak, of the R–T monomer solution, compared to the R–O monomer solution (Fig. 3a and Fig. S4a, ESI†). While both monomer solutions degraded upon UV-exposure, the rate of degradation of R–T was faster, especially as shown in Fig. 2i, than that of R–O. A typical example is the disappearance of the R–T proton peak at 1.5 ppm just after 10 min exposure, see Fig. S4b. The 1H NMR spectrum of the R–O clearly showed the formation of new peaks (highlighted in purple circles) with decreasing intensities of the initial peaks (red circles). These new peaks have the same multiplicity of the monomer, but are shifted down-field, indicating the possible formation of a quinone moiety, present in the solution, upon cleavage of the alkoxy side chains. In the R–T spectrum, however, almost no new peaks were observed. This does not mean, there were no decomposition products. A careful study of the exposed R–T monomer solution spectrum, showed clearly that there were cleavage of the alkyl side chains and possibly of the thiophene rings which could form decomposition products, rather insoluble, and therefore, not detected by 1H NMR. Evidently, R–T degraded faster than R–O, which confirms our hypothesis for the trends observed in the degradation of the devices. The photodegradation of PSCs has been recently attributed by some solely to effects triggered by charge collection layers and interfaces49 and by others to hot carriers breaking C–H bonds at the donor/acceptor interface.29 The latter claim required energies >4 eV, but we showed here that the monomers themselves are unstable to UV irradiation, which certainly does not involve homolytic cleavage of C–H bonds. If hot carriers were breaking apart C–H bonds, then almost no polymer would be stable, but that is not the case. The observed trend, however, in these four full devices reiterates the role played by the active layer composition.
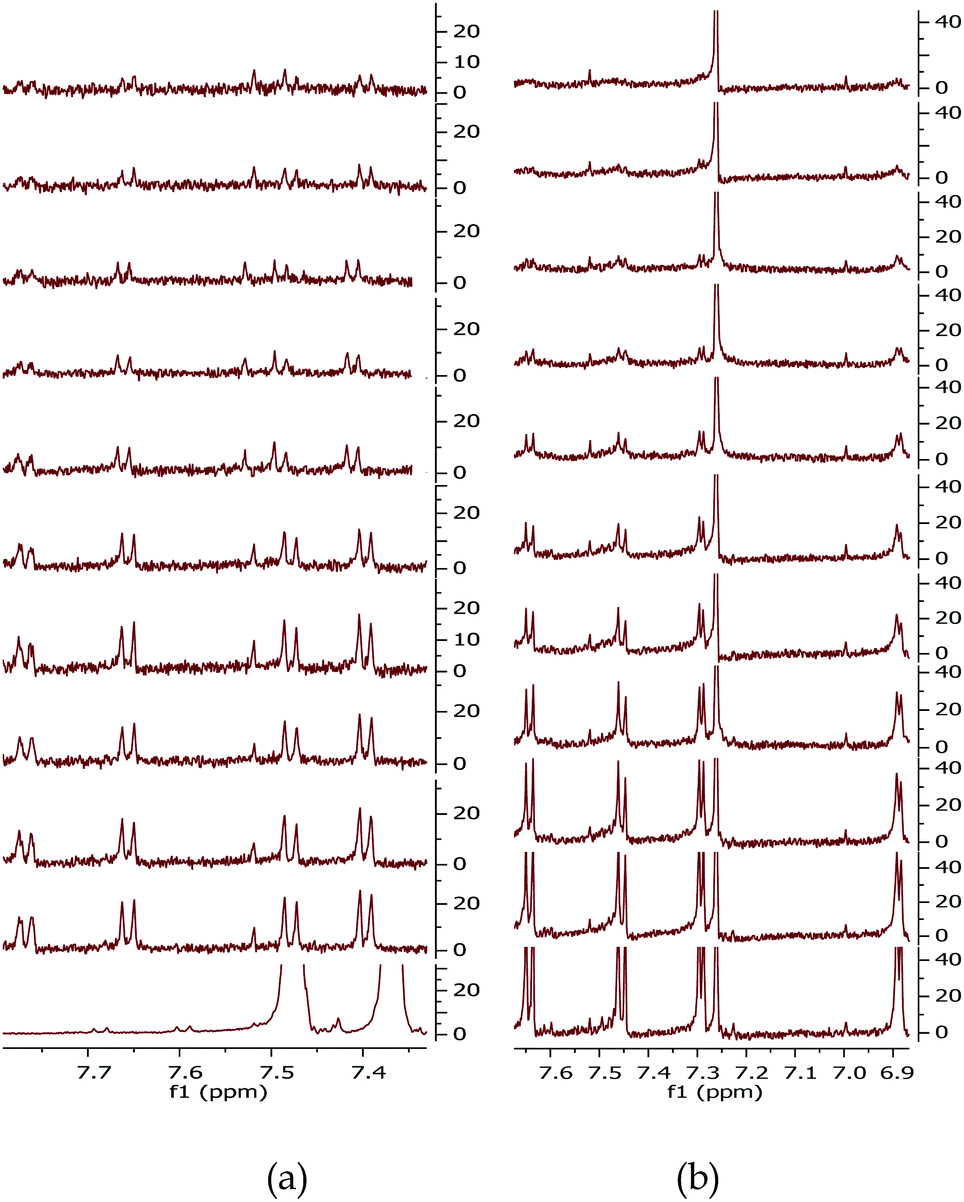 | ||
| Fig. 3 1H NMR spectra of (a) R–O and (b) R–T monomer solutions recorded in an inert environment using sealed NMR tubes under irradiation with 315–400 nm light at ten-minute intervals from bottom-to-top starting from the initial spectrum. | ||
In order to elucidate the combined effects of the presence or the absence of the fluorine (F) atom and the extra oxygen (O) atom on the TT-unit moieties in the molecular structure of the polymers on the stability of the solar cells, we examined the degradation pathways in the R–O and R–T devices themselves and compared them to each other. For example, as mentioned above and shown in Fig. 1a, the structures of the R–O polymers are identical including the side chains on the BDT-units except for the presence of F atom and an extra O atom on the side chain of the TT-unit in R–O1 compared to R–O2. The same relation holds between R–T1 and R–T2. The best-performing cells revealed that R–O1 devices were a bit more stable, with ∼10% decay over 2 hours light exposure, than R–O2 ones which recorded ∼16% decay. As shown in Fig. 2a, a similar observation was made about R–T1, with ∼35% decay and R–T2, with ∼48% decay. These observed differences (indicated in olive arrows) were so minimal, compared to differences between an R–O device and an R–T one (indicated in brown and black arrows), that it cannot be inferred with total certainty/confidence what role the presence or the absence of F and O atoms might be playing in the degradation pathway. The effect of fluorination alone on device performance has already been reported to be more complicated than just the changing of energy level as it affects polymer:fullerene compatibility.50
Charge transport
With the observed degradation, one would expect reduction of the hole current of the illuminated devices. To study the charge transport and see if this could be linked to the device degradation, single carrier devices of pristine polymers and blend materials were fabricated under similar conditions as explained elsewhere.41Fig. 4 and Fig. S5 (ESI†) present an overview analysis of the empirical data obtained from the charge transport measurements. The hole current of pristine R–T2 polymer, Fig. S5a (ESI†), is slightly higher than that of R–O2 polymer, Fig. S5b (ESI†). The same was observed for the electron current of the blend with R–T2 polymer, Fig. S5e (ESI†), with an order of magnitude higher than that of R–O2 devices, Fig. S5f (ESI†). This observation also confirms the fact that the R–T2 cells outperform the R–O2 ones in terms of efficiency. For R–T1 and R–O1, similar magnitude of currents were observed in both pristine hole only (Fig. 4a and d) and blend electron only (Fig. 4c and f) devices, explaining why they have similar performances in PCE as shown in the literature.18,51 In all four polymer pristine single carrier devices, the hole currents were reduced upon irradiation (Fig. 4a and d), while, the electron current of [70]PCBM remained almost constant. This seems to imply that the polymers degrade in the presence of UV, while PCBM does not. This reduction in hole current was more significant for the R–T devices than the R–O ones (Fig. 4a and d). In contrast to what is expected and observed in the pristine devices, the hole currents of the blend single carrier devices, as shown in Fig. 4b and e, were rather slowed down in the presence of [70]PCBM and remained almost constant (comparable to the current of the degraded pristine hole single carrier devices in Fig. 4a and d), while, the electron currents (Fig. 4c and f) reduced upon UV exposure. One would expect the inverse situation where the hole current of the blends rather reduces upon illumination. However, this process may not be correlated and obvious. The observed degradation in the monomer solutions and polymer devices suggests that the cleaved side chains form products that act as or create traps for electrons and that is probably reflected in the reduction of the electron current of the blends upon illumination (ageing). It is apparent from these figures/results that on one hand, [70]PCBM stabilizes the hole current in all these devices. This stabilization effect of the current seems to have an upper limit that is the current profile of the exposed pristine hole only device. The effect was already reported on PPV:PCBM blends52 and was recently attributed to light screening effect.53 The photo-degradation of all four polymers could be initiated by their excited states, and [70]PCBM quenches these states in the process and thereby relatively slowing down the photo-oxidation,34,54,55 especially, in the case of R–O devices. The alkoxy side-chain cleavage leads to the oxidation of the quinone core. The NMR evidence is that photo-degradation leads to the formation of the oxidized form of the quinone moiety, which is quite stable. On the other hand, however, [70]PCBM precipitates the reduction in electron transport as observed in all cases. This destabilization is more pronounced in R–T devices than in R–O devices. Thus, indicating the presence of more decomposition products which could act as traps in the R–T devices due to probable broken molecules present in the film by the cleavage of the alkyl side chains and probably the thiophene ring. This was also the case in the literature34,55 which they rather attributed to oxidation. This pronounced destabilization in R–T devices coupled with the currents limiting effect could explain why R–O devices are more stable than the R–T devices.
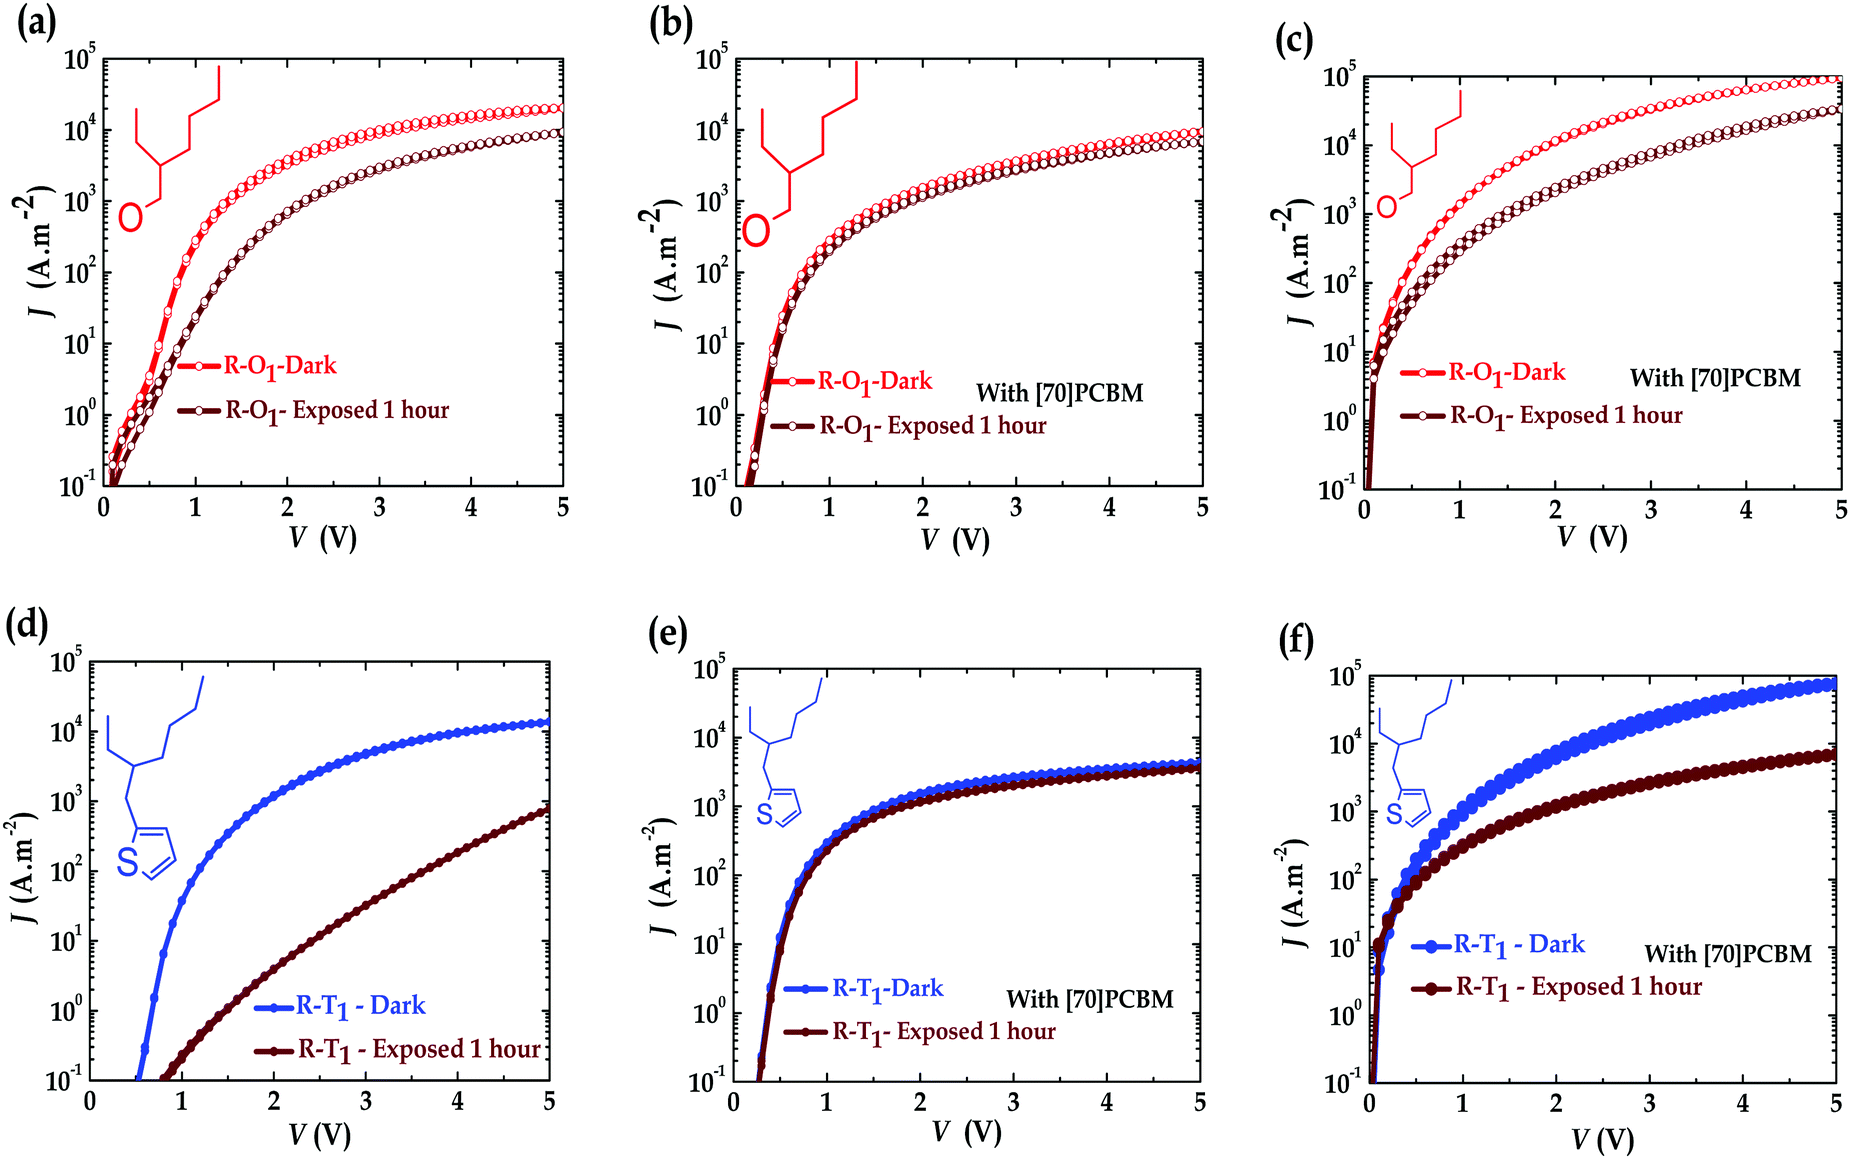 | ||
| Fig. 4 Current–voltage characteristics of unexposed (red if R–O, blue if R–T) and exposed (1 hour – brown) (a) pristine R–O1 polymers hole only devices; (b) blend R–O1 polymers hole only devices; (c) blend R–O1 polymers electron only devices; (d) pristine R–T1 polymers hole only devices; (e) blend R–T1 polymers hole only devices; and (f) blend R–T1 polymers electron only devices. Device thickness: pristine (130–160 nm) and blend (100–130 nm). | ||
To further investigate the argument of traps, light intensity dependence measurements were conducted on all four polymer:fullerene solar cells. The ideality factor (n) as determined from the dependence of VOC on light intensity, can be used to assess the recombination losses in solar cells.56 First, a stronger dependence of VOC on light intensity reveals that there are more traps in the system57i.e. 1 < n < 2. However, n = 1 would simply mean there is no trap assisted recombination. In their fresh states, the fabricated R–T devices have little or no trap-assisted recombination compared to their R–O counterparts, explaining their slightly better performance. This implies that, in the fresh state, the alkoxy-based polymers cells suffer more from trap-assisted recombination than the alkylthienyl ones. For the fresh devices, the ideality factors were 1.50 and 1.09 for R–O1 and R–T1 respectively; and 1.07 and 1 for R–O2 and R–T2 respectively. An increase in n was observed after light exposure for all devices, confirming the presence of more traps under illumination. From 1.50 to 1.74 within 1 hour light exposure, then to 1.77 in 2 hours, and finally to 1.80 in 3 hours for R–O1. For R–T1, this increase was from 1.09 to 1.30, then to 1.34, and finally to 1.35. Similar trends were observed for R–O2 and R–T2; details can be seen in Table S2 and Fig. S6 (ESI†). This increase, however, as clearly shown in Fig. S6a and b (ESI†) is slightly higher (in blue) for the R–T devices compared to (in red) the R–O devices. Even though, these percentage increases do not readily translate into known percentages of increases in traps, it is however, as shown in Fig. 5, an indication of slightly more traps present in R–T devices upon UV-exposure. This could also account for another factor confirming their faster degradation. Thus, the dependence of degradation on chemical structure.
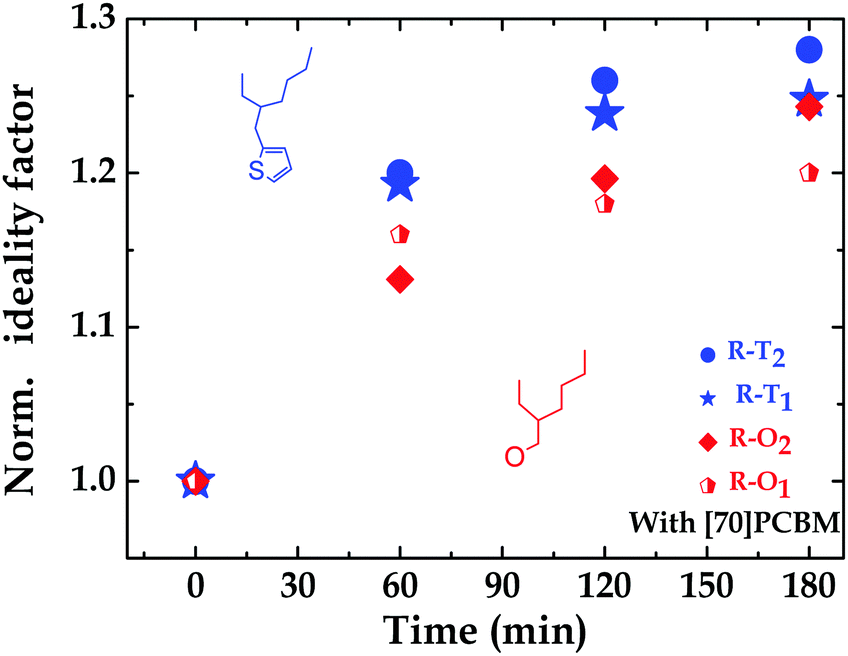 | ||
| Fig. 5 Ideality factor: n over exposure time, normalized to the n of the fresh devices. | ||
Experimental
Materials: monomers & polymers
The monomers were synthesized (full description in ESI† under synthesis of BDT-monomers) while all polymers were obtained from Solarmer Materials Inc. [70]PCBM and all solvents were purchased from Solenne BV and Sigma-Aldrich respectively. All materials commercially purchased were used as received without further purification. All our devices were fabricated through a 3-step process with the hole transporting and active layer solutions processed through spin coating. To avoid the impacts of molecular weights (Mn, Mw) and polydispersity index (Đ) on the reported experiments, all polymers were selected with very similar characteristics with Đ ∼ 1.9, Mn around 40 kDa and optical bandgap close to ∼1.6 eV.Device fabrication
All solutions and devices were prepared in a cleanroom environment.:1.5 was dissolved in anhydrous 1,2-dichlorobenzene (oDCB), 99% at a concentration of 25 mg ml−1 and stirred at 60 °C overnight. For PSC with DIO in the active layer a volume ratio of 97:3% of oDCB:DIO was used to dissolve the blend. For pristine polymer single carrier devices, 20 mg of the polymer was dissolved in 1 ml of oDCB and stirred at 60 °C overnight.
For PSC, the PEDOT:PSS layer (∼60 nm) was spin-coated from solution (PEDOT:PSS; VP AI4083, H. C. Stark) atop the ITO and annealed at 140 °C for 10 minutes. Next, the samples were transferred into a glovebox under inert conditions where the blend solutions were spin-coated for 5 seconds and then spin-dried for 120 seconds. Finally, the top electrodes either LiF (1 nm) and Al (100 nm) or Ca (20 nm) and Al (100 nm) were thermally deposited in an evaporator kept under <10−6 mbar vacuum. The final device structure is ITO/PEDOT:PSS/Polymer:[70]PCBM/LiF(Ca)/Al with device area of 10 mm2 as defined by the electrode overlap or 4 mm2 by the mask. In all, more than 80 devices were fabricated. The active layer thickness of the blends is between 100–130 nm for the UV-degradation experiments with the best-performing cells around 100 nm.
For single carrier devices, similar device fabrication methods were used with structural differences, thus, for the hole only device, the structure is Cr (1 nm)/Au (20 nm)/PEDOT:PSS/Polymer (or Blend)/Pd(15 nm)/Au(80 nm) and for electron only devices Al(20 nm)/[70]PCBM (or blend)/LiF(1 nm)/Al(100 nm). The active layer thickness of the pristine polymer samples is between 130–160 nm.
Characterization
For the UV-degradation measurement, the cells were continuously exposed to light, in inert atmosphere (with <0.1 ppm H2O and <0.1 ppm O2) for a period of 2 hours while being kept at ∼295 K by actively cooling the samples. In contrast, for light intensity dependence measurement the cells, kept at ∼295 K, were exposed to light calibrated with a long-pass filter to one sun for a duration of 3 hours and the J–V sweeps were recorded with varying light intensity using a set of neutral density filters coupled with the long-pass filter.
For the single carrier devices, the spin-coated active layer films were first exposed to light for an hour at ∼295 K before the evaporation of the top contact electrodes. The J–V sweeps were obtained under dark only for single carrier devices and both under dark and illumination for the PSCs. The collected data are presented and discussed under results and discussion.
NMR probed UV-degradation
The BDT-unit monomer MR–O and MR–T solutions were prepared at very low concentration in a glovebox and put into air-tight/sealed NMR glass tubes under an inert atmosphere. The fresh solutions were then transferred from the glovebox into the NMR set-up, a computer-controlled Varian AMX 600 (600 MHz), where 1H NMR spectra were obtained and recorded. Next, the solutions were exposed to UV light (IntelliRay, Uvitron 600 W, shuttered UV floodlight, at 50% power) in steps of 10 minutes for 1 hour 40 minutes. 1H NMR spectra were measured and recorded after each 10 minute exposure to UV. Chemical shift values are reported in ppm with the solvent resonance as the internal standard.Conclusions
The aim of the present research was to examine the role played by the chemical structure of polymers in the UV stability of polymer:fullerene solar cells. Under exposure to light in an inert atmosphere, the alkylthienyl (R–T) solar cells degrade faster than the alkoxy (R–O) ones. In summary, the experiments confirmed that the observed degradation in the solar cells, upon exposure to light, is neither due to photobleaching, nor is the accelerated degradation of the R–T devices compared to the R–O ones due to the acidity of the PEDOT:PSS layer, nor is it due to Li diffusion into the active layer. This led us to ascribe the enhanced degradation of the former cells to their chemical structures, especially the alkylthienyl side chains. We showed that, when exposed to continuous sunlight radiation in an inert atmosphere, the hole currents of the R–T pristine polymer single carrier devices reduce more than the R–O ones. Similar observation was made for their electron currents when blended with [70]PCBM. Moreover, 1H NMR studies revealed a faster degradation mechanism for R–T polymer solar cells based on the monomer solution study. Furthermore, light intensity dependence of VOC also suggested a faster degradation mechanism for R–T polymers based on complete solar cell devices study. These findings enhance our understanding of the role played by the chemical structure of polymers in the stability of polymer:fullerene solar cells. These data suggest that stable organic solar cells can be achieved if more studies are done in this direction. Although it cannot be clearly said if F and O atoms are good agents for stability, this study seems to suggest so. However, more investigation on other polymers presenting the same characteristics may be needed before it is possible to draw a clear conclusion. At this stage, it is evident that alkoxy side chains polymers are better performers in general than the alkylthienyl ones of same backbone. These results combined with the above suggested studies would pave the way for new materials that yield efficient as well as stable organic solar cells.Finally, this study led us to the following observations:
– BDT-unit polymers degrade and so if used for solar cells there is a need to use long pass filters.
– The TT-units moieties had similar but little effect on the degradation of the polymers and
– the polymer degradation in the devices under illumination which is also observed in the reduction of the pristine hole currents does not always translate into loss in the hole current of the blends.
Acknowledgements
The work was funded by the Zernike Bonus Scheme Grant. N. Y. D. would like to thank Dr D. Bartesaghi, for useful discussions. We also acknowledge Arjen Kamp for technical support. This is a publication by the FOM Focus Group “Next Generation Organic Photovoltaics”, participating in the Dutch Institute for Fundamental Energy Research (DIFFER).References
- Heliatek, the future is light, http://www.heliatek.com/en/heliafilm/unique, accessed October 2016.
- G. Li, V. Shrotriya, J. Huang, Y. Yao, T. Moriarty, K. Emery and Y. Yang, Nat. Mater., 2005, 4, 864–868 CrossRef CAS.
- R. F. Service, Science, 2011, 332, 293 CrossRef CAS PubMed.
- J. You, C. C. Chen, Z. Hong, K. Yoshimura, K. Ohya, R. Xu, S. Ye, J. Gao, G. Li and Y. Yang, Adv. Mater., 2013, 25, 3973–3978 CrossRef CAS PubMed.
- M. A. Contreras, L. M. Mansfield, B. Egaas, J. Li, M. Romero, R. Noufi, E. Rudiger-voigt and W. Mannstadt, Prog. Photovoltaics, 2007, 15, 659–676 Search PubMed.
- A. R. Bin Mohd Yusoff, D. Kim, H. P. Kim, F. K. Shneider, W. J. da Silva and J. Jang, Energy Environ. Sci., 2015, 8, 303–316 CAS.
- J. You, L. Dou, K. Yoshimura, T. Kato, K. Ohya, T. Moriarty, K. Emery, C.-C. Chen, J. Gao, G. Li and Y. Yang, Nat. Commun., 2013, 4, 1446 CrossRef PubMed.
- Y. Liang, Z. Xu, J. Xia, S. T. Tsai, Y. Wu, G. Li, C. Ray and L. Yu, Adv. Mater., 2010, 22, 135–138 CrossRef PubMed.
- W. Zhao, L. Ye, S. Zhang, M. Sun and J. Hou, J. Mater. Chem. A, 2015, 3, 12723–12729 CAS.
- S. Zhang, L. Ye, W. Zhao, D. Liu, H. Yao and J. Hou, Macromolecules, 2014, 47, 4653–4659 CrossRef CAS.
- L. Huo, S. Zhang, X. Guo, F. Xu, Y. Li and J. Hou, Angew. Chem., Int. Ed., 2011, 50, 9697–9702 CrossRef CAS PubMed.
- L. Dou, Y. Liu, Z. Hong, G. Li and Y. Yang, Chem. Rev., 2015, 115, 12633–12665 CrossRef CAS PubMed.
- S. Zhang, L. Ye and J. Hou, Adv. Energy Mater., 2016, 6, 1502529 CrossRef.
- National Renewable Energy Laboratory (NREL), http://www.nrel.gov/pv/assets/images/efficiency_chart.jpg, accessed October 2016.
- A. Polman, M. Knight, E. C. Garnett, B. Ehrler and W. C. Sinke, Science, 2016, 352, 307 CrossRef CAS PubMed.
- S.-H. Liao, H.-J. Jhuo, P.-N. Yeh, Y.-S. Cheng, Y.-L. Li, Y.-H. Lee, S. Sharma and S.-A. Chen, Sci. Rep., 2014, 4–10 Search PubMed.
- Y. Liang, Z. Xu, J. Xia, S.-T. Tsai, Y. Wu, G. Li, C. Ray and L. Yu, Adv. Mater., 2010, 22, E135–E138 CrossRef CAS PubMed.
- S. H. Liao, H. J. Jhuo, Y. S. Cheng and S. A. Chen, Adv. Mater., 2013, 25, 4766–4771 CrossRef CAS PubMed.
- J. Huang, C. Z. Li, C. C. Chueh, S. Q. Liu, J. S. Yu and A. K. Y. Jen, Adv. Energy Mater., 2015, 5, 4–9 Search PubMed.
- C. Liu, K. Wang, X. Hu, Y. Yang, C.-H. Hsu, W. Zhang, S. Xiao, X. Gong and Y. Cao, ACS Appl. Mater. Interfaces, 2013, 5, 12163–12167 CAS.
- L. Ye, S. Zhang, W. Zhao, H. Yao and J. Hou, Chem. Mater., 2014, 26, 3603–3605 CrossRef CAS.
- H. Zhou, Y. Zhang, C. K. Mai, S. D. Collins, G. C. Bazan, T. Q. Nguyen and A. J. Heeger, Adv. Mater., 2015, 27, 1767–1773 CrossRef CAS PubMed.
- L. N. Inasaridze, A. I. Shames, I. V. Martynov, B. Li, A. V. Mumyatov, D. K. Susarova, E. A. Katz and P. A. Troshin, J. Mater. Chem. A, 2017, 8044–8050 CAS.
- A. I. Shames, L. N. Inasaridze, A. V. Akkuratov, A. E. Goryachev, E. A. Katz and P. A. Troshin, J. Mater. Chem. A, 2016, 4, 13166–13170 CAS.
- Y. W. Soon, H. Cho and J. Low, Chem. Commun., 2013, 49, 1291 RSC.
- S. Alem, S. Wakim, J. Lu, G. Robertson, J. Ding and Y. Tao, ACS Appl. Mater. Interfaces, 2012, 4, 2993–2998 CAS.
- J. Razzell-Hollis, J. Wade, W. C. Tsoi, Y. Soon, J. Durrant and J.-S. Kim, J. Mater. Chem. A, 2014, 2, 20189–20195 CAS.
- F. J. Lim, A. Krishnamoorthy and G. W. Ho, ACS Appl. Mater. Interfaces, 2015, 7, 12119–12127 CAS.
- F. Fungura, W. R. Lindemann, J. Shinar and R. Shinar, Adv. Energy Mater., 2016, 1601420 Search PubMed.
- L. A. Frolova, N. P. Piven, D. K. Susarova, A. V. Akkuratov, S. D. Babenko, P. A. Troshin, D. K. Susarova, N. P. Piven, A. V. Akkuratov, L. A. Frolova, M. S. Polinskaya, S. A. Ponomarenko and S. D. Babenko, Chem. Commun., 2015, 51, 2242–2244 RSC.
- W. Kim, J. K. Kim, E. Kim, T. K. Ahn, D. H. Wang and J. H. Park, J. Phys. Chem. C, 2015, 119, 5954–5961 CAS.
- S. Chambon, A. Rivaton, J. L. Gardette and M. Firon, Sol. Energy Mater. Sol. Cells, 2008, 92, 785–792 CrossRef CAS.
- H. Hintz, H. J. Egelhaaf, H. Peisert and T. Chassé, Polym. Degrad. Stab., 2010, 95, 818–825 CrossRef CAS.
- M. Manceau, A. Rivaton, J. L. Gardette, S. Guillerez and N. Lemaître, Polym. Degrad. Stab., 2009, 94, 898–907 CrossRef CAS.
- M. Manceau, M. Helgesen and F. C. Krebs, Polym. Degrad. Stab., 2010, 95, 2666–2669 CrossRef CAS.
- S. J. Lou, J. M. Szarko, T. Xu, L. Yu, T. J. Marks, X. Lin and L. X. Chen, J. Am. Chem. Soc., 2011, 133, 1–7 CrossRef PubMed.
- J. M. Szarko, J. Guo, Y. Liang, B. Lee, B. S. Rolczynski, J. Strzalka, T. Xu, S. Loser, T. J. Marks, L. Yu and L. X. Chen, Adv. Mater., 2010, 22, 5468–5472 CrossRef CAS PubMed.
- C. V. Hoven, X.-D. Dang, R. C. Coffin, J. Peet, T.-Q. Nguyen and G. C. Bazan, Adv. Mater., 2010, 22, E63–E66 CrossRef CAS PubMed.
- A. Zusan, B. Gieseking, M. Zerson, V. Dyakonov, R. Magerle and C. Deibel, Sci. Rep., 2015, 1–6 Search PubMed.
- S. J. Lou, J. M. Szarko, T. Xu, L. Yu, T. J. Marks and L. X. Chen, J. Am. Chem. Soc., 2011, 133, 20661–20663 CrossRef CAS PubMed.
- D. Bartesaghi, G. Ye, R. C. Chiechi and L. J. A. Koster, Adv. Energy Mater., 2016, 6, 1–9 Search PubMed.
- M. Manceau, E. Bundgaard, J. E. Carlé, O. Hagemann, M. Helgesen, R. Søndergaard, M. Jørgensen and F. C. Krebs, J. Mater. Chem., 2011, 21, 4132 RSC.
- S. A. Gevorgyan, M. V. Madsen, B. Roth, M. Corazza, M. Hösel, R. R. Søndergaard, M. Jørgensen and F. C. Krebs, Adv. Energy Mater., 2016, 6, 1–17 Search PubMed.
- Y. Sun, C. J. Takacs, S. R. Cowan, J. H. Seo, X. Gong, A. Roy and A. J. Heeger, Adv. Mater., 2011, 23, 2226–2230 CrossRef CAS PubMed.
- W. J. E. Beek, M. M. Wienk, M. Kemerink, X. Yang and R. A. J. Janssen, J. Phys. Chem. B, 2005, 109, 9505–9516 CrossRef CAS PubMed.
- G. Wang, T. Jiu, G. Tang, J. Li, P. Li, X. Song, F. Lu and J. Fang, ACS Sustainable Chem. Eng., 2014, 2, 1331–1337 CrossRef CAS.
- R. Steim, F. R. Kogler and C. J. Brabec, J. Mater. Chem., 2010, 20, 2499–2512 RSC.
- A. Garcia, G. C. Welch, E. L. Ratcliff, D. S. Ginley, G. C. Bazan and D. C. Olson, Adv. Mater., 2012, 24, 5368–5373 CrossRef CAS PubMed.
- M. O. Reese, A. J. Morfa, M. S. White, N. Kopidakis, S. E. Shaheen, G. Rumbles and D. S. Ginley, Sol. Energy Mater. Sol. Cells, 2008, 92, 746–752 CrossRef CAS.
- T. Xu and L. Yu, Mater. Today, 2014, 17, 11–15 CrossRef CAS.
- Z. He, C. Zhong, S. Su, M. Xu, H. Wu and Y. Cao, Nat. Photonics, 2012, 6, 593–597 CrossRef CAS.
- H. Neugebauer, C. Brabec, J. C. Hummelen and N. S. Sariciftci, Sol. Energy Mater. Sol. Cells, 2000, 61, 35–42 CrossRef CAS.
- A. Distler, P. Kutka, T. Sauermann, H. J. Egelhaaf, D. M. Guldi, D. Di Nuzzo, S. C. J. Meskers and R. A. J. Janssen, Chem. Mater., 2012, 24, 4397–4405 CrossRef CAS.
- C. J. Brabec, G. Zerza, G. Cerullo, S. De Silvestri, S. Luzzati, J. C. Hummelen and S. Sariciftci, Chem. Phys. Lett., 2001, 340, 232–236 CrossRef CAS.
- M. O. Reese, A. M. Nardes, B. L. Rupert, R. E. Larsen, D. C. Olson, M. T. Lloyd, S. E. Shaheen, D. S. Ginley, G. Rumbles and N. Kopidakis, Adv. Funct. Mater., 2010, 20, 3476–3483 CrossRef CAS.
- L. J. A. Koster, V. D. Mihailetchi, R. Ramaker and P. W. M. Blom, Appl. Phys. Lett., 2005, 86, 1–3 CrossRef.
- M. M. Mandoc, F. B. Kooistra, J. C. Hummelen, B. De Boer and P. W. M. Blom, Appl. Phys. Lett., 2007, 91, 2007–2009 Search PubMed.
- J. M. Kroon, M. M. Wienk, W. J. H. Verhees and J. C. Hummelen, Thin Solid Films, 2002, 403–404, 223–228 CrossRef CAS.
Footnote |
| † Electronic supplementary information (ESI) available: On the Energy and Environmental Science website. See DOI: 10.1039/c7tc01455d |
| This journal is © The Royal Society of Chemistry 2017 |