 Open Access Article
Creative Commons Attribution 3.0 Unported Licence
Red green blue emissive lead sulfide quantum dots: heterogeneous synthesis and applications†
Bo
Hou
 a,
Yuljae
Cho
a,
Byung-Sung
Kim
a,
Docheon
Ahn
b,
Sanghyo
Lee
a,
Jong Bae
Park
c,
Young-Woo
Lee
a,
John
Hong
a,
Yuljae
Cho
a,
Byung-Sung
Kim
a,
Docheon
Ahn
b,
Sanghyo
Lee
a,
Jong Bae
Park
c,
Young-Woo
Lee
a,
John
Hong
 a,
Hyunsik
Im
d,
Stephen M.
Morris
a,
Jung Inn
Sohn
*a,
SeungNam
Cha
a,
Hyunsik
Im
d,
Stephen M.
Morris
a,
Jung Inn
Sohn
*a,
SeungNam
Cha
 *a and
Jong Min
Kim
e
aDepartment of Engineering Science, University of Oxford, Parks Road, Oxford OX1 3PJ, UK. E-mail: junginn.sohn@eng.ox.ac.uk; seungnam.cha@eng.ox.ac.uk
bBeamline Department, Pohang Accelerator Laboratory, Pohang 790-784, Republic of Korea
cJeonju Centre, Korea Basic Science Institute, Jeonju, Jeollabuk-do 54907, Republic of Korea
dDivision of Physics and Semiconductor Science, Dongguk University, Seoul 100-715, Republic of Korea
eDepartment of Engineering, University of Cambridge, 9 JJ Thomson Avenue, Cambridge CB3 0FA, UK
First published on 23rd March 2017
Abstract
Visible emission colloidal quantum dots (QDs) have shown promise in optical and optoelectronic applications. These QDs are typically composed of relatively expensive elements in the form of indium, cadmium, and gallium since alternative candidate materials exhibiting similar properties are yet to be realized. Herein, for the first time, we report red green blue (RGB) photoluminescences with quantum yields of 18% from earth-abundant lead sulfide (PbS) QDs. The visible emissive property is mainly attributed to a high degree of crystallinity even for the extremely small QD sizes (1–3 nm), which is realized by employing a heterogeneous reaction methodology at high growth temperatures (>170 °C). We demonstrate that the proposed heterogeneous synthetic method can be extended to the synthesis of other metal chalcogenide QDs, such as zinc sulfide and zinc selenide, which are promising for future industrial applications. More importantly, benefiting from the enlarged band gaps, the as-prepared PbS solar cells show an impressive open circuit voltage (∼0.8 V) beyond that reported to date.
Introduction
Colloidal Quantum Dots (QDs) have attracted considerable attention from the scientific communities due to their outstanding photophysical properties.1–5 Currently, the need for visible emission QDs has increased dramatically, mainly due to their deployments in commercial applications such as image sensors, solar cells (QDSCs) and displays.5–7 However, at present, RGB emissions can only be realized from expensive cadmium, indium or gallium QDs which impede their long-term sustainability.5 Earth-abundant lead sulfide (PbS) QDs are generally considered as promising materials for QDSCs.2,4,5 Recently, there has been a high demand for producing wider band gap PbS QDs to increase the photovoltage of the cell and compensate for the troublesome open circuit voltage (Voc) deficiency.8–11 Theoretically, by decreasing the size of the QD, the band gap of PbS can be expanded from 0.4 eV to more than 3 eV.12–14 However, due to the limitations of the fabrication techniques, PbS QDs are still absent from visible light emissions.5,6 ‘Hot-Injection’ is undoubtedly the best method for producing high-quality QDs that has been reported to date.6,15 The merits of this approach are the ability to combine ‘nucleation’ and ‘growth’, which generates QDs with a high degree of crystallinity and narrow size distributions.15,16 Commonly used organochalcogen compounds are activated by coordination to Lewis acidic metal centers, or spontaneously generating vigorous hydrogen chalcogen (i.e. thiols, chalcogen radicals, or H2S) species, which are highly reactive to metal precursors.15,16 Indeed, the PbS reaction equilibrium constant (e.g. Pb2+ + H2S) can reach up to 3 × 10⁶ M in the literature.17 While these intense reactions are beneficial for fast nucleation and growth through the ‘hot-injection’ process,16 they are prohibitive in terms of producing extremely small size PbS QDs and thus band gaps above 1.6 eV.5,17–19Herein, by controlling the reactivity of the precursors, we have successfully synthesized emissive PbS QDs that cover the whole visible spectrum. We highlight the generality of this method by applying it to other materials. Furthermore, by employing as-prepared wide band gap PbS QDs, we demonstrate an outstanding open circuit voltage (Voc) improvement in p–n junction QDSCs.
Results and discussion
In order to achieve such a wide band gap domains one would have to interrupt the nanoparticle growth process.11,18 The primary idea underlying the synthesis of the wide band gap PbS QDs is to control the kinetic reaction activity of the precursors.20 (i) The oleic acid (OA) concentration is limited to a quantity barely sufficient to achieve particle stabilization (e.g. OA![[thin space (1/6-em)]](https://www.rsc.org/images/entities/char_2009.gif) :
:![[thin space (1/6-em)]](https://www.rsc.org/images/entities/char_2009.gif) Pb
Pb![[thin space (1/6-em)]](https://www.rsc.org/images/entities/char_2009.gif) :
:![[thin space (1/6-em)]](https://www.rsc.org/images/entities/char_2009.gif) S = 4
S = 4![[thin space (1/6-em)]](https://www.rsc.org/images/entities/char_2009.gif) :
:![[thin space (1/6-em)]](https://www.rsc.org/images/entities/char_2009.gif) 2
2![[thin space (1/6-em)]](https://www.rsc.org/images/entities/char_2009.gif) :
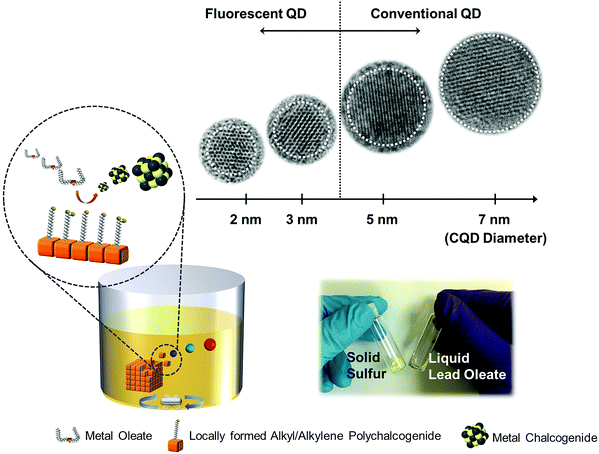
:![[thin space (1/6-em)]](https://www.rsc.org/images/entities/char_2009.gif) 1).4,18 Under these conditions, the monomer reactivity increases and the nucleation provides a very large number of small PbS nuclei that grow slowly.4,18 (ii) Alkyl or alkylene polysulfides, which are generated from the solubilization of sulphur (S) in the octadecene (ODE), have been demonstrated to have much lower activities toward metal counterparts.21–24 Instead of the commonly used liquid organochalcogen compounds,20 solid state (S) is employed as the S source and lead oleate dispersed ODE is employed as the Pb source. (iii) Unlike ‘hot-injection’ or hydrothermal approaches that have been used to produce small-sized QDs or magic-sized clusters at low temperatures11,21,25–29 (a detailed comparison is listed in Table S1 in the ESI†), we employ a high reaction temperature (>170 °C) through using sparingly soluble solid S flakes as the precursor to achieve these emissive PbS QDs. A high-temperature reaction is beneficial for producing QDs with a high crystal quality,15,29 and thus realizing visible photoluminescence (PL). Fourier transform infrared spectroscopy reveals that depletion of the olefin moieties proceeds concomitantly with the elevation of the reaction temperature, which indicates the on-site formation of the alkyl or alkylene polysulfide (SII, Fig. S1 and Scheme S1, ESI†). Due to the sulfur bond enthalpy that enables bond-breaking above 150 °C,23,24 no detectable reaction appeared to take place below 150 °C, and visible emission PbS QDs can only be formed when the reaction occurs above 170 °C. As illustrated in Scheme 1, by using this liquid and solid heterogeneous reaction methodology, we have successfully controlled the reaction between the metal and the chalcogen precursors at high temperatures, which enable the synthesis of extremely small size PbS QDs with a high degree of crystallinity (ESI† and Table S1).
1).4,18 Under these conditions, the monomer reactivity increases and the nucleation provides a very large number of small PbS nuclei that grow slowly.4,18 (ii) Alkyl or alkylene polysulfides, which are generated from the solubilization of sulphur (S) in the octadecene (ODE), have been demonstrated to have much lower activities toward metal counterparts.21–24 Instead of the commonly used liquid organochalcogen compounds,20 solid state (S) is employed as the S source and lead oleate dispersed ODE is employed as the Pb source. (iii) Unlike ‘hot-injection’ or hydrothermal approaches that have been used to produce small-sized QDs or magic-sized clusters at low temperatures11,21,25–29 (a detailed comparison is listed in Table S1 in the ESI†), we employ a high reaction temperature (>170 °C) through using sparingly soluble solid S flakes as the precursor to achieve these emissive PbS QDs. A high-temperature reaction is beneficial for producing QDs with a high crystal quality,15,29 and thus realizing visible photoluminescence (PL). Fourier transform infrared spectroscopy reveals that depletion of the olefin moieties proceeds concomitantly with the elevation of the reaction temperature, which indicates the on-site formation of the alkyl or alkylene polysulfide (SII, Fig. S1 and Scheme S1, ESI†). Due to the sulfur bond enthalpy that enables bond-breaking above 150 °C,23,24 no detectable reaction appeared to take place below 150 °C, and visible emission PbS QDs can only be formed when the reaction occurs above 170 °C. As illustrated in Scheme 1, by using this liquid and solid heterogeneous reaction methodology, we have successfully controlled the reaction between the metal and the chalcogen precursors at high temperatures, which enable the synthesis of extremely small size PbS QDs with a high degree of crystallinity (ESI† and Table S1).
PbS QDs possess a large bulk exciton Bohr radius (20 nm),14 which can create an extremely strong quantum confinement that allows us to tune its band gap across the entire visible spectrum.11Fig. 1a (inset image) displays the as-prepared PbS QDs in different sizes, which are dispersed in toluene with blue to red emission under UV irradiation (λ = 365 nm). As anticipated in previous theoretical-based studies, the band gap increased and ultimately converged to the first allowed excited state (X → A) of the PbS molecule when the particle size decreases. The band gap approaches the value of the first allowed excited state (above 2 eV) at around 2 nm.13,14 The sizes of the as-prepared QDs are determined from transmission electron microscopy (TEM) measurement and also calculated from the X-ray diffraction pattern based on the Scherrer equation (SIII, Table S2, ESI†). As rationalized in Fig. 1a, our experimental values (size/band gap) are distributed around the first allowed excited state, which agrees well with previous theoretical and experimental results.12–14,30,31Fig. 1b–e shows the TEM images of the as-prepared QDs which exhibit quasi-spherical appearances. The diameter of these QDs is 1.9 ± 0.3 nm (blue), 2.5 ± 0.5 nm (yellow), 2.7 ± 0.4 nm (red) and 3.1 ± 0.1 nm (dark red) respectively. The size distributions of the fluorescent PbS QDs are determined from TEM size statistical analysis and it is found that deviations in size are less than 0.4 nm. The high crystallinity of these fluorescent PbS QDs is demonstrated by using various experimental techniques. Through high resolution TEM analysis (HRTEM, Fig. 1c–f), the clearly resolved lattice fringes of the {111}, {220}, {200} planes can be indexed which are close to the PbS bulk crystal values (PDF = 78-1057, d111 = 3.4 Å, d220 = 2.1 Å, d200 = 3.0 Å). High-resolution synchrotron XRD (SIII, Fig. S2, ESI†), selected-area electron diffraction (SAED) and additional high-resolution TEM images (SIII, Fig. S3, ESI†) further confirm the PbS rock-salt characteristics. Moreover, a uniform lead-rich stoichiometry is revealed from the quantized X-ray photoelectron spectroscopy analysis (SIV, Fig. S4 and Table S3, ESI†), which is consistent with the lead-rich nature for small sized PbS QDs.30,31
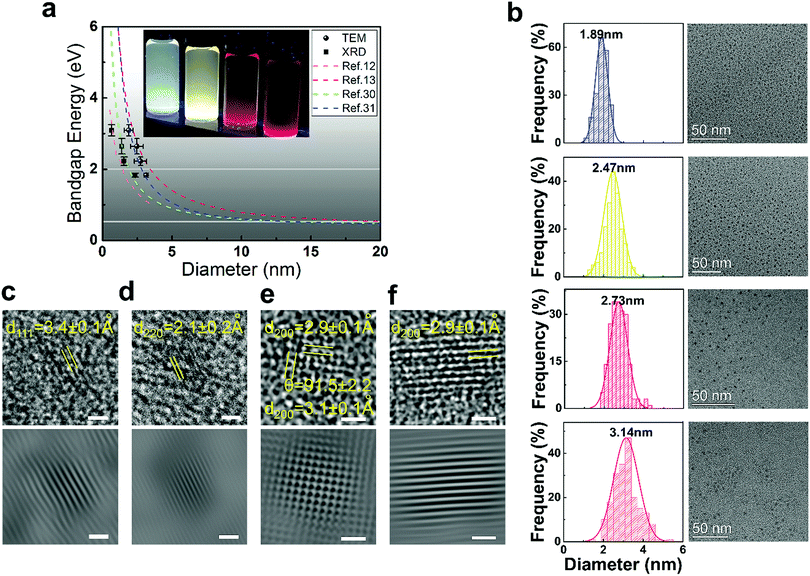 | ||
| Fig. 1 (a) The dashed lines represent the dependence of the band gap on the sizes of the PbS QDs that were calculated from the tight-binding model,12 the hyperbolic band model,13 and experimental empirical models.30,31 (●) and (■) represent current experimental data obtained from TEM and XRD analyses, and error bars are generated from the standard deviations obtained from the analysis. Horizontal lines highlight the 2 eV and 0.4 eV band gap energies. The inset image shows the PbS QDs dispersed in toluene under UV illumination (λ = 365 nm). (b) TEM images and the size distribution histogram analysis results for each QD. HRTEM images of the blue, yellow, red and dark red PL QD are shown in (c), (d), (e) and (f) respectively. Scale bars are 1 nm for the HRTEM image (top) and the inverse fast Fourier transform enhanced images (bottom). | ||
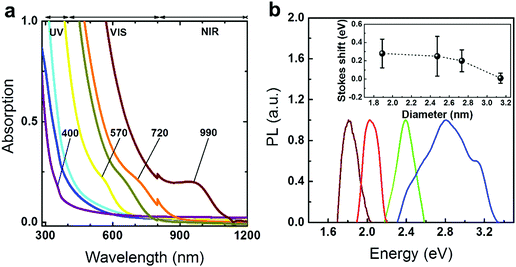
The optical band gaps extracted from the fabricated PbS QDs are determined from absorption spectroscopy as presented in Fig. 2a (Table S1, ESI†). These plots show that the absorption edge of the QDs can cover from the border of the ultraviolet (UV) to the near infrared (NIR) of the spectrum. In Fig. 2b, due to the good crystallinities and highly confined regimes, the ultra-small sized QDs show visible PL emission peaks compared to previous works (Table S1, ESI†).4,18–20,25,30,31 A comparison between the full width at half maximum (FWHM) values extracted from the PL spectra and TEM size distribution was performed (SV, Fig. S5, ESI†). The data suggest that the relatively broad PL peaks and Stokes shifts (inset of Fig. 2b) are attributed to the small exciton binding energies rather than the poly-dispersed size distribution.13,14 The quantum yields (ΦQY) of PbS QDs fabricated through conventional ‘hot-injection’ approaches are reported to range from 5% to 70%.32 However, the optical band gaps of these QDs mainly cover the NIR range (800–2000 nm).3,32 The prominent measurable PL emission enables us to quantify the visible emission properties through a quantum yield (ΦQY) analysis.3,33 By using Rhodamine B (in absolute ethanol) as a standard reference, the ΦQY of the PbS QDs is found to be as large as 18% (SV, Fig. S6 and Table S4, ESI†).
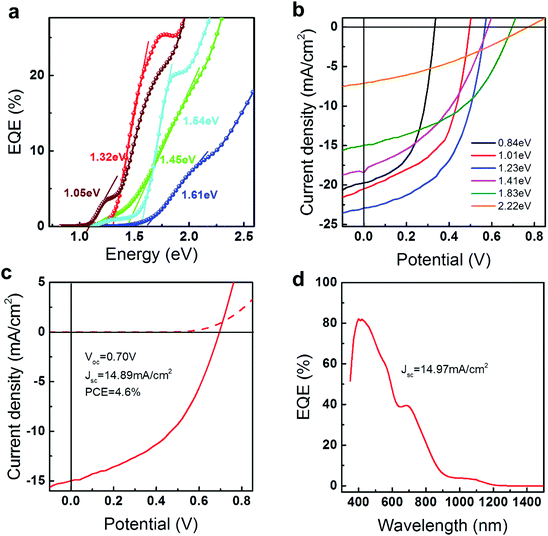
The remarkably large band gap can also be demonstrated by incorporating these QDs into current p–n junction QDSCs where they exhibit large improvements in the open circuit voltage (Voc, see details in the ESI† and SVI). Onsets of external quantum efficiency (EQE) curves are generally considered as references when comparing the measured Voc to the Shockley–Queisser limit.9 In the present work, EQE spectra and J–V curves are obtained under AM 1.5G (ASTM-G173-03) with a solar cell mask area of 0.012 cm2. Indeed, by applying the as-prepared PbS QDs in QDSCs, the EQE onset (Fig. 3a) can be enhanced to 1.61 eV which generates 0.8V Voc as measured from J–V curves (Fig. 3b). Fig. 3b exhibits six representative J–V curves from as-prepared PbS QDSCs. Accompanied by the changing of the band gap from 0.84 eV to 2.22 eV, perceptible increments in Voc can be resolved from the intersections at the abscissa axis. (Full range EQE spectra can be found in SVII, Fig. S9, ESI†) Ultraviolet photoelectron spectroscopy indicates that the enlarged band gaps increase the band offset between operation junctions, which contribute to the Voc improvement (SVI, Fig. S7 and S8, ESI†). For instance, 1.83 eV PbS QDSC exhibits a 0.71 V open circuit voltage with 4.6% efficiency, which is beyond previous reports under a similar operation junction.1,8 To ensure the validation of the measurement, a comparison of current densities extracted from the J–V curve and EQE spectrum integration is supplied. The JSC value, which is calculated by integrating the EQE spectra (14.97 mA cm−2) under AM1.5G solar irradiation, shows a good agreement with the measured JSC (14.89 mA cm−2, more details can be found in Fig. S10, ESI†). Comparisons between the as-measured Voc to the theoretical limits8,34 and other QD solar cells8,35–40 are summarized in Fig. 4 and Table S5 (ESI†). Benefiting from the enlarged band gaps, the as-prepared PbS QDSCs demonstrate outstanding Voc improvement compared to previous works. In spite of the promising performance in our QDSCs, there are still many parameters such as the current density and the fill factor that need to be optimized before catching up to the world’s leading efficiency devices. Taking 1.83 eV PbS QDSC as an example, our current density is much smaller than the theoretical limit, which suggests that there is a substantial potential for future developments on the wide band gap PbS in QDSCs. Specifically, we believe that optimizations of the QD ligand engineering or the operation junction such as applying them in cascaded or tandem QDSCs can improve the current density and the fill factor, which can lead to further improvements in QDSC efficiency.4,8,10,11,41
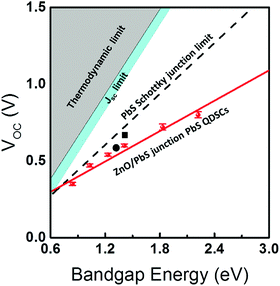 | ||
| Fig. 4 The limits of the Voc as a function of PbS QD band gaps:8,34 the thermodynamic limit (grey), the JSC limit (cyan), previously reported Schottky junction limit (black dash line), and a linear fit (red solid line) of measured Voc values (red symbols) from as-prepared PbS QDSCs which shows the possible Voc limit trend for the p–n junction solar cell. (■) and (●) represent current world-leading PbS QDSCs which are operated under a Schottky junction (Voc = 0.69 V, PCE = 1.4%) and a p–n junction (Voc = 0.61 V, PCE = 11.28%) respectively.8,35 | ||
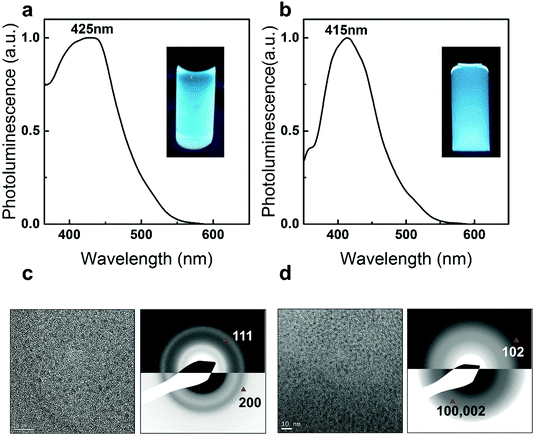
The applicability and the reproducibility of the proposed method are confirmed by fabricating Zn-based chalcogenide QDs. Owing to the heterogeneous reactivity control, Zn and chalcogenide precursors react slowly at an elevated temperature which results in highly luminescent blue emission ZnSe QDs (PL peaking at 425 nm, Fig. 5a) and ZnS QDs (PL peaking at 415 nm, Fig. 5b) with good crystallinity (Materials and method in ESI†). TEM analysis shows the sizes of the as-prepared ZnSe and ZnS to be 2.22 ± 0.4 nm (Fig. 5c) and 3.01 ± 0.46 nm (Fig. 5d), respectively. The Zinc Blende ZnSe and Wurtzite ZnS crystal structures are also identified through SAED analysis (see details in SVIII and Table S6, ESI†).22,42,43 In the right panel of Fig. 5c, two main reflections of 111, 200 can be indexed. The lattice constant, a, calculated from the average of each reflection is 5.55 ± 0.1 Å, which is consistent with its bulk value (5.618 Å, PDF = 80-0021). In the right panel of Fig. 5d, the 102 reflection is identified which confirms the hexagonal nature of the as-prepared ZnS QDs.44 The lattice constants calculated from the average of each reflection are a = 3.60 ± 0.1 Å and c = 6.24 ± 0.1 Å which are close to the bulk values (a = 3.77 Å, c = 6.188 Å, PDF = 80-0007). These promising and highly luminescent blue QDs demonstrate the potential for industrial applications and also motivate further studies on heterogeneous nanoparticle synthesis.5,22
Conclusion
In summary, for the first time, earth-abundant RGB emission PbS QDs have been synthesized by using a liquid and solid heterogeneous reaction methodology. We demonstrate the generality of this synthetic method by effectively producing other metal chalcogenide QDs with visible PL emission. By deploying fluorescent PbS QDs into QDSCs, prominent Voc improvements (0.8 V) have been achieved. These findings eventually bring PbS QDs into the visible emission QD family and also set a new Voc record for PbS QDSCs. It should encourage future works on their use in solar cell technologies as well as the enhancement of ΦQY for light emitting applications.Experimental section
Synthesis and purification of visible emissive PbS QDs
2.106 mmol PbO, 4.212 mmol oleic acid and 20 mL of ODE were loaded in a two neck flask. The solution was degassed at 100 °C in a vacuum for two hours. Subsequently, 1 mmol sulfur flakes were slowly added to the solution at room temperature under Ar. Different sizes of fluorescent PbS QDs were formed at elevated temperature (above 170 °C). QDs were purified using ethanol and recovered using hexane through a centrifugation process. The QDs were finally dispersed in toluene with a weight concentration of 50 mg mL−1 for device fabrication and characterization. A detailed description can be found in ref. 45 and in the ESI.†Solar cell fabrication and characterization
Acetone, ethanol, and 2-isopropanol were used to clean the patterned ITO. The ITO substrates were treated with oxygen plasma for 5 minutes before device fabrication. ZnO layers were formed by spin coating a solution of ZnO nanoparticles (50 mg mL−1) onto ITO substrates at 2000 rpm for 30 seconds. Then the ZnO films were annealed at 250 °C for 10 minutes on a hot plate. QD solution (50 mg mL−1) was spin casted onto the ZnO layer at 2000 rpm for 15 seconds. A tetrabutylammonium iodide (TBAI) solution (10 mg mL−1 in methanol) was then applied to the substrate for 30 seconds and then spun at 2000 rpm for 30 seconds, followed by two rinse-spin steps (30 seconds for each step) with methanol. For the 1,2-ethanedithiol (EDT) layers, an EDT solution (0.02% volume in acetonitrile) was applied to the substrate in a spin casting fashion, followed by acetonitrile washing twice. Au contact was thermally evaporated onto the films through shadow masks using an EDWARD thermal evaporator. The device areas were defined by applying pre-defined masks (0.012 cm2). J–V curves were recorded using a Keithley 2400 under simulated AM1.5 solar light illumination with a LOT Quantum Design simulator (LSE340/1/850.27C) for power conversion efficiency (PCE) calculation. The light intensity was calibrated with a RERA SOLUTIONS silicon reference cell (RQS4695) before each measurement. External quantum efficiency (EQE) measurement is performed by employing a SpeQuest QE system. The QE system has a 100 W Quartz Tungsten Halogen light as the photon source, equipped with a 150 mm F/4.2 monochromator, an SR830 DSP Lock-In Amplifier (locked to light chopped at 83 Hz) and a Melles Griot IV converter. The wavelength range is from 350 nm to 1800 nm and all the measurements are calibrated using a NIST traceable Silicon (200–1100 nm) reference cell and NIST traceable Germanium (700–1800 nm) with an area pre-defined mask (0.012 cm2).Author contribution
B. Hou and S. Cha carried out the experimental design, experiment and data analyses. Y. Cho, B. Kim, Y. Lee, and J. Hong carried out QDSC fabrication and characterisation. D. Ahn, S. Lee, J. Park and J. Sohn carried out the structural and optical analyses. H. Im, S. Morris, J. Sohn and J. Kim contributed to scientific discussion and provided experimental guidance. B. Hou and S. Cha wrote the manuscript and all the authors reviewed the manuscript.Acknowledgements
The research leading to these results has received funding from the European Research Council under ERC grant agreement number 340538 and European Commission Horizon2020 under grant agreement number 685758. The authors would also like to thank the financial support from the National Research Foundation (NRF) of Korea (2015M2A2A6A02045252).References
- C.-H. M. Chuang, P. R. Brown, V. Bulović and M. G. Bawendi, Nat. Mater., 2014, 13, 796 CrossRef CAS PubMed.
- X. Lan, O. Voznyy, A. Kiani, F. P. García de Arquer, A. S. Abbas, G.-H. Kim, M. Liu, Z. Yang, G. Walters, J. Xu, M. Yuan, Z. Ning, F. Fan, P. Kanjanaboos, I. Kramer, D. Zhitomirsky, P. Lee, A. Perelgut, S. Hoogland and E. H. Sargent, Adv. Mater., 2016, 28, 299 CrossRef CAS PubMed.
- U. Resch-Genger, M. Grabolle, S. Cavaliere-Jaricot, R. Nitschke and T. Nann, Nat. Methods, 2008, 5, 763 CrossRef CAS PubMed.
- B. Hou, Y. Cho, B. S. Kim, J. Hong, J. B. Park, S. J. Ahn, J. I. Sohn, S. Cha and J. M. Kim, ACS Energy Lett., 2016, 1, 834 CrossRef CAS PubMed.
- J. Q. Grim, L. Manna and I. Moreels, Chem. Soc. Rev., 2015, 44, 5897 RSC.
- G. Konstantatos and H. E. Sargent, Colloidal Quantum Dot Optoelectronics and Photovoltaics, Cambridge University Press, 2013 Search PubMed.
- T.-H. Kim, K.-S. Cho, E. K. Lee, S. J. Lee, J. Chae, J. W. Kim, D. H. Kim, J.-Y. Kwon, G. Amaratunga, S. Y. Lee, B. L. Choi, Y. Kuk, J. M. Kim and K. Kim, Nat. Photonics, 2011, 5, 176 CrossRef CAS.
- W. Yoon, J. E. Boercker, M. P. Lumb, D. Placencia, E. E. Foos and J. G. Tischler, Sci. Rep., 2013, 3, 2225 Search PubMed.
- C.-H. M. Chuang, A. Maurano, R. E. Brandt, G. W. Hwang, J. Jean, T. Buonassisi, V. Bulović and M. G. Bawendi, Nano Lett., 2015, 15, 3286 CrossRef CAS PubMed.
- G. Nair, L.-Y. Chang, S. M. Geyer and M. G. Bawendi, Nano Lett., 2011, 11, 2145 CrossRef CAS PubMed.
- W. Ma, S. L. Swisher, T. Ewers, J. Engel, V. E. Ferry, H. A. Atwater and A. P. Alivisatos, ACS Nano, 2011, 5, 8140 CrossRef CAS PubMed.
- R. S. Kane, R. E. Cohen and R. Silbey, J. Phys. Chem., 1996, 100, 7928 CrossRef CAS.
- Y. Wang, A. Suna, W. Mahler and R. Kasowski, J. Chem. Phys., 1987, 87, 7315 CrossRef CAS.
- F. W. Wise, Acc. Chem. Res., 2000, 33, 773 CrossRef CAS PubMed.
- C. B. Murray, D. J. Norris and M. G. Bawendi, J. Am. Chem. Soc., 1993, 115, 8706 CrossRef CAS.
- K. L. Sowers, B. Swartz and T. D. Krauss, Chem. Mater., 2013, 25, 1351 CrossRef CAS.
- D. R. Lide, CRC Handbook of Chemistry and Physics, Taylor & Francis, 85th edn, 2004 Search PubMed.
- M. A. Hines and G. D. Scholes, Adv. Mater., 2003, 15, 1844 CrossRef CAS.
- L. Cademartiri, J. Bertolotti, R. Sapienza, D. S. Wiersma, G. von Freymann and G. A. Ozin, J. Phys. Chem. B, 2006, 110, 671 CrossRef CAS PubMed.
- M. P. Hendricks, M. P. Campos, G. T. Cleveland, I. Jen-La Plante and J. S. Owen, Science, 2015, 348, 1226 CrossRef CAS PubMed.
- B. Hou, D. Benito-Alifonso, R. Webster, D. Cherns, M. C. Galan and D. J. Fermin, J. Mater. Chem. A, 2014, 2, 6879 CAS.
- S. Flamee, M. Cirillo, S. Abe, K. De Nolf, R. Gomes, T. Aubert and Z. Hens, Chem. Mater., 2013, 25, 2476 CrossRef CAS.
- W. J. Chung, J. J. Griebel, E. T. Kim, H. Yoon, A. G. Simmonds, H. J. Ji, P. T. Dirlam, R. S. Glass, J. J. Wie, N. A. Nguyen, B. W. Guralnick, J. Park, A. Somogyi, P. Theato, M. E. Mackay, Y.-E. Sung, K. Char and J. Pyun, Nat. Chem., 2013, 5, 518 CrossRef CAS PubMed.
- W. J. Chung, A. G. Simmonds, J. J. Griebel, E. T. Kim, H. S. Suh, I.-B. Shim, R. S. Glass, D. A. Loy, P. Theato, Y.-E. Sung, K. Char and J. Pyun, Angew. Chem., Int. Ed., 2011, 50, 11409 CrossRef CAS PubMed.
- E. M. Miller, D. M. Kroupa, J. Zhang, P. Schulz, A. R. Marshall, A. Kahn, S. Lany, J. M. Luther, M. C. Beard, C. L. Perkins and J. van de Lagemaat, ACS Nano, 2016, 10, 3302 CrossRef CAS PubMed.
- T.-Y. Liu, M. Li, J. Ouyang, M. B. Zaman, R. Wang, X. Wu, C.-S. Yeh, Q. Lin, B. Yang and K. Yu, J. Phys. Chem. C, 2009, 113, 2301 CAS.
- A. L. Brazeau and N. D. Jones, J. Phys. Chem. C, 2009, 113, 20246 CAS.
- S. V. Kershaw, A. S. Susha and A. L. Rogach, Chem. Soc. Rev., 2013, 42, 3033 RSC.
- C. M. Evans, L. Guo, J. J. Peterson, S. Maccagnano-Zacher and T. D. Krauss, Nano Lett., 2008, 8, 2896 CrossRef CAS PubMed.
- I. Moreels, K. Lambert, D. Smeets, D. De Muynck, T. Nollet, J. C. Martins, F. Vanhaecke, A. Vantomme, C. Delerue, G. Allan and Z. Hens, ACS Nano, 2009, 3, 3023 CrossRef CAS PubMed.
- M. C. Weidman, M. E. Beck, R. S. Hoffman, F. Prins and W. A. Tisdale, ACS Nano, 2014, 8, 6363 CrossRef CAS PubMed.
- M. Greben, A. Fucikova and J. Valenta, J. Appl. Phys., 2015, 117, 144306 CrossRef.
- C. Würth, M. Grabolle, J. Pauli, M. Spieles and U. Resch-Genger, Nat. Protoc., 2013, 8, 1535 CrossRef PubMed.
- J. Nelson, The Physics of Solar Cells, Imperial College Press, 2003 Search PubMed.
- M. Liu, O. Voznyy, R. Sabatini, F. P. Garcia de Arquer, R. Munir, A. H. Balawi, X. Lan, F. Fan, G. Walters, A. R. Kirmani, S. Hoogland, F. Laquai, A. Amassian and E. H. Sargent, Nat. Mater., 2017, 16, 258 CrossRef CAS PubMed.
- J. Wang, I. Mora-Seró, Z. Pan, K. Zhao, H. Zhang, Y. Feng, G. Yang, X. Zhong and J. Bisquert, J. Am. Chem. Soc., 2013, 135, 15913 CrossRef CAS PubMed.
- Z. Pan, I. Mora-Seró, Q. Shen, H. Zhang, Y. Li, K. Zhao, J. Wang, X. Zhong and J. Bisquert, J. Am. Chem. Soc., 2014, 136, 9203 CrossRef CAS PubMed.
- Y. Cao, M. S. Denny, J. V. Caspar, W. E. Farneth, Q. Guo, A. S. Ionkin, L. K. Johnson, M. Lu, I. Malajovich, D. Radu, H. D. Rosenfeld, K. R. Choudhury and W. Wu, J. Am. Chem. Soc., 2012, 134, 15644 CrossRef CAS PubMed.
- M. A. Green, K. Emery, Y. Hishikawa, W. Warta and E. D. Dunlop, Prog. Photovoltaics, 2014, 22, 701 Search PubMed.
- J. Wang, Y. Li, Q. Shen, T. Izuishi, Z. Pan, K. Zhao and X. Zhong, J. Mater. Chem. A, 2016, 4, 877 CAS.
- X. Wang, G. I. Koleilat, J. Tang, H. Liu, I. J. Kramer, R. Debnath, L. Brzozowski, D. A. R. Barkhouse, L. Levina, S. Hoogland and E. H. Sargent, Nat. Photonics, 2011, 5, 480 CrossRef CAS.
- L. S. Li, N. Pradhan, Y. Wang and X. Peng, Nano Lett., 2004, 4, 2261 CrossRef CAS.
- B. Hou, Y. Li, Y. Liu, B. Yuan, M. Jia and F. Jiang, CrystEngComm, 2009, 11, 1789 RSC.
- B. Hou, D. Parker, G. P. Kissling, J. A. Jones, D. Cherns and D. J. Fermín, J. Phys. Chem. C, 2013, 117, 6814 CAS.
- B. Hou and S. Cha, UK pat., 1613014.8, 2016 Search PubMed.
Footnote |
| † Electronic supplementary information (ESI) available. See DOI: 10.1039/c7tc00576h |
| This journal is © The Royal Society of Chemistry 2017 |

