 Open Access Article
Temperature-insensitive electro-optic response of polymer-stabilized blue phases
Gaby
Nordendorf
a,
Jürgen
Schmidtke
 a,
David
Wilkes
b and
Heinz
Kitzerow
 *a
*a
aFaculty of Science, University of Paderborn, Warburger Str. 100, 33098 Paderborn, Germany. E-mail: Heinz.Kitzerow@upb.de
bMerck KGaA Division Performance Materials BU Liquid Crystals – Research & Development, Frankfurter Str. 250, 64293 Darmstadt, Germany
First published on 15th December 2016
Abstract
Polymer-stabilized blue phases (PSBP) – promising candidates for developing a new generation of advanced liquid crystal displays – still suffer from the temperature dependence of the operation voltage. Here, two non-mesogenic cross-linkers were found to induce different signs of the temperature coefficient. Combining these cross-linkers results in a nearly temperature-independent operation voltage, which makes application feasable.
The development of liquid crystals (LCs) and liquid crystal displays (LCDs) over the last few decades is a remarkable chain of scientific and economic successes. The application started with small monochrome displays for pocket calculators and digital watches in the early 1970s and yielded full-colour large area flat panel displays at the turn of the century. The discovery of the twisted nematic (TN) mode1,2 in 1970 paved the way for today's widespread application. In TN cells, a thin layer of a nematic liquid crystal is sandwiched between two parallel glass slides, which are covered by transparent electrodes. The preferred local alignment direction of the rod-like liquid crystal molecules shows a continuous twist by 90° from one substrate to the other owing to appropriate alignment layers. Consequently, the plane of linearly polarized light is rotated by 90° and the cell placed between two crossed linear polarizers shows maximum transmission. For positive dielectric anisotropy, the molecules align along the electric field direction under the influence of an applied voltage and the display appears dark. Based on similar principles, further LC switching modes, such as the super twisted nematic (STN) mode and other modifications have been developed. In spite of limited viewing angle and contrast ratio these normally bright LCDs were widely used and lead to a 14 inch full colour display in 1988.3 Shortly after the TN mode was discovered, vertical alignment (VA) mode4 (utilizing a nematic liquid crystal with negative dielectric anisotropy) and in-plane switching (IPS) mode5 (based on fields applied parallel to the substrate) were suggested. However, their commercial application became possible only in the 1990s,6,7 when liquid crystal mixtures and cells with adequate properties became available. Today, displays based on TN, VA and IPS mode are ubiquitous. However, there is a continuous demand for further improvements, which drives topical research on optimized cell designs and LC materials or new electro-optic effects.
Polymer-stabilized blue phases are candidates for a new generation of liquid crystal displays, which promise large areas, simplified manufacturing, large contrast ratio and high switching speed. Liquid crystalline blue phases (BPs) have a cubic superstructure with lattice constants typically in the sub-wavelength range. Therefore, they are optically isotropic. Placed between crossed polarizers, they appear dark in transmission without needing any alignment layer. At the same time, they show a very large field-induced birefringence owing to the parallel alignment and collective motion of neighbouring LC molecules in volumes much smaller than the cubic unit cell. For moderate electric field strength E, this field-induced birefringence Δn can be formally described as an electro-optic Kerr effect
| Δn = λKE2, | (1) |
 | (2) |
The investigated samples are based on the nematic liquid crystal mixture MDA-PB-3.16,22 Chirality was induced by adding 3.8% (by weight) of the chiral dopant R5011.16,22 For stabilization, 12% reactive monomers and 0.2% of the photo-initiator IRG 651 (Ciba-Geigy) were added.16,22 Except for the photo-initiator, the compounds were provided by Merck KGaA, Darmstadt (Germany) and have been described in previous publications.16,22 In this study, the mono-functional monomer BPRM-1 and the di-functional monomers hexanediol diacrylate (HDDA) and diethylene glycol dimethacrylate (DEGDMA) have been used. The exact content of the monomers in the different samples is given in Table 1. To distinguish the samples, they are named after the cross-linkers (HDDA or/and DEGDMA) used in combination with a number, which increases with increasing cross-linker concentration. Polymer-stabilization results from in-situ photo-polymerization (3 min, IUV-A = 3 mW cm−2) of the samples at a temperature 0.5 K above the cholesteric to blue phase transition.
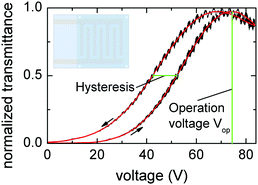
To measure the effective birefringence Δneff of the resulting PSBP samples, an in-plane switching (IPS) test cell (cf. inset in Fig. 1) was placed between crossed polarizers so that the electrode strips were aligned at an azimuthal angle of 45° with respect to both polarizers. By reorientation of the molecules in an electric field (1 kHz square wave) a bright state is induced (Fig. 1). The intensity I changes with increasing birefringence according to the relation
 | (3) |
In this work, in-plane switching cells (cell thickness d, electrode width w and electrode spacing s: d = w = s = 10 μm) were used and the Kerr coefficient at the wavelength λ = 542 nm (using a white light source and a colour filter) was determined assuming a homogeneous field distribution. Of course, the field distribution in IPS cells is not homogeneous so that this effective Kerr coefficient may deviate from the Kerr coefficient of the bulk liquid crystal material. However, the effective Kerr coefficient is of practical use for applications.
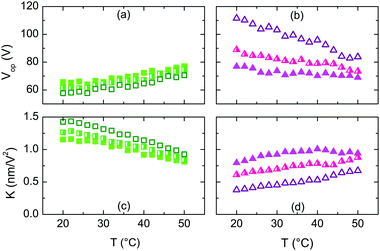
In general, samples containing the cross-linker HDDA [Fig. 2(a)] have a lower operation voltage than samples containing DEGDMA [Fig. 2(b)]. The operation voltage depends on the monomer mass fraction of the respective cross-linker. It increases with increasing amount of DEGDMA, while it decreases with increasing amount of HDDA. However, the absolute value of the slope increases for both kinds of samples with increasing amount of the cross-linker (Table 1). A low operation voltage corresponds to a larger Kerr coefficient and vice versa. A decreasing Kerr coefficient for HDDA [Fig. 2(c)] and an increasing Kerr coefficient for DEGDMA [Fig. 2(d)] are observed for increasing temperature. Here, the Kerr coefficient increases with increasing amount of HDDA and decreases with increasing amount of DEGDMA. Again, the absolute value of the slope increases with increasing amount of the cross-linker regardless of the cross-linker used (Table 1).
The different signs of the temperature dependence of samples containing HDDA and DEGDMA support the idea to combine these cross-linkers in order to create samples with reduced temperature dependence. To investigate whether compensation of the temperature dependences occurs, samples containing HDDA and DEGDMA in a 1![[thin space (1/6-em)]](https://www.rsc.org/images/entities/char_2009.gif) :
:![[thin space (1/6-em)]](https://www.rsc.org/images/entities/char_2009.gif) 1 ratio were prepared for three monomer mass fractions, called HDDA + DEGDMA-1, -2 and -3, with the total monomer concentration (including the BPRM-1) kept constant at 12% (cf.Table 1). The results for the first and the last mixture (with weight ratios of mono-/difunctional monomers 3
1 ratio were prepared for three monomer mass fractions, called HDDA + DEGDMA-1, -2 and -3, with the total monomer concentration (including the BPRM-1) kept constant at 12% (cf.Table 1). The results for the first and the last mixture (with weight ratios of mono-/difunctional monomers 3![[thin space (1/6-em)]](https://www.rsc.org/images/entities/char_2009.gif) :
:![[thin space (1/6-em)]](https://www.rsc.org/images/entities/char_2009.gif) 2 and 2
2 and 2![[thin space (1/6-em)]](https://www.rsc.org/images/entities/char_2009.gif) :
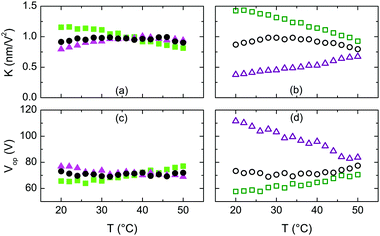
:![[thin space (1/6-em)]](https://www.rsc.org/images/entities/char_2009.gif) 3, respectively) are shown in Fig. 3, where the Kerr coefficients [Fig. 3(a) and (b)] and the operation voltages [Fig. 3(c) and (d)] of HDDA-, DEGDEMA- and HDDA + DEGDEMA-samples with identical total monomer concentrations are directly compared. The temperature dependence of the combined samples (HDDA + DEGDMA) is significantly reduced compared to the HDDA and DEGDMA samples and the absolute values of the investigated parameters are between those of the samples with only one cross-linker. Because of the inverse trends of Kerr coefficient and operation voltage in combination with increasing temperature dependence for an increasing amount of HDDA and DEGDMA, the absolute values of Kerr coefficient and the operation voltage for all mixed samples are similar, K ≈ 1 nm V−2 and Vop ≈ 70 V, respectively. Surprisingly, for all investigated temperatures the operating voltage of the combined samples (HDDA + DEGDMA-3) is lower than the interpolated value (derived from the results for the pure HDDA- and DEGDEMA-mixtures). The temperature dependence of the investigated effects is most strongly reduced in sample HDDA + DEGDMA-1, where the operating voltage is, within the experimental error, virtually constant over a temperature range of at least 30 K [cf.Fig. 3(c)].
3, respectively) are shown in Fig. 3, where the Kerr coefficients [Fig. 3(a) and (b)] and the operation voltages [Fig. 3(c) and (d)] of HDDA-, DEGDEMA- and HDDA + DEGDEMA-samples with identical total monomer concentrations are directly compared. The temperature dependence of the combined samples (HDDA + DEGDMA) is significantly reduced compared to the HDDA and DEGDMA samples and the absolute values of the investigated parameters are between those of the samples with only one cross-linker. Because of the inverse trends of Kerr coefficient and operation voltage in combination with increasing temperature dependence for an increasing amount of HDDA and DEGDMA, the absolute values of Kerr coefficient and the operation voltage for all mixed samples are similar, K ≈ 1 nm V−2 and Vop ≈ 70 V, respectively. Surprisingly, for all investigated temperatures the operating voltage of the combined samples (HDDA + DEGDMA-3) is lower than the interpolated value (derived from the results for the pure HDDA- and DEGDEMA-mixtures). The temperature dependence of the investigated effects is most strongly reduced in sample HDDA + DEGDMA-1, where the operating voltage is, within the experimental error, virtually constant over a temperature range of at least 30 K [cf.Fig. 3(c)].
Conclusions
In summary, combination of two non-mesogenic cross-linkers, which yield different temperature coefficients of the Kerr coefficient, is found to result in significantly improved temperature-stability of the operation voltage. The Kerr coefficient K and its temperature dependence are known to depend on the birefringence Δn, the dielectric anisotropy Δε and the effective elastic coefficient k of the nematic liquid crystal component, and the induced helix pitch p,23–25K ∝ ΔnΔεk−1p2. In PSBP, also the polymer components influence these properties.10,22,26 The product ΔnΔεk−1 is expected to decrease with increasing temperature. Thus, the unusual positive temperature coefficient dK/dT in PSBP systems containing DEGDMA can most likely be attributed to an increase of the pitch p with increasing temperature in these systems. This interpretation may help to identify further monomers, which can be used for the temperature compensation method presented here.The temperature insensitivity is very important, because displays are typically controlled with temperature-independent addressing voltages. The independence on temperature will not only help to achieve reproducible grey scale, but also help to reduce a disturbing hysteresis: high contrast requires utilizing the full range of addressing voltages between V = 0 and V = Vop. However, applying voltages of V > Vop is known to cause hysteresis. Both the largest possible contrast and avoidance of hysteresis can be achieved owing to the reduced temperature dependence of Vop.
Acknowledgements
Financial support of this study by Merck KGaA (Darmstadt) is gratefully acknowledged.References
- M. Schadt and W. Helfrich, Appl. Phys. Lett., 1971, 18, 127 CrossRef CAS.
- J. L. Fergason, T. R. Taylor and T. B. Harsch, Electro-Technology, 1970, 85, 41 CAS.
- T. Nagayasu, T. Oketani, T. Hirobe, H. Kato, S. Mizushima, H. Take, K. Yano, M. Hijikigawa and I. Washizuka, A 14-in-diagonal full color a-Si TFT LCD, in Proc. Int. Display Research Conf., San Diego, CA, 1988, pp. 56–58 Search PubMed.
- F. J. Kahn, Appl. Phys. Lett., 1972, 20, 199 CrossRef CAS.
- R. A. Soref, Appl. Phys. Lett., 1973, 22, 165 CrossRef CAS.
- G. D. Baur, W. Fehrenbach, R. D. Kiefer, S. B. Weber and F. Windscheid, Pat. DE4000451 B4 2004 Search PubMed.
- D. Pauluth and K. Tarumi, J. Mater. Chem., 2004, 14, 1219 RSC.
- J. Yan, H.-C. Cheng, S. Gauza, Y. Li, M. Jiao, L. Rao and S.-T. Wu, Appl. Phys. Lett., 2010, 96, 071105 CrossRef.
- G. Heppke, H.-S. Kitzerow and M. Krumrey, Mol. Cryst. Liq. Cryst. Lett., 1985, 2(1–2), 59–65 CAS.
- H. Kikuchi, M. Yokota, Y. Hisakado, H. Yang and T. Kajiyama, Nat. Mater., 2002, 1, 64 CrossRef CAS PubMed.
- J. Yan, Z. Luo, S.-T. Wu, J.-W. Shiu, Y.-C. Lai, K.-L. Cheng, S.-H. Liu, P.-J. Hsieh and Y.-C. Tsai, Appl. Phys. Lett., 2013, 102, 011113 CrossRef.
- L. Rao, Z. Ge, S.-T. Wu and S. H. Lee, Appl. Phys. Lett., 2009, 95, 231101 CrossRef.
- Y. Chen, Y. Sun and G. Yang, Liq. Cryst., 2011, 38, 555 CrossRef CAS.
- L. Rao, J. Yan, S.-T. Wu, Y.-C. Lai, Y.-H. Chiu, H.-Y. Chen, C.-C. Liang, C.-M. Wu, P.-J. Hsieh, S.-H. Liu and K.-L. Cheng, J. Disp. Technol., 2011, 7, 627 CrossRef.
- P. Nayek, H. Jeong, S.-W. Kang, S. H. Lee, H.-S. Park, H. J. Lee, H. S. Kim and G.-D. Lee, J. Soc. Inf. Disp., 2012, 20, 318 CrossRef CAS.
- G. Nordendorf, A. Lorenz, A. Hoischen, J. Schmidtke, H. Kitzerow, D. Wilkes and M. Wittek, J. Appl. Phys., 2013, 114, 173104 CrossRef.
- Y. Liu, S. Xu, D. Xu, J. Yan, Y. Gao and S.-T. Wu, Liq. Cryst., 2014, 41, 1339 CrossRef CAS.
- Y. Chen, D. Xu, S.-T. Wu, S. Yamamoto and Y. Haseba, Appl. Phys. Lett., 2013, 102, 141116 CrossRef.
- C.-Y. Fan, H.-C. Jau, T.-H. Lin, F. C. Yu, T.-H. Huang, C. Liu and N. Sugiura, J. Disp. Technol., 2011, 7, 615 CrossRef CAS.
- L. Rao, J. Yan, S.-T. Wu, S.-I. Yamamoto and Y. Haseba, Appl. Phys. Lett., 2011, 98, 081109 CrossRef.
- F. Peng, Y. Chen, J. Yuan, H. Chen, S.-T. Wu and Y. Haseba, J. Mater. Chem. C, 2014, 2, 3597 RSC.
- G. Nordendorf, A. Hoischen, J. Schmidtke, D. Wilkes and H.-S. Kitzerow, Polym. Adv. Technol., 2014, 25, 1195 CrossRef CAS.
- P. R. Gerber, Mol. Cryst. Liq. Cryst., 1985, 116, 197 CrossRef CAS.
- L. Rao, J. Yan and S.-T. Wu, J. Soc. Inf. Disp., 2010, 18(11), 954 CrossRef CAS.
- H. Choi, H. Higuchi and H. Kikuchi, Soft Matter, 2011, 7(9), 4252 RSC.
- J. Yan and S.-T. Wu, J. Disp. Technol., 2011, 7(9), 490 CrossRef CAS.
| This journal is © The Royal Society of Chemistry 2017 |


![[square filled right]](https://www.rsc.org/images/entities/char_25e8.gif) ) and HDDA-3 (□) and (b and d) DEGDMA-1 (▲), DEGDMA-2 (
) and HDDA-3 (□) and (b and d) DEGDMA-1 (▲), DEGDMA-2 (![[up triangle filled right]](https://www.rsc.org/images/entities/char_25ee.gif) ) and DEGDMA-3 (△).
) and DEGDMA-3 (△).