A visible-light active catechol–metal oxide carbonaceous polymeric material for enhanced photocatalytic activity†
Received
6th September 2016
, Accepted 15th November 2016
First published on 16th November 2016
Abstract
Designing new materials for sustainable energy and environmental applications is one of the prime focuses in chemical science. Here, an unprecedented visible-light active catechol–TiO2 carbonaceous polymer based organic–inorganic hybrid material was synthesized by a photosynthetic route. The visible light induced (>400 nm) photosynthetic polymerization of catechol led to the formation of carbonaceous polymeric deposits on the surface of TiO2. The band gap energy of hybrids was shifted to the visible region by orbital hybridization between 3d(Ti) of TiO2 and 2p(O), π(C) of catechol. The Tauc plot clearly revealed that 1.0 wt% catechol–TiO2 carbonaceous polymer remarkably tailored the optical band gap of TiO2 from 3.1 eV to 1.9 eV. The synthesized hybrid materials were thoroughly characterized and their photocatalytic activity was evaluated towards toxic Cr(VI) to relatively less toxic Cr(III) reduction under visible light irradiation (>400 nm), and solar light-driven H2 production through water splitting. Very interestingly, the hybrid material showed 5- and 10-fold enhanced activity for photocatalytic Cr(VI) reduction and solar light-driven H2 production respectively compared with pure TiO2. Moreover, the hybrid materials showed enhanced stability during photocatalysis. Thus, the simple photosynthetic strategy for developing light harvesting organic–inorganic hybrid materials can open up potential applications in energy and environmental remediation.
1. Introduction
Inorganic–organic composites are promising materials for a variety of applications including photovoltaics, optoelectronics, heterogeneous catalysts, pharmaceutical, biomedical and cosmetic formulations, and photocatalysis.1–5 In particular, semiconductor metal oxide based organic–inorganic hybrid materials have received extensive interest in the field of photocatalysis and photovoltaics. Although various metal oxide organic–inorganic hybrids including TiO2, ZnO, CdSe, and PbS have been reported for photocatalytic H2 production, dye degradation, solar energy conversion etc.,6–8 TiO2-based hybrid materials have attracted great attention due to environmental viability with great chemical stability.9,10
Various synthetic procedures have been developed to synthesise organic–inorganic hybrid materials for several applications.11–14 Among them, photocatalytic surface induced polymerization of an organic linker represents an ideal strategy for the synthesis of stable organic–inorganic hybrids. A very few reports are known for surface induced polymerization on the metal oxide surface. For example, Wang and coworkers reported that a TiO2 surface attached styrene and methyl methacrylate monomer can be polymerized under UV-light irradiation.15 Recently, the conducting polythiophene-TiO2 organic–inorganic hybrid was developed by photopolymerization for solar cell applications.16 TiO2 surface adsorbed benzene and toluene were polymerized in the presence of light radiation.17,18 The proposed mechanism of photopolymerization involves the interaction of the photogenerated holes and electrons with the organic monomer and solvent molecules, respectively. It was also shown that an anionic initiation through photogenerated electron transfer to the monomer followed by free-radical propagation can lead to polymerization. However, we explored the polymerizable nature of catechol on a TiO2 surface under visible-light illumination. Previously, Sanchez et al. reported that the catechol polymerization reaction occurred on a Ag surface and formed a stable polymer coating with C–C bonds.19
Due to high complexation tendency of catechol with TiO2, it can be utilized as an organic linker for the preparation of a visible light active TiO2–catechol surface complex. Despite light harvesting, the problem with a surface attached organic linker in the surface complex is that it is highly unstable under the operating conditions for photocatalysis application studies20,21 and the surface attached or adsorbed organic linker can be leached out during photocatalysis. In this regard, the development of a stable light harvesting organic–inorganic metal oxide surface complex for vital photocatalytic applications is highly challenging. In the present study, we found that visible-light induced photopolymerization behavior of catechol on the TiO2 surface can effectively alter the band gap energy and also increase the stability of the organic–inorganic hybrid material. The resultant photo-polymerized catechol–TiO2 organic–inorganic hybrid material exhibits enhanced visible-light photocatalytic activity for the reduction of toxic Cr(VI) to Cr(III) and water splitting. In addition, a tentative mechanism was proposed for the photosynthetic polymerization of catechol on a metal oxide surface and its enhanced visible-light photocatalytic activity. We believe that the photopolymerizable nature of catechol on the TiO2 surface may find different applications in many other fields.
2. Experimental
2.1 Synthesis of mesoporous TiO2
The mesoporous TiO2 was synthesized by the sonochemical method.22 Briefly, 0.032 mol of titanium isopropoxide and 0.016 mol of acetic acid were dissolved in ethanol under stirring and maintained for 1 h. The resultant colloidal solution was added in drops to 100 ml de-ionized water under constant ultrasonication. Subsequently, the resultant suspension was sonicated for 3 h by a low-frequency ultrasonicator (3 s on, 1 s off with amplitude 35%) using a 13 mm high-intensity probe (Sonics and materials VCX 750, 20 kHz). Finally, the product was collected by centrifugation, washed with a series of solvents (ethanol, water) and dried at 100 °C. Finally, the as-obtained TiO2 powder was calcined at 400 °C for 1 hour.
2.2 Synthesis of the catechol–TiO2 surface complex
The catechol–TiO2 surface complex was synthesized by a facile condensation method at ambient temperature. In brief, 400 mg of TiO2 nanopowder was dispersed in 10 ml of acetone. Subsequently, calculated amounts of catechol dissolved in acetone were added in drops to the TiO2 solution under stirring conditions and maintained for 1 h. During stirring, the color of the reaction mixture turned to orange indicating the formation of the surface complex. Finally, the colored solid was collected by centrifugation and washed several times with acetone to remove the unreacted catechol and dried at 60 °C.
2.3 Photosynthetic polymerization of the catechol–TiO2 surface complex
0.5 g of the TiO2–catechol surface complex was placed in a Petri-dish and irradiated with 150 W visible light (>400 nm) for 6 h in an open atmosphere. A marked color change was observed from orange to dark brown post irradiation.
2.4 Photoelectrochemical studies
Photoelectrochemical studies were carried out with the conventional three-electrode system (CHI608E electrochemical workstation). Pt wire and Ag/AgCl (in saturated KCl) electrodes were used as counter and reference electrodes. A light source of 250 W Xe arc lamp (OSRAM, Germany) was used for photocurrent measurements. An aqueous solution of 0.1 M Na2SO4 served as the electrolyte. The working electrode was prepared by mixing 50 mg of the photocatalyst with 150 ml of PEG (mol. wt 400) and 125 ml of ethanol was used to make a slurry. Then it was coated on a 2.5 × 2.5 cm2 fluorine-doped tin oxide (FTO) glass substrate with an active area of about 1 × 1 cm2 by a doctor-blade method using scotch tape as the spacer and it was dried at 80 °C.23
2.5 Photocatalytic Cr(VI) reduction activity
The toxic hexavalent chromium was chosen as the pollutant to evaluate the photocatalytic reduction activity of the catechol–TiO2 carbonaceous polymer. Photocatalytic chromium(VI) reduction was carried out under 150 W visible light (>400 nm). In a typical procedure, 100 mg of the photocatalyst was added to 100 ml of 30 ppm chromium(VI) solution which was prepared from potassium dichromate crystals (K2Cr2O7). After the addition of the photocatalyst to chromium(VI) solution, it was stirred under dark conditions for 30 min to ensure the adsorption–desorption equilibrium. After stirring, the reaction mixture was irradiated with visible light. The light intensity was measured by a Lux meter and the intensity was ∼37![[thin space (1/6-em)]](https://www.rsc.org/images/entities/char_2009.gif) 000 Lux. During the photocatalytic reaction, every 5 min, a known volume of the sample was collected and the concentration of chromium(VI) was estimated colorimetrically at 540 nm by using diphenyl carbazide and a UV-Vis spectrometer (Specord 200 plus, Analytik Jena, Germany).
000 Lux. During the photocatalytic reaction, every 5 min, a known volume of the sample was collected and the concentration of chromium(VI) was estimated colorimetrically at 540 nm by using diphenyl carbazide and a UV-Vis spectrometer (Specord 200 plus, Analytik Jena, Germany).
2.6 Diphenyl carbazide assay for Cr(VI) estimation
At each end point, 1 ml of Cr(VI) was collected and mixed with 9 ml of 0.2 M H2SO4 in a 10 ml iodine flask. Subsequently, 0.2 ml of newly prepared 0.25% (w/v) DPC in acetone was added to the iodine flask. After 15–30 s of vortexing, the mixture was allowed to stand for 10–15 min to ensure the complete complex formation. After the complexation reaction, the color of Cr(VI) solution changed from red-violet to purple, and then it was measured through a 540 nm filter using a UV-Vis spectrophotometer.
2.7 Solar photocatalytic H2 production
The photocatalytic H2 production reaction was carried out under natural solar light irradiation. Typically, 1 mg per ml of catechol carbonaceous polymer–TiO2 was dispersed in 30 ml of 5% TEOA aqueous solution taken in a 100 ml quartz reactor. The reaction mixture was stirred under dark conditions for 30 min and evacuated for 30 min. Subsequently, N2 gas was purged for 30 min to remove the dissolved oxygen. The final reaction mixture was exposed to solar light and the produced gas was collected at constant time intervals. The generated H2 gas was analyzed by an off-line gas chromatograph with a TCD detector (Shimadzu GC-2014 with Molecular Sieve/5 Å column) using N2 as the carrier gas.
3. Characterization studies
The photosynthesized catechol–TiO2 carbonaceous polymer was characterized using the following spectroscopic techniques. The X-ray diffraction (XRD) patterns were recorded with a PANalyticalX'pert powder diffractometer using Cu-Ka radiation. The photoluminescence (PL) study was carried out with a HORIBA FLUORO LOG@3. The X-ray photoelectron spectrum (XPS) analysis was performed using a Shimadzu ESCA 3100. The morphological studies of the prepared photocatalysts were carried out by using Field Emission-Scanning Electron Microscopy (FEI Quanta FEG 200 HR-SEM). The bonding nature was analyzed by using Fourier transform infrared (FT-IR) spectroscopy (Perkin-Elmer-USA). The TEM images were obtained from MODEL-TECNIA F30 and Raman analysis was carried out using BRUKER RFS 27. The surface area, pore size, and pore volume of the material were determined by using a Quantachrome Nova-1000 surface analyzer.
4. Results and discussion
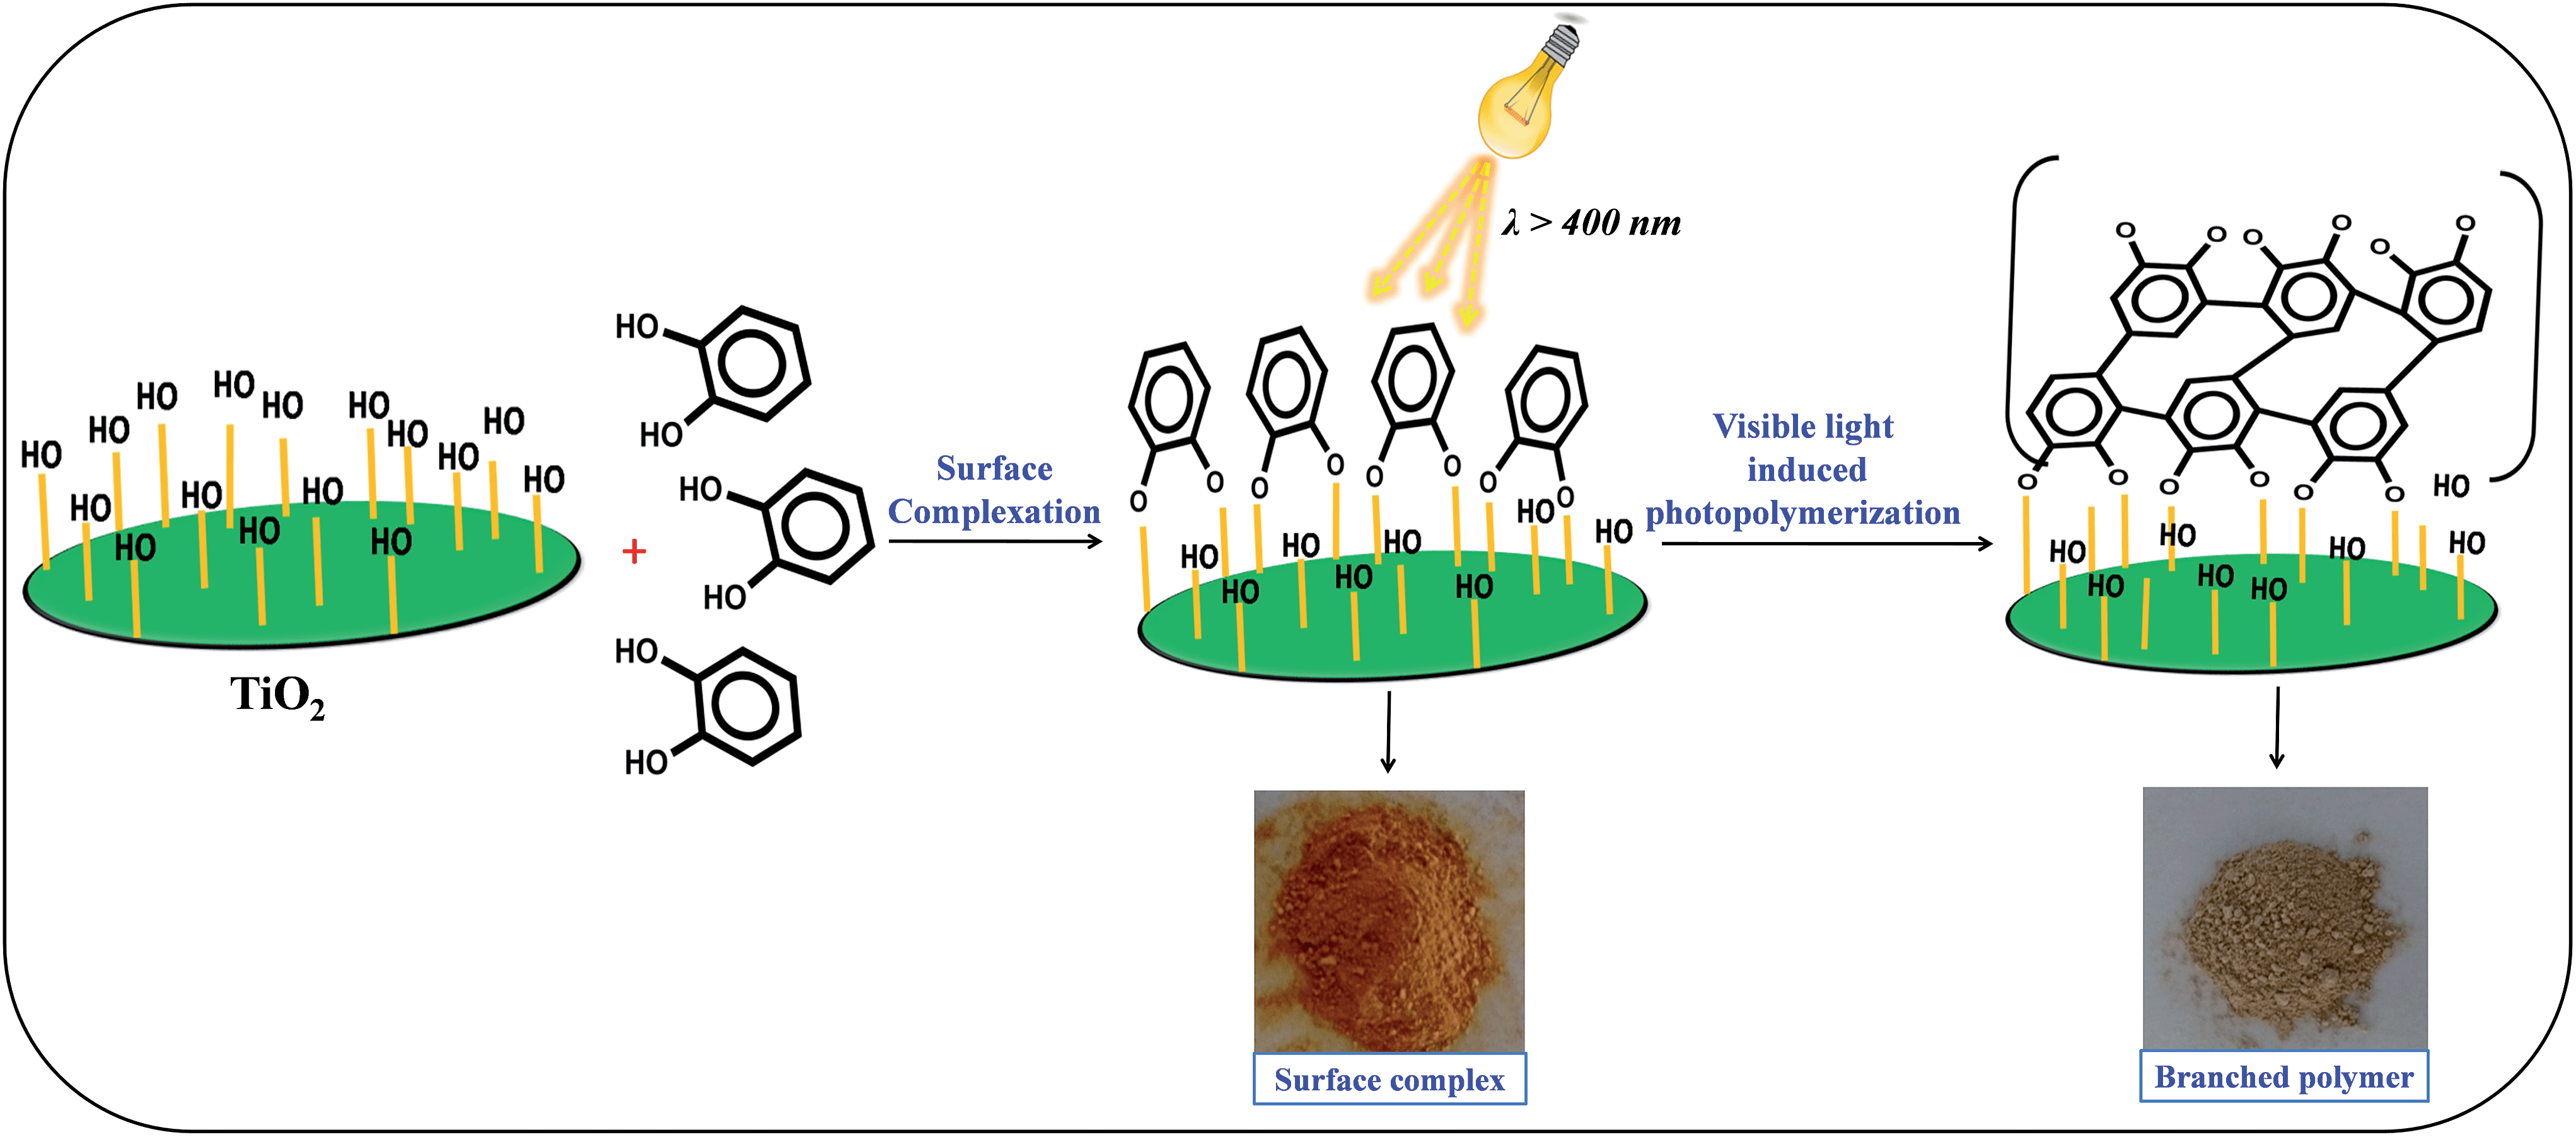
The photo-polymerization of the organic linker can be initiated by photo-excitation of TiO2 under visible light irradiation. It was observed that during the irradiation by UV light the color of the TiO2–benzene mixture changes from white to brown due to the UV light-induced polymerization.24,25 Similar to the previous report, we also observed a color change in the catechol–TiO2 surface complex from orange to brown post irradiation of visible light for 6 h (Fig. 1). This observation clearly suggests that the formation of brownish color is due to the deposition of the carbonaceous polymer on the TiO2 surface through aromatic ring cation radical polymerization.18Fig. 1 illustrates the schematic representation of surface complexation followed by visible light induced photopolymerization of the organic linker.
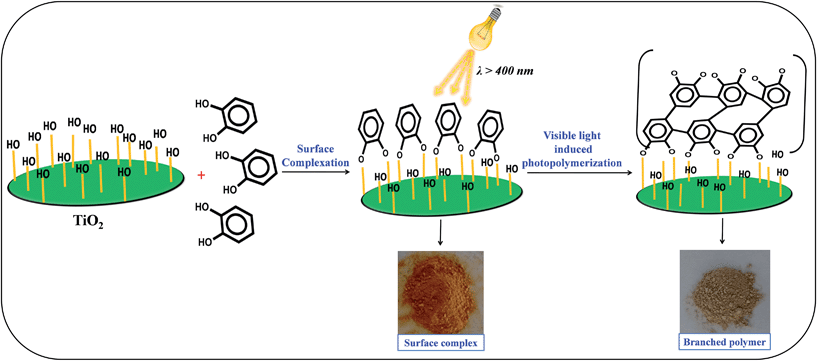 |
| | Fig. 1 Schematic illustration of visible light-induced surface photopolymerization of catechol on TiO2. | |
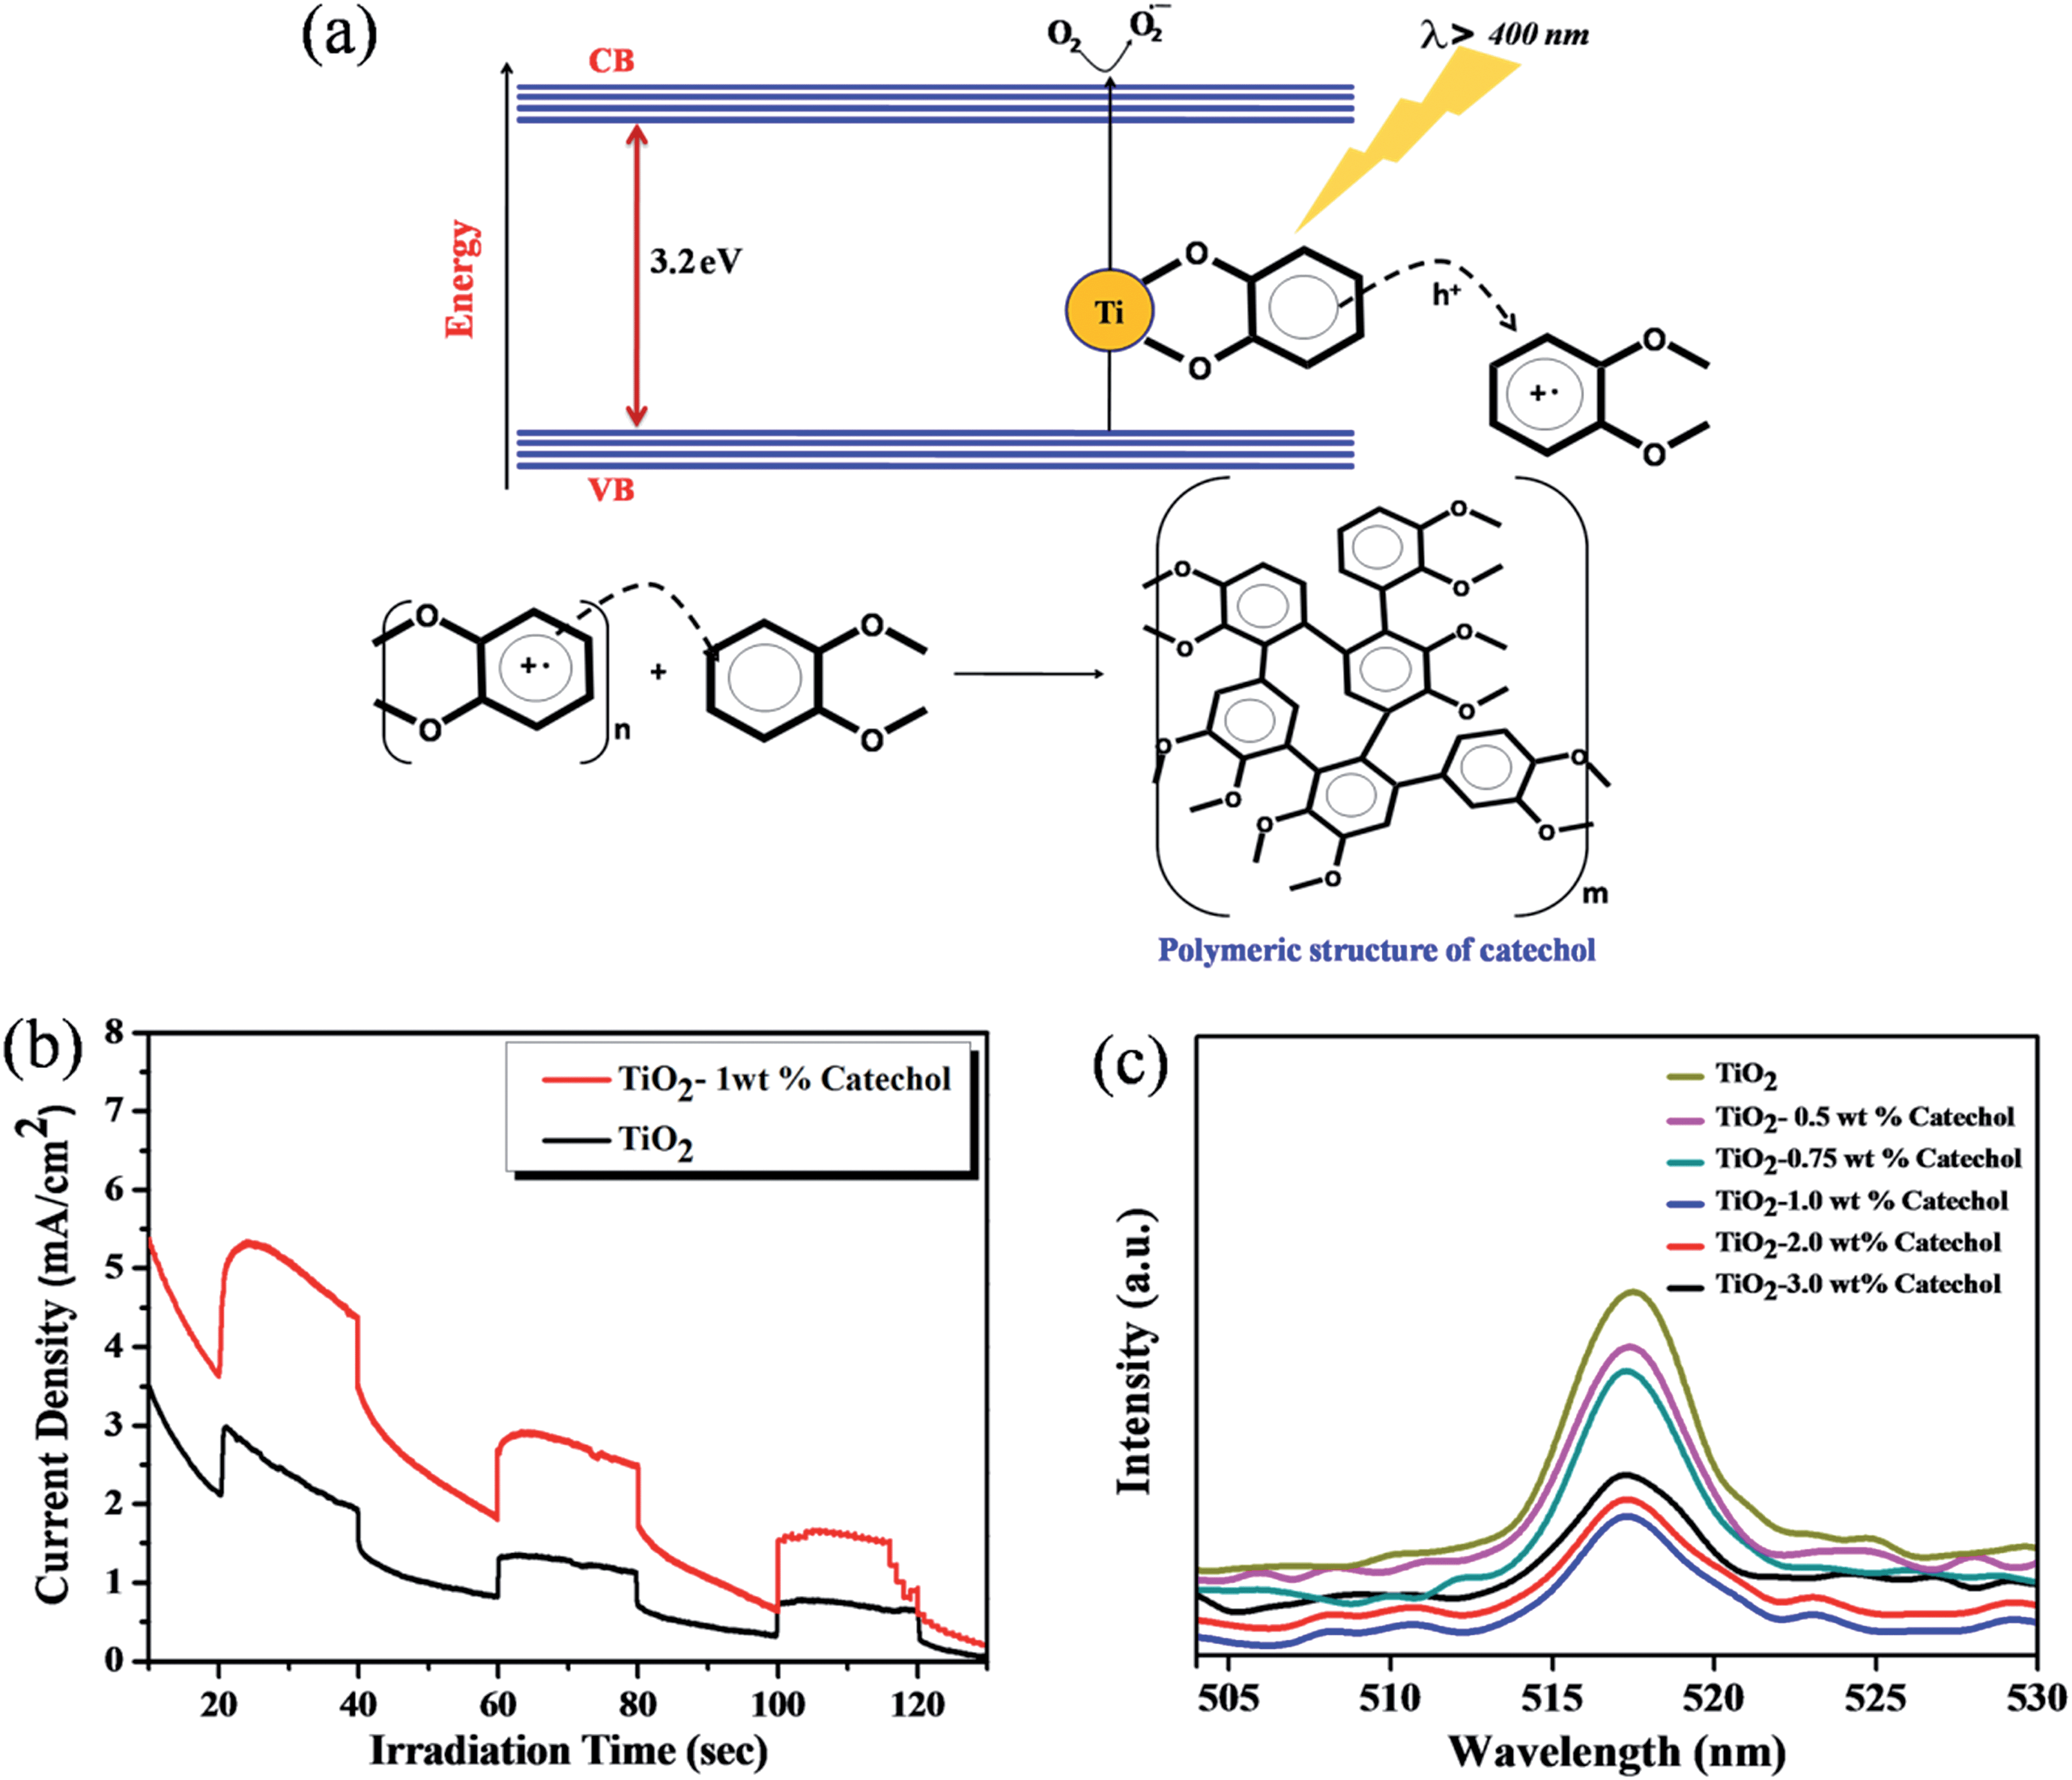
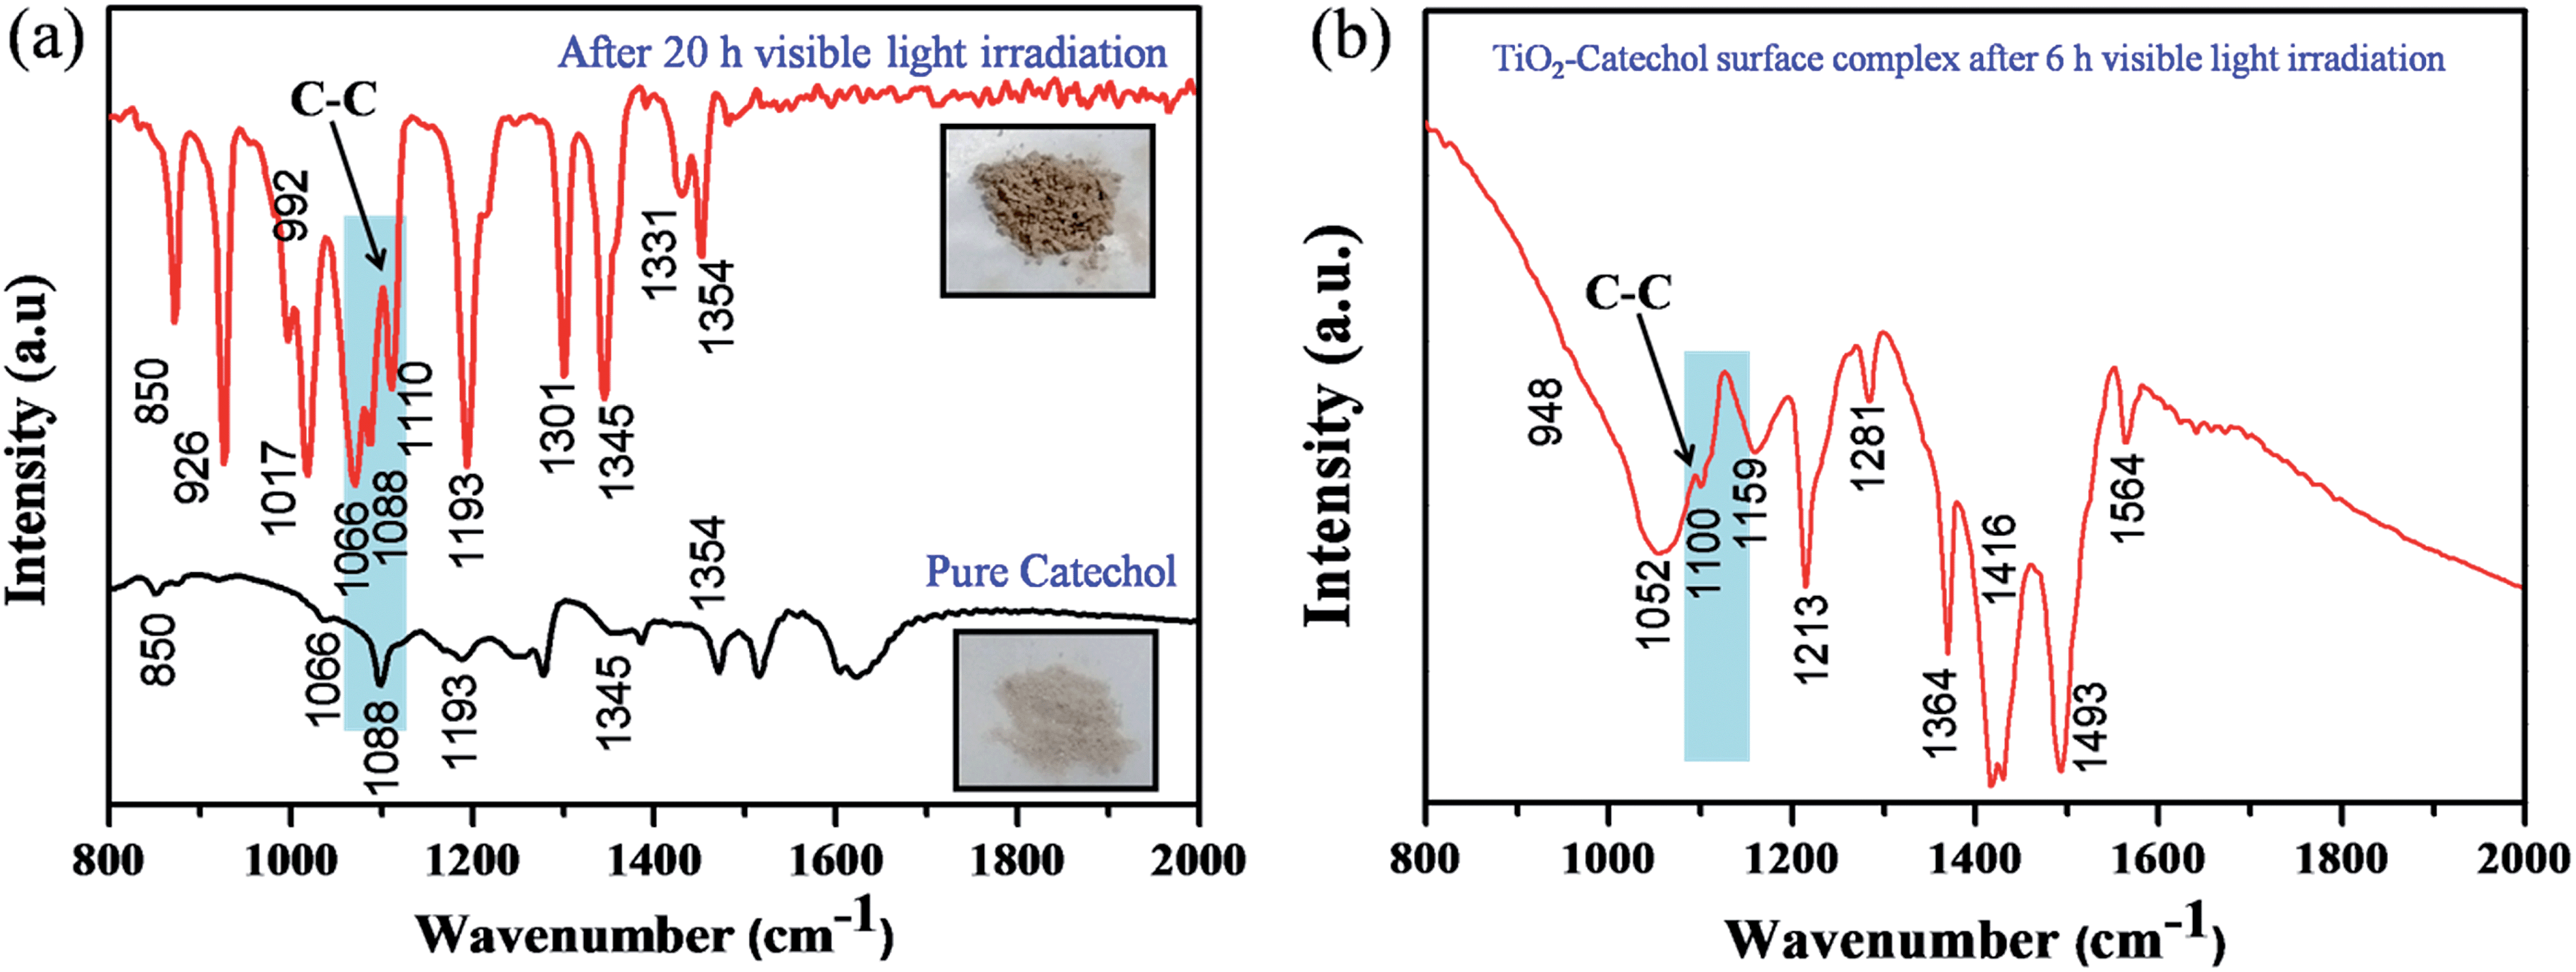
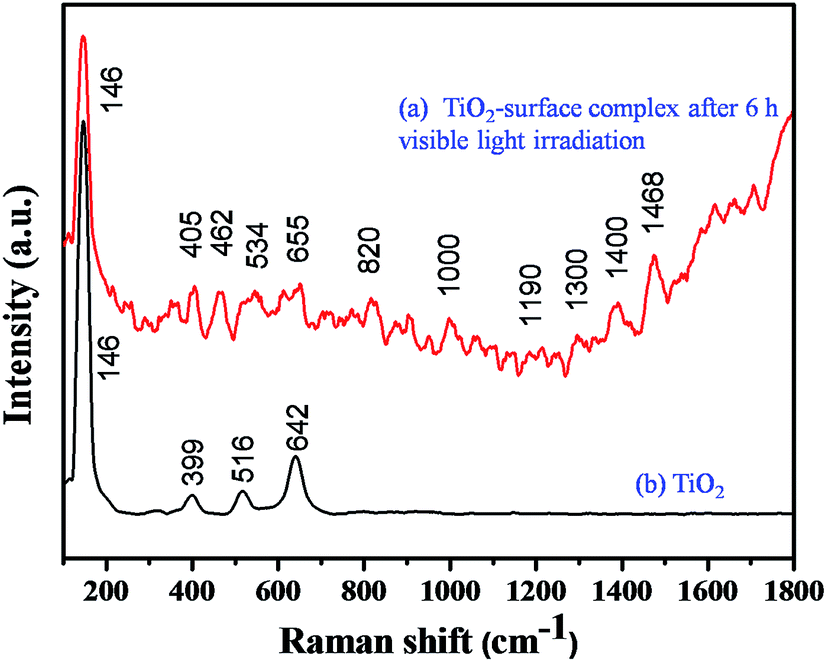
It is well known that TiO2 absorbs photons in the UV region and it can generate electron–hole pairs. However, it is interesting to note that the photopolymerization of catechol–TiO2 occurred in the visible region. We believe that visible-light induced polymerization is mainly due to ligand to metal charge transfer (LMCT) between catechol and TiO2. The plausible mechanism of photopolymerization of catechol is proposed based on the LMCT (Fig. 2a). During the visible light illumination, a weak LMCT occurred between the conduction band of TiO2 and surface attached catechol molecules, which generate electron–hole pairs and directly initiate the radical polymerization.18 The photo-generated holes further oxidize the phenyl ring of catechol and thereby produce aromatic cation radicals, whereas electrons are scavenged by oxygen and produce superoxide anions (O2−).15 In order to support the proposed mechanism of photopolymerization, the photocurrent measurement was carried out under visible light illumination. Fig. 2b shows the transient photocurrent response of TiO2 and catechol–TiO2 (1 wt%) photocatalysts. The catechol loaded TiO2 complex shows increased photocurrent response compared to pristine TiO2 under visible light illumination. This could be due to the assembly of catechol on the TiO2 surface which can act as a light sensitizer and result in the direct injection of electrons from the HOMO level of catechol to the conduction band of TiO2 leading to enhanced photocurrent response with the effective scavenging of photogenerated electrons by oxygen. In addition, the photoluminescence intensity of the 1 wt% catechol–TiO2 carbonaceous polymer is significantly quenched compared to others (0.5, 0.75, 2.0 and 3.0 wt%) as depicted in Fig. 2c. This result further strongly supports that the electron–hole pair recombination has been remarkably suppressed by the formation of superoxide anions O2−˙ during visible light illumination. The formation of superoxide anion (O2−˙) radicals was confirmed using nitroblue tetrazolium (NBT) assay (see Fig. S10†).26 The visible light induced photopolymerization reaction of catechol molecules and the TiO2–catechol surface complex was analyzed by FT-IR spectroscopy. The FT-IR spectra of pure catechol, 20 h visible light irradiated catechol and the TiO2–catechol surface complex irradiated with visible light for 6 h are displayed in Fig. 3. As shown in Fig. 3, the characteristic peaks of free catechol are as follows: the stretching vibrations of phenolic group ν(C–OH) appeared at 1345 cm−1 and 1300 cm−1 and the corresponding bending vibrations of the phenolic group δ(C–OH) appeared at 1193, 1088, and 1068 cm−1. The peaks appearing at 1615 cm−1 and 1467 cm−1 correspond to aromatic ν(C–H) and ν(C![[double bond, length as m-dash]](https://www.rsc.org/images/entities/char_e001.gif) C) stretching vibrations. Moreover, the FT-IR spectra of 20 h visible light irradiated catechol, exhibits a characteristic peak of ν(C–C) at 1110 cm−1 along with normal stretching and bending vibrations of catechol molecules.27,28 It is clearly demonstrated that the catechol molecules also undergo the polymerization reaction during visible light irradiation and form a stable carbonaceous polymer. In addition, the two new peaks appearing at 1017 and 926 cm−1 for 20 h visible light irradiated catechol are assigned to the C–H plane bending vibration of aromatic rings.29 On the other hand, no such FT-IR peaks related to the C–H plane bending vibration of aromatic rings are observed for pure catechol. This observation clearly suggested that during the photopolymerization process, the aromatic ring connects via the C–C bond and this bond formation leads to enhance the in-plane C–H bending vibration and reduce its ring strain. Thus, the enhanced in-plane bending vibration further supports the photopolymerization reaction and C–C bond formation. Similar phenomenon has been previously reported for poly aromatic rings.29 Similarly, the 6 h visible light irradiated TiO2–catechol surface complex also shows the ν(C–C) peak at 1110 cm−1. However, the peak appearing in the range of 1260–1280 cm−1 is mainly attributed to Ti–O–C bonding between TiO2 and catechol molecules.30–32 These observations confirmed that the radical polymerization of catechol is initiated by the TiO2 surface and the resultant carbonaceous polymer was strongly deposited over the TiO2 surface,21,33 thus leading to Ti–O–C bonding. The formation of the C–C bond was further analyzed by FT-Raman spectroscopy. Fig. 4 shows the Raman spectra of TiO2 and after the 6 h visible light irradiated TiO2–catechol surface complex. As illustrated in Fig. 4, the bands appeared in the range of 1150 to 1300 cm−1 and 930–1077 cm−1 correspond to C–O and C–H ring deformation vibrations of catechol molecules.34 The peaks appearing at 1468, and 1190 cm−1 are related to the aromatic CC ring vibration, and C–O–C bond, respectively. Importantly, the main peak at 1400 cm−1 is related to the C–C bond vibration.35,36 This C–C bond vibration peak confirms the formation of the polymeric structure during visible light illumination. Similar C–C bond vibration was observed by Goa et al. for polypyrrole.
C) stretching vibrations. Moreover, the FT-IR spectra of 20 h visible light irradiated catechol, exhibits a characteristic peak of ν(C–C) at 1110 cm−1 along with normal stretching and bending vibrations of catechol molecules.27,28 It is clearly demonstrated that the catechol molecules also undergo the polymerization reaction during visible light irradiation and form a stable carbonaceous polymer. In addition, the two new peaks appearing at 1017 and 926 cm−1 for 20 h visible light irradiated catechol are assigned to the C–H plane bending vibration of aromatic rings.29 On the other hand, no such FT-IR peaks related to the C–H plane bending vibration of aromatic rings are observed for pure catechol. This observation clearly suggested that during the photopolymerization process, the aromatic ring connects via the C–C bond and this bond formation leads to enhance the in-plane C–H bending vibration and reduce its ring strain. Thus, the enhanced in-plane bending vibration further supports the photopolymerization reaction and C–C bond formation. Similar phenomenon has been previously reported for poly aromatic rings.29 Similarly, the 6 h visible light irradiated TiO2–catechol surface complex also shows the ν(C–C) peak at 1110 cm−1. However, the peak appearing in the range of 1260–1280 cm−1 is mainly attributed to Ti–O–C bonding between TiO2 and catechol molecules.30–32 These observations confirmed that the radical polymerization of catechol is initiated by the TiO2 surface and the resultant carbonaceous polymer was strongly deposited over the TiO2 surface,21,33 thus leading to Ti–O–C bonding. The formation of the C–C bond was further analyzed by FT-Raman spectroscopy. Fig. 4 shows the Raman spectra of TiO2 and after the 6 h visible light irradiated TiO2–catechol surface complex. As illustrated in Fig. 4, the bands appeared in the range of 1150 to 1300 cm−1 and 930–1077 cm−1 correspond to C–O and C–H ring deformation vibrations of catechol molecules.34 The peaks appearing at 1468, and 1190 cm−1 are related to the aromatic CC ring vibration, and C–O–C bond, respectively. Importantly, the main peak at 1400 cm−1 is related to the C–C bond vibration.35,36 This C–C bond vibration peak confirms the formation of the polymeric structure during visible light illumination. Similar C–C bond vibration was observed by Goa et al. for polypyrrole.
 |
| | Fig. 2 (a) Mechanism of visible light-induced polymerization of catechol, (b) photocurrent response of TiO2 and the 1 wt% catechol–TiO2 carbonaceous polymer hybrid, and (c) PL spectra of different wt% catechol loaded TiO2 carbonaceous polymer hybrids. | |
 |
| | Fig. 3 (a) FT-IR spectra of pure catechol and catechol after 20 h of visible light irradiation and (b) TiO2–catechol surface complex after 6 h of visible light irradiation. | |
 |
| | Fig. 4 FT-Raman spectra of TiO2 and the catechol–TiO2 surface complex after 6 h of visible light irradiation. | |
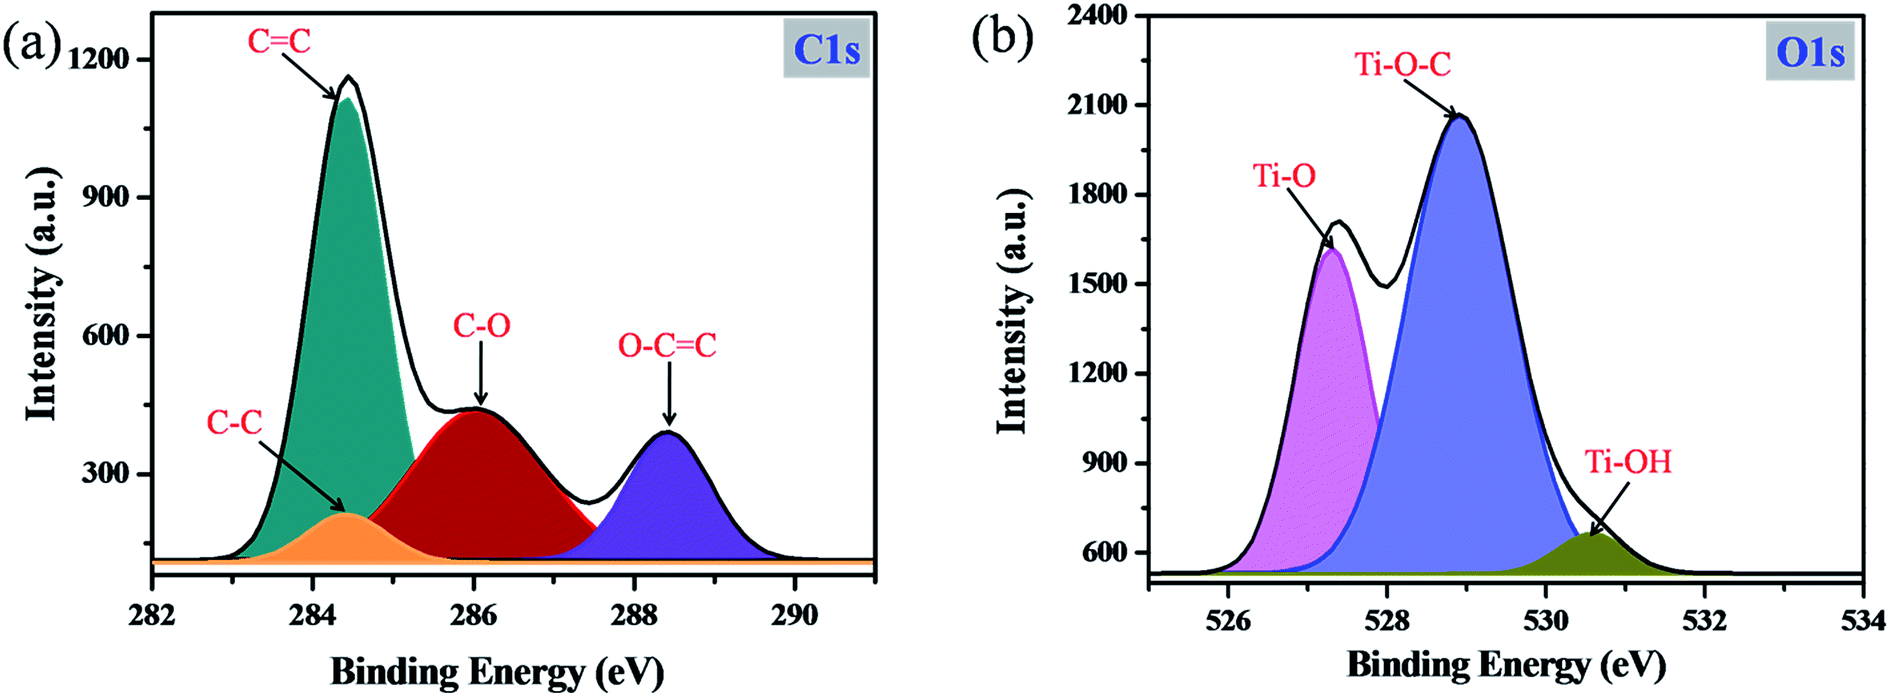
In order to confirm the formation of the C–C bond during the photopolymerization reaction and the chemical interaction between catechol and TiO2, XPS analysis was carried out. As shown in Fig. 5a, the high resolution C1s spectrum can be deconvoluted into four peaks. The characteristic peak observed at 284.5 eV is mainly attributed to C–C bonds, which clearly revealed that during the photopolymerization the carbonaceous polymer was formed and phenyl rings of catechol molecules are connected through the C–C bond.17,37–39 Moreover, the additional peaks centered at 284.2, 286.2 and 288.5 eV are assigned to aromatic CC, C–O and O–CO bonds, respectively.40,41 Similarly, the high resolution O1s spectrum (Fig. 5b) is deconvoluted into three main components. The peak identified at 529.5 eV mainly arises from the Ti–O–C bond.42 During the condensation reaction, the Ti–O bond from TiO2 may interact with catechol molecules and form the Ti–O–C bond. Moreover, the surface complex formation between TiO2 and catechol can occur only via Ti–O–C bond formation and there are no other possibilities for the surface complex formation between TiO2 and catechol.43,44 In a previous report, Zhang et al. have synthesized an organic linker functionalized TiO2 surface complex and obtained the high intense Ti–O–C peak.42 This is the clear evidence supporting the TiO2 and catechol orbital mixing. In addition, the Ti–O–C bond formation in the catechol–TiO2 surface complex was also confirmed by FT-IR spectra.30–32 The additional peaks that appeared at 527.1 and 530.5 eV are assigned to Ti–O and Ti–OH bonds of TiO2.45 Moreover, the Ti2p3/2 and Ti2p1/2 peaks identified in the high resolution Ti2p spectra confirmed the presence of anatase TiO2 (Fig. S4†).
 |
| | Fig. 5 XPS spectra of the catechol–TiO2 carbonaceous polymer: (a) high-resolution C1s spectrum and (b) high-resolution O1s spectrum. | |
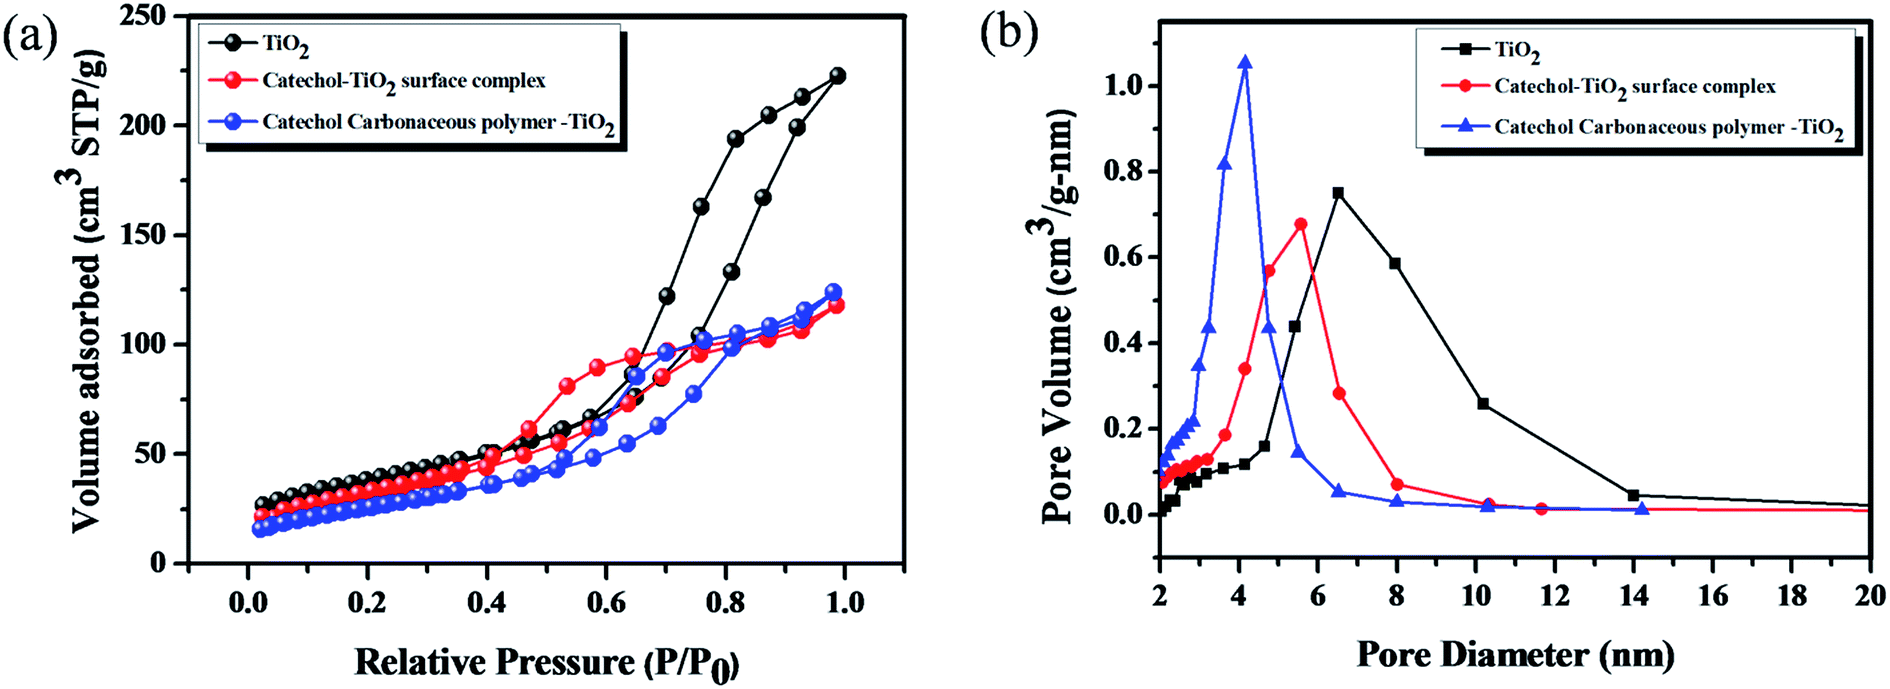
Fig. 6 shows the N2 adsorption–desorption isotherms and the corresponding pore size distribution curves of TiO2, the catechol–TiO2 surface complex (before photopolymerization) and the catechol–TiO2 carbonaceous polymer. As shown in Fig. 6, all the prepared photocatalysts exhibit type (IV) isotherms with H3 hysteresis loops. It is well known that type (IV) pattern corresponds to the mesoporous structure of materials.46 The average pore size of TiO2, the catechol–TiO2 surface complex and the catechol–TiO2 carbonaceous polymer are 4.8, 3.7 and 2.9 nm, respectively. It can be seen that due to the surface complexation of catechol with TiO2, the average pore size of TiO2 decreased to 3.7 nm from 4.8 nm (Table 1). Moreover, after 6 h of visible irradiation the average pore size further decreases (2.9 nm). It clearly indicates that during the visible light illumination, the surface attached catechol molecules undergo the polymerization reaction and the resultant branched polymers block the TiO2 pores. In contrast to pore volume the surface area of the catechol–TiO2 surface complex (96.1 m2 g−1) increases after the photopolymerization (117.4 m2 g−1), which suggests that TiO2 is strongly intercalated in the branched carbonaceous polymer matrix.47
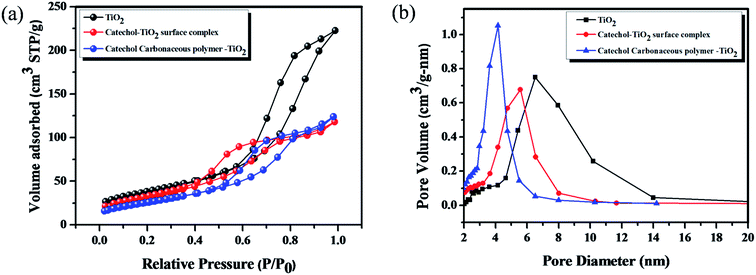 |
| | Fig. 6 (a) and (b) Nitrogen adsorption–desorption isotherms and pore distribution curves of TiO2, the catechol–TiO2 surface complex (before polymerization) and the catechol–TiO2 carbonaceous polymer. | |
Table 1 Surface area and pore size analysis
| Entry |
Name of samples |
S
BET (m2 g−1) |
V
p (cm3 g−1) |
Pore size (nm) |
| 1 |
TiO2 |
134.6 |
0.329 |
4.8 |
| 2 |
Catechol–TiO2 surface complex |
96.1 |
0.178 |
3.7 |
| 3 |
Catechol carbonaceous polymer–TiO2 surface complex |
117.4 |
0.170 |
2.9 |
The influence of polymerization of the organic linker (catechol) on the TiO2 surface morphology and the elemental composition of catechol–TiO2 carbonaceous polymer hybrids were studied using FE-SEM and EDX analysis. The bare TiO2 particles exhibited spherical morphology, whereas the catechol–TiO2 carbonaceous polymer hybrid showed an irregular morphological pattern with rough embodiments (Fig. S1†). The change in the morphologies of the particles (post-polymerization) clearly demonstrated the presence of catechol groups on the TiO2 surface. Moreover, FE-SEM-EDX (Fig. S2†) analysis confirmed the presence of a higher carbon content. This is a clear evidence for the deposition of the carbonaceous polymer on the TiO2 surface.17 In order to further confirm the structural changes of TiO2 during the photopolymerization reaction, TEM and HRTEM were performed and the results are illustrated in Fig. 7. It can be clearly seen from Fig. 7 that TiO2 possesses uniform spherical particles with pores that indicate the formation of mesoporous TiO2 nanoparticles similar to SEM images. Unlike mesoporous TiO2 nanoparticles, the photopolymerization of catechol on TiO2 affects the existing TiO2 morphology and forms a continuous network with aggregation. This continuous network with high surface area could efficiently facilitate the photoexcited electrons and enhance the photocatalytic performance. Several studies have been reported earlier related to the morphological dependent photocatalytic activity of the photocatalysts.48–50 The calculated interplanar spacing value for both TiO2 and the catechol–TiO2 carbonaceous polymer hybrid was 0.34 nm and it corresponded to the (101) plane of anatase phase TiO2. This clearly suggests that photopolymerization occurred only on the surface of TiO2 without affecting the existing crystalline phases of TiO2, as revealed from XRD (Fig. S3†).
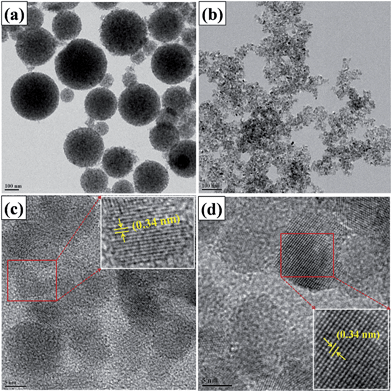 |
| | Fig. 7 TEM images of: (a) TiO2; (b) catechol–TiO2 carbonaceous polymer and HRTEM images of (c) TiO2; (d) catechol–TiO2 carbonaceous polymer. | |
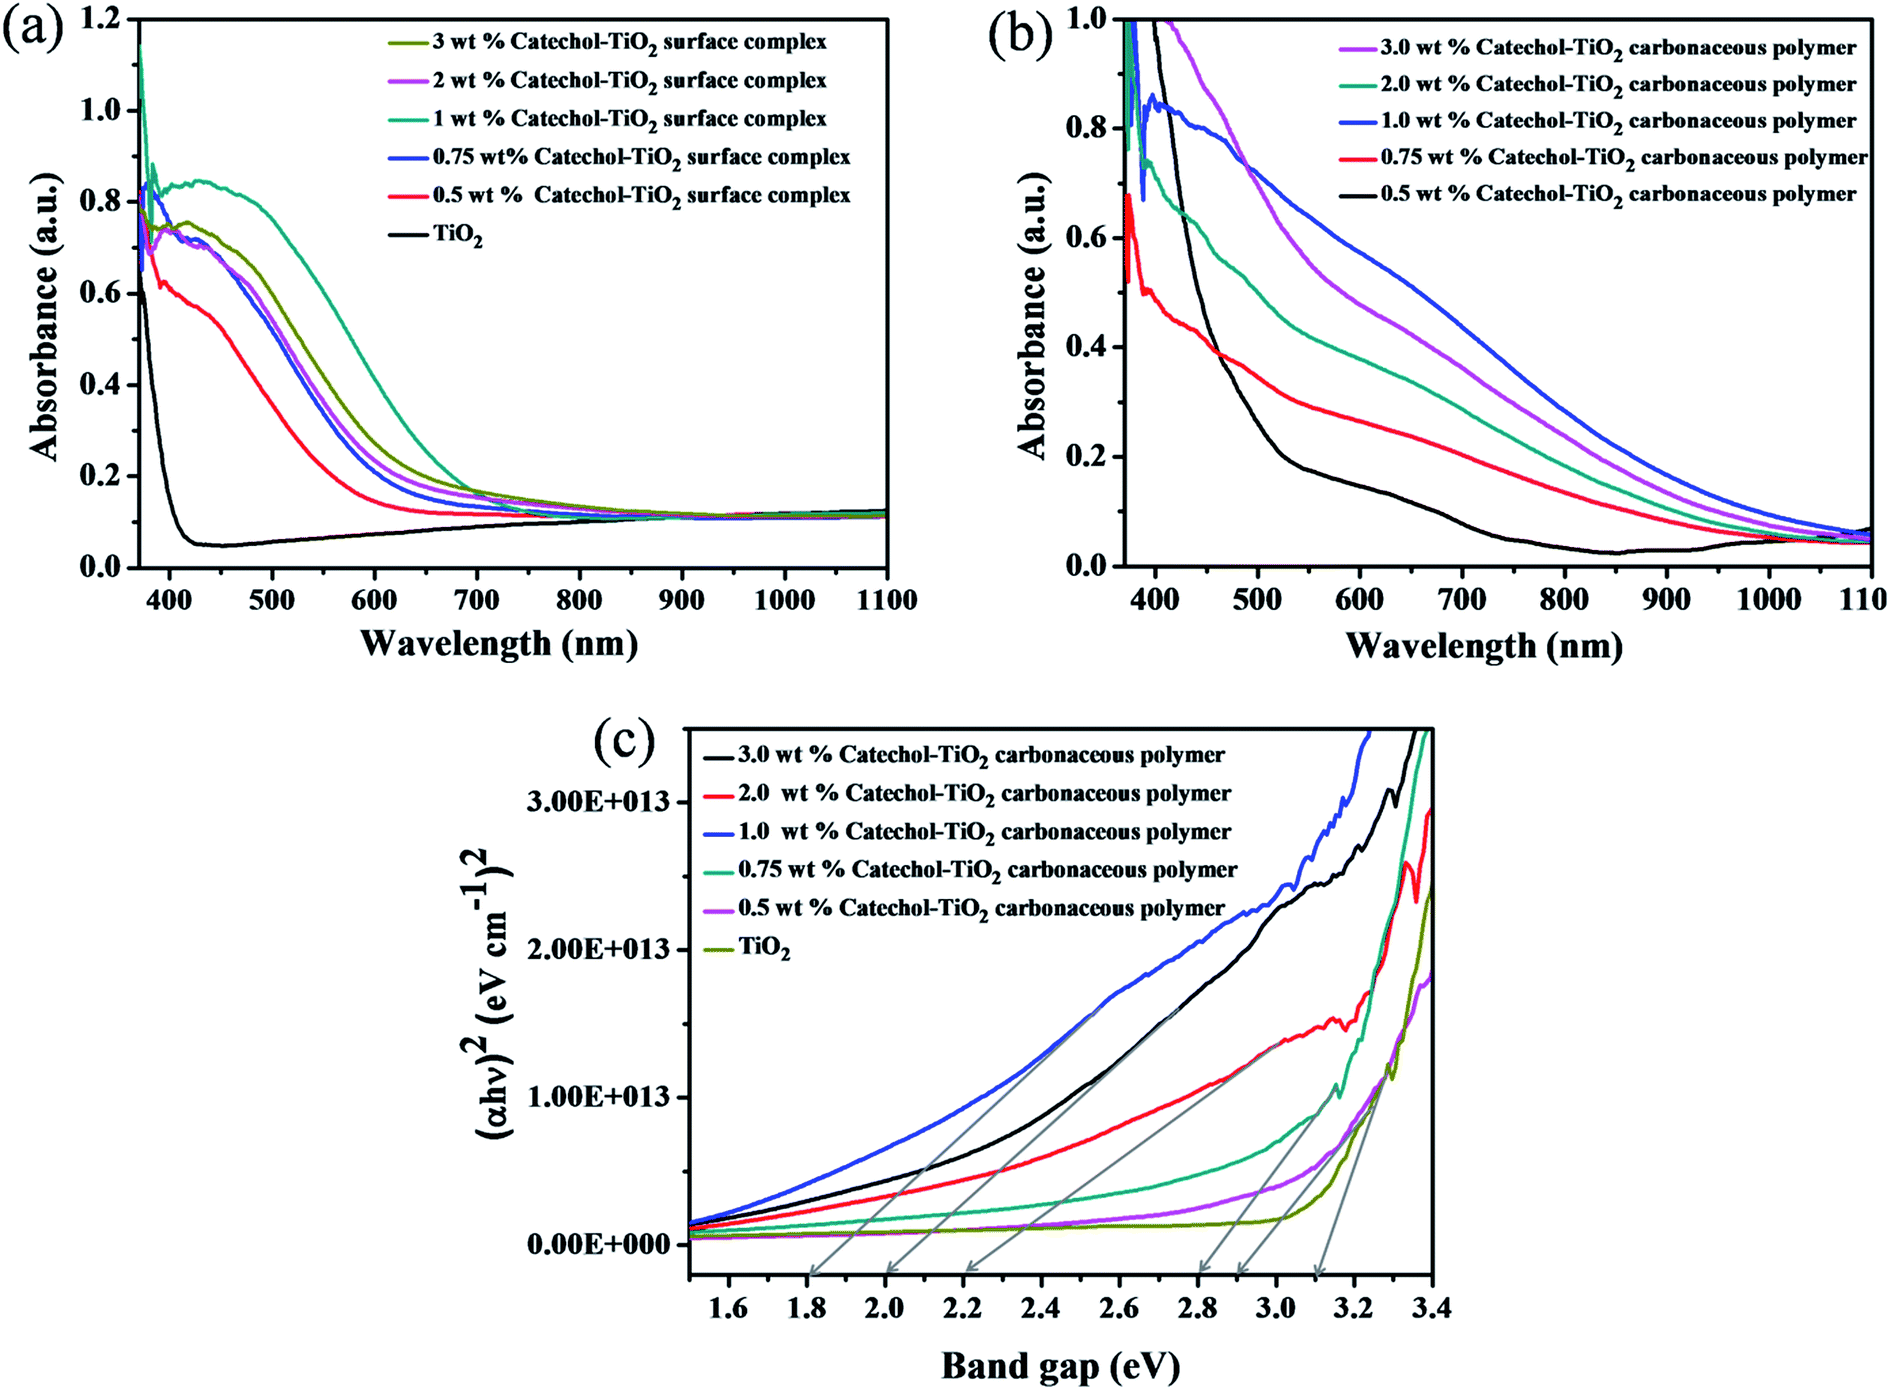
The optical absorption of different concentrations of the catechol loaded TiO2 surface complex and the carbonaceous polymer hybrid was investigated by UV-Vis absorption spectra recorded in Diffuse Reflectance Spectroscopy (DRS) mode. As depicted in Fig. 8a, the absorption spectra of the catechol–TiO2 surface complex shows enhanced absorption in the visible region compared to pristine TiO2. The increased absorption in the visible region is due to complex formation between catechol and the TiO2 surface. Moreover, after 6 h of visible light irradiation, the absorbance of the surface complex further shifted to the visible region and a small peak at 630 nm is noted (Fig. 8b). It is mainly because all the aromatic rings of catechol combined through the C–C bond and extended the π–π conjugation. The maximum absorption is observed with the 1 wt% catechol–TiO2 carbonaceous polymer hybrid and the subsequent decrease in the absorption of TiO2 was observed irrespective of the loading of catechol (wt%). This is clearly attributed to the higher loading of catechol (2 and 3 wt%) concentration on the TiO2 surface leading to light penetration. As can be seen from Fig. 8c, the calculated band gap values of pristine TiO2 and catechol–TiO2 carbonaceous polymer hybrids are 3.1 eV (TiO2), 2.9 eV (0.5 wt% catechol–TiO2), 2.8 eV (0.75 wt% catechol–TiO2), 1.8 eV (1.0 wt% catechol–TiO2), 2.2 eV (2.0 wt% catechol–TiO2) and 2.0 eV (3.0 wt% catechol–TiO2). It is worthy to mention here that the band gap of TiO2 can be tuned by changing the concentration of the organic linker. The decrease in the band-gap of the catechol–TiO2 carbonaceous polymer hybrid may be attributedto the following reasons.
 |
| | Fig. 8 (a) UV-Vis absorption spectra (DRS mode) of different wt% catechol–TiO2 surface complexes, (b) different wt% catechol–TiO2 carbonaceous polymer hybrids (after 6 h of visible light irradiation), and (c) Tauc plot of various catechol–TiO2 carbonaceous polymer hybrids. | |
(i) The interfacial charge transfer complex formation between surface hydroxyl groups of TiO2 and catechol (it was confirmed by FT-IR spectra).
(ii) The effective orbital hybridization between the 2p(O), π(C) orbitals of catechol (ligand) and 3d(Ti) orbital of TiO2 could lead to the formation of the Ti–O–C bond.51 It was confirmed from FT-IR and O1s XPS spectra.
It is interesting to note that the mixing of orbitals can be controlled by the organic linker concentration. Upon increasing the catechol concentration from 0.5 wt% to 1 wt%, the effective orbital mixing also increases and the optical band gap energy shifts towards the red region. Whereas, beyond 1 wt% loading, the band gap increases and this could be attributed to the mixing of molecular orbitals of TiO2 and catechol getting saturated with maximal orbital mixing and further loading of catechol molecules had minimal effect (nominal increase) on the band gap.
4.1 Photocatalytic Cr(VI) reduction activity
The photocatalytic activity of catechol–TiO2 carbonaceous polymer hybrids was assessed for toxic Cr(VI) to less toxic Cr(III) reduction. The photocatalytic Cr(VI) reduction was performed and monitored through UV-Vis absorption spectra using a DPC assay. Prior to the reaction, Cr(VI) solution was stirred under dark conditions for 30 min to achieve the adsorption–desorption equilibrium. As depicted in Fig. 9a, pure TiO2 shows only 20% of Cr(VI) reduction in 20 min under visible light irradiation. In contrast, the catechol–TiO2 carbonaceous polymer hybrids exhibit complete reduction (100%) of Cr(VI) to Cr(III) in 20 min under identical experimental conditions (Fig. 9b). There is complete reduction of Cr(VI) (30 ppm) in the presence of the catechol–TiO2 carbonaceous polymer hybrid supporting the efficiency of the prepared photocatalyst. Efficient reduction of Cr(VI) to Cr(III) can be explained by the phenomenon that the catechol–TiO2 carbonaceous polymer hybrid facilitates the interfacial charge transfer between the aromatic rings of catechol and TiO2via (–Ti–O–C–) linkage as evident from the O1s spectrum (see Fig. 5b). However, another possible reason for high photocatalytic Cr(VI) reduction activity is adsorption. As shown in Fig. 9c, the catechol–TiO2 carbonaceous polymer showed higher Cr(VI) adsorption efficiency (33%) compared to that of pure TiO2. The high Cr(VI) adsorption capacity of catechol–TiO2 carbonaceous polymer may be due to the complexing tendency of oxygen atoms present in the polymeric material with Cr(VI) and the high surface area. In general, the adsorption of Cr(VI) ions on the catalyst's surface plays a vital role in the photoreduction reaction. The high adsorption of Cr(VI) ions on the catechol–TiO2 carbonaceous polymer can enhance the photoreduction of Cr(VI) to Cr(III). During the photocatalysis, the photogenerated electrons from the photocatalysts can readily migrate to the surface adsorbed Cr(VI) ions and thereby efficiently reduce Cr(VI) to Cr(III).52–54 In order to evaluate the mechanistic aspects and effect of different catechol loaded carbonaceous polymer hybrids on the enhanced photoreduction activity of photocatalysts, we carried out a set of experiments with different experimental conditions and the results are depicted in Fig. 9c. As can be seen from Fig. 9c, the photocatalytic activity is increased on increasing the catechol loading (up to 1 wt%). Beyond 1 wt%, the photocatalytic activity is gradually decreased which clearly indicates that the higher catechol loading (2 and 3 wt%) greatly affects the photocatalytic activity due to the steric-screening effect of excess aromatic rings adsorbed on the surface of TiO2.55 The maximum Cr(VI) reduction is observed with 1 wt% catechol–TiO2 carbonaceous polymer hybrids due to their very low band gap energy (1.8 eV) compared to other composites (Fig. 8b), which further supports that there is more absorption of light in the visible region. In addition, the photocatalytic Cr(VI) reduction activity of the catechol–TiO2 carbonaceous polymer hybrid was compared with that of the already reported photocatalysts and is tabulated in Table 2. It can be seen that the photocatalytic Cr(VI) reduction activity of the catechol–TiO2 carbonaceous polymer hybrid showed enhanced photocatalytic activity compared to other reported photocatalysts.56–65
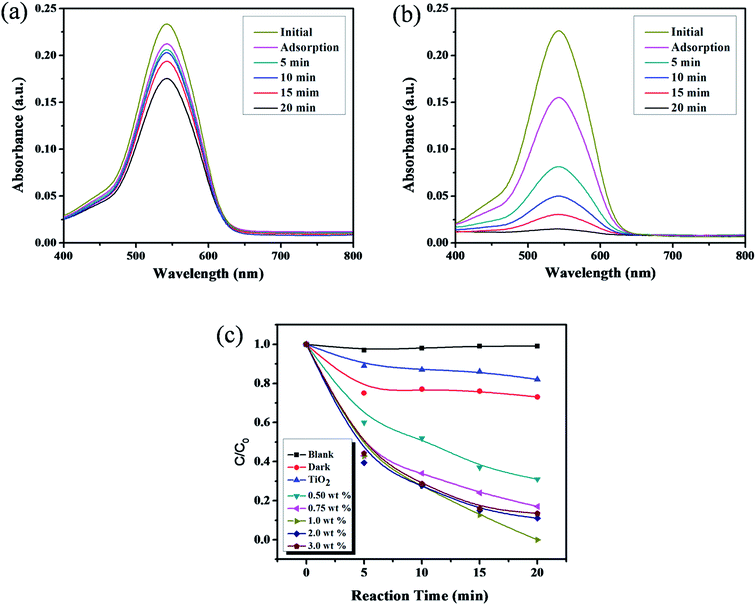 |
| | Fig. 9 UV-Vis absorption spectra of photocatalytic Cr(VI) reduction using (a) TiO2, (b) the catechol–TiO2 carbonaceous polymer hybrid and (c) C/Co profile of different wt% catechol–TiO2 carbonaceous polymer hybrids. | |
Table 2 Comparison of photocatalytic Cr(VI) reduction activity
| Catalyst |
Concentration of Cr(VI) ions |
Irradiation time (min) |
Light source |
Number of recycles |
Cr(VI) estimation |
Ref. |
| Au/N–TiO2 |
10 ppm |
250 min |
Visible |
— |
UV-Vis spectrophotometer |
56
|
| TiO2–2-naphthol |
30 ppm |
180 min |
Visible |
2 |
UV-Vis spectrophotometer |
21
|
| CdS–rGO |
10 ppm |
250 min |
Visible |
— |
UV-Vis spectrophotometer |
57
|
| Mg, Ag co-impregnated TiO2 |
5 ppm |
100 min |
Visible |
— |
UV-Vis spectrophotometer |
58
|
| Bi nanowire networks |
40 ppm |
60 min |
Visible |
5 |
UV-Vis spectrophotometer |
59
|
| CuO–ZnO nanocomposite |
20 ppm |
60 min |
Visible |
4 |
UV-Vis spectrophotometer |
60
|
| NH2-MIL-88B (Fe) |
8 ppm |
45 |
Visible |
3 |
DPC |
61
|
| MIL-68(In)-NH2 |
20 ppm |
180 |
Visible |
3 |
DPC |
62
|
| UiO-66(NH2) |
10 ppm |
100 |
Visible |
3 |
DPC |
63
|
| rGO–UiO-66(NH2) |
10 ppm |
120 |
Visible |
3 |
DPC |
64
|
| Pd@UiO-66(NH2) |
10 ppm |
120 |
Visible |
3 |
DPC |
65
|
|
Catechol–TiO
2
carbonaceous polymer
|
30 ppm
|
20
|
Visible
|
5
|
DPC
|
This work
|
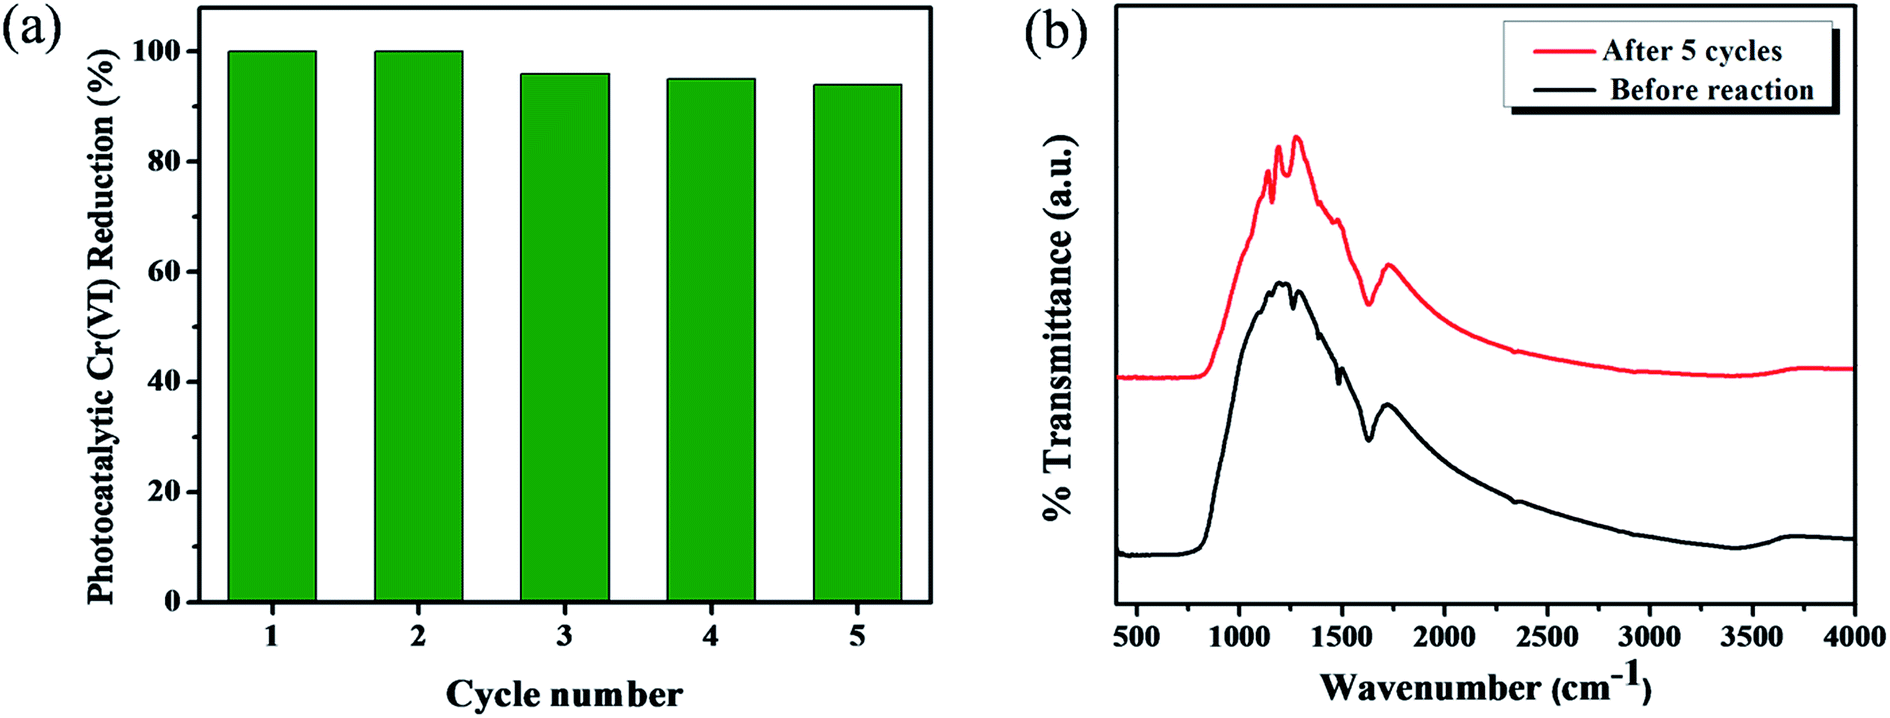
It is well known that the organic linker-functionalized metal oxide surface complexes are highly unstable due to the formation of surface bonding between the organic linkers and metal-oxides. As a result, their application is greatly limited for the commercialization of organic linker attached metal oxide photocatalysts. Kim et al. reported that the TiO2–phenolic surface complex was less stable due to the surface interaction between phenolic –OH and TiO2.20 However, in the present work, the stability of catechol-functionalized TiO2 surface complexes were achieved by the photosynthetic polymerization approach under visible light (>400 nm) irradiation. The carbonaceous copolymer formation was previously identified by XPS analysis (Fig. 5). Fig. 10a represents the durability of catechol–TiO2 carbonaceous polymer hybrids for five successive cycles. For all the five cycles the photocatalytic Cr(VI) reduction is consistently noted above 96% without significant loss in the photocatalytic activity. Moreover, the stability of hybrid photocatalysts was further confirmed by FT-IR and TEM analysis. The FT-IR and TEM (Fig. 10b and S8†) analyses were carried out before and after five cycles of the photocatalytic reaction. There is no significant changein both FT-IR and TEM after five consecutive cycles, demonstrating the high chemical stability of catechol–TiO2 carbonaceous polymer hybrids.
 |
| | Fig. 10 (a) Reusability experiment for photocatalytic Cr(VI) reduction using the 1 wt% catechol–TiO2 carbonaceous polymer hybrid, and (b) FT-IR spectra before and after five cycles of reaction. | |
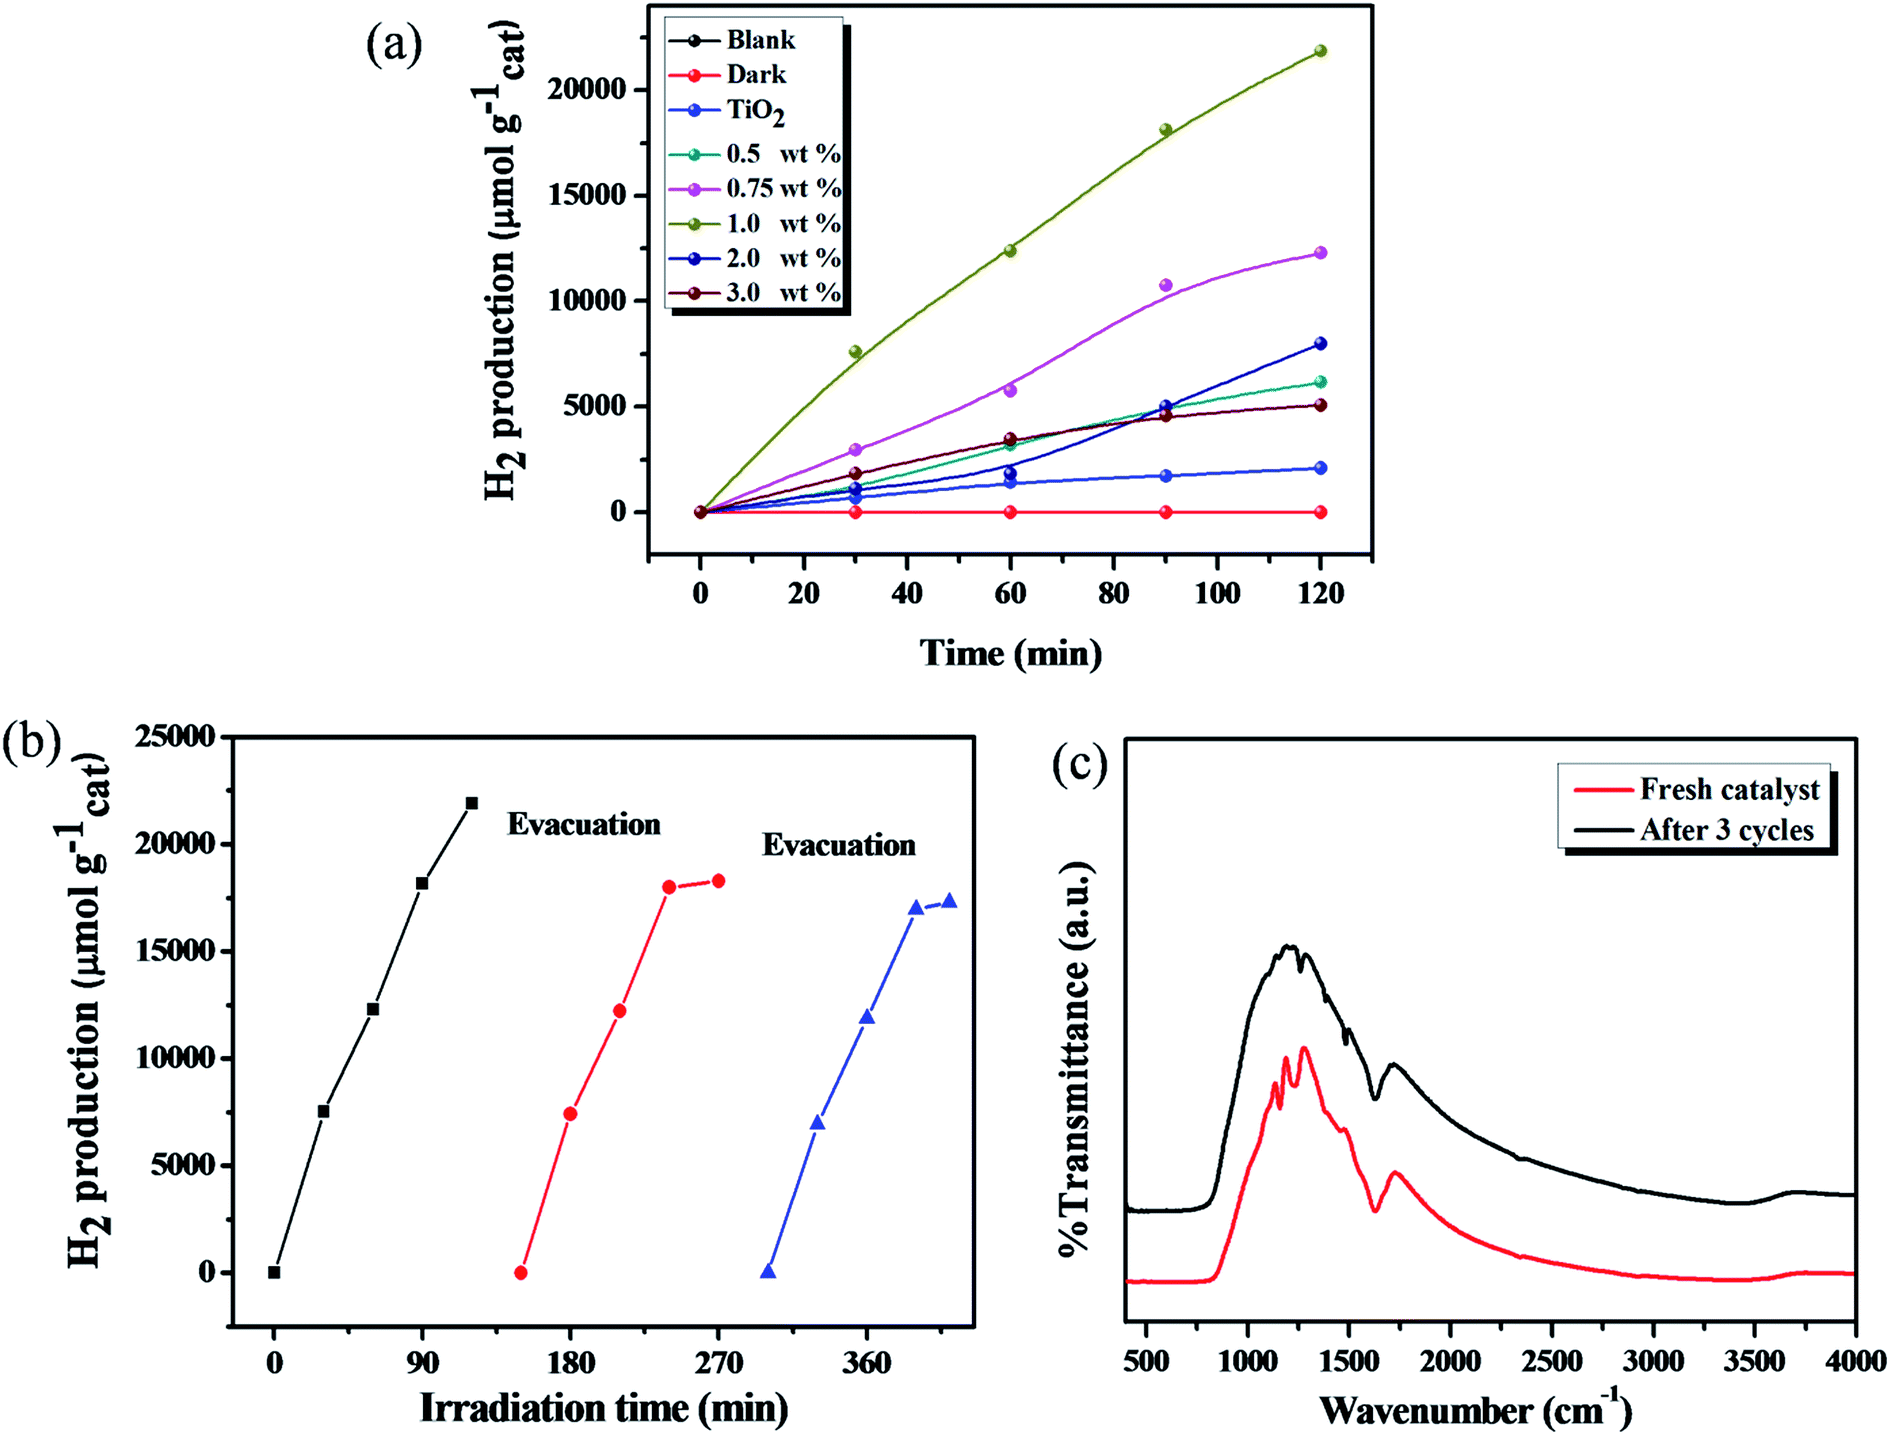
4.2 Photocatalytic H2 production
The photocatalytic H2 production activity was evaluated under solar light irradiation with different amounts of catechol loaded TiO2 carbonaceous polymer hybrids by using triethanolamine (TEOA) as a hole scavenger. No H2 production was observed in the absence of either solar light or the photocatalyst. As can be seen from Fig. 11, the descending order of photocatalytic H2 production activity is 1 wt% catechol–TiO2 (10925 μmol h−1 gcat−1) > 0.75 wt% catechol–TiO2 (6148 μmol h−1 gcat−1) > 0.5 wt% catechol–TiO2 (3082 μmol h−1 gcat−1) > 2 wt% catechol–TiO2 (3995 μmol h−1 gcat−1) > 3 wt% catechol–TiO2 (2534 μmol h−1 gcat−1) > TiO2 (1035 μmol h−1 gcat−1). The results obviously demonstrated that the photocatalytic activity of pristine TiO2 is lower than that of different wt% catechol loaded TiO2 carbonaceous polymer hybrid photocatalysts. Notably, the optimized 1.0 wt% catechol–TiO2 carbonaceous polymer photocatalyst shows the highest AQY (59.3%) compared to that of other photocatalysts. Thus, it clearly demonstrates that the 1.0 wt% catechol–TiO2 carbonaceous polymer photocatalyst effectively utilized the photons and thereby enhanced the photocatalytic H2 production rate (see Table S2†). The enhanced photocatalytic activity of the catechol–TiO2 carbonaceous polymer hybrid photocatalyst is due to interfacial charge transfer transition between TiO2 and the catechol carbonaceous polymer. However, the maximum H2 production was observed with the 1 wt% catechol–TiO2 carbonaceous polymer hybrid photocatalyst which strongly suggested that interfacial electron transfer has rapidly occurred compared to other photocatalysts as revealed from the photoluminescence (PL) spectra. In addition, the lower band gap energy (Fig. 8) of the 1 wt% catechol–TiO2 carbonaceous polymer hybrid photocatalyst facilitates more absorption in the visible region and thereby enhances the photocatalytic activity. Moreover, the photocatalytic H2 production activity of the catechol–TiO2 carbonaceous polymer hybrid was compared with the already reported organic/inorganic hybrid materials and metal–organic framework (MOF) photocatalysts (Table 3). Compared to known photoactive organic/inorganic hybrids and metal–organic framework (MOF) photocatalysts, catechol–TiO2 carbonaceous polymer hybrids showed better photocatalytic activity under solar light irradiation.66–75
 |
| | Fig. 11 (a) Photocatalytic H2 production using different wt% catechol–TiO2 carbonaceous polymers, (b) reusability test, and (c) FT-IR spectra of the catechol–TiO2 photocatalyst before and after 3 cycles of the photocatalytic H2 production reaction. | |
Table 3 photocatalytic H2 production activity with the existing TiO2 based organic/inorganic hybrid materials
| Catalyst |
Reaction condition |
H2 production activity |
Ref. |
| TO-SCA[4]/Pt–TiO2 |
λ ≥ 450 nm, 0.2 M TEOA |
∼200 μmol h−1 |
66
|
| (PR)-Pt/TiO2 |
λ ≥ 420 nm, 50 mM Na2S, pH 12.50 |
∼700 μmol g−1 in 4 h |
67
|
| EY–Pt/TiO2 |
Visible light, 5% TEOA |
2000 μmol in 20 h |
68
|
| RhB-Pt/UiO-66(Zr) (MOF) |
λ ≥ 420 nm, 10% TEOA, pH 7.00 |
116 μmol h−1 g−1 |
69
|
| EB–UiO-66 (MOF) |
λ ≥ 420 nm, 30 mg ErB, 0.5 wt% Pt |
4.6 μmol h−1 |
70
|
| ErB–MIL-101 (MOF)-Ni/NiOx |
λ ≥ 420 nm, 30 mg ErB |
125 μmol h−1 |
71
|
| Pt/NH2-MIL-125(Ti) |
Xe lamp (TEOA) |
33 μmol |
72
|
| Co@NH2-MIL-125(Ti) |
500 W Xe/Hg lamp |
37 μmol |
73
|
| Pt@CdS/MIL-101(Cr) |
300 W Xe lamp (lactic acid) |
150 μmol h−1 |
74
|
| Pt@MOF-1 or Pt@MOF-2 |
450 W Xe-lamp (TEA), visible |
3400 or 7000 TON |
75
|
|
Catechol–TiO
2
carbonaceous polymer
|
Solar light, 5% TEOA aqueous solution
|
10![[thin space (1/6-em)]](https://www.rsc.org/images/entities/b_char_2009.gif) 925 μmol h
−1
g
cat
−1 925 μmol h
−1
g
cat
−1
|
This work
|
In order to verify the photostability of the catechol–TiO2 carbonaceous polymer hybrid during the photocatalytic H2 production, the recyclability experiment was carried out under identical conditions by evacuating the generated gas at certain time intervals for the next cycle and the results are illustrated in Fig. 11b. It can be seen that no significant change was observed in the H2 production activity for 3 cycles and it indicates the superior stability of the photocatalyst. However, the stability of catechol–TiO2 carbonaceous polymer hybrids was further confirmed using FT-IR and TEM analyses. As observed from FT-IR and TEM (Fig. 11c and S9†), no notable change was observed in both FT-IR and TEM analyses of fresh catalysts and those used after 3 cycles and it clearly demonstrated the high sustainability of catechol–TiO2 carbonaceous polymer hybrids as in the case of photocatalytic Cr(VI) reduction reaction.
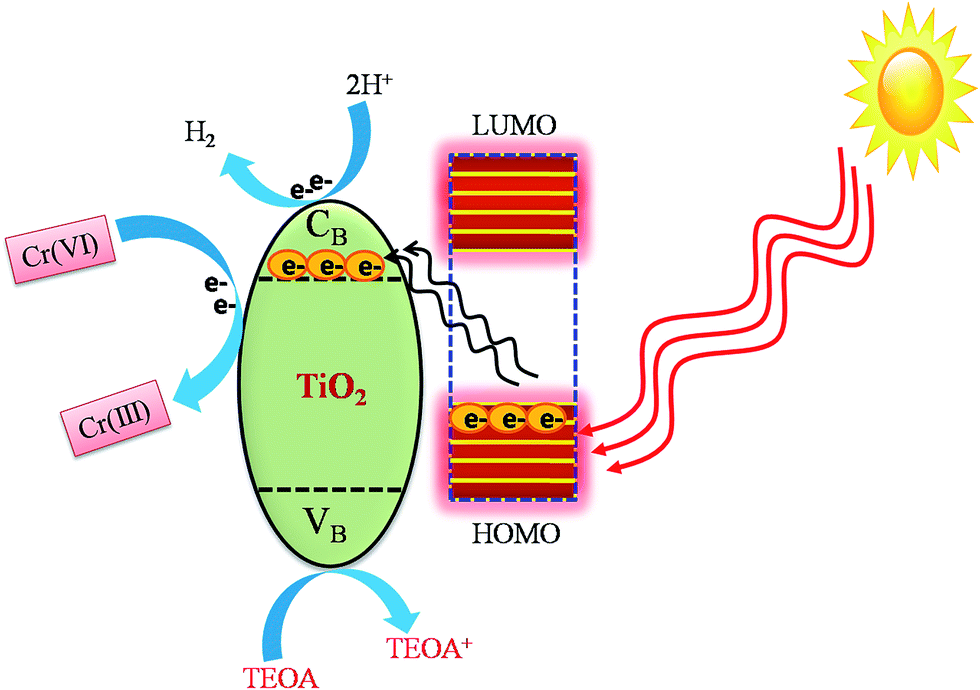
4.3 Possible mechanism for photocatalytic Cr(VI) reduction and H2 production
Based on the above discussion, a possible LMCT photocatalytic reaction mechanism has been proposed and illustrated in Fig. 12. In this process, the catechol attached on the TiO2 surface sensitizes TiO2 by forming a type-II ligand to metal charge transfer (LMCT) complex.76–78 In general, a wide band gap semiconductor metal oxide can be activated by visible light by surface adsorption of dyes and with simple organic molecules and complexes as sensitizers other than coupling with narrow band gap semiconductors. In this work, during the visible light irradiation the photoexcited electrons present in the HOMO level of catechol can directly inject into the conduction band of TiO2 due to the exact match of their energy levels. Therefore, the higher the population of electrons in the conduction band of TiO2 the more effective is the reduction of Cr(VI) to Cr(III)21 within a short span of time. In addition, during LMCT holes are also generated in the valence band of TiO2. This electron–hole (h+) generation is supported by photocurrent studies (Fig. 2b). The photo-generated holes are scavenged by triethanolamine (TEOA) to produce H+ and the produced H+ ions undergo a reduction reaction with photo-excited electrons and generate H2.
 |
| | Fig. 12 Proposed mechanism for photocatalytic Cr(VI) reduction and H2 production. | |
5. Conclusion
A visible light active catechol–TiO2 carbonaceous polymer organic–inorganic hybrid was successfully synthesized by a facile photosynthetic method. The synthesized hybrid materials exhibited superior photocatalytic activity for Cr(VI) reduction and H2 production from the aqueous TEOA solution through ligand to metal charge transition. In addition, the lowest band gap (1.8 eV), highest photocatalytic Cr(VI) reduction (100% within 20 min) and maximum H2 production activity were achieved with the 1 wt% catechol-loaded hybrid. The plausible mechanism was proposed for the photosynthetic polymerization of catechol on TiO2 and photocatalytic Cr(VI) reduction as well as H2 production activity. The current new finding may provide new insights into the design and development of visible light harvesting stable organic–inorganic hybrid materials for energy and environmental applications.
Acknowledgements
This work was financially supported by the Science and Engineering Research Board (SERB) [File No. EMR/2014/000645], New Delhi, India and Ministry of New and Renewable Energy (MNRE), New Delhi, India [File No. 103/239/2015-NT].
References
- J. Ge and Y. Yin, Adv. Mater., 2008, 20, 3485–3491 CrossRef CAS.
- F. Caruso, R. A. Caruso and H. Möhwald, Science, 1998, 282, 1111–1114 CrossRef CAS PubMed.
- H. Lu, B. Fei, J. H. Xin, R. Wang and L. Li, Adv. Colloid Interface Sci., 2006, 300, 111–116 CrossRef CAS PubMed.
- P. Pitukmanorom, T. H. Yong and J. Y. Ying, Adv. Mater., 2008, 20, 3504–3509 CrossRef CAS.
- N. Zhang, M.-Q. Yang, S. Liu, Y. Sun and Y.-J. Xu, Chem. Rev., 2015, 115, 10307–10377 CrossRef CAS PubMed.
- X.-M. Gao, L.-D. Shu, L.-Y. Yang, Y.-Q. Shen, Y.-J. Zhang and Q.-F. Hu, Bull. Korean Chem. Soc., 2013, 34, 246–248 CrossRef CAS.
- A. Batool, F. Kanwal, M. Imran, T. Jamil and S. A. Siddiqi, Synth. Met., 2012, 161, 2753–2758 CrossRef.
- F. Tan, S. Qu, L. Wang, Q. Jiang, W. Zhang and Z. Wang, J. Mater. Chem. A, 2014, 2, 14502–14510 CAS.
- C. Han, N. Zhang and Y.-J. Xu, Nano Today, 2016, 11, 351–372 CrossRef CAS.
- S. Liu, C. Han, Z.-R. Tang and Y.-J. Xu, Mater. Horiz., 2016, 3, 270–282 RSC.
- A. Schmid, S. P. Armes, C. A. Leite and F. Galembeck, Langmuir, 2009, 25, 2486–2494 CrossRef CAS PubMed.
- A. Schmid, S. Fujii, S. P. Armes, C. A. Leite, F. Galembeck, H. Minami, N. Saito and M. Okubo, Chem. Mater., 2007, 19, 2435–2445 CrossRef CAS.
- L.-J. Xu, W.-Z. Zhou, L.-Y. Zhang, B. Li, H.-Y. Zang, Y.-H. Wang and Y.-G. Li, CrystEngComm, 2015, 17, 3708–3714 RSC.
- B. Kobin, L. Grubert, S. Blumstengel, F. Henneberger and S. Hecht, J. Mater. Chem., 2012, 22, 4383–4390 RSC.
- X. Wang, Q. Lu, X. Wang, J. Joo, M. Dahl, B. Liu, C. Gao and Y. Yin, ACS Appl. Mater. Interfaces, 2015, 8, 538–546 Search PubMed.
- Y. Otsuka, Y. Okamoto, H. Y. Akiyama, K. Umekita, Y. Tachibana and S. Kuwabata, J. Phys. Chem. C, 2008, 112, 4767–4775 CAS.
- A. Ramakrishnan, S. Neubert, B. Mei, J. Strunk, L. Wang, M. Bledowski, M. Muhler and R. Beranek, Chem. Commun., 2012, 48, 8556–8558 RSC.
- S. Neubert, A. Ramakrishnan, J. Strunk, H. Shi, B. Mei, L. Wang, M. Bledowski, D. A. Guschin, M. Kauer and Y. Wang, ChemPlusChem, 2014, 79, 163–170 CrossRef CAS.
- S. Sanchez-Cortes, O. Francioso, J. Garcıa-Ramos, C. Ciavatta and C. Gessa, Colloids Surf., A, 2001, 176, 177–184 CrossRef CAS.
- S. Kim and W. Choi, J. Phys. Chem. B, 2005, 109, 5143–5149 CrossRef CAS PubMed.
- P. Karthik, R. Vinoth, S. G. Babu, M. Wen, T. Kamegawa, H. Yamashita and B. Neppolian, RSC Adv., 2015, 5, 39752–39759 RSC.
- C. Y. Jimmy, L. Zhang and J. Yu, New J. Chem., 2002, 26, 416–420 RSC.
- S. G. Babu, R. Vinoth, D. P. Kumar, M. V. Shankar, H.-L. Chou, K. Vinodgopal and B. Neppolian, Nanoscale, 2015, 7, 7849–7857 RSC.
- O. d'Hennezel, P. Pichat and D. F. Ollis, J. Photochem. Photobiol., A, 1998, 118, 197–204 CrossRef.
- H. Einaga, S. Futamura and T. Ibusuki, Appl. Catal., B, 2002, 38, 215–225 CrossRef CAS.
- A. R. Upreti, Y. Li, N. Khadgi, S. Naraginti and C. Zhang, RSC Adv., 2016, 6, 32761–32769 RSC.
- S. Hu, L. Ma, H. Wang, L. Zhang, Y. Zhao and G. Wu, RSC Adv., 2015, 5, 31947–31953 RSC.
- J. Suárez-Guevara, O. Ayyad and P. Gómez-Romero, Nanoscale Res. Lett., 2012, 7, 1 CrossRef PubMed.
-
B. C. Smith, Infrared spectral interpretation: a systematic approach, CRC press, 1998 Search PubMed.
- P. Lei, F. Wang, S. Zhang, Y. Ding, J. Zhao and M. Yang, ACS Appl. Mater. Interfaces, 2014, 6, 2370–2376 CAS.
- S. Sakthivel and H. Kisch, Angew. Chem., Int. Ed. Engl., 2003, 42, 4908–4911 CrossRef CAS PubMed.
- G. Lui, J.-Y. Liao, A. Duan, Z. Zhang, M. Fowler and A. Yu, J. Mater. Chem. A, 2013, 1, 12255–12262 CAS.
- T. D. Savić, I. A. Janković, Z. V. Šaponjić, M. I. Čomor, D. Ž. Veljković, S. D. Zarić and J. M. Nedeljković, Nanoscale, 2012, 4, 1612–1619 RSC.
- Y. Gao, Y. Wang, X. Xu, K. Ding and D. Yu, RSC Adv., 2014, 4, 63719–63724 RSC.
- T. Lana-Villarreal, A. Rodes, J. M. Pérez and R. Gómez, J. Am. Chem. Soc., 2005, 127, 12601–12611 CrossRef CAS PubMed.
- P. Deshmukh, S. Patil, R. Bulakhe, S. Pusawale, J.-J. Shim and C. Lokhande, RSC Adv., 2015, 5, 68939–68946 RSC.
- X. H. Yang, J. W. Guo, S. Yang, Y. Hou, B. Zhang and H. G. Yang, J. Mater. Chem. A, 2014, 2, 614–619 CAS.
- S. Mao, K. Yu, S. Cui, Z. Bo, G. Lu and J. Chen, Nanoscale, 2011, 3, 2849–2853 RSC.
- M. H. Ahmed, J. A. Byrne, J. McLaughlin and W. Ahmed, Sci. Res., 2013, 4, 194–203 Search PubMed.
- O. Akhavan and E. Ghaderi, Nanoscale, 2013, 5, 10316–10326 RSC.
- R. Larciprete, S. Fabris, T. Sun, P. Lacovig, A. Baraldi and S. Lizzit, J. Am. Chem. Soc., 2011, 133, 17315–17321 CrossRef CAS PubMed.
- S. Zhang, Y. Peng, W. Jiang, X. Liu, X. Song, B. Pan and H.-Q. Yu, Chem. Commun., 2014, 50, 1086–1088 RSC.
- L. Zhang and J. M. Cole, ACS Appl. Mater. Interfaces, 2015, 7, 3427–3455 CAS.
- G. Zhang, G. Kim and W. Choi, Energy Environ. Sci., 2014, 7, 954–966 CAS.
- Y. Jiang, L. Meng, X. Mu, X. Li, H. Wang, X. Chen, X. Wang, W. Wang, F. Wu and X. Wang, J. Mater. Chem., 2012, 22, 23642–23649 RSC.
- N. C. Strandwitz, Y. Nonoguchi, S. W. Boettcher and G. D. Stucky, Langmuir, 2010, 26, 5319–5322 CrossRef CAS PubMed.
- N. Parveen, M. O. Ansari and M. H. Cho, Ind. Eng. Chem. Res., 2015, 55, 116–124 CrossRef.
- W. Sun, H. Liu, J. Hu and J. Li, RSC Adv., 2015, 5, 513–520 RSC.
- L. Pan, J.-J. Zou, S. Wang, X.-Y. Liu, X. Zhang and L. Wang, ACS Appl. Mater. Interfaces, 2012, 4, 1650–1655 CAS.
- Y. Wang, X. Li, N. Wang, X. Quan and Y. Chen, Sep. Purif. Technol., 2008, 62, 727–732 CrossRef CAS.
- J.-I. Fujisawa, R. Muroga and M. Hanaya, Phys. Chem. Chem. Phys., 2015, 17, 29867–29873 RSC.
- B. Neppolian, A. Bruno, C. L. Bianchi and M. Ashokkumar, Ultrason. Sonochem., 2012, 19, 9–15 CrossRef CAS PubMed.
- C. Chenthamarakshan, K. Rajeshwar and E. J. Wolfrum, Langmuir, 2000, 16, 2715–2721 CrossRef CAS.
- X. Zhang, N. Zhang, Y.-J. Xu and Z.-R. Tang, New J. Chem., 2015, 39, 6756–6764 RSC.
- Y. Fu, D. Sun, Y. Chen, R. Huang, Z. Ding, X. Fu and Z. Li, Angew. Chem., 2012, 124, 3420–3423 CrossRef.
- X. Liu, L. Pan, T. Lv, Z. Sun and C. Sun, RSC Adv., 2012, 2, 3823–3827 RSC.
- X. Liu, L. Pan, T. Lv, G. Zhu, Z. Sun and C. Sun, Chem. Commun., 2011, 47, 11984–11986 RSC.
- H. Eskandarloo, A. Badiei, M. A. Behnajady and G. M. Ziarani, RSC Adv., 2014, 4, 28587–28596 RSC.
- J. Zhao, Q. Han, J. Zhu, X. Wu and X. Wang, Nanoscale, 2014, 6, 10062–10070 RSC.
- J. Yu, S. Zhuang, X. Xu, W. Zhu, B. Feng and J. Hu, J. Mater. Chem. A, 2015, 3, 1199–1207 CAS.
- L. Shi, T. Wang, H. Zhang, K. Chang, X. Meng, H. Liu and J. Ye, Adv. Sci., 2015, 2, 1500006–1500014 CrossRef.
- R. Liang, L. Shen, F. Jing, W. Wu, N. Qin, R. Lin and L. Wu, Appl. Catal., B, 2015, 162, 245–251 CrossRef CAS.
- L. Shen, S. Liang, W. Wu, R. Liang and L. Wu, Dalton Trans., 2013, 42, 13649–13657 RSC.
- L. Shen, L. Huang, S. Liang, R. Liang, N. Qin and L. Wu, RSC Adv., 2014, 4, 2546–2549 RSC.
- L. Shen, W. Wu, R. Liang, R. Lin and L. Wu, Nanoscale, 2013, 5, 9374–9382 RSC.
- T. Kamegawa, S. Matsuura, H. Seto and H. Yamashita, Angew. Chem., Int. Ed., 2013, 52, 916–919 CrossRef CAS PubMed.
- G. Zhang and W. Choi, Chem. Commun., 2012, 48, 10621–10623 RSC.
- D. Chatterjee, Catal. Commun., 2010, 11, 336–339 CrossRef CAS.
- J. He, J. Wang, Y. Chen, J. Zhang, D. Duan, Y. Wang and Z. Yan, Chem. Commun., 2014, 50, 7063–7066 RSC.
- Y.-P. Yuan, L.-S. Yin, S.-W. Cao, G.-S. Xu, C.-H. Li and C. Xue, Appl. Catal., B, 2015, 168, 572–576 CrossRef.
- X.-L. Liu, R. Wang, M.-Y. Zhang, Y.-P. Yuan and C. Xue, APL Mater., 2015, 3, 104403 CrossRef.
- Y. Horiuchi, T. Toyao, M. Saito, K. Mochizuki, M. Iwata, H. Higashimura, M. Anpo and M. Matsuoka, J. Phys. Chem. C, 2012, 116, 20848–20853 CAS.
- M. Nasalevich, R. Becker, E. Ramos-Fernandez, S. Castellanos, S. Veber, M. Fedin, F. Kapteijn, J. Reek, J. Van Der Vlugt and J. Gascon, Energy Environ. Sci., 2015, 8, 364–375 CAS.
- J. He, Z. Yan, J. Wang, J. Xie, L. Jiang, Y. Shi, F. Yuan, F. Yu and Y. Sun, Chem. Commun., 2013, 49, 6761–6763 RSC.
- C. Wang and Z. Xie, J. Am. Chem. Soc., 2012, 134, 7211–7214 CrossRef CAS PubMed.
- V. Houlding and M. Gratzel, J. Am. Chem. Soc., 1983, 105, 5695–5696 CrossRef CAS.
- T. D. Savić, Z. V. Šaponjić, M. I. Čomor, J. M. Nedeljković, M. D. Dramićanin, M. G. Nikolić, D. Ž. Veljković, S. D. Zarić and I. A. Janković, Nanoscale, 2013, 5, 7601–7612 RSC.
- Z. Tachan, I. Hod and A. Zaban, Adv. Energy Mater., 2014, 4, 1301249 CrossRef.
Footnote |
| † Electronic supplementary information (ESI) available. See DOI: 10.1039/c6ta07685h |
|
| This journal is © The Royal Society of Chemistry 2017 |
Click here to see how this site uses Cookies. View our privacy policy here.