 Open Access Article
Creative Commons Attribution 3.0 Unported Licence
Microfluidic pumping by micromolar salt concentrations†
Ran
Niu‡
 a,
Patrick
Kreissl‡
b,
Aidan T.
Brown‡
c,
Georg
Rempfer
b,
Denis
Botin
a,
Christian
Holm
b,
Thomas
Palberg
a and
Joost
de Graaf
a,
Patrick
Kreissl‡
b,
Aidan T.
Brown‡
c,
Georg
Rempfer
b,
Denis
Botin
a,
Christian
Holm
b,
Thomas
Palberg
a and
Joost
de Graaf
 *c
*c
aInstitut für Physik, Johannes Gutenberg Universität Mainz, 55128 Mainz, Germany
bInstitute for Computational Physics, Universität Stuttgart, Allmandring 3, 70569 Stuttgart, Germany
cSUPA, School of Physics and Astronomy, University of Edinburgh, JCMB Kings Buildings, Edinburgh EH9 3FD, UK. E-mail: j.degraaf@ed.ac.uk
First published on 12th January 2017
Abstract
An ion-exchange-resin-based microfluidic pump is introduced that utilizes trace amounts of ions to generate fluid flows. We show experimentally that our pump operates in almost deionized water for periods exceeding 24 h and induces fluid flows of μm s−1 over hundreds of μm. This flow displays a far-field, power-law decay which is characteristic of two-dimensional (2D) flow when the system is strongly confined and of three-dimensional (3D) flow when it is not. Using theory and numerical calculations we demonstrate that our observations are consistent with electroosmotic pumping driven by μmol L−1 ion concentrations in the sample cell that serve as ‘fuel’ to the pump. Our study thus reveals that trace amounts of charge carriers can produce surprisingly strong fluid flows; an insight that should benefit the design of a new class of microfluidic pumps that operate at very low fuel concentrations.
Fluid, solute, and colloid transport on the microscale pose a significant challenge, due to external pressure-driven pumping requiring the pump itself to withstand large forces. To circumvent this issue, a range of microfluidic pumps has recently been developed,1–21 most of which exploit self-generated solute gradients. Typically, a solute-gradient-based (osmotic) pump consists of a source/sink of solute molecules, close to the surface of a sample cell. The solutes are produced/consumed either by chemical reactions on the surface of the pump,3–5,9,11–15,17–24 the pump slowly dissolving,8,22,24 or exchange reactions taking place within the pump.16,23 This sets up a concentration gradient in the fluid and along the surface of the sample cell. The interaction between the solutes and the surface causes a force on the fluid, which—coupled with the spatial heterogeneity of the solutes—leads to fluid flow, in a process that is referred to as osmosis.25
In osmotic pumps, the solute thus acts as ‘fuel’, which enables the pump to move fluid around. Such pumps generate relatively small forces applied over a much larger range of the fluid through long-ranged concentration gradients, thus overcoming the issues that face external pressure-driven pumps. Depending on the nature of the surface–solute interactions, neutral or Coulombic, the pump is either diffusioosmotic or electroosmotic. However, there is strong evidence that solute-density20 and thermal-convection18 effects can also play a role for large pumps.
A fundamental problem for microfluidic pumping based on osmosis is the need for a solute (gradient) in the fluid medium that also contains the material to be transported, since solutes can interact with the transported material. For instance, pumps that utilize catalytic decomposition of hydrogen peroxide3,4,13 or hydrazine5 are not biocompatible and these solutes will also react (unfavorably) with other materials. The working of pumps that instead employ enzymatic reactions to convert biomolecules, such as urease,18,20 will be inhibited when material that is transported reacts with the solute itself. This also limits their use in transporting biological material, which typically interacts with such biomolecules. To solve this issue, it is desirable to design pumps that are driven by unreactive solutes, preferably in minimal amounts, and that have a limited impact on their environment.
In this paper, we introduce a microfluidic pump that accomplishes this goal. Our pump is experimentally shown to function in almost completely deionized water for periods of over 24 h. We study the fluid flow by means of tracer velocimetry (close to the bottom of the sample cell) and show that the pumping speed is in the μm s−1 range over hundreds of μm. The dependence of this flow on the size of the pump and the added salt concentration in the system is also characterized. It is further experimentally demonstrated that solute-density and thermal-convection effects do not play a role in our system. We therefore hypothesize that our pump operates on trace amounts of ions present in the bulk fluid, by exchanging one species of ion for another, thereby generating a diffusion potential which drives electroosmotic flow. This sets it apart from other microfluidic pumps that generate flow by slow dissolution of the pump itself, see, e.g., ref. 8 and 22. Specifically, our pump only modifies the identity of the ionic species in the bulk, whereas dissolving pumps increase the bulk ion concentration.
Furthermore, we show experimentally that the decay of the flow velocity can be modified by changing the geometry of the sample cell on the mm length scale. The far-field, power-law decay of the speed with the radial distance r is either quasi-2D (∝r−1) for small cell heights (≤2 mm), or 3D (∝r−2) for tall cells (≥10 mm). Even in the quasi-2D regime, our system displays almost time-independent (steady-state) fluid flow profiles. This is surprising, as 2D diffusive systems are not expected to exhibit steady-state solutions.
We interpret our experimental findings using a combination of the numerical finite-element method (FEM) and analytic calculations. It is shown that the experimental observations can indeed be understood by the resin exchanging trace amounts of cations from its surroundings with protons from its interior. We estimate the relevant trace cation concentration to be in the low micromolar range. The experimental observations are further shown to be consistent with an electroosmotic pumping mechanism: the difference in ion mobility between the protons and the exchanged cations sets up a diffusion potential that causes flow toward the exchange resin in the absence of a net electrical current. The mechanism is the same as previously found for similar ion-exchange pumps16 as well as dissolving pumps.8,22 However, our results indicate that ion-exchange-resin-based microfluidic pumps have a surprisingly small lower bound to the ion concentration under which they can operate, which we chart in this paper.
In our numerical work, we directly model the electroosmotic flow generated by ion exchange in the geometry of the experiment. We employ steady-state solutions for the concentration fields, electrostatic potential, and fluid velocity using the FEM. These computations go far beyond the thin electrostatic screening limit that is typically considered for such systems and give insight into the flow throughout the cell. Using analytic theory, we investigate the time dependence of the flow in the quasi-2D far field. We use our analytic theory to prove that the experimentally observed steady-state flow can be explained by the fact that the flow is driven by concentration gradients. While the relevant solute concentrations evolve over time and have no steady state, the concentration gradients become time-independent beyond a characteristic, system-dependent diffusion time that we identify.
Finally, we can explain the scaling of our results with cell height in terms of interaction between the out-of-equilibrium ion fluxes and the confining geometry. Here, we observe qualitative, but not quantitative, agreement between the experiments and the numerical calculations. In the experiment, the power-law decay of the flow sets in unexpectedly close to the ion-exchange resin. We argue that this is due to the neglect of solute transport by advection in our calculations, which is necessary to make progress in both numerical and analytic theory. Accurately modeling the near-field effect of advection will be important to understanding the formation and performance of swimmers comprised of mobile ion-exchange resins and inert particles26 and therefore presents challenges for future study.
Our results on ion-exchange-resin-based microfluidic pumps lead to the startling finding that trace amounts of ions are sufficient to generate significant fluid flow, which is driven by diffusion-potential electroosmosis. This insight should prove instrumental for the design of new microfluidic pumps operating in close-to-deionized water, which is the natural and often desirable environment in which to perform experiments. It furthermore provides compelling evidence that the effect of small amounts of charge and minute ionic fluxes may have significant consequences in other systems, such as chemically self-propelled colloids.
1 Experiments
In this section, we describe the experimental setup for a single ion-exchange-resin pump and characterization of the tracer properties used in our velocimetry measurements. We also provide quantification of a wide range of resin pumps and tracers to show the generality of our findings. Finally, we study the impact of added salt on the pumping.1.1 Tracer characterization
Polystyrene (PS) tracers were used for the velocimetry (PIV) measurements of our ion-exchange-resin pump. Stock PS particle suspensions (Microparticle GmbH, Germany) were diluted with distilled water and thoroughly deionized using ion-exchange resin (Amberlite K306, Carl Roth GmbH + Co. KG, Karlsruhe, Germany). The electrophoretic mobilities of the PS tracers were determined using micro-electrophoresis in a custom-built, disposable setup. For this setup, we employed a Perspex cell 45 mm in height and with a square cross section (10 mm edge length). Based on the geometry of Uzgiris27,28 two platinum electrodes of width 1 mm were mounted into the center of the Teflon® cap sealing the cell. This ensures sufficient electrode-wall distances to effectively reduce stray-field-driven electroosmosis at the cell walls. The electrode spacing was set to 1 mm to obtain homogeneous electric fields and square-wave alternating voltages of ±1 V were applied by a function generator (PeakTeck 4060 by PeakTeck GmbH, Germany). The cell was mounted on the stage of a micro-electrophoresis instrument (Mark II, Rank Bros. Bottisham, Cambridge, UK) supplying ultramicroscopic illumination and particle tracks were imaged using exposure times of 3 s on a consumer digital single-lens reflex camera (DSLR; D800, Nikon, Japan).Electrophoresis of the tracers was performed in the horizontal direction, while the particles sedimented in the vertical direction due to gravity. Thus the trace of a single particle has a saw-tooth shape. The mobility of the particles μE was calculated from the averaged velocity in the horizontal direction vE and is given by μE = vE/E, with E the amplitude of the electric field. The obtained values of μE are listed in Table 1. The values of μE are relatively low due to the non-monotonic scaling of the electrophoretic mobility at low salt concentrations.29
| Type (—) | Diameter (μm) | μ E (10−8 m2 V−1 s−1) |
|---|---|---|
| PS1 | 1.7 ± 0.1 | −2.0 ± 0.2 |
| PS7 | 7.6 ± 1.0 | −2.6 ± 0.3 |
| PS10 | 10.4 ± 0.9 | −2.5 ± 0.3 |
| PS15 | 15.2 ± 0.9 | −2.5 ± 0.2 |
| PS15COOH | 15.5 ± 0.2 | −2.1 ± 0.2 |
1.2 Velocimetry for the ion-exchange-resin pump
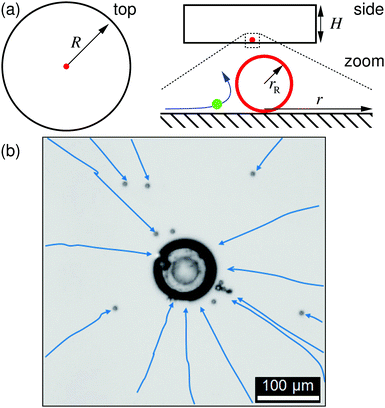
For the characterization of the ion-exchange-resin pumps via tracer velocimetry, we constructed custom sample cells of radius R = 10 mm and several heights H out of poly(methyl methacrylate) (PMMA) rings attached to a microscopy glass slide and covered with another glass slide (soda lime glass of hydrolytic class 3 by VWR International), see the sketch in Fig. 1a. The glass slides were washed with alkaline solution (Hellmanex® III, Hellma Analytics) by sonication for 30 min, then rinsed with tap water, and finally washed several times with doubly distilled water (distilled using a Quartz Hareaus Destamat; the conductivity was measured to be 55 nS cm−1). Spherical cationic resin beads (CGC50×8, Purolite Ltd, UK; exchange capacity 1.7 eq. L−1§) with radii ranging from 10 to 50 μm were carefully glued to the bottom glass slide with a tiny amount of two-component glue (UHU plus sofortfest, UHU GmbH, Germany), which was then set aside for 24 h to allow the glue to completely solidify. One resin bead was glued in each sample cell.The sample cell for the ion-exchange-resin pump experiments was loaded with a dilute PS-tracer suspension, prepared according to the above deionization procedure. It was subsequently mounted on the stage of an inverted scientific microscope (DMIRBE, Leica, Germany), and observed in bright field, typically at 5× magnification. Images were shot with a DSLR and videos recorded with standard video equipment at frame sizes of 5.2 Mpix and frame rates of 30 fps. We imaged an area with cross-section of (typically) larger than 1000 μm, slightly above the bottom glass plate, focusing on the average hovering height of gravitationally settled PS tracers, see Fig. 2.
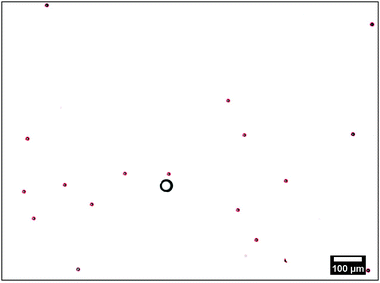 | ||
| Fig. 2 Typical microscopy image of the tracers (red outlined circles) around the ion-exchange resin (black circle). The red outlines are obtained using the fit algorithm explained in the text. | ||
The resin bead glued to the glass slide displayed significant fluid pumping, as evidenced by the PS tracers moving toward the individual resin beads; Supplemental Movie “Exchange_Resin_Pump.avi” gives an example of this for tracers close to the resin (ESI†). These tracers come in from far away along the substrate, move up vertically from the substrate close to the resin, then move radially away from the resin, subsequently sediment to the substrate away from the resin, and finally move back toward the resin along the substrate, leading to a recirculation of the tracer particles. Along their path the tracer speed varies as a function of r. The radial dependence of UPS was determined from the tracer positions in successive frames of the recorded movies. These positions were extracted using an in-house Python code. In brief: the circular perimeter of each particle was extracted using standard edge-detection methods, and then fitted to a circle using the Hough transform,30 implemented in the OpenCV function HoughCircle, see Fig. 2. Tracer positions in consecutive frames were compared to determine radial velocity. The velocity of a given tracer species for a specific ion-exchange-resin bead size was measured for 80–100 individual PS particles for each bead and the results averaged over some 40–50 beads.
We made use of the following expression to determine the tracer speed UPS
 | (1) |
![[r with combining circumflex]](https://www.rsc.org/images/entities/i_char_0072_0302.gif) is the 2D unit vector pointing from the resin to the tracer, Δ
is the 2D unit vector pointing from the resin to the tracer, Δ![[s with combining right harpoon above (vector)]](https://www.rsc.org/images/entities/i_char_0073_20d1.gif) is the displacement of the tracer between frames (time between frames Δt), “·” is the inner product, and 〈⋯〉 indicates averaging over all tracers that are a distance r from the resin's center.
is the displacement of the tracer between frames (time between frames Δt), “·” is the inner product, and 〈⋯〉 indicates averaging over all tracers that are a distance r from the resin's center.
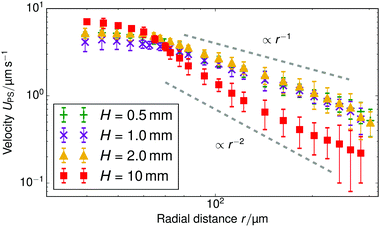
The results of our velocimetry are shown in Fig. 3, which provides UPS as a function of the radial distance. Two regimes can be distinguished. For r ≲ 75 μm, there is a slight increase in the tracer speed, followed by a maximum and subsequent decrease (this is more evident in Fig. 4). For r ≳ 75 μm the speed decreases with a power law and is appreciable over at least 300 μm. For sample cells with a height of H = 1 mm, we find that UPS ∝ r−0.9±0.1 in the far field (H = 0.5 mm, UPS ∝ r−1.2±0.1; H = 2 mm, UPS ∝ r−1.1±0.1), while for the sample with height H = 10 mm, the fitted decay is UPS ∝ r−2.2±0.3.
We concentrate on understanding the far-field regime throughout this paper, as in the near field there are several competing effects, including electrophoresis, local flow, and interaction with the substrate, which complicate understanding of the physics. For instance, it is difficult to assess on the strength of our experiments and the theory what the cause of the apparent near-field maximum in the tracer speed is. Fluid incompressibility could explain the decrease in speed close to the resin, i.e., an increasingly upward-directed component of the near-field flow requires a decrease in the horizontal component. However, other possibilities cannot be excluded at this time.
1.3 Resin size, tracer properties, and salt concentration
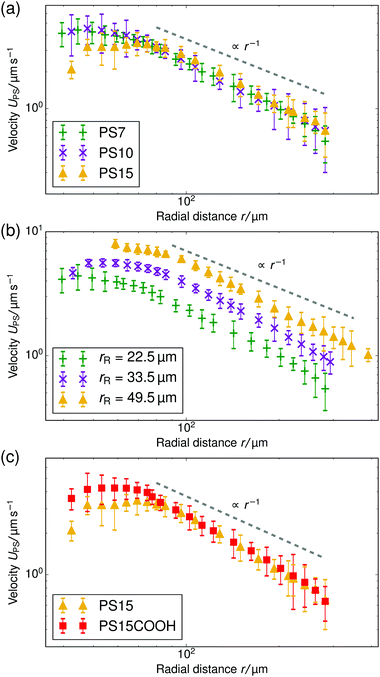
In this section we demonstrate the generality of the fluid pumping by ion-exchange resins. The systematic quantification of the tracer speed UPS as a function of r is shown in Fig. 4.• In Fig. 4a we vary the size of the PS tracers for tracers which have similar electrophoretic mobility. In the far-field region there is a power-law decay of the tracer speed, which is insensitive to the type of tracer used within the error bar. This shows that in the far-field the size of the tracer does not play a role.
• Fig. 4b shows results for three resin sizes (radius rR). A larger resin induces a stronger electroosmotic flow over a larger range. We analyzed the far-field tracer speed by fitting the three curves using power-law decays. Then, we established the speed at an arbitrary far-field distance (r = 150 μm) as a function of the size. For these three data points, we found a linear dependence through the origin UPS(r = 150 μm) ≈ rR × (5.5 ± 0.5) × 10−2 s−1; the offset ≈0.15 μm s−1 is negligible—similar scaling was observed for other far-field distances. This strongly indicates that the process is diffusion limited. By diffusion limited, we mean the upper speed limit imposed by the rate at which ions can diffuse towards the resin bead from the bulk reservoir. In this limit the flux through the particle surface js,dl (per unit area) is determined by the diffusivity of the ions D* and the concentration far away ρ*, with the familiar diffusion-limit scaling js,dl ∝ D*ρ*/rR (ref. 31). The speed is proportional to the total flux through the resin, i.e., UPS ∝ 4πrR2js,dl ∝ D*ρ*rR, giving the linear dependence with rR observed in the experiment.
• In Fig. 4c, we vary the electrophoretic mobility of the tracers, but not their size. It is evident that these tracer particles have the same velocity within the error bar in the power-law regime. This shows that the results are reproducible with nominally similar (μE is comparable within the error bar), but possibly slightly different particles.
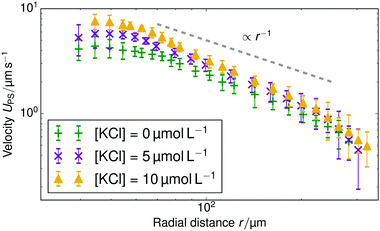
Finally, we added KCl solution (Merck KGaA, Germany) to the sample cell for H = 1 mm and the rR = 22.5 μm resin beads. Fig. 5 shows the change in tracer speed: adding 5 μmol L−1 KCl increases UPS, adding 10 μmol L−1 instead, increases the speed further. That is, a higher concentration of exchangeable ions induces stronger flow. However, at a KCl concentration of 80 μmol L−1, the velocity of tracer particles is effectively zero (therefore not shown here). For the 80 μmol L−1 sample, we also do not observe any Brownian motion of the tracer beads. This indicates that the beads have become firmly stuck to the sample cell wall, probably because of the increased electrostatic screening at this higher salt concentration. Therefore, we cannot use this 80 μmol L−1 data to infer a drop in pumping speed at higher salt concentration. This is in line with similar findings for chemically-propelled swimmers in ref. 32.
1.4 An inverted pump
We inverted our setup to check whether solute density variations or thermal convection effects played a role in our system, as is the case in ref. 18 and 20. That is, we glued the resin to the top glass slide and examined the movement of the tracers. In order to ensure that the tracers were at the top cover slide, we modified the overall density of the solution by adding glycerol (water![[thin space (1/6-em)]](https://www.rsc.org/images/entities/char_2009.gif) :
:![[thin space (1/6-em)]](https://www.rsc.org/images/entities/char_2009.gif) glycerol mass ratio of 1
glycerol mass ratio of 1![[thin space (1/6-em)]](https://www.rsc.org/images/entities/char_2009.gif) :
:![[thin space (1/6-em)]](https://www.rsc.org/images/entities/char_2009.gif) 0.3) to slightly exceed the density of our PS particles. We used tracers with a diameter of 3.3 μm here and we increased the size of the ion-exchange resin to rR = 250 μm, in order to increase the speed of the tracers in this mixture of higher viscosity (approximately double that of water).
0.3) to slightly exceed the density of our PS particles. We used tracers with a diameter of 3.3 μm here and we increased the size of the ion-exchange resin to rR = 250 μm, in order to increase the speed of the tracers in this mixture of higher viscosity (approximately double that of water).
Supplemental movie “Inverted_Resin_Pump.avi” shows the result of this experiment (ESI†). It is clear that inverting the pump did not change the direction in which the tracers move toward the resin. While we increased the overall density of the mixture, this should not affect the possible density variations induced by ion exchange. Our experiment therefore rules out density variation effects.
2 General considerations
We performed a theoretical/numerical analysis of the pump to gain understanding of the fluid flow observed in our experiments and to show that the observed fluid pumping is indeed caused by trace amounts of cations in the sample cell. In this section, we start with several general considerations to provide a background for our calculations.• The resin is designed to exchange H+ for other cations in the bulk, with a capacity of 1.7 eq. L−1. There are no decomposition-type surface reactions. Nor does our pump itself dissolve, as is the case in ref. 8 and 22.
• The surface of the sample cell is charged and we measured the zeta potential of the bottom glass slide to be ζ ≈ −(105 ± 5) mV.¶ The negative surface charge is due to the dissociation of surface groups, which release cations into the bulk. However, because the sample cell is filled with deionized water and carefully rinsed before preparation, there will be very few non-protonic cations present.
• Dissolved CO2 forms carbonic acid and thus creates cations in the form of protons that screen the wall charge. We measured a pH ∼ 5.4 at the onset of the experiment, consistent with typical pH values for water in equilibrium with atmospheric CO2.35 The cations associated with CO2 dissociation (protons) are the same as the ions inside the ion-exchange resin, so they cannot contribute to electroosmosis via ion exchange.
One might assume that the exchange resin cannot exchange protons for other cations, as any non-protonic cations released from the cell walls will have been washed away during preparation of the sample cell, according to our second point. This would then prevent ion-exchange-based electroosmosis.
However, we will argue that a very low concentration of cations remaining in the bulk after cleaning would be sufficient to fuel pumping. We estimate here the residual concentration of ions that would be required in this case. During a period of 24 h,|| a spherical pump of rR = 22.5 μm in radius exchanges at most a part of its ionic content via an (assumed) constant surface flux density js. Let us further assume 25% of the original content to account for an unmodified pumping speed over the course of the experiment. Then it follows from the resin size and exchange capacity that js ≲ 5 × 10⁻⁸ mol m−2 s−1. This value is reasonable, as similar numbers are found for self-electrophoretic Janus swimmers that move at speeds comparable to our maximum UPS (ref. 31). To make this level of exchange possible, the non-protonic cation concentration in the sample cell has to be at least 1 × 10⁻⁷ mol L−1—the total number of exchanged ions over 24 h and the volume of the sample cell were used to arrive at this number. Again, we can assume only a fraction of the total ions present are exchanged. This would lead to an estimate for the cation concentration of ρ* = 1 μmol L−1 (if 10% is exchanged). Such low ion concentrations could be contributed by “impurity” cations released from the glass slides into the bulk fluid following rinsing. Taking ρ* and a typical value for cation diffusivity of D* ≈ 2 × 10⁻⁹ m2 s−1, the surface flux in the diffusion-limited regime is js,dl ≈ D*ρ*/rR = 4 × 10⁻⁸ mol m−2 s−1 (using K+ for the cationic contaminant, which has a typical cation diffusivity). Our estimate for js is thus in the physically reasonable regime, close to the diffusion limit, in accordance with our experimental result.
This proposed mechanism of generating fluid flow by ion exchange is as follows. Exchanged protons moving away from the resin have a higher mobility than the to-be-exchanged cations moving toward the resin—H+ has the highest mobility of any ion—and thus the protons have a greater diffusive flux. To prevent bulk charge separation due to the difference in diffusivity, an electric field (E-field) is formed to compensate for the difference in diffusive flux with a migrative flux (via the E-field). The E-field points toward the resin and prevents charge separation in the bulk, by slowing down the H+ and accelerating the cations, such that the total fluxes remain equal and opposite throughout. Since the associated electrostatic potential stems from a difference in ion diffusivity (equivalently mobility) this mechanism is “diffusion potential” based.16,25 The E-field acts on all ions in the system. However, the E-field only exerts a significant force on the fluid in a screening layer close to the chamber boundaries, where there is an excess of cations. In the electrically neutral bulk, the E-field has a vanishingly small effect. The result is that the E-field drives fluid flow along the glass slides towards the resin, which then, through incompressibility, generates a backflow outwards along the horizontal center-plane of the chamber.
We verified that this simple picture and our estimates can indeed give rise to the observed flow speed and direction using finite-element-method (FEM) simulations representative of the experimental geometry, see Sections 4 and 5. We also used linearized, analytic theory to study the regime where the geometry can be considered as quasi-2D, i.e., for r > H, see Section 6. In both cases, we solved the associated time-dependent electrokinetic equations, which we discuss next.
3 Electrokinetic equations
To model the electroosmotic flow around the ion-exchange resin, we require three coupled equations, collectively known as the electrokinetic equations: Nernst–Planck for the solutes, Poisson for the electrostatics, and Stokes for the fluid flow, together with boundary conditions for the respective problems. We explain the three equations in detail below and discuss the boundary conditions for the simulations in Section 4 and the approximations made for the theory in Section 6, respectively.The Nernst–Planck equation describes the diffusion and migration of the solute species. Here, we consider three ionic solute species in the fluid, protons H+, potassium K+, and chloride Cl−. The protons are loaded in the exchange resin and the choice of the two other ions is arbitrary. Here, we selected two ions with almost equal diffusivities DK+ ≈ DCl− (ref. 36) to avoid the complication of additional (but relatively small) diffusion potentials. These three species are indexed by i ∈ {H+,K+,Cl−}, respectively. We write ρi for the time- and space-dependent concentration fields and Di for the molecular diffusivities. Then the flux of each species is given by
 | (2) |
![[u with combining right harpoon above (vector)]](https://www.rsc.org/images/entities/i_char_0075_20d1.gif) is the fluid velocity (accounting for advection), kB is Boltzmann's constant, T the temperature, e the elementary charge, zi the valency, Φ the electrostatic potential, and
is the fluid velocity (accounting for advection), kB is Boltzmann's constant, T the temperature, e the elementary charge, zi the valency, Φ the electrostatic potential, and  the gradient operator. The continuity equation is given by
 | (3) |
Before we move on to the other equations, we should comment on two simplifying assumptions typically made in the above description.
• We ignored the advective contribution to the flow in eqn (2) in all our calculations. We consider the Péclet number, which give the ratio of diffusion to advection, to examine whether this is reasonable. A simple estimate is as follows: using a typical length scale of H for the development of fluid flow in this problem, a typical non-protonic ion diffusivity of D ≈ 2.0 × 10⁻⁹ m2 s−1 (ref. 36), and a typical speed of ŪPS ≈ 1.0 μm s−1, we arrive at Pe = ŪPSH/D ≈ 5. This indicates that the value of Pe is probably high,** so the advective term should not be ignored in eqn (2). However, due to the computational complexity of our FEM calculations,†† as well as the need to linearize our analytic theory, this approximation must be made in order to make progress. As we will see, the understanding of the physics of the resin pump is not strongly affected by this reduction.
• We have ignored bulk ionic association–dissociation reactions, as described in ref. 31, which would have entered on the right-hand side of eqn (3) as coupled chemical source and sink terms. In the physical system, bulk exchange will lead to coupling of the H+ flux coming from the ion-exchange resin and H2O and OH− present in solution via H2O ⇌ H+ + OH−.‡‡ The main effect of these bulk reactions would be to replace the relevant diffusion rate DH+ with an effective rate
 | (4) |
The electrostatic potential fulfills the Poisson equation, which is given by
 | (5) |
 | (6) |
Finally, we have the incompressible Stokes equations to describe the fluid flow. These read
 | (7) |
 | (8) |
![[f with combining right harpoon above (vector)]](https://www.rsc.org/images/entities/i_char_0066_20d1.gif) the body-force density. Here,
the body-force density. Here, ![[u with combining right harpoon above (vector)]](https://www.rsc.org/images/entities/i_char_0075_20d1.gif) and
and ![[f with combining right harpoon above (vector)]](https://www.rsc.org/images/entities/i_char_0066_20d1.gif) are time-dependent quantities. Given the electrostatic potential and the densities of all (charged) species, we can specify the body-force density on the fluid to close the problem as
are time-dependent quantities. Given the electrostatic potential and the densities of all (charged) species, we can specify the body-force density on the fluid to close the problem as | (9) |
 | (10) |
4 Finite-element model of the pump
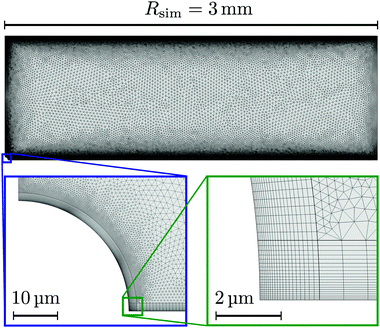
In this section we describe the boundary conditions for the above equation system and the specific choices made for the FEM modeling. Throughout, we used COMSOL Multiphysics® Solver 5.2a to numerically solve the electrokinetic equations for a model setup of the experimental geometry.We considered a 3D cylindrical portion of the microscopy cell, with the resin located on the symmetry axis of the cylinder. Due to the rotational symmetry of our setup, which corresponds closely to the experiment, the simulations could be performed on a quasi-2D axisymmetric domain, see Fig. 6. We considered two domains in order to simulate small sample heights H ≲ 1 mm (a) and large sample heights H ≳ 2 mm (b) for the steady-state electrokinetic equations; we will come back to this in Section 5. The latter domain is a half-open domain, which we will refer to as “unbound”.
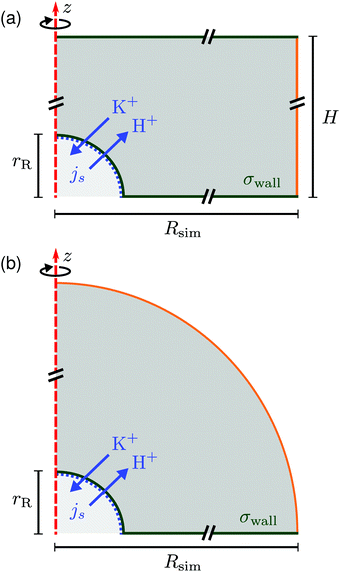 | ||
| Fig. 6 Schematic of the rotationally symmetric (a) top-bound and (b) “unbound” simulation domain, the red dashed line shows the symmetry axis. The resin is modeled as a hemisphere of radius rR (lower-left corner). Cation exchange is modeled by an inward/outward directed flux js of cations (K+) and protons (H+), respectively, see eqn (12). A constant surface charge density σwall is imposed on the bottom (and top wall) and on the resin. All solid surfaces form no-slip boundaries for the hydrodynamics. The right-most boundary (orange line (a) or a circular arc (b)) is an “open boundary” for the hydrodynamic problem and we impose a pre-computed electrostatic profile and ion distributions on it, as explained in the text. Cut lines are used to emphasize that the domain is much larger than the resin, see Fig. 7. | ||
Let us first describe the simulation domain that most accurately represents the experiment, see Fig. 6a. The bottom and top of the simulation domain correspond to the glass slides of the sample cell, the height of the sample cell H is fully resolved. The radius of the simulated geometry is Rsim. The spherical resin (experiment) is modeled as a hemisphere of radius rR attached to the lower boundary (substrate). We chose a hemi-spherical resin, rather than a fully spherical one—as in the experiment—for simulation convenience. Specifically, the choice of a hemispherical resin facilitates the use of quadrilateral elements for the mesh, see inset to Fig. 7. This meshing would not be possible for a resin sphere in contact with the substrate, as is likely the case in the experiment, due to the cusp-like feature present in that geometry.
Quadrilateral elements are necessary, since we use the spurious-flow reducing method of ref. 39–41. This method consists of finely meshing several Debye lengths (in our case 6) using such elements around the walls and the rest of the domain using triangular elements, see Fig. 7. Quadrilaterals have the advantage that larger aspect ratios are permitted than for triangles, before numerical instabilities become important in FEM. It should be noted that our choice of a hemispherical resin will only affect the near-field flow around the resin. Beyond a certain distance, the resin can be considered a point source for protons and sink for potassium ions, respectively, and the details of its shape thus become irrelevant. This far field is the regime of interest to us.
At the edge of the domain, there is an “open boundary” for the hydrodynamic problem. This implies that there is no fluid momentum flux through the boundary. Since there is no convective momentum transport in the Stokes equations, there can be flow, but no stress normal to the boundary. This is a standard technique to model a piece of a domain that is embedded in a larger physical region, without modeling the full geometry, but allowing for the flow lines not to be closed within the domain. The unbound simulation domain (Fig. 6b) is the same as the top-bound domain, but replaces the top glass slide with a hemispherical (open-boundary) domain.
We now provide the expressions for the boundary conditions used in the FEM model.
• For all solute species, no-penetration conditions are imposed in the Nernst–Planck equation on the bottom/top of the cell
 | (11) |
![[n with combining circumflex]](https://www.rsc.org/images/entities/i_char_006e_0302.gif) is the unit normal to the boundary pointing into the fluid.
is the unit normal to the boundary pointing into the fluid.
For the resin, we only impose no-penetration conditions for Cl−. The exchange of H+ and K+ is modeled via out- and influx on the resin, respectively. To be precise, we impose the following flux boundary condition
 | (12) |
At the outer edge of the domain, the orange line in Fig. 6a, we impose concentration profiles for the ions that are based on the Poisson–Boltzmann solution for a two plate geometry with height H and surface charge σwall. For the geometry of Fig. 6b, the solution to the Poisson–Boltzmann equation for a single plate was used.
• For the Poisson equation, we impose a constant surface charge density σwall on all solid surfaces via
 | (13) |
 | (14) |
• The boundary conditions for the incompressible Stokes equation are no-slip boundary conditions on all solid surfaces (![[u with combining right harpoon above (vector)]](https://www.rsc.org/images/entities/i_char_0075_20d1.gif) = 0), that is the bottom and top of the cell, plus the resin. At the outer edge of the domain, a no-normal stress boundary condition is applied, which reads
= 0), that is the bottom and top of the cell, plus the resin. At the outer edge of the domain, a no-normal stress boundary condition is applied, which reads
 | (15) |
![[Doublestruck I]](https://www.rsc.org/images/entities/char_e16c.gif) the identity matrix.
the identity matrix.
A final detail for the FEM solver is that we used polynomial ansatz functions of order 2 for the electrostatic, order 2 for the diffusion/migration, and order 3 + 2 for hydrodynamic equations. This is necessary in order to further reduce spurious flows. Despite these measures, as well as decoupling the solute and solvent problems by our low Pe assumption, extremely fine meshes are required, see Fig. 7, that push the boundaries of modern computational platforms in order to obtain convergence and sufficiently smooth results within a reasonable time.
4.1 Tracer speed
We determined the tracer speed from the solution of the above system of electrokinetic equations with boundary conditions as follows. The speedUPS = ![[u with combining right harpoon above (vector)]](https://www.rsc.org/images/entities/i_char_0075_20d1.gif) · ·![[r with combining circumflex]](https://www.rsc.org/images/entities/i_char_0072_0302.gif) + μE + μE![[E with combining right harpoon above (vector)]](https://www.rsc.org/images/entities/i_char_0045_20d1.gif) · ·![[r with combining circumflex]](https://www.rsc.org/images/entities/i_char_0072_0302.gif) , , | (16) |
![[u with combining right harpoon above (vector)]](https://www.rsc.org/images/entities/i_char_0075_20d1.gif) , and a component deriving from the electrophoretic mobility μE
, and a component deriving from the electrophoretic mobility μE![[E with combining right harpoon above (vector)]](https://www.rsc.org/images/entities/i_char_0045_20d1.gif) . We evaluate the velocity and electric field at a constant “equilibrium height”, h*, where gravity balances electrostatic repulsion from the wall. Throughout, we used a constant height of h* = 5 μm. The exact height in the experiment is difficult to measure, presumably varies locally, and changes with the environment. We therefore varied h* between 4 μm and 10 μm to check how our specific choice affected the result. The resulting speed profiles turned out to be virtually the same in this range. This is because the fluid flow velocity, which is the major component in the tracer speed, varies over a typical length scale of order H ≫ h*. Note that eqn (16) treats the tracer particle as if it were a point-like object, i.e., it does not perturb the flow and electric fields by its presence. In general we found that including the second term in eqn (16) does not significantly modify the UPS, leading us to conclude that advection indeed dominates over electrophoretic effects for the tracer motion.
. We evaluate the velocity and electric field at a constant “equilibrium height”, h*, where gravity balances electrostatic repulsion from the wall. Throughout, we used a constant height of h* = 5 μm. The exact height in the experiment is difficult to measure, presumably varies locally, and changes with the environment. We therefore varied h* between 4 μm and 10 μm to check how our specific choice affected the result. The resulting speed profiles turned out to be virtually the same in this range. This is because the fluid flow velocity, which is the major component in the tracer speed, varies over a typical length scale of order H ≫ h*. Note that eqn (16) treats the tracer particle as if it were a point-like object, i.e., it does not perturb the flow and electric fields by its presence. In general we found that including the second term in eqn (16) does not significantly modify the UPS, leading us to conclude that advection indeed dominates over electrophoretic effects for the tracer motion.
4.2 Parameter choices
We made the following parameter choices to simulate the experimental system. For the geometry of the simulation setup we typically chose: rR = 25 μm for the radius of the resin and Rsim = 3 mm for the radius of the cylindrically symmetric domain. This choice was a compromise between the size of the sample cell, which is too large to numerically simulate in its entirety, and a domain size on which the power-law decay in the fluid velocity was observable in the steady-state FEM calculations. The height of the domain was chosen to match the relevant experimental setup, e.g., H = 1 mm, with the open simulation domain representing the H = 10 mm domain, as we explain in Section 5.The fluid represents water at room temperature (T = 298.15 K), which has a mass density of ρf = 1.0 × 10³ kg m−3, viscosity η = 8.9 × 10⁻⁴ Pa s, and relative permittivity εr = 78.4. The diffusivities of the ionic species are DH+ = 9.3 × 10⁻⁹ m2 s−1 (ref. 43) and DK+ = DCl− = 2.0 × 10⁻⁹ m2 s−1 (ref. 36). The bulk concentration of impurities was chosen to be  , in line with our estimates from the experiment, and
  or
or  , with
  . The ion-exchange rate coefficient kex = 3.08 × 10⁻⁶ m s−1 was obtained by fitting the near-field velocity to the experiment for H = 1 mm in Fig. 3. The surface charge density σwall = −4.03 × 10⁻⁴ C m−2 was computed from the experimentally measured zeta potential ζ ≈ −0.1 V using the Grahame eqn (14), see ref. 42.
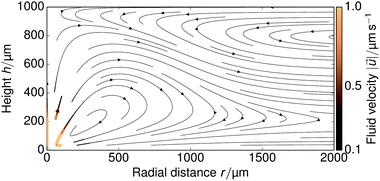
5 Finite-element results
The FEM-computed fluid flow for the steady-state problem is shown in Fig. 8 for a large portion of the sample cell; we used H = 1 mm. Both on the top and bottom wall the fluid flow is radially inward, due to the electroosmotic driving near the walls, with swirl-like patterns forming in the middle of the cell, due to the incompressibility of the fluid.Fitting the near-field tracer speed UPS for a cation concentration of ρ = 1 μmol L−1 to the H = 1 mm profile in Fig. 3, we found that kex = 3.08 × 10⁻⁶ m s−1 is sufficient to match the experimentally observed near-field speed—compare Fig. 3 and 9a. We used this parameter throughout our simulations. This gives rise to an average surface flux of js ≈ 7 × 10⁻⁸ mol m−2 s−1, which corresponds closely to our back-of-the-envelope estimate in Section 2. This shows that the experimentally observed tracer speeds can indeed be explained by ion exchange of trace amounts of cationic impurities in the μmol L−1 range.
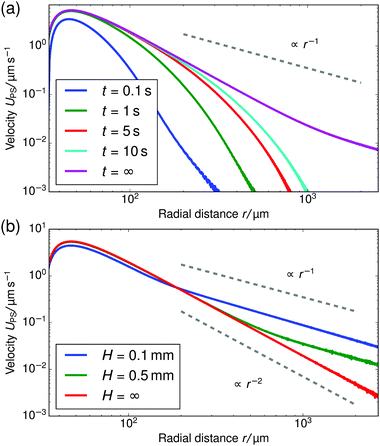
First, we verified that our steady-state solution for the quasi-2D domain gives a reasonable result, when compared to the time-dependent simulations. We considered a cell height of H = 0.2 mm for this problem. This choice allowed us to reduce the number of mesh elements required compared to the typical experimental height H = 1.0 mm and thereby improve the computational time sufficiently to access second time scales. Fig. 9a shows several time-dependent tracer speed curves, up to the maximum time of t = 10 s that we could access with our FEM calculations (several days of computer run time). Note that for these times, the long-time, far-field power-law decay has not yet set in. We estimate the time for this decay to set in, using the time it takes H+ ions to diffuse a distance H: tH+ = H2/DH+ ≈ 400 s. This time is short on the time scale of the experiment, but too long to access via FEM calculations, which is why we consider analytic theory in Section 6. Nevertheless, the near-field solution has begun to converge to the steady-state after 10 s. Considering the relatively short time scales compared to the length of the experiment, on which convergence should take place, we are justified in neglecting the time-dependence in the FEM calculations.
Second, we considered the far-field r−1 scaling in our steady-state simulations in Fig. 9b. For increasing H there is an increasingly large intermediate range of 3D decay with r−2. This is to be expected, because the minimum length (equivalently the time, in the time-dependent problem) that the ions travel before the quasi-2D decay sets in will increase with the height. This also explains the experimental observation of r−2 scaling for the H = 10 mm sample cell in Fig. 3, since for this height the transition time can be estimated to be tH+ = H2/DH+ ≈ 1.0 × 10⁴ s, which is long compared to the experimental time scale (typical velocity measurements take place within an hour after sample preparation).
When solving the steady-state system of equations on the geometry of Fig. 6a, the flow field always decays with r−1 in the far field. This is because in the steady-state problem a sufficient amount of time has passed for the ions to “become aware” of their confinement, i.e., stationarity is analogous to t → ∞ in the time-dependent problem. Therefore, the experimentally obtained transition from quasi-2D to 3D decay by increasing the height H, cannot be observed in such a simulation. To observe a r−2 decay in the steady-state far field, an unbound domain must be simulated instead. Hence the need for the geometry of Fig. 6b.
Finally, comparing Fig. 3 and 9b, we find that the regime in which the power-law decay sets in is much closer to the resin in the experiment, i.e., around 75 μm. This is counterintuitive, since on the basis of simple geometry arguments one would expect the ions to become aware of their 2D confinement when the distance they have diffused becomes comparable to the confining height. This suggests that there are mechanisms by which the ions are transported faster than through diffusion alone. A clear candidate is advection via the fluid flow, as the flow field around the resin, see Fig. 8, causes significant vertical displacement of the near-resin ions, provided the Péclet number is sufficiently large. We already estimated in Section 3 that this is likely the case. Unfortunately, the effect of advection cannot be incorporated in this work due to current limitations in computational performance for our FEM modelling, so that a quantitative match between theory and experiment is left for future study. Nevertheless, the qualitative behavior that we do capture together with our geometric arguments already provide important insights into the pumping mechanism.
6 Analytical calculations
In this section, we present an approximate, analytical solution to the electrokinetic equations on the domain of the sample cell. This allows us to obtain the time dependence and radial scaling of the flow in the far field. Our solution makes use of the equations provided in Section 3, where we already made the following simplifying assumptions: (i) Advection can be neglected. (ii) The only ions present are H+, K+, and Cl−. (iii) The diffusivities of K+ and Cl− ions are equal. In order to make progress analytically, we also require: (iv) The perturbation of the ionic concentrations from their equilibrium distributions due to ionic fluxes generated by the resin bead are small compared to the background ionic concentrations—this is likely to be strictly valid only at short times or far from the central bead. (v) Far enough from the resin bead, the solution can be treated as 2D, and the bead as a point (δ-function) source. This means that our geometry is essentially a 2D disk, rather than the 3D cylinder segment of the FEM setup, with the fluxes of the species independent of the vertical position in the sample cell. (vi) The electrostatic Debye screening length κ is much shorter than the relevant length scales of the problem, which are of order H. (vii) The resin bead produces constant, equal and opposite fluxes of H+ outwards and K+ inward.Under the above assumptions, we can combine eqn (2) and (3) to obtain
 | (17) |
 | (18) |
| ∂txCl− = DCl−∇22D(xCl− − ψ), | (19) |
![[u with combining right harpoon above (vector)]](https://www.rsc.org/images/entities/i_char_0075_20d1.gif) . The final term in eqn (17) and (18) represents the steady production of H+ and consumption of K+ at the origin. Here, the 2D radial vector
. The final term in eqn (17) and (18) represents the steady production of H+ and consumption of K+ at the origin. Here, the 2D radial vector ![[r with combining right harpoon above (vector)]](https://www.rsc.org/images/entities/i_char_0072_20d1.gif) =
= ![[x with combining right harpoon above (vector)]](https://www.rsc.org/images/entities/i_char_0078_20d1.gif) +
+ ![[y with combining right harpoon above (vector)]](https://www.rsc.org/images/entities/i_char_0079_20d1.gif) (r = |
(r = |![[r with combining right harpoon above (vector)]](https://www.rsc.org/images/entities/i_char_0072_20d1.gif) |) and δ2D is the 2D δ-function, which is normalized so that
|) and δ2D is the 2D δ-function, which is normalized so that  , with the integral running over the whole plane. Γ is the total production rate of H+ in molecules
![[thin space (1/6-em)]](https://www.rsc.org/images/entities/char_2009.gif) s−1. Note that we do not make Γ dependent on ρK+, as in the FEM model, to avoid complicating our calculation.
s−1. Note that we do not make Γ dependent on ρK+, as in the FEM model, to avoid complicating our calculation.
Linearizing the Poisson equation, eqn (5) and defining the dimensionless background concentrations  gives
gives
 | (20) |
We now apply the thin-Debye-layer approximation (vi). Since we are interested in distances from the origin r ≫ H, the capillary height, this approximation can be quantified as κr ≫ 1, and the approximation involves making an expansion to lowest order in the small parameter 1/(κr). Now, from eqn (17)–(19), we must have that ψ and xi are of similar order. However, if we multiply eqn (20) by r2, we see that the right-hand side is of order unity since ∇22D = ![[scr O, script letter O]](https://www.rsc.org/images/entities/char_e52e.gif) (r−2), but the left-hand side is of order κ2r2. This means that, for consistency, the sum on the left-hand side of eqn (20) must be zero to lowest order in 1/(κr), i.e.,
(r−2), but the left-hand side is of order κ2r2. This means that, for consistency, the sum on the left-hand side of eqn (20) must be zero to lowest order in 1/(κr), i.e.,
 | (21) |
| 2xH+α + xK+(1 − 2α) = xCl−. | (22) |
Eqn (17)–(19) together with eqn (22) represent a linear system of equations that we will now solve. From linear combinations of eqn (17)–(19), we can eliminate ψ, and eqn (22) allows us to also eliminate xCl−. This leaves us with two equations for xH+ and xK+
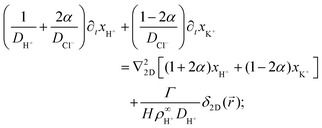 | (23) |
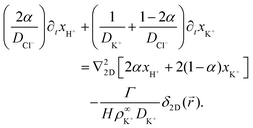 | (24) |
We solve these equations using the ansatz functions
 | (25) |
 | (26) |
 | (27) |
![[D with combining tilde]](https://www.rsc.org/images/entities/i_char_0044_0303.gif) m, m ∈ {1,2} are effective diffusivities to be determined. Directly solving for these effective diffusivities in general yields extremely unwieldy expressions, so instead we first make the simplifying assumption (iii) that DK+ = DCl−. This gives
m, m ∈ {1,2} are effective diffusivities to be determined. Directly solving for these effective diffusivities in general yields extremely unwieldy expressions, so instead we first make the simplifying assumption (iii) that DK+ = DCl−. This gives![[D with combining tilde]](https://www.rsc.org/images/entities/i_char_0044_0303.gif) 1 = DK+; 1 = DK+; | (28) |
 | (29) |
| A = 0; | (30) |
| B = 1; | (31) |
 | (32) |
 | (33) |
 | (34) |
 | (35) |
The potential in eqn (35) will generate an equal slip-velocity  on both the upper and lower surfaces of the channel; we are sufficiently far away from the resin that the asymmetry caused by it being glued to the bottom wall should not strongly affect the flow field. From eqn (35) we then obtain
 | (36) |
![[u with combining right harpoon above (vector)]](https://www.rsc.org/images/entities/i_char_0075_20d1.gif) slip is the velocity at the outer edge of the Debye layer. However, in the thin Debye limit, we can take
slip is the velocity at the outer edge of the Debye layer. However, in the thin Debye limit, we can take ![[u with combining right harpoon above (vector)]](https://www.rsc.org/images/entities/i_char_0075_20d1.gif) slip to be the fluid velocity on the wall itself. In the bulk of the channel, the fluid flow will vary with a typical length scale H, the capillary height. Therefore, we can use
slip to be the fluid velocity on the wall itself. In the bulk of the channel, the fluid flow will vary with a typical length scale H, the capillary height. Therefore, we can use ![[u with combining right harpoon above (vector)]](https://www.rsc.org/images/entities/i_char_0075_20d1.gif) slip as a good estimate for the velocity
slip as a good estimate for the velocity ![[u with combining right harpoon above (vector)]](https://www.rsc.org/images/entities/i_char_0075_20d1.gif) PS(z) of a tracer particle located a small distance z ≪ H above the capillary surface, with a fractional error
PS(z) of a tracer particle located a small distance z ≪ H above the capillary surface, with a fractional error ![[scr O, script letter O]](https://www.rsc.org/images/entities/char_e52e.gif) (z/H) < 10−2 for the channels used here.
(z/H) < 10−2 for the channels used here.
Fig. 10 shows the tracer speed UPS as a function of the distance as calculated using eqn (36) for a sample cell with H = 0.2 mm and other parameters the same as in Fig. 9a. Since the theory does not use the same expression for the surface fluxes (vii), we selected a molecular exchange rate of Γ = 2 × 10⁸ s−1 to give reasonable speed correspondence when compared to the results in Fig. 9a. At long times, i.e., for t ≫ r2/![[D with combining tilde]](https://www.rsc.org/images/entities/i_char_0044_0303.gif) 2, the exponential term approaches unity, so we obtain the 1/r scaling observed experimentally. At short times, the exponential term dominates, so we obtain the rapid radial decays seen in the FEM calculations in Fig. 9a.
2, the exponential term approaches unity, so we obtain the 1/r scaling observed experimentally. At short times, the exponential term dominates, so we obtain the rapid radial decays seen in the FEM calculations in Fig. 9a.
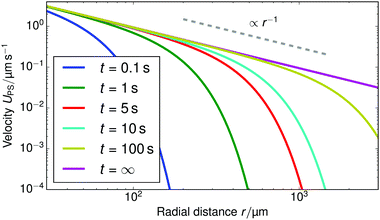 | ||
| Fig. 10 The tracer speed UPS obtained using our analytic theory as a function of the radial distance r for several times t, for PS7 tracers in a sample cell with height H = 0.2 mm, pH = 7, and Γ = 2 × 10⁸ s−1; this models the setup of Fig. 9a. The steady-state solution is given by the purple curve (t = ∞). The gray dashed line serves as a guide to the eye for the power-law decay. | ||
Note that, as we would expect for a 2D system, the electrostatic field in eqn (35) (as well as the ion density profiles) is not in steady state—the integral approaches log(t) in the limit of large t. Nevertheless, the flow field in eqn (36) does approach a steady-state solution, see Fig. 10, because it scales with the gradient  , which is in steady state. This is in line with our experimental observations, where we observed the same tracer-velocity trends after 24 h of pumping, albeit with decrease in speed by a factor of two. The latter can be attributed to depletion of the trace amounts of cations in the cell or a reduction in the effectiveness with which the resin exchanges ions. These results further underpin our conclusion that the microfluidic pumping is driven by ion exchange of trace amounts of cationic species in the sample cell.
The correspondence to the FEM calculations (Fig. 9a) is semi-quantitative, despite the additional simplifying assumptions. However, it should be noted that we cannot make a prediction for the near field using the theory, due to the quasi-2D assumption (v), nor do we account for advection of the solutes (i). This means that we cannot expect, nor do we find, quantitative agreement with the experiment.
7 Discussion and outlook
In summary, we have introduced and characterized an ion-exchange-resin-based microfluidic pump. The striking feature of this pump is that it operates in μmol L−1 ionic concentrations for periods exceeding 24 h and yet manages to produce fluid flows with speeds of several μm s−1 over hundreds of μm, without strongly modifying its environment.We demonstrated that our pump uses trace amounts of cations to generate fluid flow using a combination of tracer velocimetry experiments, analytic electrokinetic theory, and finite-element-method simulations. These together show that fluid flow is achieved via electroosmosis, by the exchange of cations for protons in its interior. The difference in ionic mobility between the cations and the protons, for which they are exchanged, sets up a diffusion potential that points towards the resin and causes fluid flow in this direction. The speed of pumping can be modified by varying the bulk cation concentration in the μmol L−1 range.
Our pump has several advantages over other microfluidic pumps that also exploit diffusion-potential-based electroosmosis, e.g., small pieces of salt that slowly dissolve.8,22 Firstly, ion-exchange pumps only modify the nature of the bulk ions, not their net concentration. Secondly, as a pump dissolves, it might change shape, thereby inducing an undesirable directionality to the pumping. Our system does not have this disadvantage, as our spherical ion-exchange resins retain their shape throughout. Thirdly, ion exchange using protons as the exchangeable cation has the advantage of setting up significant diffusion potentials (and hence flow), due to the strong difference in diffusivity between the proton and any exchanged cationic species. Finally, the ion-exchange-resin pump functions for very long times in a low-ionicity medium—over 24 h—compared to the much shorter operating times of dissolving micropumps, which were indicated to be around 20 min in ref. 22.
The range of our pump can be tuned via the height of the sample cell to give rise to either 3D or quasi-2D decay of the far-field flow velocity, i.e., power-law decay with the relevant exponent. We have thus demonstrated that significant microfluidic pumping can be achieved at very low fuel (cation) concentrations and can be sensitively tuned via the geometry. This tunability can be exploited to self-assemble single colloidal crystals.23
In our modeling of the experiment it proved necessary to ignore the advective contributions to the ionic fluxes. This simplifying assumption is the likely cause of the quantitative (but not qualitative) differences between the theory and experiment. We argue in favor of including advective (fluid flow) contributions to the ionic fluxes in any future modeling of these systems, as this is important in understanding the near-field fluid flow around the ion-exchange resin, and to extract the kinetics of ion exchange from far-field flow and concentration profile measurements.
Presently, we are only able to indicate that the ion-exchange process is likely diffusion limited in our system. Future experimental work will focus on pH measurements to quantify the exchange process, while the nature of the decay in these concentration profiles will be further examined using numerical approaches. For the latter, the use of a boundary-layer approach to rescale the high Péclet number regime and make these problems computationally tractable will be explored. Furthermore, capturing the near-field flow accurately will be relevant to understanding the formation of self-assembled cooperative swimmers based on mobile ion-exchange resins and tracer particles.26
In conclusion, our system showcases the significance of very small ionic concentrations and fluxes in microfluidic settings. This suggests that such fluxes may be responsible for flow and motion in a much wider range of out-of-equilibrium systems, such as for chemical swimmers and in biological processes, and should be considered in future modeling thereof.
Acknowledgements
JdG gratefully acknowledges financial support from a Marie Skłodowska-Curie Intra European Fellowship (G.A. No. 654916) within Horizon 2020. JdG and CH, as well as RN, DB, and TP, further thank the DFG for funding through the SPP 1726 “Microswimmers—From Single Particle Motion to Collective Behavior” (HO1108/24-1 & Pa459/18-1).References
- H. Andersson, W. Van Der Wijngaart, P. Nilsson, P. Enoksson and G. Stemme, Sens. Actuators, B, 2001, 72, 259 CrossRef CAS.
- J. Santiago and D. Laser, J. Micromech. Microeng., 2004, 14, R35 CrossRef.
- T. Kline, W. Paxton, Y. Wang, D. Velegol, T. Mallouk and A. Sen, J. Am. Chem. Soc., 2005, 127, 17150 CrossRef CAS PubMed.
- W. Paxton, P. Baker, T. Kline, Y. Wang, T. Mallouk and A. Sen, J. Am. Chem. Soc., 2006, 128, 14881 CrossRef CAS PubMed.
- M. Ibele, Y. Wang, T. Kline, T. Mallouk and A. Sen, J. Am. Chem. Soc., 2007, 129, 7762 CrossRef CAS PubMed.
- S. Chang, V. Paunov, D. Petsev and O. Velev, Nat. Mater., 2007, 6, 235 CrossRef CAS PubMed.
- A. Nisar, N. Afzulpurkar, B. Mahaisavariya and A. Tuantranont, Sens. Actuators, B, 2008, 130, 917 CrossRef CAS.
- M. Ibele, T. Mallouk and A. Sen, Angew. Chem., Int. Ed., 2009, 48, 3308 CrossRef CAS PubMed.
- I.-K. Jun and H. Hess, Adv. Mater., 2010, 22, 4823 CrossRef CAS PubMed.
- A. Shields, B. Fiser, B. Evans, M. Falvo, S. Washburn and R. Superfine, Proc. Natl. Acad. Sci. U. S. A., 2010, 107, 15670 CrossRef CAS PubMed.
- Y. Hong, M. Diaz, U. Córdova-Figueroa and A. Sen, Adv. Funct. Mater., 2010, 20, 1568 CrossRef CAS.
- T. Hogg and R. Freitas, Nanomedicine, 2010, 6, 298 CAS.
- A. Solovev, S. Sanchez, Y. Mei and O. Schmidt, Phys. Chem. Chem. Phys., 2011, 13, 10131 RSC.
- H. Zhang, K. Yeung, J. Robbins, R. Pavlick, M. Wu, R. Liu, A. Sen and S. Phillips, Angew. Chem., Int. Ed., 2012, 51, 2400 CrossRef CAS PubMed.
- V. Yadav, H. Zhang, R. Pavlick and A. Sen, J. Am. Chem. Soc., 2012, 134, 15688 CrossRef CAS PubMed.
- A. Reinmüller, E. Oğuz, R. Messina, H. Löwen, H. Schöpe and T. Palberg, J. Chem. Phys., 2012, 136, 164505 CrossRef PubMed.
- A. Farniya, M. Esplandiu, D. Reguera and A. Bachtold, Phys. Rev. Lett., 2013, 111, 168301 CrossRef PubMed.
- S. Sengupta, D. Patra, I. Ortiz-Rivera, A. Agrawal, S. Shklyaev, K. Dey, U. Córdova-Figueroa, T. Mallouk and A. Sen, Nat. Chem., 2014, 6, 415 CrossRef CAS PubMed.
- M. Esplandiu, A. Afshar Farniya and A. Bachtold, ACS Nano, 2015, 9, 11234 CrossRef CAS PubMed.
- I. Ortiz-Rivera, H. Shum, A. Agrawal, A. Sen and A. Balazs, Proc. Natl. Acad. Sci. U. S. A., 2016, 113, 2585 CrossRef CAS PubMed.
- C. Zhou, H. Zhang, Z. Li and W. Wang, Lab Chip, 2016, 16, 1797 RSC.
- J. McDermott, A. Kar, M. Daher, S. Klara, G. Wang, A. Sen and D. Velegol, Langmuir, 2012, 28, 15491 CrossRef CAS PubMed.
- R. Niu, E. C. Oğuz, H. Müller, A. Reinmüller, D. Botin, H. Löwen and T. Palberg, Phys. Chem. Chem. Phys., 2017, 1 10.1039/C6CP07231C.
- D. Velegol, A. Garg, R. Guha, A. Kar and M. Kumar, Soft Matter, 2016, 12, 4686 RSC.
- J. L. Anderson, Annu. Rev. Fluid Mech., 1989, 21, 61 CrossRef.
- R. Niu, D. Botin, A. Reinmüller and T. Palberg, 2016, arXiv 1610.04723, 1.
- E. Uzgiris, Rev. Sci. Instrum., 1974, 45, 74 CrossRef CAS PubMed.
- E. Uzgiris, Prog. Surf. Sci., 1981, 10, 53 CrossRef CAS.
- B. Midmore, G. Pratt and T. Herrington, J. Colloid Interface Sci., 1996, 184, 170 CrossRef CAS PubMed.
- P. Hough, International conference on high energy accelerators and instrumentation, 1959 Search PubMed.
- A. Brown, W. Poon, C. Holm and J. de Graaf, Soft Matter, 2017, 1 10.1039/C6SM01867J.
- A. Brown and W. Poon, Soft Matter, 2014, 10, 4016 RSC.
- T. Palberg, T. Köler, B. Sieber, H. Schweinfurth, H. Reiber and G. Nägele, J. Phys.: Condens. Matter, 2012, 24, 464109 CrossRef PubMed.
- Á. Delgado, F. González-Caballero, R. Hunter, L. Koopal and J. Lyklema, J. Colloid Interface Sci., 2007, 309, 194 CrossRef PubMed.
- F. Millero, Geochim. Cosmochim. Acta, 1995, 59, 661 CrossRef CAS.
- H. Harned and R. Nuttall, J. Am. Chem. Soc., 1949, 71, 1460 CrossRef CAS.
- U. Córdova-Figueroa and J. Brady, Phys. Rev. Lett., 2008, 100, 158303 CrossRef PubMed.
- G. Rempfer, G. Davies, C. Holm and J. de Graaf, J. Chem. Phys., 2016, 145, 044901 CrossRef PubMed.
- G. Rempfer, S. Ehrhardt, C. Holm and J. de Graaf, Macromol. Theory Simul., 2016, 1 DOI:10.1063/1.4968596.
- G. Rempfer, S. Ehrhardt, N. Laohakunakorn, G. Davies, U. Keyser, C. Holm and J. de Graaf, Langmuir, 2016, 32, 8525 CrossRef CAS PubMed.
- P. Kreissl, C. Holm and J. de Graaf, J. Chem. Phys., 2016, 144, 204902 CrossRef PubMed.
- D. Grahame, Chem. Rev., 1947, 41, 441 CrossRef CAS PubMed.
- CRC handbook of chemistry and physics, ed. W. M. Haynes, CRC Press, Boca Raton, USA, 93rd edn, 2013 Search PubMed.
- S. Shin, E. Um, B. Sabass, J. Ault, M. Rahimi, P. Warren and H. Stone, Proc. Natl. Acad. Sci. U. S. A., 2016, 113, 257 CrossRef CAS PubMed.
Footnotes |
| † Electronic supplementary information (ESI) available: Movies for the ion-exchange-resin pumps. See DOI: 10.1039/c6sm02240e |
| ‡ These authors contributed equally to this work. |
| § The eq. stands for amount of charge that the resin can exchange (here per liter of resin): 1 eq. = 1 mol of monovalent ions, 0.5 mol of divalent ions, etc. |
| ¶ We used Doppler velocimetry with PS tracers,33 originally designed to measure bulk electrokinetics in colloidal suspensions, to determine the electroosmotic mobility μwall of cleaned glass slides using a custom made cell with exchangeable sides for the top and bottom. Standard electrokinetic theory was used to calculate the zeta potential from the mobility.34 |
| || We experimentally measured a tracer speed decrease of only a factor 2 over a 24 h period, justifying the assumption of almost constant pumping. The shape of the speed profile remained unchanged. |
| ** We believe that in practice the Pe number is likely to be self-limiting to a value ≈1, as found for chemically propelled swimmers.37 This is because the high-concentration-gradient region centered around the colloid would be expelled into the bulk of the channel by a strong advective current—see the direction of the flow lines in Fig. 8—where it would no longer contribute strongly to electrophoretic flow generation. |
| †† Making the Pe = 0 assumption allows us to split the solute and solvent problems and solve them in series, rather than in parallel, leading to a strong reduction in the required mesh resolution and therefore of computer memory. |
| ‡‡ There will be similar association–dissociation reactions involving dissolved CO2 in water, as well as other species. The arguments provided here apply equally to these reactions. |
| This journal is © The Royal Society of Chemistry 2017 |

