Organic thermoelectric devices based on a stable n-type nanocomposite printed on paper†
Salim
Ferhat
 *a,
Christophe
Domain
b,
Julien
Vidal
b,
Didier
Noël
b,
Bernard
Ratier
a and
Bruno
Lucas
a
aUniv. Limoges, CNRS, XLIM, UMR 7252, F-87000 Limoges, France. E-mail: salim.ferhat@xlim
bEDF R&D, Site des Renardières, avenue des Renardières – Ecuelles, 77818 Moret-sur-Loing cedex, France
First published on 5th October 2017
Abstract
We present a fully inkjet-printed flexible thermoelectric device using organic and organic/inorganic hybrid materials. As part of our effort in the development of an n-type material, we present an approach to synthesize a solution processable thermoelectric hybrid material based on in situ oxidative polymerization and intercalation that can yield layered quasi two-dimensional superlattice structures. Thus, we have inserted poly(3,4-ethylenedioxythiophene) (PEDOT) within the nanotemplates of vanadium pentoxide gel (V2O5·nH2O) in order to enhance the charge carrier concentration. Furthermore, for the first time, we adapted the hybrid (PEDOT)xV2O5 material to the inkjet printing technology, thus successfully proving the printability of (PEDOT)xV2O5. Hence, we successfully produced a thermoelectric device composed of 4 thermocouples. Moreover, we optimized the geometry of the organic thermoelectric generator (OTEG) device thanks to a numerical model; the simulated and measured results are presented. The OTEG yielded a power density as high as 0.266 μW cm−2 for a temperature gradient of 20 K, therefore unveiling the potential of hybrid V2O5-based compounds for thermoelectric applications.
1. Introduction
In today's context of continuous industrialization and population growth, the world's energy demand continues to increase. Currently, fossil fuels share the biggest part in primary energy consumption in the world. Because of the consequence of the second principle of thermodynamics, more than half of the fossil fuel combusted in heat engines dissipates as heat into the atmosphere. This leads to well-known environmental problems, as well as resource management issues. Therefore, great attention has been devoted to converting different sources of energy into electrical energy: solar, wind, nuclear, hydroelectric, tidal, etc. The key possibility is to recover electrical energy directly from waste heat. Precisely, thermoelectric generators (TEGs) are designed to transform heat into electrical energy – this process is associated with the Seebeck effect.Traditionally TEGs are fabricated from inorganic materials, namely Bi–Te and Pb–Te alloys, which are rare metals, expensive, toxic and of costly processing. Thus, thermoelectric energy generation is still confined to niche applications such as space and luxury automobile industries. However, in recent years, a great deal of interest has been focused on organic and hybrid materials as an alternative to inorganic ones.1–7 Abundance, low thermal conductivity, environmental-friendliness and convenient solution-processes make organic/hybrid materials a promising route for flexible large-area and low cost thermoelectric generators. Other interesting features of organic/hybrid materials are easily tunable thermoelectric properties with various chemical treatments and their particularly suitable application at low temperatures (<250 °C).1–7
The energy conversion efficiency of materials (input thermal energy to output electrical energy) is given by the materials' function of merit (ZT):
| ZT = S2σT/κ. |
An efficient TEG design requires balanced n-type and p-type materials. The typical PF of n-type solution processable organic polymers was reported near 0.6 μW m−1 K−2 for poly{N,N′-bis(2-octyl-dodecyl)-1,4,5,8-napthalene dicarboximide-2,6-diyl]-alt-5,5′-(2,2′-bithiophene)} (P(NDIOD-T2)) doped with dihydro-1H-benzoimidazol-2-yl (N-DBI) derivatives,12 although recently more interesting hybrid n-type materials have been proposed9,10 with maximum reported ZT near 0.28.9 However, they are still behind their p-type counterparts performance-wise,4,5,11,16 as a result of poor electron affinity leading to instability in air and low electrical conductivity. Kim et al. 2013 reported a PF of 470 μW m−1 K−2 reaching a ZT of 0.4 by bathing PEDOT:PSS in ethylene glycol.11 In addition, few n-type organic materials have been identified as easy solution-processing materials for direct device fabrication. One of the major criteria a thermoelectric material must meet is the actual transfer from the laboratory scale device fabrication into a process that is scalable for manufacture in large volumes. Unfortunately, most of the laboratory condition techniques, such as spin coating or vacuum deposition, do not meet the criteria of mass-scale processing such as inkjet printing technology.
Here, we develop an n-type hybrid nanocomposite showing a robust stability in ambient air, as well as a straightforward solution-processability that can be transferred to inkjet printing for mass-scale device fabrication.8
Vanadium pentoxide (V2O5) sol-gels have attracted much attention in the past few decades. As a metal oxide which forms a gel or stable colloid structure in an aqueous medium, hydrated xerogels (V2O5·nH2O) are of particular interest because of their simple synthesis and relatively low cost, as vanadium is one of the most abundant metals on earth. Vanadium pentoxide gels possess ideal hosting properties for the intercalation of a variety of materials, both organic and inorganic, having a lamellar structure with an interlayer distance of 11.55 Å.13 M. G. Kanatzidis et al. (1990) reported a successful intercalation and polymerization of aniline in V2O5·nH2O xerogels.14 The intercalation process of such nanocomposites makes them especially attractive in areas such as lithium ion batteries, supercapacitors and smart displays (mainly because of their electrochromic properties). C. G Wu et al. (1996) reported a high negative Seebeck coefficient for a (polyaniline)xV2O5 hybrid material and an increased electrical conductivity compared to those of pristine V2O5, thus reporting thermoelectric properties of V2O5 based hybrid nanocomposites.15
One of the aims of this work is to optimize the thermoelectric properties of the (PEDOT)xV2O5 hybrid nanocomposite and pattern a device based on this material as the n-type component. We have successfully exploited the redox intercalative polymerization of EDOT in V2O5·nH2O xerogel. The intercalation involves an in situ polymerisation of EDOT monomers and insertion of the resulting conjugated PEDOT polymer within the V2O5 lamellar host. Furthermore, for the first time, an ink formulation of (PEDOT)xV2O5 was elaborated, and it proved to be suitable for inkjet printing deposition in order to produce an OTEG.
2. Experimental
2.1 Materials and film synthesis
![[thin space (1/6-em)]](https://www.rsc.org/images/entities/char_2009.gif) :
:![[thin space (1/6-em)]](https://www.rsc.org/images/entities/char_2009.gif) 5. The process is exothermic: heat and gas were released during the reaction. The suspension turned from a light orange to a brown flocculate and finally to a homogeneous, viscous red-brown V2O5·nH2O gel. The whole synthesis takes several days under vigorous stirring at ambient temperature and in ambient air.
5. The process is exothermic: heat and gas were released during the reaction. The suspension turned from a light orange to a brown flocculate and finally to a homogeneous, viscous red-brown V2O5·nH2O gel. The whole synthesis takes several days under vigorous stirring at ambient temperature and in ambient air.
The (PEDOT)xV2O5 nanocomposite was obtained by a simple addition of EDOT monomer drops (97%, Sigma Aldrich) into the V2O5·nH2O gel, and subsequent stirring for 3 days under ambient air and temperature. The molar ratio of EDOT![[thin space (1/6-em)]](https://www.rsc.org/images/entities/char_2009.gif) :
:![[thin space (1/6-em)]](https://www.rsc.org/images/entities/char_2009.gif) V2O5 is calculated from the varying quantity of EDOT added. The result is a (PEDOT)xV2O5 dispersion in water of green or dark-green colour, depending on the quantity of added organic matter.
V2O5 is calculated from the varying quantity of EDOT added. The result is a (PEDOT)xV2O5 dispersion in water of green or dark-green colour, depending on the quantity of added organic matter.
V2O5·nH2O and (PEDOT)xV2O5 films were produced by drop casting directly on glass substrates and left to dry at room temperature; the resulting thickness was approximately 3 μm. After the deposition, dried films were annealed at 150 °C for 30 minutes in order to evaporate the remaining intercalated water.17
2.2 Ink formulation and device fabrication
Thermoelectric modules were printed on a photo paper by inkjet technology using a DIMATIX DMP-381 multi-material printer. A (PEDOT)xV2O5 nanocomposite dispersion was adapted for inkjet printing by further diluting it in water in order to decrease its viscosity to 5 mPa s. Detergent additives (Triton X-100) were added to the dispersion in order to decrease its surface tension down to 31 mN m−1. PEDOT:PSS (PJET 700) is already formulated for inkjet printing by the manufacturer (Heraeus).Subsequently, both the (PEDOT)xV2O5 hybrid and PEDOT:PSS dispersions were filtered through a 5 μm PTFE filter before the injection into the Dimatix printer cartridge. Inks are then sequentially printed on paper (Photo Everyday 180gr A4 100f. APLI), with silver ink (NovaCentrix) printed on top of semi-conductor layers. PEDOT:PSS (p-type component of a thermocouple) and (PEDOT)xV2O5 (n-type component of a thermocouple) legs are electrically connected in series with printed silver ink electrodes. After printing, the device was left in an oven under 100 °C overnight.
2.3 Films characterization
Electrical conductivity was measured using the classic four-point probe technique in air at room temperature. Thermopower measurements were carried out by placing two voltage probes equipped with heating points (heating up to ΔT = 9 K) and thermocouples directly on thin films. The probes are connected to a Keithley 617 electrometer. The 3 omega method was used to measure the thermal conductivity.X-ray diffraction analyses were carried out with a SIEMENS D5000 (Bruker) using Cu Kα radiation (wavelength = 0.15418 nm). Sample thickness measurements were carried out with a Bruker Dektak XT profilometer.
3. Results and discussion
3.1 Intercalation process of PEDOT in V2O5·nH2O nanolayers
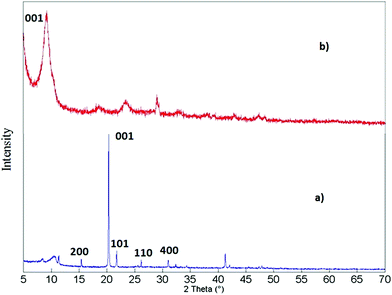
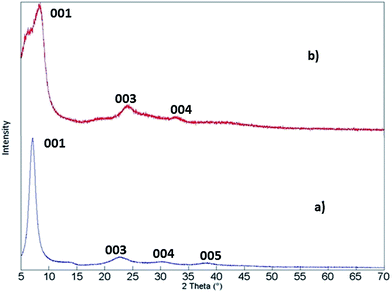
The (PEDOT)xV2O5 nanocomposite is the result of a redox reaction between the host and the guest in which EDOT monomers are oxidatively polymerized and V2O5 layers are reduced upon intercalation of PEDOT chains between V2O5 nanolayers. Water is expelled from the slightly hydrophobic interlamellar space, thus facilitating the insertion of the polymer. This process is summarized in Fig. 1.15X-ray diffraction analysis can help to verify if the doping process of the (PEDOT)xV2O5 hybrid is based on the intercalation of the doping PEDOT chains into the interlayer space of V2O5. Fig. 2 shows the X-ray diffraction patterns of V2O5 milled powder and of a (PEDOT)0.5V2O5 (powder) composite film, showing the structural changes upon intercalation of the polymer. The most intense peak corresponds to the (001) reflection, which is related to the interlayer spacing between V2O5 layers. In the case of the powder samples, the peak changes the position to lower angles with higher molar ratios of added EDOT. For molar ratios of 0 and 0.5, the interlayer spacing increases from 4.1 Å to 10 Å. This expansion can be explained by the formation of PEDOT chains and their insertion into the interlayer spacing. However, the xerogel (PEDOT)xV2O5·H2O composites show a contraction of the distance between monolayers compared to pristine V2O5·nH2O xerogel films (Fig. 3). The (001) peak shifts to higher angles, indicating a contraction from 11.55 Å of V2O5·nH2O to 10 Å upon intercalation (for a molar ratio of 0.5). The contraction of the interlayer separation indicates the expulsion of water from the hydrophobic interlamellar space and its replacement by PEDOT chains.15 Thus, this process appears to be accompanied by the expulsion of trapped water from the nanolayers, allowing the introduction and polymerization of PEDOT chains and thus the formation of the (PEDOT)xV2O5·H2O nanocomposite. For molar ratios lower than 1![[thin space (1/6-em)]](https://www.rsc.org/images/entities/char_2009.gif) :
:![[thin space (1/6-em)]](https://www.rsc.org/images/entities/char_2009.gif) 1 of V2O5
1 of V2O5![[thin space (1/6-em)]](https://www.rsc.org/images/entities/char_2009.gif) :
:![[thin space (1/6-em)]](https://www.rsc.org/images/entities/char_2009.gif) EDOT, thermal annealing is required to expel the remaining trapped water.
EDOT, thermal annealing is required to expel the remaining trapped water.
3.2 Thermoelectric performance
The thermoelectric properties of V2O5·nH2O and (PEDOT)xV2O5·nH2O films are investigated as a function of the molar concentration of added EDOT monomers. Fig. 4 illustrates the evolution of the electrical conductivity (Fig. 4(a)) and Seebeck coefficient (Fig. 4(b)), ranging between 0 and 0.6 mole of EDOT per mole of V2O5. We can notice a fast increase in electrical conductivity with the addition of EDOT monomers. Electrical conductivity increases by 3 orders of magnitude from 10−4 S cm−1 to nearly 0.5 Scm−1 at 0.6 of molar ratio. The electrical transport mechanism of the (PEDOT)xV2O5·nH2O nanocomposite results in compacting at the molecular level two anisotropic electrical conductors.15 Both conductors are of different types: the charge carriers of the V2O5 lattice are small polarons (which is typical for many transition metal oxides), in this case, small polarons are associated with the d-shell (V4+) centres, while massive polarons are those of the PEDOT chains.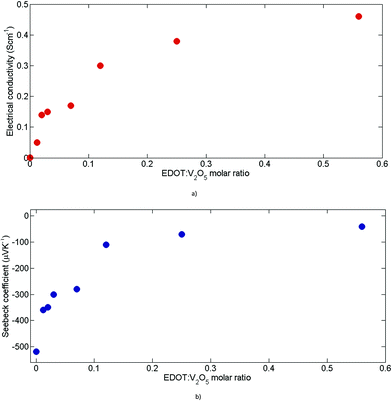 | ||
| Fig. 4 Thermoelectric performance of (PEDOT)xV2O5 for different molar ratios: (a) electrical conductivity and (b) Seebeck coefficient. | ||
The relative mobility of these two types of carriers determines the charge transport mechanism: the small polarons of the reduced V2O5 lattice have significantly higher mobility than the large polarons of the PEDOT polymer chains.15
Simultaneously, the absolute value of the thermopower decreases slowly starting from −480 μV K−1 for the polymer-free vanadium oxide, down to −30 μV K−1 at 0.6 of added EDOT (Fig. 4(b)). The negative sign of the thermopower proves the n-type nature of pristine V2O5·nH2O and (PEDOT)x V2O5·nH2O films. This shows the inverse dependency of the Seebeck coefficient on the reduction level of V2O5 lattices.
Furthermore, in order to optimize the overall thermoelectric performance of the material, we proceeded to tune the molar ratio to find the highest PF.
Fig. 5 illustrates the evolution of the PF as a function of the molar ratio of EDOT monomers. The PF increases very rapidly upon adding EDOT, influenced by the trend of the dramatic rise in electrical conductivity. Optimal values of the PF are under 0.1 molar ratio, with the highest value recorded at approximately 0.03 equal to 2 μW m−1 K−2, which is 3 orders of magnitude higher compared to the 2 × 10⁻³ μW m−1 K−2 of pristine vanadium oxide films. This is explained by the slow decrease of the absolute value of the Seebeck coefficient and the rapid increase of electrical conductivity at lower EDOT concentrations (<0.1 of added EDOT), which translates into a higher PF. After reaching its maximum, the PF decreases quickly with further addition of EDOT monomers: indeed, after 0.1 molar ratio, the increase of electrical conductivity is much slower than the decrease in the Seebeck coefficient. As the PF formula involves a quadratic dependence of the Seebeck coefficient, the rapid decrease of S translates into a substantial lowering of the PF.
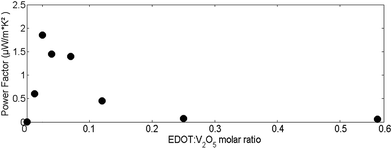 | ||
| Fig. 5 Power factor evolution of (PEDOT)xV2O5·nH2O for different molar ratios of added EDOT monomers. | ||
Both the electrical conductivity and thermopower showed nearly constant results for a period of at least 6 months of storage under ambient room conditions as shown in the ESI (Fig. S1 and S2†). Thus, (PEDOT)0.03V2O5 showed excellent stability in air.
The colour of V2O5·nH2O and the (PEDOT)xV2O5·nH2O films changes progressively with the oxidation level, showing electrochromic properties (Fig. 6). Upon the formation of the (PEDOT)xV2O5·nH2O nanocomposite, the film changes colour from red-brown to green or dark blue. This is explained by a band gap widening and the disappearance of the absorption of blue light.18
 | ||
| Fig. 6 V2O5·nH2O (far left) and (PEDOT)xV2O5 nanocomposite films (to the right). Colour changes with the progressively decreasing oxidation level of V2O5 (from left to right). | ||
The thermal conductivity of (PEDOT)0.03V2O5 films has been measured and the result is as low as 0.68 W m−1 K−1
The thermoelectric properties of PEDOT:PSS and of (PEDOT)0.03V2O5 for an optimal figure of merit are summarized in Table 1.
| Material | PEDOT:PSS | (PEDOT)0.03V2O5 | Units |
|---|---|---|---|
| κ | 0.34 (ref. 11,19 and 20) | 0.68 | W m−1 K−1 |
| σ | 600 ± 70 | 0.16 ± 0.03 | S cm−1 |
| Seebeck coefficient | 17 ± 1.5 | −350 ± 17 | μV K−1 |
| Power factor | 17.12 ± 4.6 | 2 ± 0.524 | μW m−1 K−2 |
| ZT | 1.3 × 10⁻² | 10–3 |
3.3 Ink formulation of (PEDOT)0.03V2O5
In order to produce a thermoelectric generator by inkjet printing, a correct formulation of inks is required. A Dimatix DMP381 drop-on-demand (DoD) piezo printer was used to print materials on paper. The generation of inkjet droplets depends on numerous factors relating mainly to the properties of the ink (rheology, particle size, volatility, substrate adhesiveness and density of the fluid) as well as the voltage-driven deformations of the DoD liquid-filled chamber (such as the electric waveform, jetting frequency, amplitude and duration of the signal).The first step is to ensure the ejectability of the fluid. This can be addressed by adjusting the viscosity, surface tension, particle size, temperature of the nozzle and the wave voltage amplitude. The next step is to improve the drop formation process for better printing quality. Ideally, we want spherical drops for precise trajectory with high enough velocity in order to obtain a higher precision and quality in the printing process. However, a too high velocity could lead to a splash effect of the drop on impact and deteriorate printing quality. Finally, the adhesiveness to the substrate must be investigated to reduce the overspreading of the fluid.
(PEDOT)0.03V2O5 viscosity is initially rather high (>30 mPa s) which makes its ejection difficult. Increasing the wave voltage amplitude could eject the fluid, but would cause a non-spherical drop shape and too high of a velocity, compromising thus the printing quality. Applying a higher temperature to the chamber could diminish its viscosity, however (PEDOT)0.03V2O5 has a low boiling point (<100 °C); applying a temperature could dry it quickly and block the nozzles. Thus, the most efficient way to decrease the viscosity of (PEDOT)0.03V2O5 is by further diluting it in its solvent (water); the optimal viscosity value for both ejectability and printing quality was found to be around 5 mPa s for 28 V of applied voltage.
(PEDOT)0.03V2O5 is a non-Newtonian fluid, and therefore elastic properties and viscosity are shear-dependent. However, polymers behave as a Newtonian fluid with a viscosity approaching a constant value when fully stretched with a high enough strain rate.21–23
The surface tension of (PEDOT)0.03V2O5 is equal to 71 mN m−1 (Fig. 7(a)), which is roughly equal to the surface tension of water. This high surface tension compromises the jetting of the ink. Thus, lowering the surface tension by adding surfactants is mandatory. However, if the surface tension is too low, the nozzle won't hold the ink without dripping. The optimal value was found to be 31 mN m−1 for (PEDOT)0.03V2O5 by adding 0.6% vol/vol of Triton X-100 surfactant (Fig. 7(b)).
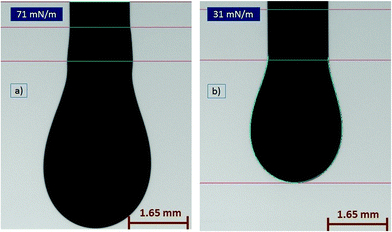 | ||
| Fig. 7 Pendant drop profile and surface tension of (PEDOT)0.03V2O5 before detachment for (a) without added detergent, 71 mN m−1 and (b) with 0.6% vol of Triton X100 detergent added, 31 mN m−1. | ||
Fig. 8 shows the contact angle of a (PEDOT)0.03V2O5 drop on paper. Decreasing the surface tension with the detergent does reduce the contact angle at equilibrium on the paper substrate by less than 10° (from 56° down to 48° upon the addition of Triton X-100) (Fig. 8(a) and (b)). This shows the partial wettability of (PEDOT)0.03V2O5 on the paper substrate, however the contact angle is large enough to avoid overspreading of the printed ink.24
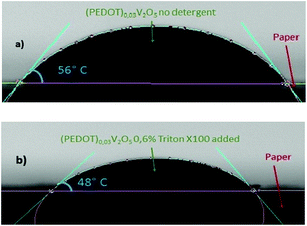 | ||
| Fig. 8 Contact angle of (PEDOT)0.03V2O5 on paper at equilibrium for (a) without detergent added 56° and (b) with 0.6% Triton X100 added, 48°. | ||
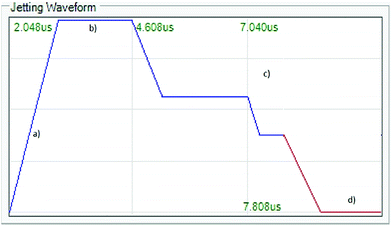
In order to generate drops, a waveform was used (Fig. 9). During the “rise time” (a) the chamber expands and is filled with the ink until it reaches the peak voltage (28 V) where it remains constant for a determined period (2.6 μs) of “dwell time”. The voltage then drops down and the chamber shrinks (c), followed by two “dwell time” plateaus. The waveform is being sent at a frequency of 7 kHz.
This process ejects the fluid and forms a drop with the desired shape (spherical), velocity (near 2 ms−1) and volume (near 6 pL).
Nanoparticle sedimentation will cause large particles to clog the nozzles, preventing ink ejection. Filtration through a 5 μm PTFE filter showed to be optimal to prevent nozzle obstruction during printing.
In the end, we get an effective ejection of a spherical drop with a straight trajectory, as shown in Fig. 10. The aimed pattern is precisely printed and without overspreading of the ink. Typically, the full production of a device (8 TCs) takes around 4 hours. Research toward a more optimized process for faster printing could be of interest. Faster printing can be achieved by carefully increasing the drop size, velocity, firing frequency and printhead path speed, without degrading printing quality. Importantly, thermopower and electrical conductivity of the printed samples showed comparable results with respect to the dropcast films.
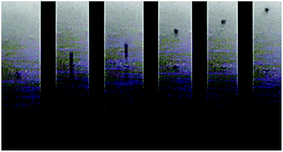 | ||
| Fig. 10 Drop generation of (PEDOT)0.03V2O5 ink. A spherical drop is ejected and pursues a straight trajectory. | ||
3.4 Device performance
The processability is an important criterion a thermoelectric material must meet, as it is the key to actually design and produce a TEG. The device optimization usually involves maximizing the voltage output and current output.25–30The voltage of the system, or typically, open circuit voltage, is given by
| Voc = nSpnΔT | (1) |
The current I is given by
 | (2) |
 | (3) |
Geometric parameters such as length and cross-section are an important part of design optimisation. Hence, numerical simulations constitute an important part of the TEG optimization. COMSOL Multiphysics, 3D-finite element analysis and simulation software for coupled physical problems, was used in this study to model and evaluate thermoelectric devices. Modelling has been done in two stages. The first stage was in a time-dependent mode, with the goal to evaluate the minimal leg lengths required to maintain a temperature difference of 20 K. The second stage of simulations has been in stationary mode, and had the objective to evaluate the output short circuit current, open circuit voltage and maximum output power for the corresponding external load resistance RL. Both materials showed a negligible dependence on temperature at ΔT = 20 K (see Table S1 in the ESI†), and thus we consider thermoelectric properties of the materials independent of the temperature gradient.
The projected organic thermoelectric device is of the classic flat-plate, “π”-shaped architecture composed of 4 thermocouples with a leg width of 3 mm and approximately 4 μm thickness. The legs are separated by a blank gap of 1 mm width, a choice made considering printing deposition constraints, and are electrically connected with silver electrodes.
Traditionally, to evaluate the thermal behavior of the TEG performance, the thermal resistance model has been the most used so far.31 However, the thermal resistance model assumes heat dissipation only at the cold side as it involves a heat sink system. The herein presented model in COMSOL Multiphysics, contrary to the thermal resistance model, accounts for heat losses between the device and the ambient and avoids the use of a specific heat sink. The heat source is applied to the bottom electrode; legs and top electrodes are exposed to ambient air with convective heat transfer as the boundary condition:
| dq = hcdS(T − Tc)dt | (4) |
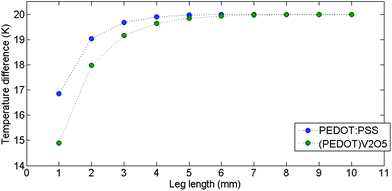
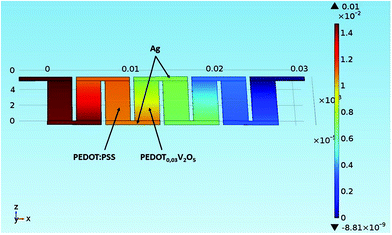
Fig. 11 shows thermal distribution over a thermocouple composed of PEDOT:PSS, (PEDOT)0.03V2O5 5 mm-long legs and silver electrodes for different times. Over time, the heat diffuses from the hot side to the cold side and stabilizes after 50 s. In 5 mm long legs, the temperature distribution is almost perfectly symmetric on the n-type leg with the temperature difference between the hot side and the cold side equal to ΔT = 20 K, and ΔT = 10 K between the middle point and the edge of the device. The thermal distribution on the p-type leg is slightly less symmetric as the thermal conductivity of PEDOT:PSS is lower than the thermal conductivity of (PEDOT)0.03V2O5. In Fig. 12, we have represented the variation of temperature differences between the hot side and the cold side with the thermocouple leg lengths of both materials.
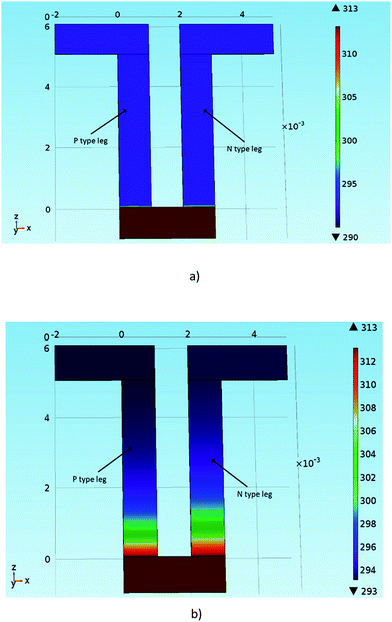 | ||
| Fig. 11 Model of thermal distribution over a PEDOT:PSS and (PEDOT)0.03V2O5 thermocouple as a function of time: (a) at t = 0 seconds and (b) 50 seconds. | ||
According to COMSOL modelling, as shown in Fig. 12, the temperature difference in both materials starts to rise for the first couple millimeters. The PEDOT:PSS leg increases ΔT in the 1–3 mm range and converges to 20 K near 4 mm, indicating the minimum leg length of the PEDOT:PSS component for ΔT = 20 K. The (PEDOT)0.03V2O5 leg shows similar behaviour except that its temperature gradient stabilizes near 5 mm. The slight difference in the minimum leg lengths comes from different thermal conductivities of these two materials ((PEDOT)0.03V2O5 having a higher thermal conductivity than PEDOT:PSS). Thus, according to numerical simulations, 5 mm length seems to be adequate for 20 K applied temperature for a thermocouple composed of these materials.
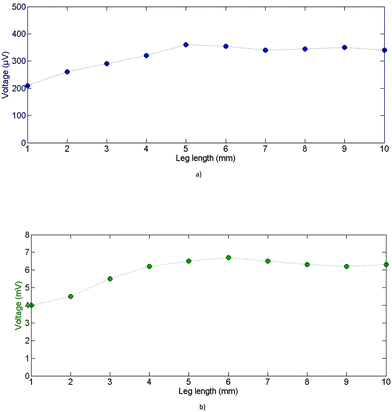
In order to experimentally confirm this thermal simulation model, several samples of both materials were produced, ranging from 1 mm to 10 mm in length. As Voc is directly proportional to ΔT (see eqn (1)), we can thus relate the evolution of Voc to the leg length indirectly to the behaviour of ΔT for each leg length (Fig. 13).
As shown in Fig. 13, Voc rises linearly with the leg length (up to 5 mm length) for PEDOT:PSS and (PEDOT)0.03V2O5 samples. Voc then stabilizes at near 5 mm leg length for both materials, which corresponds to ∼350 μV for PEDOT:PSS and ∼6.5 mV for (PEDOT)0.03V2O5. As previously mentioned, ΔT should follow the same trend as Voc with leg length, so we can assume that ΔT reached its maximum value equal to 20 K around 5 mm leg length for both materials. These experimental measurements validate the numerical model.
The values are reported in Table 2 for the 4-thermocouple Organic Thermoelectric Generators (OTEGs). The output voltage is expected to be of high value due to the high thermopower of (PEDOT)0.03V2O5, providing an open circuit Voc = 29.36 mV at ΔT = 20 K. If we assume the absence of contact resistances in the numerical study, the device internal resistance is expected to be 139 kΩ with Isc expected to be near 211 nA. However, with contact resistances between materials accounted for, the internal resistance reaches 515 kΩ (experimentally measured) with the respective simulated Isc near 57 nA. Such a relatively low current is mainly explained by the moderate electrical conductivity of (PEDOT)0.03V2O5.
| R L = Ri (kΩ) | Simulations | Experimental | |||||||
|---|---|---|---|---|---|---|---|---|---|
| I (nA) | V (mV) | P (nW) | P/A (μW cm−2) | I (nA) | V (mV) | P (nW) | P/A (μW cm−2) | ||
| Max (Rl = Ri) | 515 | 28.5 | 14.7 | 0.419 | 0.328 | 23 | 14.5 | 0.34 | 0.266 |
| Short circuit | — | 57 | — | — | — | 47 | — | — | — |
| Open circuit | ∞ | — | 29.36 | — | — | 0 | 26.1 | — | — |
In the case of a load resistance connected to the output of the device, the output voltage is calculated to be approximately half of Voc, which is in accordance with the impedance matching.34 The expected maximum power output is 0.419 nW with an external load resistance RL of 515 kΩ, equal to the internal resistance Ri of the devices.
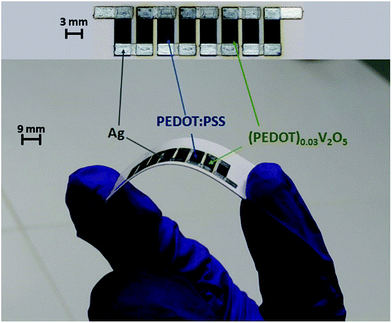
To verify these simulated thermoelectric behaviours, a generator has been produced by inkjet printing technology (Fig. 15). The fabrication is described in the Ink formulation and device fabrication section.
The thermoelectric performance of printed OTEGs has been characterized according to the experimental configuration in Fig. 16. The bottom electrodes of the generators have been wrapped around a cylindrical ceramic piece (Boron Nitride). Indeed, the printed OTEG showed remarkable mechanical flexibility (Fig. 15), as the applied bending stress did not damage the device. A thermally conductive paste was applied to the bottom electrodes and the ceramic piece in order to ensure a better thermal contact between the heated piece and the device. A temperature gradient was realized by putting the ceramic piece and the wrapped around OTEG on a heating Peltier module. The Peltier module was connected to a temperature controlling system, thus adjusting Th (45 °C) on one end, and Tc (25 °C – corresponding to the ambient air) has been applied on the other end of the test specimens (Fig. 16). The OTEG is electrically connected to an electrometer for electrical output measurements.
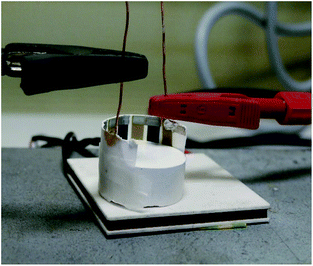 | ||
| Fig. 16 Experimental setup with the OTEG wrapped around the ceramic piece put on a temperature-controlled Peltier module. | ||
The fill factor (FF), which is defined as the ratio of the area of active thermoelectric elements to the cross-sectional area of the device, as well as geometrical properties of the OTEG are given in Fig. 17 and Table 3. As the absorbed into paper substrate portion of materials doesn't contribute to the thermoelectric performance of the devices (see Fig. S4 in the ESI†), we ignore the paper thickness in FF calculations. The FF is calculated considering the heat flux applied to a one circle rolled structure (Fig. 17). This definition of FF becomes obsolete for more than one rolled circles, as in that case substrate thickness becomes relevant in the calculation of the FF. The resulting thermoelectric properties of the OTEG are listed in Table 2.
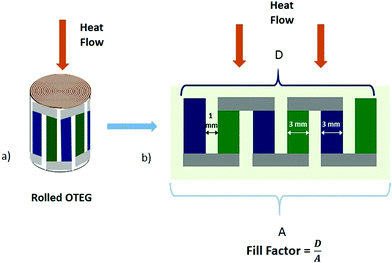 | ||
| Fig. 17 a) Rolled structure and (b) fill factor defined as the ratio of the area of active thermoelectric elements to the cross-sectional area of the device. | ||
| Number of TCs | Leg length | Leg width | Leg thickness | A: total OTEG area | Fill factor |
|---|---|---|---|---|---|
| 4 | 5 mm | 3 mm | ∼4 μm | 0.128 mm2 | 75% |
Upon application of ΔT, both voltage and current steadily increase with the heat source temperature. As shown in Table 2, the experimentally produced open circuit voltage of 26.1 mV at ΔT = 20 K is relatively close to the ideal computed value (29.36 mV), with a margin of approximately 11%. The output short circuit current (47 nA at ΔT = 20 K) is slightly (17%) lower than the numerically calculated current (57 nA at ΔT = 20 K), with contact resistances accounted for. This low disparity between the experimentally measured output voltage and current and the numerically calculated one is well within the margin of measurement error and the slight loss of heat at the thermal contacts. This shows the relative accuracy of the simulation model with respect to experimental results.
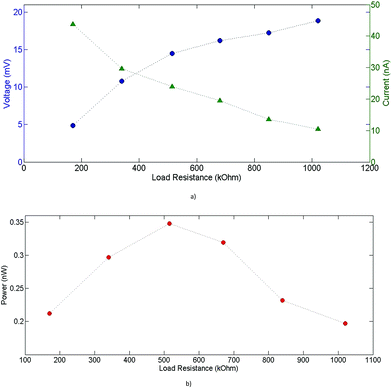
Furthermore, the power outputs for various connected load resistances have been measured. The behavior of the output current and voltage for different load resistances is shown in Fig. 18(a)), and the output power for the corresponding resistance values is given in Fig. 18(b)). The maximum power output of 0.34 nW at ΔT = 20 K was measured around 515 kOhm of attached load resistance, which corresponds to the internal resistance of the module. This leads to a maximum power density of 0.266 μW cm−2 at ΔT = 20 K, which is of the same order of magnitude as some previously reported printed devices.4,35 Such a relatively high power output density is due to the optimized geometry parameters of the devices and packing density of legs. Indeed, the printing deposition enabled a device with a relatively high (FF) of 75%. Anyhow, the actual experimental results show overall a reasonable accordance with expected simulated values. A possible approach to improve the output current of the device is increasing the cross-section of n-type legs, thus decreasing the internal resistance of the device and augmenting further its fill factor. In this case, an asymmetric structure would be of most interest, with (PEDOT)0.03V2O5 n-type legs wider than PEDOT:PSS p-type legs.
4. Conclusions
In this paper, we have presented a novel approach to synthesize an n-type thermoelectric material based on in situ polymerization and intercalation of PEDOT chains into V2O5 monolayers with excellent stability in air. The advantages of our approach are improved system packaging, simplified fabrication, inherent ruggedness and design flexibility. The nanocomposite based on the polymer showed a large reproducible thermopower; moreover, the intercalation of the polymer was essential to the increase of the electrical conductivity. The synthesis is both facile and entirely solution-based, which proved to be easily adaptable to inkjet printing technology. The numerical simulation was used to optimize the geometry of the device and the thermoelectric performance. Thus, an OTEG has been printed, composed of four thermocouples (with PEDOT:PSS as the p-type component) patterned in the classic π-shaped architecture. The electrical performance of the device was evaluated and was close to the expected numerically calculated values. A power density of 0.266 μW cm−2 was obtained for a low gradient of temperature (ΔT = 20 K). In addition, (PEDOT)0.03V2O5 films showed excellent stability in air, which shows the potential of organic/V2O5 materials in thermoelectric applications.Conflicts of interest
There are no conflicts to declare.Acknowledgements
The authors acknowledge Institut des sciences de l'ingénierie et des systèmes (INSIS) of Centre national de la recherche scientifique (CNRS) and Électricité de France (EDF). We'd also like to thank Bertrand Garnier and Polytech Nantes (UMR CNRS 6607) for thermal conductivity measurements (3 omega method) of (PEDOT)0.03V2O5 films.Notes and references
- B. T. McGrail, A. Sehirlioglu and E. Pentzer, Angew. Chem., Int. Ed., 2015, 54, 1710 CrossRef CAS PubMed.
- O. Bubnova and X. Crispin, Energy Environ. Sci., 2012, 5, 9345 CAS.
- M. Chabinyc, Nat. Mater., 2014, 13, 119 CrossRef CAS PubMed.
- O. Bubnova, Z. U. Khan, A. Malti, S. Braun, M. Fahlman and M. Berggren, Nat. Mater., 2011, 10, 429 CrossRef CAS PubMed.
- R. Yue and J. Xu, Synth. Met., 2012, 162, 912 CrossRef CAS.
- Q. Zhang, Y. Sun, W. Xu and D. Zhu, Adv. Mater., 2014, 26, 6829 CrossRef CAS PubMed.
- Y. Du, S. Z. Shen, K. Cai and P. S. Casey, Prog. Polym. Sci., 2012, 37, 820 CrossRef CAS.
- M. Singh, H. M. Haverinen, P. Dhagat and G. E. Jabbour, Adv. Mater., 2010, 22, 673 CrossRef CAS PubMed.
- C. Wan, X. Gu, F. Dang, T. Itoh, Y. Wang and H. Sasaki, Nat. Mater., 2015, 14, 622 CrossRef CAS PubMed.
- Y. M. Sun, P. Sheng, C. A. Di, F. Jiao, W. Xu, D. Qiu and D. B. Zhu, Adv. Mater., 2012, 24, 932 CrossRef CAS PubMed.
- G.-H. Kim, L. Shao, K. Zhang and K. P. Pipe, Nat. Mater., 2013, 12, 719 CrossRef CAS PubMed.
- R. A. Schlitz, F. G. Brunetti, A. M. Glaudell, P. Levi Miller, M. A. Brady, C. J. Takacs, C. Hawker and M. Chabinyc, Adv. Mater., 2014, 26, 2825 CrossRef CAS PubMed.
- J. Lemerle, L. Nejem and J. J. Lefebvre, J. Inorg. Nucl. Chem., 1980, 42, 17 CrossRef CAS.
- M. G. Kanatzidis, C.-G. Wu, H. O. Marcy and C. R. J. Kannewurf, J. Am. Chem. Soc., 1989, 111, 4139 CrossRef CAS.
- C.-G. Wu, D. C. DeGroot, H. O. Marcy, J. L. Schindler, C. R. Kannewurf, Y.-J. Liu, W. Hirpo and M. G. Kanatzidis, Chem. Mater., 1996, 8, 1992 CrossRef CAS.
- E. J. Bae, Y. H. Kang, K.-S. Jang and S. Y. Cho, Sci. Rep., 2016, 6, 18805 CrossRef CAS PubMed.
- G. N. Barbosa, C. F. O. Graeff and H. P. Oliveira, Ecletica Quim., 2005, 30, 2 Search PubMed.
- A. Talledo and C. G. Granqvist, J. Appl. Phys., 1996, 80, 7041 CrossRef.
- M. Scholdt, H. Do, J. Lang, A. Gall, A. Colsmann, U. Lemmer, D. Koenig, M. Winkler and H. Boettner, J. Electron. Mater., 2010, 39, 1589 CrossRef CAS.
- F. Faghani, PhD thesis, Linkoping University, 2010.
- G. H. McKinley, Rheol. Rev., 2005, 3, 1 Search PubMed.
- M. Stelter, G. Brenn, A. L. Yarin, R. P. Singh and F. Durst, J. Rheol., 2002, 46, 507 CrossRef CAS.
- H. Yoo and C. Kim, Rheol. Acta, 2013, 52, 313 CrossRef CAS.
- R. A. Street, W. S. Wong, S. E. Ready, M. L. Chabinyc, A. C. Arias, S. Limb, A. Salleo and R. Lujan, Mater. Today, 2016, 9, 32 CrossRef.
- A. Bitschi, PhD thesis, Swiss Federal Institute of Technology Zurich, 2009.
- G. S. Nolas, J. Sharp and H. J. Goldsmid, Thermoelectrics—Basic Principles and New Material Developments, Springer, Berlin, 2001 Search PubMed.
- M. Bhaskaran, S. Sriram and K. Iniewski, Energy Harvesting with Functional Materials and Microsystems, CRC Press, Boca Raton, 2014 Search PubMed.
- G. Snyder and T. Ursell, Phys. Rev. Lett., 2013, 91, 148301 CrossRef PubMed.
- S. W. Angrist, Direct energy conversion, Allyn and Bacon, 4th edn, Boston, 1982 Search PubMed.
- D. M. Rowe, CRC handbook of thermoelectrics, CRC Press, Boca Raton, 1995 Search PubMed.
- M. Gomez, R. Reid, B. Ohara and H. Lee, J. Appl. Phys., 2013, 113, 174908 CrossRef.
- S. S. Kutateladze and V. M. Borishanskii, A Concise Encyclopedia of Heat Transfer, Pergamon Press, 1966 Search PubMed.
- T. Floyd, Principles of Electric Circuits, Prentice Hall, 5th edn, 1997 Search PubMed.
- D. Beretta, A. Perego, G. Lanzani and M. Caironi, Sustainable Energy & Fuels, 2017, 1, 174 CAS.
- Q. Wei, M. Mukaida, K. Kirihara, Y. Naitoh and T. Ishida, RSC Adv., 2014, 4, 28802 RSC.
Footnote |
| † Electronic supplementary information (ESI) available. See DOI: 10.1039/c7se00313g |
| This journal is © The Royal Society of Chemistry 2018 |


