High-rate sodium ion anodes assisted by N-doped carbon sheets
Peng
Ge
a,
Hongshuai
Hou
a,
Nianci
Liu
d,
Xiaoqing
Qiu
*a,
Qing
Zeng
b,
Chao
Wang
 *b,
Lidong
Shao
 c and
Xiaobo
Ji
 a
a
aCollege of Chemistry and Chemical Engineering, Central South University, Changsha, China. E-mail: xq-qiu@csu.edu.cn; Fax: +86-731-88879616; Tel: +86-731-88879616
bUniversity of Electronic Science and Technology of China, Chengdu, 611731, China. E-mail: cwang@uestc.edu.cn
cShanghai Key Laboratory of Materials Protection and Advanced Materials in Electric Power, Shanghai University of Electric Power, Shanghai 200090, China
dHu Nan Middle School of Geosciences, Changsha, China. E-mail: 1019934324@qq.com
First published on 24th April 2017
Abstract
Well-defined 3D nitrogen-doped porous carbon materials (NPCMs) have been obtained from CQDs and melamine by the self-assembly process, presenting a distinct textural structure with uniform N-doping distribution. The as-prepared NPCMs, as the anode materials for SIBs, display high specify capacity, long-term cyclability and good rate capacity. At 100 mA g−1, the NPCM electrode can reach the first capacity of 225 mA h g−1 (204.7 mA h cm−2) and maintain 241.2 mA h g−1 (219.3 mA h cm−2) after 100 cycles. Even at the current density of 1000 mA g−1, a reversible capacity of 130.2 mA h g−1 (118.9 mA h cm−2) can be retained, which can be attributed to the improved extrinsic defects and electrical conductivity resulting from N-doping.
1 Introduction
Along with the progress of lithium-ion batteries, sodium ion batteries (SIBs) have attracted great attention for potential applications in large-scale energy storage devices.1–10 Compared with lithium, sodium resources are much cheaper, more abundant, and more widely distributed around the world. However, the radius of the sodium ion (1.02 Å) is slightly larger than that of the lithium ion (0.76 Å) and hence a larger interstitial space is in favor of facilitating the insertion of sodium ions.11–15 Recently, some polyanion materials have been explored for the cathode region owing to their large shuttling channels, such as NaxFePO4 and Na3V2(PO4)3.4,11,16 Actually, the performances of SIBs are also dependent on anode materials. It is well known that numerous kinds of anode materials, such as carbonaceous, metals and oxides/sulphides have been investigated and achieved some progress.17,18 However, carbon materials play an outstanding role in the batteries owing to their properties of incredible electrical conductivity and sustainable chemical stability.19,20 Nevertheless, ordered carbon materials, such as graphite, frequently utilized in lithium-ion batteries, are not suitable for the reversible accommodation of sodium ions because of the relatively small interstitial space. Thus, the novel carbon based materials with a unique disordered structure and sufficient interlayer distance are highly desired for SIBs.Generally, the microstructural features of electrode materials can be greatly optimized by hierarchical and morphological control, which could contribute to their electrochemical properties.21,22 In particular, a diversity of well controlled morphologies of carbon materials have been successfully obtained utilizing various approaches, including carbon quantum dots (CQDs),23 carbon rods,13 carbon sheets,24 three-dimensional 3D carbon spheres25 and so on.26,27 Nevertheless, the untreated CQDs without carbonization are inapposite as the SIB anode materials, due to the lower conductivity and less extrinsic defects. Encouragingly, they show rich surface functional groups and flexible electrochemical properties, which make them an ideal precursor to fabricate other carbon anodes with diverse morphologies.23 It has been demonstrated that the construction of 3D porous carbon materials by using CQDs as the building blocks is an efficient way to improve their electrochemical properties as SIB anodes, since the 3D porous structure can provide more interconnected macro- and meso-channels for sodium ions.28,29 Moreover, doping with exotic ions is another effective strategy to modify the internal layer of host materials.14,30–34 For instance, the interlayer spacing of carbon can be increased up to 0.34 and 0.348 nm by boron as well as sulfur doping, respectively.35,36 Nitrogen-doped carbon nanofibers are applied as anodes in SIBs, displaying the improved reversible capacity of 176 mA h g−1 after 100 cycles at a current density of 50 mA h g−1.37 Notably, nitrogen is considered as the most promising candidate to improve the electrochemical properties of carbon materials, since the well-bonded nitrogen can promote the adsorption, electric conductivity, and surface wettability, which are beneficial for improving the kinetics of sodium diffusion and transfer.38,30 Therefore, it is expected that a combination of the construction of 3D carbon and the N-doping strategy should become an efficient approach to obtain enhanced electrochemical performances for SIBs.
In this work, the nitrogen-doped 3D porous carbon materials were investigated as anode materials for SIBs. Owing to the improved reversibility and electrical conductivity from N-doping, the NPCMs exhibit excellent electrochemical properties, delivering a high reversible capacity of 130.2 mA h g−1 at 1000 mA g−1 after 1000 cycles.
2 Experimental section
2.1 Preparation of PCMs and NPCMs
The raw materials were melamine (nitrogen source), NaOH and CQDs (carbon source) from our previous work.39 Typically, stoichiometrically weighed NaOH and CQDs (the ratio is 10![[thin space (1/6-em)]](https://www.rsc.org/images/entities/char_2009.gif) :
:![[thin space (1/6-em)]](https://www.rsc.org/images/entities/char_2009.gif) 1) with a given amount of melamine were mixed thoroughly via grinding in an agate mortar. The mixture was calcined at 1000 °C for 2 h in an Ar atmosphere, with a heating rate of 10 °C min−1, followed by cooling to room temperature. The materials were collected and washed with hydrochloric acid, water and ethanol several times, respectively. The final black product was dried at 80 °C in a vacuum oven overnight and denoted as NPCMs. For comparison, pure porous carbon materials (named as PCMs) were also prepared with the same processes mentioned above without melamine. All the chemical reagents were obtained from Sinopharm Group.
1) with a given amount of melamine were mixed thoroughly via grinding in an agate mortar. The mixture was calcined at 1000 °C for 2 h in an Ar atmosphere, with a heating rate of 10 °C min−1, followed by cooling to room temperature. The materials were collected and washed with hydrochloric acid, water and ethanol several times, respectively. The final black product was dried at 80 °C in a vacuum oven overnight and denoted as NPCMs. For comparison, pure porous carbon materials (named as PCMs) were also prepared with the same processes mentioned above without melamine. All the chemical reagents were obtained from Sinopharm Group.
2.2 Materials characterization
Powder X-ray diffraction (XRD) patterns were carried out utilizing a Bruker D8 diffractometer with monochromatic Cu Kα radiation (the wavelength of 1.5406 Å) with a scan rate of 2° min−1 at 50 kV and 300 mA. The chemical compositions of the samples were investigated through X-ray photoelectron spectroscopy (XPS, K-Alpha 1063, monochromatized Al Ka X-ray source in a N2-filled atmosphere). The Raman spectra were collected using a Renishaw InVia (a 514 nm Ar+ laser) with a 50 mm diameter pinhole, and a 600 groove per mm grating. The surface morphologies of the products were investigated on a scanning electron microscope (SEM, FEI Quanta 200 at 10–15 kV). The conductivities were measured by the standard four-probe method at room temperature. Transmission electron microscopy (TEM, JEM-2100F) and TEM-energy dispersive X-ray (EDX) spectra were taken to explore the internal microstructure and element distribution of the products.2.3 Electrochemical measurements
In order to investigate the electrochemical performance of the as-prepared materials, coin-type half-cells were assembled in an argon filled glovebox. The tested electrode films were obtained from coating a homogenous slurry, which was prepared with active materials, carboxymethyl cellulose (CMC) and carbon black (Super P) in a weight ratio of 70![[thin space (1/6-em)]](https://www.rsc.org/images/entities/char_2009.gif) :
:![[thin space (1/6-em)]](https://www.rsc.org/images/entities/char_2009.gif) 15
15![[thin space (1/6-em)]](https://www.rsc.org/images/entities/char_2009.gif) :
:![[thin space (1/6-em)]](https://www.rsc.org/images/entities/char_2009.gif) 15 in deionized water, on a copper foil. Then, the electrodes were further dried at 80 °C for 10 h to remove water. Metallic sodium as the counter electrode, Celgard 2400 as the separator and the tested electrode film (the content of active materials about 0.9–1.1 mg) as the working electrode were three main parts to assemble half-cells. The electrolyte was 1 M NaClO4 dissolved in propylene carbonate (PC) with the addition of 5% fluoroethylene carbonate (FEC). The cells were galvanostatically charge–discharge cycled on a Land CT 2001 battery tester at different current densities in a voltage interval of 3.0–0.01 V (vs. Na/Na+) for both charge (Na extraction) and discharge (Na insertion) at room temperature. Cyclic voltammetric (CV) measurements were measured by using a Solartron Analytical instrument between 0.01 and 3.0 V (vs. Na/Na+) at a scan rate of 0.1 mV s−1. The electrochemical impedance measurements were conducted on a Solartron Analytical instrument at an AC voltage of 5 mV in a frequency range from 0.01 Hz to 100 kHz.
15 in deionized water, on a copper foil. Then, the electrodes were further dried at 80 °C for 10 h to remove water. Metallic sodium as the counter electrode, Celgard 2400 as the separator and the tested electrode film (the content of active materials about 0.9–1.1 mg) as the working electrode were three main parts to assemble half-cells. The electrolyte was 1 M NaClO4 dissolved in propylene carbonate (PC) with the addition of 5% fluoroethylene carbonate (FEC). The cells were galvanostatically charge–discharge cycled on a Land CT 2001 battery tester at different current densities in a voltage interval of 3.0–0.01 V (vs. Na/Na+) for both charge (Na extraction) and discharge (Na insertion) at room temperature. Cyclic voltammetric (CV) measurements were measured by using a Solartron Analytical instrument between 0.01 and 3.0 V (vs. Na/Na+) at a scan rate of 0.1 mV s−1. The electrochemical impedance measurements were conducted on a Solartron Analytical instrument at an AC voltage of 5 mV in a frequency range from 0.01 Hz to 100 kHz.
3 Results and discussion
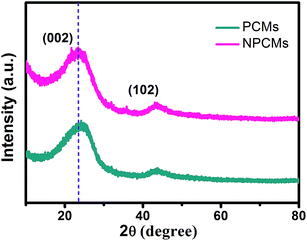
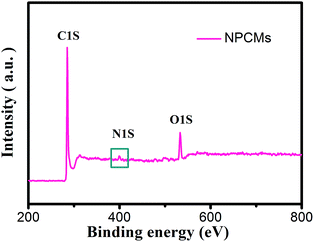
The XRD patterns of the as-prepared PCMs and NPCMs are displayed in Fig. 1. Two weak and broad peaks located at about 2θ = 24 and 43° can be ascribed to the characteristic (0 0 2) and (1 0 2) peaks of a disordered carbonaceous structure according to the previous reports.28,40,41 No other peak related to the nitrogen source is found in the patterns, indicating that the melamine was completely decomposed after the thermal treatment and the nitrogen species were successfully doped into the host materials.1 No distinct intensity change is observed at the peaks of PCMs and NPCMs, suggesting that heteroatom doping may not destroy the host structure of carbon.25 Moreover, compared with the PCMs, the (002) diffraction peaks of NPCMs are shifted to a lower angle (about 22.6°). Based on Bragg's equation, the interlayer spacing (d(002)) of NPCMs was calculated to be 0.393 nm, much larger than that of graphite (0.335 nm) and PCMs (0.368 nm), indicating a faster diffusion coefficient and more reasonable intercalation/extraction of Na+.37,42To specify the chemical states of surface elements, XPS for the obtained samples was carried out. Fig. 2 displays the survey spectrum of NPCMs, clearly showing the existence of C, O, and N at the surface of the sample. It has to be noted that the strong peak at 285.2 eV can be related to C 1s and the medium peak at 533 eV can be assigned to O 1s, while the weak peak at about 400 eV is associated with N 1s.30,43,44 The oxygen is mainly derived from the thermally stable functional groups of the CQDs and some oxygen is also absorbed on the carbon surface. It is found that the doped nitrogen content in NPCMs is 2.75 wt% from the monitored XPS.
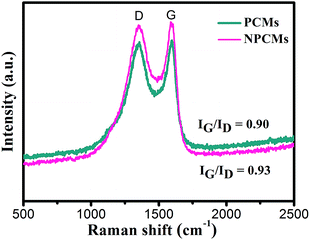
Fig. 3 displays the Raman spectra of the as-obtained PCMs and NPCMs. It is clear that two distinctive D and G peaks appear at 1355 and 1588 cm−1, respectively.45 No Raman fingerprints related to the melamine are observed in Fig. 3, confirming that the melamine as the nitrogen source was decomposed completely in the carbon materials, which is well consistent with XRD analysis. As reported,30 the D band is related to the amorphous structure and crystal defects in carbon materials, and the G band is associated with the nanographitic structure (sp2 bonded carbon atoms) of carbon materials. The specific value of the ID/IG ratio is 0.90, confirming the low degree of graphitization of NPCMs, which shows that NPCMs are mainly made up of disordered carbon.46
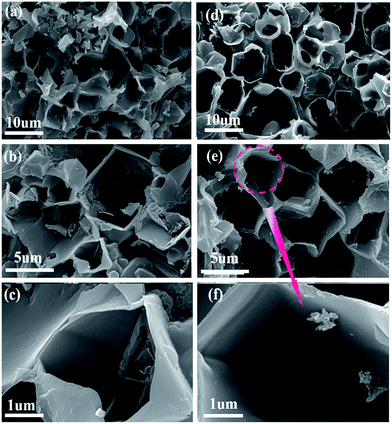
The SEM images of PCMs and NPCMs are shown in Fig. 4. The low magnification SEM images of PCMs with the primary 3D porous framework are displayed in Fig. 4a and b. The high magnification image of PCMs displayed in Fig. 4c shows that the 3D porous framework of PCMs has been slightly broken and some macropores were jammed, which is attributed to the fact that the PCMs cannot endure high heating temperatures. The broken structure seems to be bad for the infiltration of the electrolyte into electrode materials adequately, resulting in the low cycle capacity rate performances. Encouragingly, after the introduction of melamine, it is found that the 3D porous framework consists of N-doped nanosheets and the diameter of the macropores can be stabilized at 1 μm (Fig. 4d and e). By careful examination of the high magnification images in Fig. 4f, more macropores and larger internal space are clearly observed in NPCMs, which are favourable for the wetting of the electrolyte, further increasing the interstitial space for the sodium ion shuttle.28 Meanwhile, from the different framework morphologies, it is expected that the assembling mechanism of the structure is affected by N-doping. In principle, the melamine and CQDs with rich functional groups are pyrolyzed in molten salt, facilitating the formation of numerous macropores and nitrogen-doping. NaOH plays a vital role in self-assembly of the carbon and activating carbon materials to create additional active sites,47 which are of importance for the capacity.
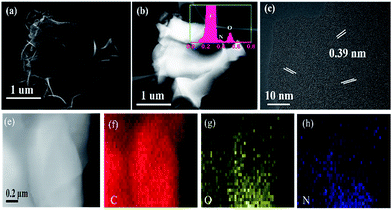
In order to further investigate the interior structure of the 3D framework and the element distribution, high angle circular dark field scanning transmission electron microscopy (HAADF-STEM) and EDX were carried out. Fig. 5a and b display the STEM and the corresponding HAADF-STEM images of NPCMs in low magnification, respectively. No agglomeration spots are found in Fig. 5b, indicating uniform element distribution.21 The EDX peak of nitrogen is clear as displayed in the illustration of Fig. 5b, indicating that the nitrogen species were successfully doped into the host materials, which is in accordance with the analysis of XRD. The electronegativity of the nitrogen (3.5) is stronger than that of the carbon (3.0), the C–N covalent would furnish additional sodium storage areas to improve the capacity.48,49 From the HRTEM image in Fig. 5c, some nanographitic structures can be found in the disordered carbon matrix, and a larger interlayer distance (0.39 nm) is observed, larger than that of the graphene (0.335 nm). The layer distance was enlarged by nitrogen-doping, which is in consistent with XRD analyses. As previously reported, the large internal space is beneficial for the insertion/extraction of sodium ions, resulting in the improved electrochemical performances. In addition, Fig. 5e–h display the elemental mappings of the NPCMs, the elemental nitrogen disperses uniformly, further revealing that the nitrogen atoms from the melamine are well-distributed in the carbon materials.
In Fig. 6b, the initial charge and discharge capacities of the PCMs deliver 160.3 mA h g−1 and 293.2 mA h g−1, respectively (coulombic efficiency of 54.48%). By adding melamine as a stabilizer, the as-prepared NPCM samples display greatly improved electrochemical properties. As displayed in Fig. 6a, NPCMs can reach the charge capacities of 225.2 mA h g−1 (204.7 mA h cm−2), and discharge values of 391.03 mA h g−1 (355.48 mA h cm−2), as well as the initial coulombic efficiency of 57.55%. The formation of the SEI layer on the interface of solid–liquid and the restricted sodium on the active sites of the materials should be responsible for the low first coulombic efficiency of the as-prepared materials, representing a characteristic for hard carbons.25,37,50,51 However, the suitable SEI layer coming from the decomposition of the PC electrolyte is beneficial for the long-time cycling stability and high capacity as reported by Komaba's group.52 Through comparing with the platforms of the as-obtained samples, it is clear that the slope platform is related to the absorption/desorption of Na+-storage behaviors and the corresponding charge capacities of PCMs and NPCMs are 140.2 and 167.3 mA h g−1 respectively in the second cycles. The increased part of NPCMs is ascribed to the more effective active sites derived from N-doping. It has to be noted that the platforms of NPCMs at 0.3 and 0.01 V (vs. Na/Na+) are larger than those of PCMs, which is associated with the insertion of sodium ions in the graphitic nanocrystallite structure. The previous reports about the energy cost of sodium ion insertion confirmed that the enlarged internal layer is used to store more Na+. Thus, NPCMs exhibit a charge capacity of 65.8 mA h g−1, larger than that of PCMs (20.5 mA h g−1), indicating that the larger Na+-storage spacing from N-doping gives rise to the main increased capacity of NPCMs. Moreover, the larger interlayer from N-doping could facilitate sodium ion insertion/extraction, resulting in the higher coulombic efficiency of NPCMs. The coulombic efficiency of two materials quickly increases to more than 99.1% after 5 cycles, indicating that PCMs and NPCMs possess high reversible sodium storage properties. The cycle performances of the as-prepared electrodes are depicted in Fig 6c and d. The capacities are greatly increased after first several cycles and maintained at a constant state in the subsequent cycles, which is attributed to the fact that the samples have been activated in the insertion/extraction process. In Fig. 6c, after 100 charge–discharge cycles, the charge capacity of the PCM electrodes only keep 185 mA h g−1 and NPCMs can retain a reversible capacity of 241.2 mA h g−1 (219.3 mA h cm−2) with a high coulombic efficiency (99.01%), suggesting better cycling stability of the NPCMs. In comparison with PCMs, more sodium storage sites and enlarged internal layers from N-doping are favorable for the surface charge transfer and electronic adsorption/desorption of Na+ ions, resulting in larger charge capacity and better rate performances of NPCMs.
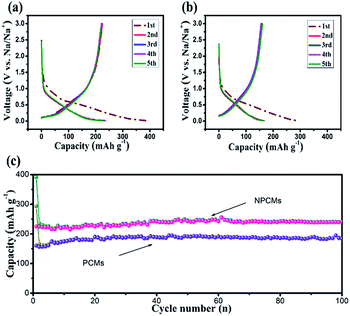 | ||
| Fig. 6 Charge–discharge curves of the (a) PCMs, (b) NPCMs, cycling performance and coulombic efficiencies of the PCMs and NPCMs at current density of 100 mA g−1 between 3.0 and 0.01 V. | ||
The rate performances of the as-prepared materials are presented in Fig. 7a. For NPCMs, when the current densities are 100, 200, 400, 800 and 1600 mA g−1, the average specific capacities can remain at 222.8, 204.3, 170.3, 142.9 and 115.6 mA h g−1, respectively. Even if the current density is reduced back to 100 mA g−1, the reversible capacity of NPCMs can still recover to 210.8 mA h g−1 (191.63 mA h cm−2), displaying good rate properties. For PCMs, at stepwise current densities, the average reversible capacities of PCMs only remain at 163.7, 110.5, 90.9, 79.3 and 70.2 mA h g−1. It is clear that the rate capacity of the NPCMs is superior to that of PCMs, which can be attributed to the adequate wetting, increased active sites and large internal layers resulting from a special morphology as well as nitrogen-doping. The long-term cycling performance of NPCMs is displayed in Fig. 7b at an augmented current density of 1000 mA g−1, it is found that a reversible capacity of 130.8 mA h g−1 (118.9 mA h cm−2) could be retained after 1000 repeated charge/discharge cycles, showing excellent rate properties of the NPCMs. It has to be noted that the NPCMs also have an activing progress coming from the etching of NaOH, the coulombic efficiency is more than 99.5% owing to the broadened shuttling channels for sodium ions from the enlargement of internal layers. Benefitting from N-doping, the electronic conductivity of NPCMs can achieve higher values than that of PCMs, giving rise to better rate performances. Through comparing with the previous reports,24,37,44,52–56 it can be confirmed that nitrogen-doping is an effective strategy to improve electrochemical properties of carbon materials. It has to be noted that the NPCMs display the highest coulombic efficiency and excellent electrochemical performances, which is ascribed to the available doped nitrogen content and unique morphology structure (Fig. 8).
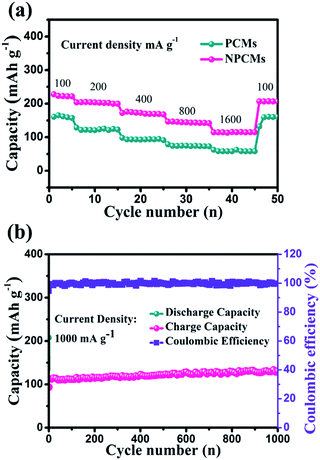 | ||
| Fig. 7 Rate performance of PCMs and NPCMs (a), long-term cycling performance of the NPCMs at 1000 mA g−1 (b). | ||
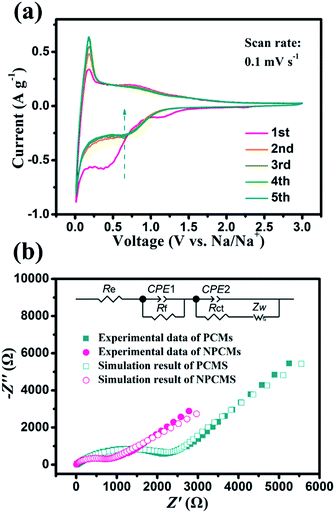
To evaluate the detailed electrochemical behaviours of the as-prepared NPCMs, the profiles of CV in the first five cycles are shown in Fig. 8a. In the first reduction scan, clear irreversible cathodic peaks around 0.4 V and 1.1 V appeared, and disappeared in the following cycles, which mainly drives from the irreversible side reactions and the PC electrolyte decomposition to form the SEI layer.24,39 For the cathodic process, the bulge appearing at 0.8 V and the sharp peak located at 0.1 V can be attributed to the adsorption/insertion of sodium ions on the surface and internal layers of the NPCMs. Comparing with the peaks at 0.1 V, after 5 insertion/extraction cycles, the Na+-insertion into the graphitic nanocrystallite structure becomes stable, which is in accordance with the analysis of cycling curves owing to the activation process. During the anodic process, the broad peak was ascribed to the sodium ion extraction from the NPCMs. From the second to fifth cycle, the CV behaviours became stable, indicating high reversibility as well as good cycling stability during the sodiation–desodiation process. Fig. 8b shows the Nyquist plots of PCM and NPCM electrodes, after the cycle in a discharged state (0.8 V vs. Na+/Na). As can be seen, a semicircle at the high-to-medium frequencies and a straight sloping line at low frequency are the main parts. The semicircle is the representative of the charge-transfer resistance, while the sloping line corresponds to the solid-state diffusion of sodium in the electrode. Moreover, the equivalent circuit is established to analyze the impedance data, which is given as an internal illustration in Fig. 8b. Re is related to the total resistance of the separator, electrolyte, and electrode. Rf represents the impedance of the solid electrolyte interface (SEI) of the electrode. Rct is the charge-transfer resistance and Zw (Warburg impedance) corresponds to the diffusion of sodium ions into the bulk electrode.48 Compared with the two electrodes' plots, it can be found that the Rct (about 873 Ω) of NPCMs is much smaller than that of PCMs (about 2655 Ω), indicating that the N-doping can affect the sodium diffusion in the porous materials to improve electrochemical kinetics of the materials. Moreover, the larger straight slope of NPCM materials at low frequency should be noted in comparison with that of PCMs, which confirms that the enlarged internal layer of NPCMs resulting from N-doping is beneficial for the diffusion of sodium ions (Table 1).
| Materials | Initial C.E. (%) | Nitrogen content (%) | Current density (A g−1) | Cycle number | Residue capacity (mA h g−1) | Rate performances (mA h g−1) |
|---|---|---|---|---|---|---|
| Commercially available hard carbon | 78 | — | 0.025 | 100 | 225 | — |
| Templated carbon | 20 | — | 0.074 | 40 | 120 | ∼100 at 1.85 A g−1 |
| Expanded graphite | ∼49.53 | — | 0.1 | 2000 | 150 | 284 at 0.02 A g−1; 91 at 2.0 A g−1; |
| N-doped carbon nanosheets | 34.9 | — | 0.5 | 200 | 155 | ∼190 at 0.2 A g−1; ∼50 at 2 A g−1; ∼45 at 5 A g−1 |
| N-doped interconnected carbon nanofibers | 41.8 | 13.93 | 0.2 | 200 | 134.2 | 150 at 0.2 A g−1; 121 at 2 A g−1; 100 at 5 A g−1 |
| N-doped porous carbon nanofibers | 46 | 8.8 | 0.05 | 100 | 243 | 210 at 0.2 A g−1; 134 at 2 A g−1; 101 at 5 A g−1 |
| N-doped ordered mesoporous carbon | — | 6.2 | 0.1 | 45 | 327.6 | 259 at 0.2 A g−1; 157 at 1 A g−1; 98 at 2 A g−1; |
| N-doped bamboo-like carbon nanotubes | ∼30 | 2.5 | 0.5 | 160 | 100 | 270.6 at 0.05 A g−1; 81 at 1 A g−1 |
| Our work | 57.55 | 2.7 | 0.1 | 100 | 241.2 | 142.9 at 0.8 A g−1 115.6 at 1.6 A g−1 |
4 Conclusion
In summary, the NPCMs with an enlarged interlayer distance of 0.39 nm were prepared through the self-assembly of carbon quantum dots, which are utilized as SIB anodes. The NPCMs displayed high specific capacity, excellent cycle stability as well as good rate performances. At 100 mA g−1, a high charge capacity of 241.2 mA h g−1 can be retained after 100 cycles. When the current density reaches 1000 mA g−1, a capacity of 130.8 mA h g−1 can be retained after 1000 cycles. This work confirms that the electrochemical properties of 3D carbon materials can be effectively improved through the introduction of nitrogen.Acknowledgements
This work was financially supported by the National Natural Science Foundation of China (51622406, 21673298 and 21473258), Innovation Mover Program of Central South University (2016CX020), Distinguished Young Scientists of Hunan Province (13JJ1004), Fundamental Research Funds for the Central Universities of Central South University (2016zzts022), Technology Department in Sichuan Province Supporting Plan (No. 20147GZ0151, 2016JQ0022) and Open Project Program of the State Key Laboratory of Photocatalysis on Energy and Environment (Grant No. SKLPEE-KF201703), Fuzhou University.Notes and references
- Y. Mao, H. Duan, B. Xu, L. Zhang, Y. Hu, C. Zhao, Z. Wang, L. Chen and Y. Yang, Energy Environ. Sci., 2012, 5, 7950 CAS.
- Y. Li, Z. Wang and X.-J. Lv, J. Mater. Chem. A, 2014, 2, 15473–15479 CAS.
- Y. Jiang, X. Ma, J. Feng and S. Xiong, J. Mater. Chem. A, 2015, 3, 4539–4546 CAS.
- J. Kim, D.-H. Seo, H. Kim, I. Park, J.-K. Yoo, S.-K. Jung, Y.-U. Park, W. A. Goddard III and K. Kang, Energy Environ. Sci., 2015, 8, 540–545 CAS.
- X.-F. Luo, C.-H. Yang, Y.-Y. Peng, N.-W. Pu, M.-D. Ger, C.-T. Hsieh and J.-K. Chang, J. Mater. Chem. A, 2015, 3, 10320–10326 CAS.
- D. Wang, Q. Liu, C. Chen, M. Li, X. Meng, X. Bie, Y. Wei, Y. Huang, F. Du and C. Wang, ACS Appl. Mater. Interfaces, 2016, 8, 2238–2246 CAS.
- S. H. Choi, Y. N. Ko, J. K. Lee and Y. C. Kang, Adv. Funct. Mater., 2015, 25, 1780–1788 CrossRef CAS.
- K. Zhang, Z. Hu, X. Liu, Z. Tao and J. Chen, Adv. Mater., 2015, 27, 3305–3309 CrossRef CAS PubMed.
- H. Hou, M. Jing, Z. Huang, Y. Yang, Y. Zhang, J. Chen, Z. Wu and X. Ji, ACS Appl. Mater. Interfaces, 2015, 7, 19362–19369 CAS.
- Y. Zhu, P. Nie, L. Shen, S. Dong, Q. Sheng, H. Li, H. Luo and X. Zhang, Nanoscale, 2015, 7, 3309–3315 RSC.
- Y. Fang, L. Xiao, X. Ai, Y. Cao and H. Yang, Adv. Mater., 2015, 27, 5895–5900 CrossRef CAS PubMed.
- J. S. Cho, J.-K. Lee and Y. C. Kang, Sci. Rep., 2016, 6, 2338 Search PubMed.
- Y. Cao, L. Xiao, M. L. Sushko, W. Wang, B. Schwenzer, J. Xiao, Z. Nie, L. V. Saraf, Z. Yang and J. Liu, Nano Lett., 2012, 12, 3783–3787 CrossRef CAS PubMed.
- H. Hou, L. Shao, Y. Zhang, G. Zou, J. Chen and X. Ji, Adv. Sci., 2017, 4, 1600243 CrossRef PubMed.
- H. Hou, X. Qiu, W. Wei, Y. Zhang and X. Ji, Adv. Energy Mater., 2017 DOI:10.1002/aenm.201602898.
- Q. Zhang, W. Wang, Y. Wang, P. Feng, K. Wang, S. Cheng and K. Jiang, Nano Energy, 2016, 20, 11–19 CrossRef CAS.
- Y. Zhang, C. Wang, H. Hou, G. Zou and X. Ji, Adv. Energy Mater., 2016, 1600173 Search PubMed.
- Y. Zhang, C. W. Foster, C. E. Banks, L. Shao, H. Hou, G. Zou, J. Chen, Z. Huang and X. Ji, Adv. Mater., 2016, 28, 9391–9399 CrossRef CAS PubMed.
- M. M. Titirici, A. Thomas and M. Antonietti, Adv. Funct. Mater., 2007, 17, 1010–1018 CrossRef CAS.
- M.-M. Titirici, R. J. White, N. Brun, V. L. Budarin, D. S. Su, F. del Monte, J. H. Clark and M. J. MacLachlan, Chem. Soc. Rev., 2015, 44, 250–290 RSC.
- Y. Qu, Z. Zhang, K. Du, W. Chen, Y. Lai, Y. Liu and J. Li, Carbon, 2016, 105, 103–112 CrossRef CAS.
- J. Balamurugan, G. Karthikeyan, T. D. Thanh, N. H. Kim and J. H. Lee, J. Power Sources, 2016, 308, 149–157 CrossRef CAS.
- Y. Zhu, X. Ji, C. Pan, Q. Sun, W. Song, L. Fang, Q. Chen and C. E. Banks, Energy Environ. Sci., 2013, 6, 3665 CAS.
- L. Fu, K. Tang, K. Song, P. A. van Aken, Y. Yu and J. Maier, Nanoscale, 2014, 6, 1384–1389 RSC.
- K. Tang, L. Fu, R. J. White, L. Yu, M.-M. Titirici, M. Antonietti and J. Maier, Adv. Energy Mater., 2012, 2, 873–877 CrossRef CAS.
- T. Yang, T. Qian, M. Wang, X. Shen, N. Xu, Z. Sun and C. Yan, Adv. Mater., 2016, 28, 539–545 CrossRef CAS PubMed.
- E. M. Lotfabad, J. Ding, K. Cui, A. Kohandehghan, W. P. Kalisvaart, M. Hazelton and D. Mitlin, ACS Nano, 2014, 8, 7115–7129 CrossRef CAS PubMed.
- H. Liu, M. Jia, N. Sun, B. Cao, R. Chen, Q. Zhu, F. Wu, N. Qiao and B. Xu, ACS Appl. Mater. Interfaces, 2015, 7, 27124–27130 CAS.
- K. Yan, L.-B. Kong, K.-W. Shen, Y.-H. Dai, M. Shi, B. Hu, Y.-C. Luo and L. Kang, Appl. Surf. Sci., 2016, 364, 850–861 CrossRef CAS.
- H. Wang, C. Zhang, Z. Liu, L. Wang, P. Han, H. Xu, K. Zhang, S. Dong, J. Yao and G. Cui, J. Mater. Chem., 2011, 21, 5430 RSC.
- H. Zhao, Y. Gao, J. Wang, C. Chen, D. Chen, C. Wang and F. Ciucci, Mater. Lett., 2016, 167, 93–97 CrossRef CAS.
- W.-H. Lee and J. H. Moon, ACS Appl. Mater. Interfaces, 2014, 6, 13968–13976 CAS.
- S. Wang, J. Zhang, P. Shang, Y. Li, Z. Chen and Q. Xu, Chem. Commun., 2014, 50, 12091–12094 RSC.
- W. Li, M. Zhou, H. Li, K. Wang, S. Cheng and K. Jiang, Energy Environ. Sci., 2015, 8, 2916–2921 CAS.
- X. Wang, G. Li, F. M. Hassan, J. Li, X. Fan, R. Batmaz, X. Xiao and Z. Chen, Nano Energy, 2015, 15, 746–754 CrossRef CAS.
- C. Shu, Y. Lin, B. Zhang, S. B. A. Hamid and D. Su, J. Mater. Chem. A, 2016, 4, 6610–6619 CAS.
- Z. Wang, L. Qie, L. Yuan, W. Zhang, X. Hu and Y. Huang, Carbon, 2013, 55, 328–334 CrossRef CAS.
- Y. Zhai, B. Xu, Y. Zhu, R. Qing, C. Peng, T. Wang, C. Li and G. Zeng, Mater. Sci. Eng., C, 2016, 61, 449–456 CrossRef CAS PubMed.
- H. Hou, C. E. Banks, M. Jing, Y. Zhang and X. Ji, Adv. Mater., 2015, 27, 7861–7866 CrossRef CAS PubMed.
- X. Zhou and Y.-G. Guo, ChemElectroChem, 2014, 1, 83–86 CrossRef.
- X. Zhou, Z. Dai, J. Bao and Y.-G. Guo, J. Mater. Chem. A, 2013, 1, 13727–13731 CAS.
- Y. Yan, Y.-X. Yin, Y.-G. Guo and L.-J. Wan, Adv. Energy Mater., 2014, 4, 1301584 CrossRef.
- H. Wang, T. Maiyalagan and X. Wang, ACS Catal., 2012, 2, 781–794 CrossRef CAS.
- Y. Wen, K. He, Y. Zhu, F. Han, Y. Xu, I. Matsuda, Y. Ishii, J. Cumings and C. Wang, Nat. Commun., 2014, 5, 5033 CrossRef PubMed.
- Y. Li, Z. Wang, L. Li, S. Peng, L. Zhang, M. Srinivasan and S. Ramakrishna, Carbon, 2016, 99, 556–563 CrossRef CAS.
- L. David and G. Singh, J. Phys. Chem. C, 2014, 118, 28401–28408 CAS.
- G. Sun, L. Ma, J. Ran, B. Li, X. Shen and H. Tong, Electrochim. Acta, 2016, 194, 168–178 CrossRef CAS.
- X. Ma, G. Ning, C. Qi, C. Xu and J. Gao, ACS Appl. Mater. Interfaces, 2014, 6, 14415–14422 CAS.
- J. Hou, C. Cao, F. Idrees and X. Ma, ACS Nano, 2015, 9, 2556–2564 CrossRef CAS PubMed.
- D. A. Stevens and J. R. Dahn, J. Electrochem. Soc., 2001, 148, A803 CrossRef CAS.
- E. Buiel and J. R. Dahn, Electrochim. Acta, 1999, 45, 121–130 CrossRef CAS.
- S. Komaba, W. Murata, T. Ishikawa, N. Yabuuchi, T. Ozeki, T. Nakayama, A. Ogata, K. Gotoh and K. Fujiwara, Adv. Funct. Mater., 2011, 21, 3859–3867 CrossRef CAS.
- S. Wenzel, T. Hara, J. Janek and P. Adelhelm, Energy Environ. Sci., 2011, 4, 3342–3345 CAS.
- H.-G. Wang, Z. Wu, F.-l. Meng, D.-l. Ma, X.-l. Huang, L.-M. Wang and X.-B. Zhang, Chemsuschem, 2013, 6, 56–60 CrossRef PubMed.
- Z. Wang, Y. Li and X.-J. Lv, RSC Adv., 2014, 4, 62673–62677 RSC.
- S. Wang, L. Xia, L. Yu, L. Zhang, H. Wang and X. W. Lou, Adv. Energy Mater., 2016, 6, 1502217 CrossRef.
| This journal is © The Royal Society of Chemistry 2017 |

