A sustainable and efficient process for the preparation of polyethylene–polystyrene interpolymer based anion exchange membranes by in situ chloromethylation for electrodialytic applications†
Vaibhavee
Bhadja
ab,
Souradeep
Chakraborty
a,
Sandip
Pal
a,
Rakhi
Mondal
a,
B. S.
Makwana
a and
Uma
Chatterjee
 *ab
*ab
aElectromembrane Processes Division, Bhavnagar, Gujarat, India. E-mail: umac@csmcri.org
bAcSIR-Central Salt & Marine Chemicals Research Institute, Bhavnagar, Gujarat, India
First published on 14th February 2017
Abstract
The present article describes the preparation of efficient and stable anion exchange membranes (AEMs) from the inter-polymer of polyethylene and polystyrene-co-polydivinylbenzene. The chloromethylated moiety in the interpolymer film was incorporated by an in situ Friedel–Crafts reaction followed by quaternization with trimethylamine. This process dispensed the direct use of hazardous and carcinogenic chloromethyl ether which is required for functionalization of interpolymer films. The effects of mole ratio of reactants during the electrophilic substitution reaction were investigated and the degree of chloromethylation was optimized. The anion exchange membrane was characterized by ATR-IR spectroscopy, thermogravimetric analysis, stress–strain properties, ion-exchange capacity and water uptake. The electrochemical properties such as the membrane resistance, ionic conductivity and transport number were also determined. The oxidative stability of the membrane was verified by treatment with 3% Fenton's reagent at room temperature. The performance of the membrane in terms of water desalination by electrodialysis and ultrapure water production by the electrodeionization process was evaluated and compared with those of polyethylene–poly-4-methylstyrene interpolymer based membranes and two other commercial membranes (Ionsep and Fujifilm).
Introduction
Anion exchange membranes (AEMs) are widely used in fuel cells, batteries, electrodialysis and different commercial separation processes.1–6 Several types of polymers such as polysulfone, polyether imide, poly(2,6-dimethyl-1,4-phenylene oxide), poly(arylene ether), poly(phthalazinone ether ketone), and poly(phthalazinone ether sulfone ketone) (PPESK) have been used for AEM preparation by the chloromethylation reaction using chloromethyl methyl ether (CME) followed by the quaternization reaction.7–10 Unfortunately CME is a hazardous and carcinogenic chemical and its use has been restricted. Apart from the chloromethylation reaction, AEMs have been prepared from methyl(diphenyl)phosphine (MDPP), poly(2,6-dimethyl-1,4-phenylene oxide), benzylmethyl polysulfone, and poly(arylene ether ketone) polymers via benzylic bromination using N-bromosuccinimide and benzoyl peroxide followed by quaternization using tertiary amines.11–15 During reaction with benzoyl peroxide, degradation of the polymeric backbone is possible. In addition, complete amination of the benzyl halide group is difficult and unreacted benzyl halide may further react with hydroxide anions under alkaline environments. Therefore, the extent of the quaternary ammonium moiety may reduce.16 AEMs have also been prepared from methylated melamine grafted on polyvinylbenzyl chloride by using CME.17 Recently a new method of thin surface coating on membrane surfaces with a hydrophobic layer having very narrow water channels called nanocracks has been employed to increase the permselectivity of AEMs. This coating also helped to lower the membrane resistance of AEMs.18 An alternative method of direct use of CME for the chloromethylation reaction is in situ generation which eliminates its handling.16 AEMs have been prepared from polysulfone and polyether ether ketone by in situ chloromethylation using paraformaldehyde, stannic chloride, and chlorotrimethyl silane followed by reaction with trimethyl amine.16,19 Both the AEMs exhibited similar ion-exchange capacity, transport number and ionic conductivity values to the AEMs prepared from these polymers by direct use of CME.16,19 Apart from AEMs, the preparation of chloromethylated polystyrene via in situ chloromethylation has also been well documented.20 A New type of hyper cross-linked resin was prepared from cross-linked chloromethylated polystyrene-co-divinylbenzene by reaction with acetanilide by the Friedel–Crafts reaction. The resin was used for the removal of salicylic acid from aqueous solution by an adsorption process.21 Chloromethylated polystyrene beads after reaction with 1,3-diamino urea were used to selectively remove copper ions by an adsorption mechanism.22 Cellulose grafted thiomalic acid was used for selective removal of hazardous selenium(IV) ions from waste water.23 Chloromethylated polystyrene-g-2-adenine based anion exchange resin was used for the selective detection of mercury ions in edible mushrooms.24Polyethylene–polystyrene interpolymer based AEMs prepared by the chloromethylation reaction using CME have been used for water desalination by electrodialysis.25–27 AEMs have also been prepared from the interpolymer of polyethylene and poly-4-methyl styrene by benzylic bromination of the –CH3 group of 4-methyl styrene.28,29 The AEMs have been successfully used for water desalination, ultrapure water production, and removal of fluoride and arsenic ions from water by electrodialysis as well as for the preparation of potassium sulfate by metathesis electrodialysis.30–32 Since, the cost of 4-methyl styrene is 10 times higher than the cost of styrene, in order to make the same AEM with similar performance, we propose a cost effective process for the preparation of AEMs. In this work, an AEM has been prepared from a polyethylene–polystyrene interpolymer film by in situ chloromethylation using formaldehyde, stannic chloride and chlorotrimethyl silane followed by quaternization with trimethyl amine. This process thus avoids the direct handling of CME during chloromethylation. The membrane has been used for water desalination by electrodialysis (ED), ultrapure water production by the electrodeionization (EDI) process. The desalination efficacy of this membrane has been compared with that of a polyethylene–poly-4-methylstyrene interpolymer based AEM along with two other commercial membranes (Ionsep and Fujifilm). Similarly, the properties of ultrapure water obtained by the EDI process using these four different types of AEMs have been evaluated.
Experimental
Materials
Styrene (St, 98%) and divinyl benzene (DVB 80%) were purchased from Sigma-Aldrich Chemicals and used after purification. Benzoyl peroxide (BPO 98%) (SD Fine-Chem Ltd, India) was re-crystallized from chloroform prior to use. Chloroform, methanol, and xylene were procured from Spectrochem, India. Paraformaldehyde, tinchloride (SnCl4), and chlorotrimethylsilane were purchased from TCI chemicals, Japan. Trimethylamine (TMA 30%) was purchased from Qualigens, India. All these chemicals were used as received. Film grade high density polyethylene (HDPE, F-46) and linear low density polyethylene (LLDPE, F-19) were purchased from Reliance Industries, India. The cation exchange resin (CER), cross-linked sulfonated polystyrene beads with an ion exchange capacity (IEC) of 1.9 meq. mL−1, and the anion exchange resin (AER), cross-linked quaternary ammonium polystyrene beads with an IEC of 1.0 meq. mL−1, used for EDI experiments were purchased from Ion Exchange India. The CER to AER ratio was 2![[thin space (1/6-em)]](https://www.rsc.org/images/entities/char_2009.gif) :
:![[thin space (1/6-em)]](https://www.rsc.org/images/entities/char_2009.gif) 1 (w/w) in the EDI unit.
1 (w/w) in the EDI unit.
Synthesis of the polyethylene–polystyrene (PE/PSt) interpolymer based AEM
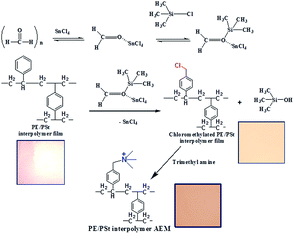
The PE/PSt interpolymer based AEM has been prepared in four steps. First, PE/PSt interpolymer pellets have been prepared from the free radical polymerization of St and DVB in the presence of PE using xylene as the solvent. Next the interpolymer pellets were converted to a thin film of thickness 0.13–0.15 mm by a melt extrusion process. The detailed procedure of the interpolymer pellet preparation and conversion of the interpolymer pellets to the interpolymer film has been reported by our group.28,29 In the third step, the in situ chloromethylation of the PE/PSt interpolymer film was carried out by reaction with paraformaldehyde, tinchloride and chlorotrimethylsilane in chloroform at 50 °C. The detailed procedure of the chloromethylation is as follows: 10 g of PE/PSt interpolymer film was immersed in 400 mL chloroform. Next paraformaldehyde (15 g, 0.5 mole) and SnCl4 (15.2 g, 0.5 mole) were added into it. After the solution became homogeneous, chlorotrimethylsilane (60 g, 0.55 mole) was added into it. The mixture was stirred at 50 °C for 3 days. Next, the film was washed with isopropanol and immersed in trimethyl amine for 24 h.Instrumental characterization of the AEM
The ATR-IR spectrum of the AEM was recorded using an Agilent instrument (Agilent Cary 600 series FTIR) at room temperature. Thermogravimetric analysis (TGA) of the AEM was carried out using a Netzsch TGA (TG209 F1 Libra) system. The samples were heated from 30 °C to 500 °C under a nitrogen atmosphere at a heating rate of 10 °C min−1. Stress–strain traces of water wet AEM samples were determined on a Zwick Roell Z2.5 tester with a 10 mm min−1 crosshead speed.Physical and electrochemical properties of the AEMs
The physical characterization such as the water uptake (%) of all the AEMs used in this work was determined by measuring the gain of weight of the membranes by using the procedure reported by us earlier.28–33 The ion-exchange capacity (IEC) of the AEMs were determined by a titration method. The membrane resistance (Rm), membrane conductivity (Km) and transport number (t−) of the AEMs were measured by using a similar procedure.28–33ED experiment
The water desalination efficiency of the developed AEM was assessed through an ED stack of effective area 65 cm2 with 5 pieces of the prepared AEM and an identical PE/PSt based inter-polymer cation exchange membrane (CEM). The electrode housing was made from rigid polyvinyl chloride (PVC) sheets with inbuilt flow distribution. The cathode and anode were made from stainless steel and a coated titanium tantalum mixed oxide. A parallel-cum-series flow arrangement in three stages was used in the ED unit. Peristaltic pumps were used to recirculate the outlet and inlet streams. The flow was 5.4 L h−1. Both the electrode chambers were interconnected and flushed with 0.01 M aqueous sodium sulphate. A known volume of water (1 L) with known total dissolved solids (TDS 2000 ppm) was re-circulated in both the diluate and concentrated compartments for all the experiments. A predetermined DC potential was applied between the electrodes by means of an AC–DC rectifier. The whole setup was maintained under ambient conditions. The samples were withdrawn at different time intervals and the TDS was measured using an Orion Versa Star instrument. Similar experiments were carried out replacing the AEM with the AEM prepared from the PE/P4-MS interpolymer based AEM prepared by benzylic bromination as well as with commercial AEMs. Fig. S1† shows the schematic diagram and membrane arrangement in the ED unit.pH and oxidative stability
The acid base stability of the membrane was verified by keeping the different AEM samples separately in 0.1 M NaCl solution for 12 h. The pH of the solution was varied from 2 to 14. The AEM samples were kept in different pH solution for 24 h to attain equilibrium. After that the ionic conductivity of the membrane was determined. The oxidative stability of the AEMs was determined by submerging the AEM in 0.1 M NaCl. Next, 3 ppm FeSO4 and 3% H2O2 were added in the mixture and the solution was kept at 40 °C for 6 h. After each hour fresh H2O2 was added externally. After that the changes in the weight, IEC and Km values were measured.33Production of ultrapure water in the EDI unit
The ultrapure water was prepared in an in-house fabricated EDI stack. A rigid PVC of thickness 10 mm was used as the electrode housing. Platinum coated expanded metal of titanium was used as the anode and a 2 mm thick stainless steel (SS-316) was used as the cathode. PVC sheets of thickness 4–5 mm were used as spacer gaskets. Holes and slits on the membrane and gaskets were made for an appropriate flow arrangement. The EDI unit was operated in continuous mode. The concentrate compartment was attached with the electrode wash compartment. Hence, no extra electrolyte solution was required to flush the electrodes. Electrical potential was applied in parallel mode to the compartments and water was passed in series mode throughout the compartments. The final flow of product water was 15 L h−1 in the diluate compartment whereas in the concentrate compartment the flow was 7.5 L h−1. Fig. S2† shows the membrane arrangement in the EDI unit. Five pieces of the PE/PSt based CEM and different types of AEMs of effective membrane area (31 cm × 5 cm) were used separately in the stack for separate comparison purposes. Mixed bed ion-exchange resin beads were placed in between the CEM and AEM. The RO permeate water of TDS 35 mg L−1 with a total organic carbon content (TOC) of 2 ppb was fed into the EDI unit and the resistance of ultrapure water was measured.Determination of the TDS, resistance, conductivity and total organic carbon content (TOC) of ultrapure water
The TDS, resistance and conductivity of the prepared ultrapure water were measured using a similar procedure to that reported by us previously.30Determination of energy consumption and current efficiency during water desalination and ultrapure water production
W (kW h kg−1 of salt removed) is a measure of the energy consumed for the transport of 1 kg of salt from the diluate compartment to the concentrate compartment. The values were estimated from eqn (1), | (1) |
 | (2) |
Results and discussion
Chloromethylation and quaternization of the PE/PSt interpolymer based AEM
Scheme 1 shows the synthetic strategy adopted for the preparation of the PE/PSt interpolymer based AEM.First, PE/PSt interpolymer films have been prepared by the process reported earlier by us.28–30 The functionalization of the interpolymer film has been achieved by in situ chloromethylation using paraformaldehyde, stannic chloride and chlorotrimethyl silane in chloroform at 50 °C for 80 h. Quaternization of the film was achieved by the reaction of the in situ chloromethylated film with trimethyl amine. The effect of ratio of reactants on the degree of chloromethylation which in turn finally controls the Rm and Km of the AEM has been explored. Table 1 shows the different formulations used for the AEM preparation by varying the mole ratio of each reactant during in situ chloromethylation.
| Entry | Paraformaldehyde (mole) | Stannic chloride (mole) | Chlorotrimethyl silane (mole) | Thickness (mm) | IEC (meq. g−1) | R m (ohm cm) |
|---|---|---|---|---|---|---|
| 1 | 1 | 2 | 1.1 | 0.15 | 0.6 | 300 |
| 2 | 1 | 1 | 1.1 | 0.15 | 1.14 | 11 |
| 3 | 1.5 | 1 | 1.1 | 0.15 | 0.75 | 210 |
| 5 | 0.5 | 1 | 1.1 | 0.15 | 0.89 | 150 |
| 6 | 1 | 1 | 2.0 | 0.15 | 0.94 | 110 |
| 7 | 1 | 1 | 0.5 | 0.15 | 0.42 | 450 |
| 8 | 1 | 1 | 1.1 | 0.18 | 0.98 | 18 |
| 9 | 1 | 1 | 1.1 | 0.20 | 0.92 | 28 |
Table 1 shows that when the mole ratio of paraformaldehyde![[thin space (1/6-em)]](https://www.rsc.org/images/entities/char_2009.gif) :
:![[thin space (1/6-em)]](https://www.rsc.org/images/entities/char_2009.gif) stannic chloride
stannic chloride![[thin space (1/6-em)]](https://www.rsc.org/images/entities/char_2009.gif) :
:![[thin space (1/6-em)]](https://www.rsc.org/images/entities/char_2009.gif) chlorotrimethyl silane was 1
chlorotrimethyl silane was 1![[thin space (1/6-em)]](https://www.rsc.org/images/entities/char_2009.gif) :
:![[thin space (1/6-em)]](https://www.rsc.org/images/entities/char_2009.gif) 1
1![[thin space (1/6-em)]](https://www.rsc.org/images/entities/char_2009.gif) :
:![[thin space (1/6-em)]](https://www.rsc.org/images/entities/char_2009.gif) 1.1 the Rm was minimum and the IEC was maximum. This is the best condition for the PE/PSt based AEM preparation by in situ chloromethylation (Table 1, entry 2). It is also observed from Table 1 that in case any deviation from the optimised mole ratio of reactants, a detrimental effect on the IEC and Rm values of the AEMs is observed. It is important to note that the thickness of the interpolymer film also has an effect on the degree of chloromethylation. The IEC and Km values decrease when the thickness of the interpolymer film increases (Table 1, entries 2, 8 and 9) under similar experimental conditions. The rate of reaction also becomes slower due to the difficulty of penetration of the reactants through the membrane surface.
1.1 the Rm was minimum and the IEC was maximum. This is the best condition for the PE/PSt based AEM preparation by in situ chloromethylation (Table 1, entry 2). It is also observed from Table 1 that in case any deviation from the optimised mole ratio of reactants, a detrimental effect on the IEC and Rm values of the AEMs is observed. It is important to note that the thickness of the interpolymer film also has an effect on the degree of chloromethylation. The IEC and Km values decrease when the thickness of the interpolymer film increases (Table 1, entries 2, 8 and 9) under similar experimental conditions. The rate of reaction also becomes slower due to the difficulty of penetration of the reactants through the membrane surface.
The above mentioned reason was verified by the surface SEM images of the films of Table 1, entries 2 and 9 (Fig. 1a–d). The surface SEM images (Fig. 1a and b, magnifications 20![[thin space (1/6-em)]](https://www.rsc.org/images/entities/char_2009.gif) 000× and 50
000× and 50![[thin space (1/6-em)]](https://www.rsc.org/images/entities/char_2009.gif) 000×) of the film (Table 1, entry 2) show a higher porosity than the SEM images of the thick film of Table 1, entry 9 (Fig. 1c and d, magnifications 20
000×) of the film (Table 1, entry 2) show a higher porosity than the SEM images of the thick film of Table 1, entry 9 (Fig. 1c and d, magnifications 20![[thin space (1/6-em)]](https://www.rsc.org/images/entities/char_2009.gif) 000× and 50
000× and 50![[thin space (1/6-em)]](https://www.rsc.org/images/entities/char_2009.gif) 000×). The higher porosity of the thin film allows better penetration of the reactants which in turn provides a better chloromethylation reaction. The formation of surface pores may presumably be due to the rapid phase inversion of the PE/PSt interpolymer after melt extrusion. Hence, the reaction will give better results in terms of membrane properties (IEC and Rm) at a low membrane thickness.
000×). The higher porosity of the thin film allows better penetration of the reactants which in turn provides a better chloromethylation reaction. The formation of surface pores may presumably be due to the rapid phase inversion of the PE/PSt interpolymer after melt extrusion. Hence, the reaction will give better results in terms of membrane properties (IEC and Rm) at a low membrane thickness.
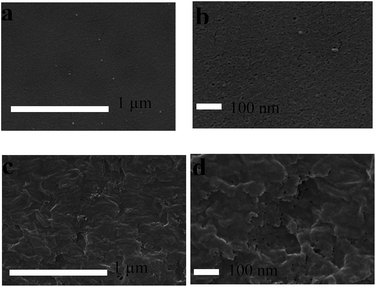 | ||
Fig. 1 Surface SEM images of interpolymer films of different thicknesses. Images (a) and (b): Table 1, entry 2 at magnifications 20![[thin space (1/6-em)]](https://www.rsc.org/images/entities/char_2009.gif) 000× and 50 000× and 50![[thin space (1/6-em)]](https://www.rsc.org/images/entities/char_2009.gif) 000×. Images (c) and (d): Table 1, entry 9 at magnifications 20 000×. Images (c) and (d): Table 1, entry 9 at magnifications 20![[thin space (1/6-em)]](https://www.rsc.org/images/entities/char_2009.gif) 000× and 50 000× and 50![[thin space (1/6-em)]](https://www.rsc.org/images/entities/char_2009.gif) 000× respectively. 000× respectively. | ||
The structure of the PE/PSt interpolymer based AEM has also been confirmed by ATR-IR spectroscopy. Fig. 2 shows the ATR-IR spectra of the chloromethylated interpolymer film and the AEM. In the ATR-IR spectrum of both the AEM and the chloromethylated interpolymer film the bands at 1466 cm−1 and 1463 cm−1 were assigned to aromatic ring stretching vibrations. In the spectrum of the chloromethylated film the peak appeared at 1870 cm−1 was due to formation of –CH2Cl. In the spectrum of the AEM, the peaks appeared at 1642 cm−1 and 609 cm−1 were due to –CH2–N+ formation after reaction with trimethyl amine.16,19 The broad absorption band in the spectrum of AEM at 3389 cm−1 was due to the quaternary ammonium group (the film was dried in a vacuum oven at 80 °C and hence the peak was not due to moisture uptake).28,29
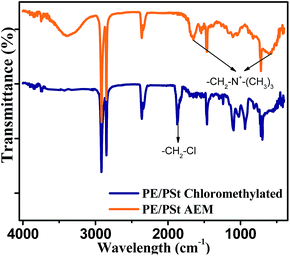 | ||
| Fig. 2 ATR IR spectrum of the chloromethylated PE/PSt interpolymer film and PE/PSt interpolymer AEM. | ||
Mechanical and thermal properties of the AEM
Mechanical properties mainly the stress–strain behaviour of the prepared AEM were measured and compared with those of the PE/P4-MS interpolymer based AEM. Fig. 3 shows the stress strain profile of the prepared AEM.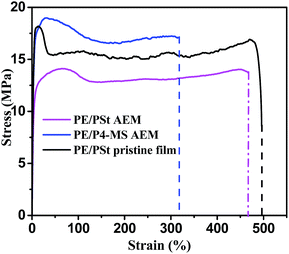 | ||
| Fig. 3 Stress vs. strain plots of PE/P4-MS and PE/PSt based AEMs and a pristine PE/PSt interpolymer film. | ||
The two different types of PE based AEMs show high mechanical stability. The tensile stress of the PE/P4-MS interpolymer based AEM is higher than that of the PE/PSt interpolymer based AEM. This may be due to the higher HDPE content (90%) in the PE/P4-MS than the HDPE content (80%) in the PE/PSt based AEM.
It is important to mention that during the preparation of the crosslinked PSt-DVB based anion exchange resin by an in situ chloromethylation reaction, the aromatic rings in the polymer skeleton are connected to each other by the formation of methylic bridges.34,35 Therefore, the degree of crosslinking increases.34,35 This enhances the brittleness. The number of available sites for further reaction with the ion-exchange functional group also reduces. The water uptake of the obtained resin reduces and leads to breakage of the resin over time through osmotic shock during adsorption processes.36 In the present case, the mechanical stress of the AEM (prepared by in situ chloromethylation) was somewhat lower than that of the pristine film due to water uptake by the AEM whereas the water uptake of the pristine film is negligibly small. The elongation remained almost unchanged after membrane formation. This indicates no negative effect of chloromethylation on the elongation of the AEM.
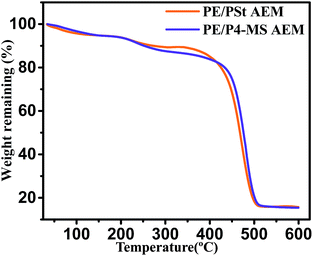
The thermal stability of the prepared AEM has been determined by TGA analysis. Fig. 4 shows the TGA thermograms of the PE/PSt based AEM and PE/P4-MS based AEM. Both the thermograms show that initially upto 150 °C heating a very small amount of (6%) weight loss is observed due to the loss of trapped water molecules. After that another 7% degradation was observed when heating the AEM upto 400 °C, which may be due to degradation of the quaternary ammonium moiety. The thermal stabilities of both PE/PSt and PE/P4-MS interpolymer based AEMs are comparable.
Physicochemical and electrochemical properties of the prepared AEM
Table 2 shows the physicochemical properties such as water uptake and electrochemical properties such as IEC, Km and t− of the prepared AEM. The water uptake and electrochemical properties of the PE/P4-MS interpolymer AEM and two other commercial AEMs (Ionsep and Fujifilm) have also been shown in Table 2 for comparison purposes.| Membranes | Thickness (mm) | Water uptake (%) | IEC (meq. g−1) | K m (mS cm−1) | t − |
|---|---|---|---|---|---|
| PE/PSt | 0.11 | 10 | 1.32 | 1.14 | 0.93 |
| PE/P4-MS | 0.20 | 14 | 1.30 | 1.12 | 0.92 |
| Ionsep | 0.40 | 40 | 2.20 | 3.20 | 0.85 |
| Fujifilm | 0.13 | 25 | 2.12 | 2.12 | 0.91 |
The water uptake of the PE/PSt interpolymer membrane is lower and t− value is higher than those of the membranes listed in Table 2. The IEC, Km and t− values of the PE/PSt based AEM are slightly higher than the values obtained with the PE/P4-MS based AEM. The IEC and Km of the PE/PSt based membrane are lower than those of commercial Ionsep and commercial Fujifilm membranes. Commercial Ionsep and Fujifilm membranes are fabric supported heterogeneous membranes and are prepared from the dispersion of a high concentration of ion-exchange resin powder solution in suitable polymer solution. On the other hand, the interpolymer membranes are prepared from radical polymerization of styrene in a polyethylene matrix. Therefore the presence of an ionic moiety in these two membranes is higher than that in interpolymer membranes. Therefore the IEC and Km values of commercial membranes are much higher than those of interpolymer membranes. The lower t− of commercial membranes may be due to high water uptake by these membranes which allows the back diffusion of ions through the membranes.33 The high t− of the PE/PSt interpolymer based AEM indicates the high permselectivity of the membrane which is due to the low water uptake of this AEM.
ED performance of AEMs
ED experiments were performed in a laboratory scale ED unit of effective membrane area 65 cm2 to assess the performance of the prepared PE/PSt interpolymer based AEM for the desalination of sodium chloride solution. Similar desalination experiments were conducted with the PE/P4-MS interpolymer based AEM and commercial Ionsep and Fujifilm AEMs for comparison purposes.Current–voltage (I–V) studies
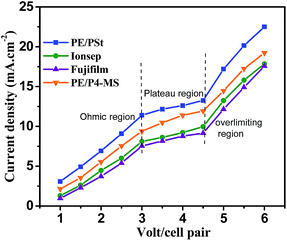
I–V plots (Fig. 5) were generated with the PE/PSt interpolymer based AEM prepared by in situ chloromethylation, PE/P4-MS prepared by benzylic bromination and commercial Fujifilm and Ionsep membranes separately. Feed water solution of TDS 2000 mg L−1 was used for this purpose. The CEM used in all the experiments was a sulfonated PE/PSt interpolymer. The voltage was varied from 1 to 6 volt per cell pair. The curves indicate typical characteristic regions, viz., ohmic region (1–3 V), non-ohmic region (3–4.5 V) and over limiting region (4.5–6 V). In the ohmic region, the current density increases linearly with the applied potential. In the plateau region or limiting current density region due to counter ion depletion at the membrane–solution interface, the current density does not increase linearly with the applied potential. In the over-limiting region the current increases suddenly due to dissociation of water molecules into hydrogen and hydroxyl ions or concentration polarisation.37The current density of the used membranes follows the trend PE/PSt > PE-P4-MS > Ionsep > Fujifilm. Therefore, the obtained current was maximum for the PE/PSt interpolymer membrane and lowest for the commercial Fujifilm membrane. Though the IEC values of commercial Ionsep and Fujifilm membranes are higher than those of indigenous membranes, the current density of indigenous membranes is higher than those of commercial membranes. Since both the commercial membranes are heterogeneous membranes and PE/PSt and PE/4-MS are homogeneous membranes, the charge distribution throughout the indigenous interpolymer membrane matrix is more uniform than that in commercial ones. Therefore the obtained current density is lower in commercial membranes.
Current vs. time and TDS vs. time plots during water desalination by ED
Fig. 6a shows the plots of current vs. time and Fig. 6b shows the TDS vs. time of the PE/PSt interpolymer based AEM prepared using in situ chloromethylation. The desalination of brackish water of 2000 mg L−1 TDS under recirculation mode was carried out with a fixed applied potential of 1.5 V per cell pair. Fig. 6a and b also include the desalination result obtained with PE/P4-MS, Ionsep and Fujifilm membranes. The experiments were stopped when the TDS of diluate compartment was around 500 ppm.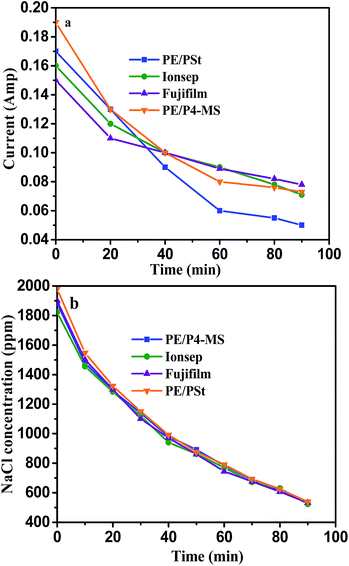 | ||
| Fig. 6 Plots of (a) current vs. time and (b) TDS vs. time for desalination of brackish water of TDS 2000 ppm using the four different types of AEMs at 1.5 volt per cell pair applied potential. | ||
Fig. 6a and b clearly reveal that with the progress of desalination time both the current and TDS decrease with all four different types of AEMs. Initially, the current was highest due to the presence of a high concentration of salt. With the progress of desalination, the current decreases due to removal of salt which increases the total ED unit resistance.30–32 Hence with time, the TDS of the diluate compartment also decreases. The rate of desalination with the above four types of membranes follows the trend PE/PSt > PE/P4-MS > Fujifilm > Ionsep which was determined by measuring W and CE (%) values during the desalination process (see later). Since, the water uptake of PE/PSt is lowest and the same is highest for the Ionsep membrane, the back diffusion of water through the membrane was lower when the salt concentration in the diluate compartment was lower and hence the rate of desalination using PE/PSt was highest.3,4,33
pH and oxidative stability
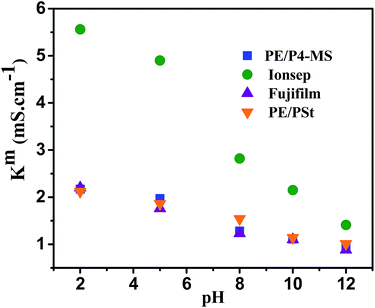
The stability of the AEMs under varying solution pH and oxidative conditions is important for their practical application in electrochemical separation processes. The stability of the four different types of AEMs in the pH window of 2 to 12 has been determined in 0.1 M NaCl solution. pH was adjusted by addition of HCl or NaOH. Fig. 7 shows the variation of Km with pH for the four different types of AEMs. The Km value was highest at pH 2 for all four types of AEMs. This may be due to the increased mobility of ions at lower pH. The Km value of PE/P4-MS, PE/PSt and commercial Fujifilm membranes is almost constant in the pH window of 8–10. For the commercial Ionsep membrane the Km decreases with increase of pH. Therefore for this particular AEM there is a loss of functional groups. Therefore all three AEMs except Ionsep are stable upto pH 12. The Ionsep membrane is stable upto pH 8 and hence it can be used for water desalination by an ED process.The oxidative stability of the AEMs was determined by exposure to Fenton's reagent at 40 °C for 6 h. Since, water desalination is generally carried out at room temperature we had performed the oxidative stability test at 40 °C by measuring the change in the IEC, weight and Km values of all the membranes. There was a very minimum weight (0.5%) loss after oxidative degradation for all the AEMs. Fig. 8 shows the IEC and Kmvs. time plots of all four AEMs.
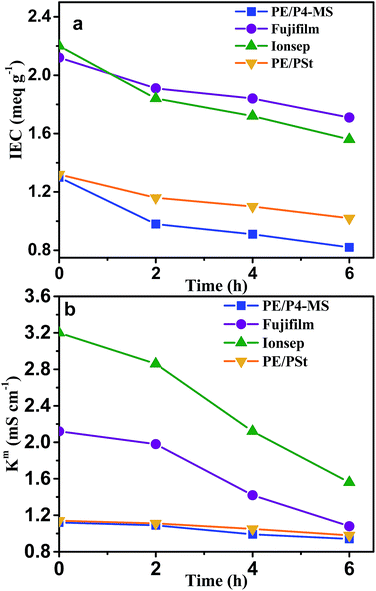 | ||
| Fig. 8 Variation of the (a) IEC and (b) Km of all four AEMs with time during exposure to Fenton's reagent. | ||
Ultrapure water production by an electrodeionization (EDI) process
An EDI experiment was carried out by circulating feed water of TDS 35 mg L−1 through an EDI unit packed with the PE/PSt interpolymer based membranes. In order to determine the optimum applied potential where the resistance of the produced ultrapure water was maximum, the EDI experiment was carried out at three different applied potentials (15, 18 and 20 volt per cell pair). The flow was kept constant at 15 L h−1. The pH of the product water remained constant (6.9–7.2). Fig. 9a shows the variation of the current density with time and Fig. 9b shows the variation of the resistance with time at different applied potentials for PE/PSt membranes. The current density increased when the applied potential was increased from 15–20 volt per cell pair due to faster dissociation of water molecules at higher applied potentials. The value of the current density at any applied potential increased initially and then remained constant throughout the experiment. The initial increase of the current density may be due to the contact of surface water with the mixed bed resin which is more conductive than diluted feed water and present in excess.30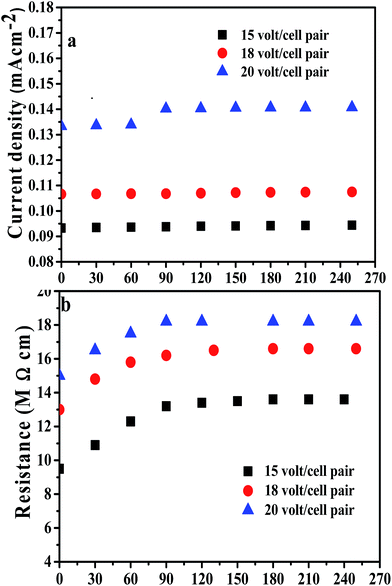 | ||
| Fig. 9 (a) shows the variation of current density with time and (b) shows the variation of resistance with time at different applied potentials using PE/PSt interpolymer membranes. | ||
It is also observed from Fig. 9b that the resistance of the product water increases with increase of the applied potential. The value of the resistance was 13.6, 16.6 and 18.2 MΩ cm at 15, 18 and 20 volt per cell pair respectively. The maximum resistance of 18.2 MΩ cm of ultrapure water was achieved at 20 volt per cell pair. At higher applied potentials resin regeneration becomes fast; therefore the resistance of the final water increases.30 The properties of the ultrapure water obtained with PE/PSt membranes have been measured and compared with those of the ultrapure water produced with PE/P4-MS and commercial Ionsep and Fujifilm membranes.30 These values have been presented in Table 3.
| Types of AEMs | Applied potential (volt per cell pair) | Final TDS (ppm) | pH | Ionic resistance (MΩ) | Final conductivity (μS cm−1) | TOC | Reference |
|---|---|---|---|---|---|---|---|
| PE/PSt | 20 | 0.025 | 7–7.2 | 18.2 | 0.053 | <1 ppb | This work |
| PE/P4-MS | 20 | 0.056 | 7–7.2 | 10.2 | 0.083 | <1 ppb | This work |
| PE/P4-MS | 25 | 0.027 | 7–7.2 | 18.1 | 0.054 | <1 ppb | This work |
| Ionsep | 30 | 0.04 | 7.2–7.4 | 15.0 | 0.067 | <1 ppb | This work |
| Fujifilm | 30 | 0.032 | 7–7.2 | 17.1 | 0.062 | <1 ppb | This work |
Therefore, the ionic resistance of the ultrapure water produced with the PE/PSt membrane was similar to that with PE/P4-MS membranes and higher than those with commercial Fujifilm and Ionsep membranes. Table 3 (entries 1 and 2) reveals that when the experiment was conducted at a fixed 20 volt per cell pair applied potential using PE/P4-MS membranes the resistance of the obtained ultrapure water was only 10.2 MΩ cm and much lower than the value obtained with PE/PSt membranes at a similar applied potential. The resistance value increased from 10.2 to 18.2 MΩ cm, when the applied potential was increased from 20 to 25 volt per cell pair (Table 3, entry 3) for PE/P4-MS membranes. This may be due to insufficient water splitting with PE/P4-MS membranes at low applied potentials. Therefore the cost of ultrapure water produced with PE/P4-MS membranes will be higher due to high power consumption for its preparation with PE/P4-MS than that produced with PE/PSt membranes.
Determination of W and CE (%) values during ED and EDI processes
The W and CE values during water desalination (feed TDS 1850–1900 ppm) by ED at 1.5 volt per cell pair applied potential using the different types of AEMs and a PE/PSt interpolymer CEM have been calculated. The W and CE values during ultrapure water production by an EDI process have also been calculated and presented in Table 4.| Types of AEMs | Feed water TDS (ppm) | Final water TDS (ppm) | W (kW h kg−1) | CE (%) | Reference |
|---|---|---|---|---|---|
| a During water desalination by the ED process. b During ultrapure water production by the EDI process. | |||||
| PE/PSta | 1884 | 533 | 0.710 | 96.00 | This work |
| PE/PStb | 35 | 0.027 | 0.256 | 68.00 | This work |
| PE/P4-MSa | 1980 | 539 | 0.760 | 90.00 | This work |
| PE/P4-MSb | 35 | 0.027 | 0.324 | 58.86 | 30 |
| Ionsepa | 1823 | 523 | 0.840 | 82.00 | This work |
| Ionsepb | 35 | 0.070 | 0.60 | 38.0 | This work |
| Fujifilma | 1900 | 532 | 0.800 | 86.00 | This work |
| Fujifilmb | 35 | 0.032 | 0.40 | 58 | This work |
Thus, it is observed from Table 4 that PE/PSt interpolymer membranes require less energy than the PE/P4-MS interpolymer membrane for both water desalination by the ED process and also for ultrapure water production by the EDI process. The PE/PSt membrane also requires less energy and shows a higher current efficiency than commercial membranes during ED and EDI processes.
Conclusions
An alternative pathway for polyethylene–polystyrene (PE/PSt) interpolymer anion exchange membrane (AEM) preparation has been demonstrated. Polyethylene–polystyrene interpolymer pellets prepared by free radical copolymerization of polyethylene and styrene were converted to a thin film by a blow extrusion process. Functionalization was achieved by in situ chloromethylation using paraformaldehyde, tin chloride and chlorotrimethyl silane. In this way, use of hazardous chloromethyl methyl ether was avoided. The prepared AEM showed slightly better water desalination performances by ED in terms of less power consumption and higher current efficiency than a polyethylene–poly-4-methyl styrene (PE/P4-MS) interpolymer based AEM which was prepared by benzylic bromination of the methyl group of methyl styrene. The PE/PSt interpolymer AEM also exhibited a higher efficiency during ultrapure water production by electrodeionization than the PE/P4-MS interpolymer AEM and commercial (Ionsep and Fujifilm) AEMs. The PE/PSt interpolymer AEM requires a low applied potential (20 volt per cell pair) to produce ultrapure water of resistance 18.2 MΩ cm whereas the PE/P4-MS membrane requires 25 volt per cell pair applied potential to produce ultrapure water of resistance 18.2 MΩ cm. In contrast, commercial Fujifilm and Ionsep membranes can produce ultrapure water of maximum resistance 17.1 and 15 MΩ cm respectively at 30 volt per cell pair applied potential. Therefore, the cost of ultrapure water produced with the PE/PSt interpolymer membrane is lower or than that produced with the other three reported membranes. This is attributed to its higher or similar transport number and lower water uptake than all three membranes. The cost of styrene monomers is 10 times lower than the cost of 4-methyl styrene monomers. Hence the overall cost of the PE/PSt interpolymer membrane will be around 10 times lower than that of the PE/P4-MS interpolymer AEM and the process might be economical for large scale preparation of the AEM.Acknowledgements
Dr Uma Chatterjee acknowledges DST-WTI Govt of India (WTI/TM/2K15/11) for financial support. CSMCRI registration number of this work is 144/2016. We thank the centralised analytical facility of CSIR-CSMCRI for analytical support.Notes and references
- A. D. Mohanty, Y.-B. Lee, L. Zhu, M. A. Hickner and C. Bae, Macromolecules, 2014, 47, 1973 CrossRef CAS.
- G. Marle, M. Wessling and K. Nijmeijer, J. Membr. Sci., 2011, 377, 1 CrossRef.
- U. Chatterjee and S. K. Jewrajka, J. Mater. Chem. A, 2014, 2, 8396 CAS.
- U. Chatterjee, V. Bhadja and S. K. Jewrajka, J. Mater. Chem. A, 2014, 2, 16124 CAS.
- X. Tongwen, J. Membr. Sci., 2005, 263, 1 CrossRef.
- P. Długołecki, K. Nijmeijer, S. Metz and M. Wessling, J. Membr. Sci., 2008, 319, 214 CrossRef.
- G. Wang, Y. Weng, D. Chu, R. Chen and D. Xie, J. Membr. Sci., 2009, 332, 63 CrossRef CAS.
- T. Xu, Z. Liu, Y. Li and W. Yang, J. Membr. Sci., 2008, 320, 232 CrossRef CAS.
- X. Li, Q. Liu, Y. Yu and Y. Meng, J. Mater. Chem. A, 2013, 1, 4324 CAS.
- H. J. Lee, M. K. Hong, S. D. Han and S. H. Moon, J. Membr. Sci., 2008, 320, 549 CrossRef CAS.
- J. Yan and M. A. Hickner, Macromolecules, 2010, 43, 2349 CrossRef CAS.
- M. R. Hibbs, C. H. Fujimoto and C. J. Corneli, Macromolecules, 2009, 42, 8316 CrossRef CAS.
- T. Xu, Z. Liu and W. Yang, J. Membr. Sci., 2005, 249, 183 CrossRef CAS.
- C. H. Zhao, Y. Gong, Q. L. Liu, Q. G. Zhang and A. M. Zhu, Int. J. Hydrogen Energy, 2012, 37, 11383 CrossRef CAS.
- M. I. Khan, R. Lique, S. Akhtar, A. Shaheen, A. Mehmood, S. Idress, S. A. Buzdar and A. U. Rehman, Materials, 2016, 9, 365 CrossRef.
- A. Jasti, S. Prakash and V. K. Shahi, J. Membr. Sci., 2013, 428, 470 CrossRef CAS.
- Y.-C. Cao, X. Wang, M. Mamlouk and K. scott, J. Mater. Chem., 2011, 21, 12910 RSC.
- C. H. Park, S. Y. Lee, D. S. Hwang, D. W. Shin, D. H. Cho, K. H. Lee, T.-W. Kim, T.-W. Kim, M. Lee, D.-S. Kim, C. M. Doherty, A. W. Thornton, A. J. Hill, M. D. Guiver and Y. M. Lee, Nature, 2016, 532, 480 CrossRef PubMed.
- M. Manohar, A. K. Thakur, R. P. Pandey and V. K. Shahi, J. Membr. Sci., 2015, 493, 250 CrossRef.
- S. Itsuna, K. Uchikoshi and K. Ito, J. Am. Chem. Soc., 1990, 112, 8187 CrossRef.
- J. Huang, X. Wang, X. Wang and K. Huang, Ind. Eng. Chem. Res., 2011, 50, 2891 CrossRef CAS.
- C. Shen, Y. Chang, L. Fang, M. Min and C. H. Xiong, New J. Chem., 2016, 40, 3588 RSC.
- M. Min, C. Shen, L. Fang, B. Zhu, J. Li, L. Yao, Y. Jiang and C. Xiong, Chem. Eng. Res. Des., 2017, 117, 773 CrossRef CAS.
- S. Li, Y. Feng, L. Fang, X. Zheng, D. Chen, L. Yao and C. Xiong, Can. J. Chem., 2016, 94, 751 CrossRef CAS.
- A. S. Gozdz and W. Ttrochimczuk, J. Appl. Polym. Sci., 1980, 25, 947 CrossRef CAS.
- G. Pozniak and W. Trochimcluk, J. Appl. Polym. Sci., 1982, 27, 1833 CrossRef CAS.
- G. Poźniak and W. Trochimczuk, Angew. Makromol. Chem., 1980, 92, 155 CrossRef.
- M. Dinda, U. Chatterjee, V. Kulshrestha, S. Sharma, S. Ghosh, G. R. Desale, V. K. Shahi, B. S. Makwana, P. D. Maru, V. Bhadja, S. Maiti and P. K. Ghosh, J. Membr. Sci., 2015, 493, 373 CrossRef CAS.
- V. Kulshrestha, U. Chatterjee, S. Sharma, B. S. Makwana and P. D. Maru, Macromol. Symp., 2015, 357, 194 CrossRef CAS.
- V. Bhadja, B. S. Makwana, S. Maiti, S. Sharma and U. Chatterjee, Ind. Eng. Chem. Res., 2015, 54, 10974 CrossRef CAS.
- V. Bhadja, J. S. Trivedi and U. Chatterjee, RSC Adv., 2016, 6, 67118 RSC.
- J. S. Trivedi, V. Bhadja, B. S. Makwana, S. K. Jewrajka and U. Chatterjee, RSC Adv., 2016, 6, 71807 RSC.
- V. Bhadja, U. Chatterjee and S. K. Jewrajka, RSC Adv., 2015, 5, 40026 RSC.
- G. D. Jones, Ind. Eng. Chem., 1952, 44, 2686 CrossRef CAS.
- K. W. Pepper, H. M. Paisley and M. A. Young, J. Chem. Soc., 1953, 4097 RSC.
- G. L. Burnett, J. C. Rohanna, S. Rosenberg, A. K. Schultz and J. R. de Alaniz, J. Polym. Sci., Part A: Polym. Chem., 2016, 54, 1966 CrossRef.
- Y.-J. Choi, J.-M. Park, K.-H. Yeon and S.-H. Moon, J. Membr. Sci., 2005, 250, 295 CrossRef CAS.
Footnote |
| † Electronic supplementary information (ESI) available. See DOI: 10.1039/c7se00048k |
| This journal is © The Royal Society of Chemistry 2017 |

