
 Open Access Article
 This Open Access Article is licensed under a Creative Commons Attribution-Non Commercial 3.0 Unported Licence
Synthesis and characterization of nickel-doped ceria nanoparticles with improved surface reducibility†
Wassila Derafaab,
Fotios Paloukisa,
Basma Mewafya,
Walid Baazizc,
Ovidiu Ersen c,
Corinne Petita,
Gwenaël Corbeld and
Spyridon Zafeiratos*a
c,
Corinne Petita,
Gwenaël Corbeld and
Spyridon Zafeiratos*a
aInstitut de Chimie et Procédés pour l'Energie, l'Environnement et la Santé (ICPEES), ECPM, UMR 7515 CNRS, Université de Strasbourg, 25 rue Becquerel, 67087 Strasbourg Cedex 02, France. E-mail: spiros.zafeiratos@unistra.fr
bChemistry Department, College of Science, Jouf University, P. O. Box: 2014, Sakaka, Saudi Arabia
cInstitut de Physique et Chimie des Matériaux de Strasbourg (IPCMS), UMR 7504 du CNRS, Université de Strasbourg, 23 rue du Loess, 67037 Strasbourg Cedex 08, France
dInstitut des Molécules et Matériaux du Mans, IMMM-UMR 6283 CNRS, Le Mans Université, Avenue Olivier Messiaen, 72085 Le Mans Cedex 9, France
First published on 5th December 2018
Abstract
Nickel-doped ceria nanoparticles (Ni0.1Ce0.9O2−x NPs) were fabricated from Schiff-base complexes and characterized by various microscopic and spectroscopic methods. Clear evidence is provided for incorporation of nickel ions in the ceria lattice in the form of Ni3+ species which is considered as the hole trapped state of Ni2+. The Ni0.1Ce0.9O2−x NPs exhibit enhanced reducibility in H2 as compared to conventional ceria-supported Ni particles, while in O2 the dopant nickel cations are oxidized at higher valence than the supported ones.
Introduction
Cerium(IV) oxide, also known as ceria (CeO2), is largely exploited in catalysis and electrocatalysis,1 such as for example, as a constituent of three-way automotive catalysts.2 The unique catalytic properties of ceria have been connected to the facile and reversible exchange between Ce4+ and Ce3+ oxidation states which allows fast uptake and release of oxygen under oxidizing and reducing conditions, respectively. Although oxidation of Ce3+ ions is kinetically fast, the reduction of Ce4+ is generally sluggish, therefore great effort has been devoted to promote ceria reducibility3 either by modifying the size and the morphology of the crystals or by partial substitution of cerium by metal ions.4,5 The latter has been also exploited as a strategy to produce catalysts containing metal ions atomically dispersed on the oxide support, usually referred to as single-atom catalysts.6,7 A prerequisite for the synthesis of metal-substituted ceria particles is the formation of a homogenous solid solution between the metal and ceria. Conventional catalyst synthesis methods, e.g. co-precipitation, are not capable of that and typically lead to the formation of segregated metal/ceria agglomerates.8 Therefore, realizing the homogeneous dispersion of metal into the ceria lattice is a critical challenge in the effort to synthesize novel single-atom catalysts and there are only few available methods for that. Recently W. L. Wang et al.,9 proposed a synthesis route that involves a solution of the two metal salts which react in a continuous reactor in the presence of supercritical water (374 °C and 23 MPa). Alternatively, S. McIntosh and co-workers, demonstrated that Cu-doped ceria nanoparticles can be synthesized at room temperature in aqueous solution using a modified base precipitation method.10 These methods do not involve organic compounds and so, does not require a cleaning step after preparation. On the downside, the absence of an organic protective layer constitutes the particles potentially vulnerable to aggregation and agglomeration. In an alternative synthesis method put forward by Elias et al.11 a solution-based pyrolysis route is followed to produce phase pure, monodisperse M0.1Ce0.9O2−x (M: Ni, Co, Au) nanoparticles. To ensure close association of cerium and transition metal ions during their nucleation and growth heterobimetallic Schiff base complexes were used as inorganic precursors. By this method the nanoparticles are surrounded by an oleylamine protective layer, which allows obtaining narrow size distributions of relatively small particles (ca. 3 nm). However, the synthesis is relatively complex since it requires 3 consecutive steps.In this work we modulate/simplified the previously proposed method11 to prepare nickel-doped ceria NPs from Schiff base metal complexes obtained in one step, without pre-synthesis of the salpn (N,N′-bis(salicylidene)-1,3-diaminopropane) ligand molecule. The structure and composition of the produced NPs were verified by various methods, including XPS, HR-TEM, Raman and XRD, while their surface reducibility is compared to conventional supported Ni/CeO2 using in situ structural and surface sensitive techniques.
Materials and methods
Synthesis of Ni0.1Ce0.9O2−x nanoparticles
The Ni0.1Ce0.9O2−x nanoparticles (hereafter abbreviated as NiCe NPs) were synthesized by mixing the heterobimetallic Schiff base complexes precursors in oleylamine and reflux the mixture at 180 °C under Ar (see Scheme 1). The Schiff base complexes were prepared directly, without using a Schiff base ligand as in ref. 11. For characterization, the NiCe NPs were dispersed in hexane solution and dropped casted on various inert supports (polycrystalline gold foil, silicon wafer and fused quartz glass) and the solvent was allowed to evaporate at room temperature, leaving a layer of nanoparticles grafted on the support. A reference 10%Ni/CeO2 sample (hereafter Ni/CeO2) was prepared by the co-precipitation synthesis route. Detailed description of the synthesis and the characterization methods is included in ESI 1.†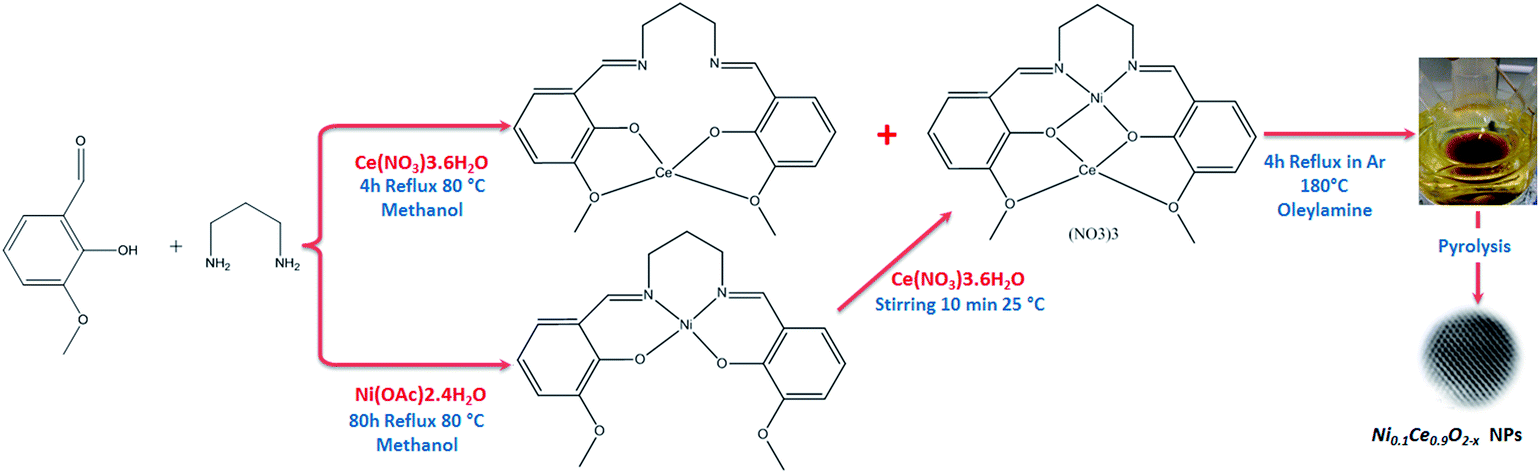 | ||
| Scheme 1 Schematic illustration of the preparation of the Ni0.1Ce0.9O2−x nanoparticles. | ||
Characterization methods
The X-ray photoelectron spectroscopy (XPS) analysis chamber is equipped with VSW Class WA hemispherical electron analyzer (150 mm radius) and a monochromatic Al Kα X-ray source (1486.6 eV). Oxidation/reduction treatments were carried out in a flow-through variable-pressure reactor attached to the UHV setup (0.6 L volume). Each oxidation/reduction step lasted 30 min at constant temperature and gas pressure. The pressure of the gas (H2 or O2) treatment was 7 mbar. Subsequently to the gas treatment, the sample was cooled to room temperature in gas and the reactor was evacuated to 5 × 10⁻⁸ mbar. Then the sample was transferred in vacuum into the analysis chamber for XPS characterization.The XRD spectra were recorded at 25 °C intervals between 25 and 400 °C (heating rate of 10 °C min−1, temperature stabilization for 20 min, cooling rate of 60 °C min−1) by using a XRK 900 Anton Paar reactor chamber attached to a PANalytical θ/θ Bragg–Brentano Empyrean diffractometer (CuKα1+2 radiations) equipped with the PIXcel1D detector. The sample was deposited on the sieve (pore size ∅ 0.2 mm) of the open sample holder cup, both made of glass ceramic Macor, thus allowing gas to flow through and eventually reacting with the sample. For CeO2/NiO (10 mol%) powder sample, the diffractogram was collected at each temperature in the [20–130°] scattering angle range with a 0.0131° step for a total acquisition time of 220 min. For Ni0.1Ce0.9O2−x drop casted sample, the diffractogram was collected at each temperature in the [20–65°] scattering angle range with a 0.0131° step for a total acquisition time of 155 min. The program FullProf12 was used for Le Bail refinements. The size of the coherent diffusion domains, which are frequently assigned to the average particle size, was estimated by measuring the full-width at the half maximum (FWHM) of the Bragg peaks, taking into account the instrumental contribution. Typically the error in such estimation is considered around 10%.
Raman spectra were acquired using a micro-Raman spectrometer (Horiba LabRam), with excitation wavelength of 532 nm. A 100× objective was used to focus the excitation laser to an approximately 1 μm spot with a laser power of less than 1 mW to avoid heating and damage of the sample.
The surface morphology was inspected by SEM using a Zeiss GeminiSEM 500 microscope. Energy-dispersive X-ray spectroscopy (EDXS) mapping was combined with the SEM images to resolve the different elements on the surface of the electrodes. The TEM analysis of Ni0.1Ce0.9O2−x was carried out in scanning mode (STEM) using bright field and annular dark field detectors on a JEOL 2100F working at 200 kV, equipped with a probe aberration corrector. The sample powder was dispersed in a beaker containing ethanol solution and sonicated for 5 minutes inside an ultrasound bath. Then, a dropper (Pasteur pipette) was used to deposit one drop of the as prepared solution on a commercial copper grid covered with a holey carbon membrane destined to the TEM observation.
Results and discussion
Characterization of Ni0.1Ce0.9O2−x nanoparticles and films
The X-ray diffraction (XRD) patterns of NiCe NPs before and after calcination are shown in Fig. 1a. Both patterns are characteristic of fluorite-type CeO2 phase without extra peaks originating from Ni-containing phase. The absence of Ni diffraction peaks indicates the successful introduction of the entire amount of Ni ions in the ceria lattice and the absence of segregated nickel.13 The cubic unit cell parameter is slightly increasing after calcination from 5.421(1) Å to 5.424(1) Å in good agreement with the parameter determined by Elias et al. for ceria NPs (aCeria ≈ 5.42 Å).11 The unit cell parameter for the NiCe NPs is larger than the one typically reported for undoped bulk CeO2 grains (5.411 Å).14 At first sight this may appear to oppose the fact that nickel ion is smaller in size than Ce4+,15 however the lattice expansion can be explained by the creation of extrinsic oxygen vacancies through the aliovalent substitution of Ce4+ with Nin+.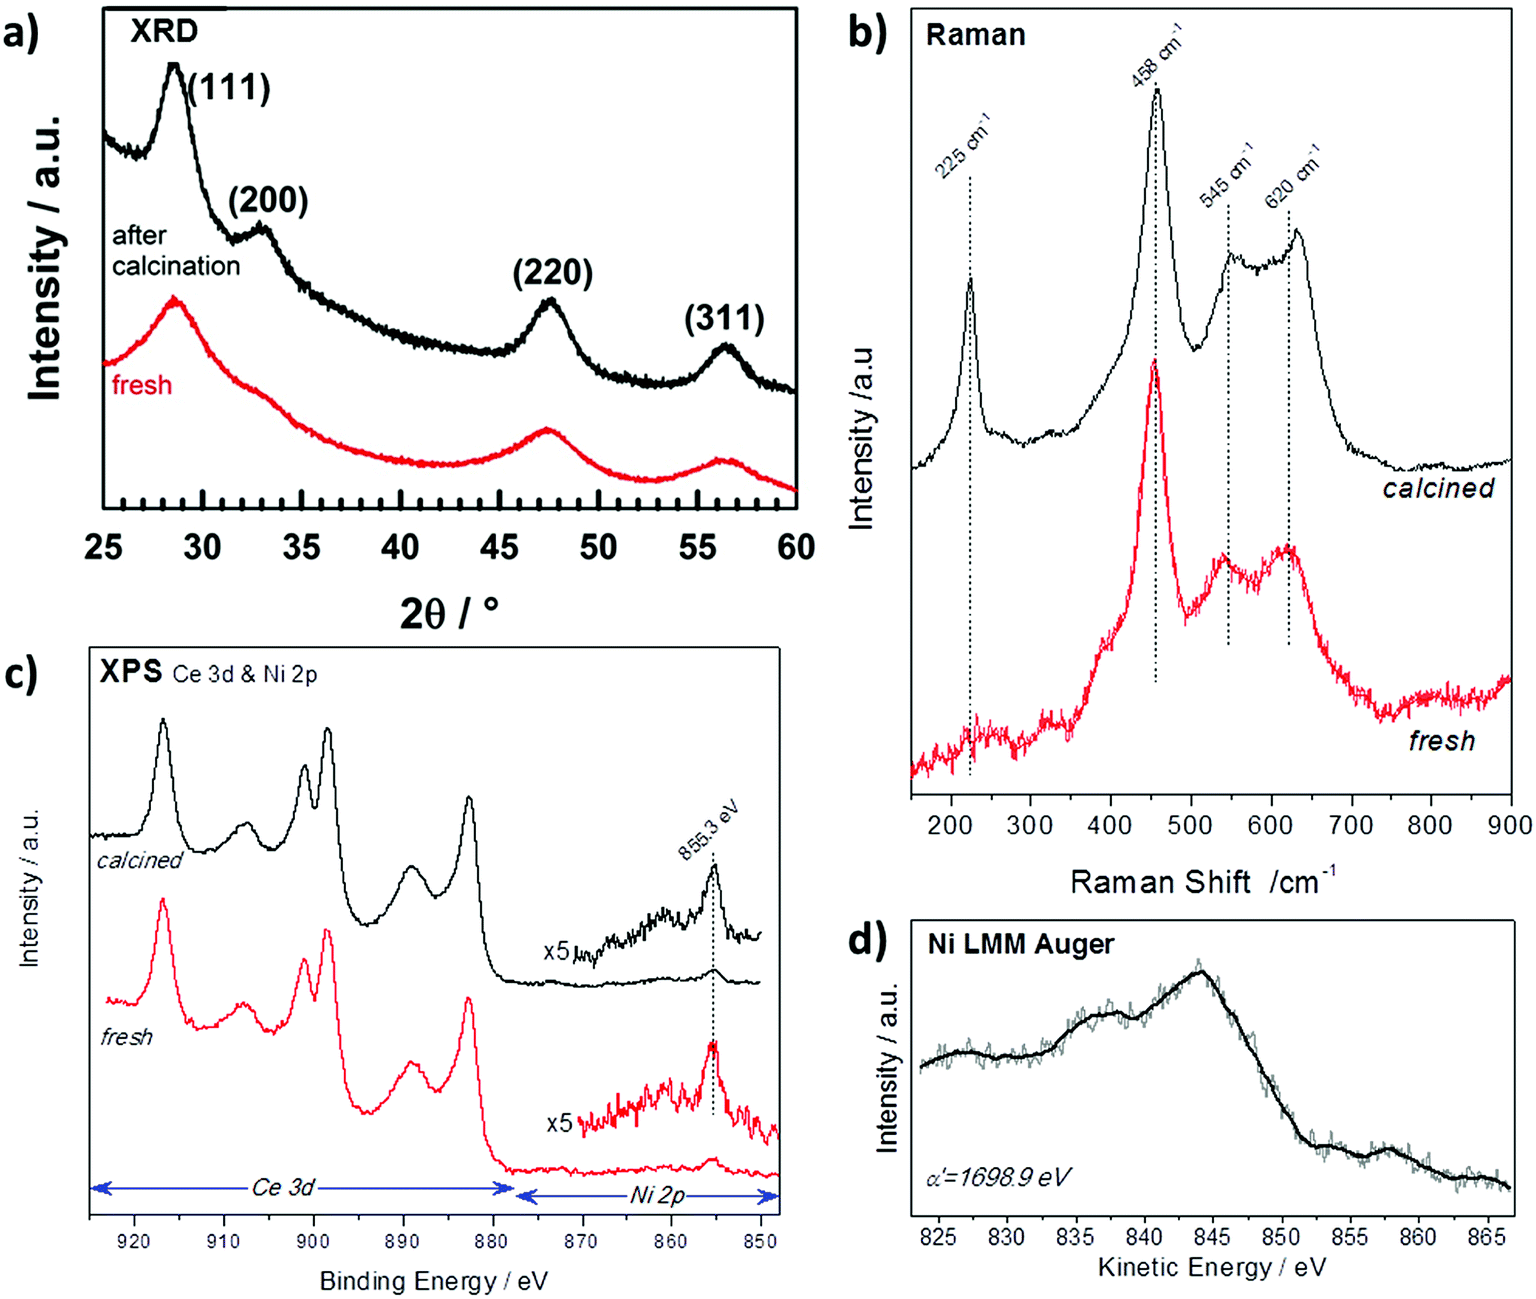 | ||
| Fig. 1 (a) XRD patterns (b) Raman spectra and (c) XPS spectra (d) Auger spectrum of Ni0.1Ce0.9O2−x particles as synthesized (red) and after calcination at 400 °C in O2 (black). | ||
Raman spectroscopy is sensitive to the modification of the local structure of the ceria crystal and particularly to lattice defects.16 Fig. 1b shows the baseline corrected Raman spectra of fresh and calcined NiCe NPs. The main Raman band at 458 cm−1 corresponds to the triply degenerate F2g mode of fluorite-type ceria structure and it can be considered as the symmetric stretching mode of oxygen atoms around cerium ions.17 Two addition features are observed at about 545 and 620 cm−1 which according to previous studies are induced by defects in the ceria structure.16,18 The lower-wavenumber band at 545 cm−1 is attributed to defect sites that include an O2− vacancy (extrinsic vacancy), while the higher-wavenumber band at 620 cm−1 is induced by the presence of Ce3+ or Ni3+ ions.16,18–20 The peak at 225 cm−1 is the transverse optical (TO) phonon mode, which, it becomes Raman active due to the disorder induced by doping in CeO2.20 Comparison of the Raman spectra before and after calcination in Fig. 1b shows that fresh NiCe particles contain a great number of defect sites which, to a large extent, remain also after calcination at 400 °C. Since the amount of extrinsic oxygen vacancies is directly related to the oxidation state of nickel ions, this indicates the stability of nickel oxidation state during calcination.
XPS can be used to confirm the oxidation state of Ce and Ni ions as well as to their surface arrangement.21 In Fig. 1c are presented the Ce 3d and Ni 2p spectra before and after calcination of NiCe NPs. The Ce 3d photoelectron peak contains several multiple splitting features including the intense peak at 916.8 eV which is characteristic for Ce4+ ions.21 The Ni 2p3/2 line is composed by a main peak at 855.3 ± 0.1 eV and a satellite feature at higher binding energies with relative intensity about 25 ± 5% of the main Ni 2p3/2 peak. The binding energy (BE) position and the peak shape do not correspond to nickel oxides or hydroxides reported in relevant literature.22–25 Similarly, the Ni LMM Auger peak shape and the so called modified Auger parameter (α′) at 1698.9 eV shown in Fig. 1d, differ from previously published results of oxidized nickel compounds.24
These findings suggest that the chemical environment around Ni cations varies from the known bulk nickel oxides (e.g. NiO). On the other hand, previous studies of Ni3+ species formed after potassium interaction with NiO26,27 exhibit similar Ni 2p3/2 peak characteristics with the one found here, which is strong evidence that in the case of NiCe NPs, nickel is mainly in the Ni3+ state. More conclusive results about the oxidation state of nickel will be provided after comparison with supported nickel oxide particles in the next section. The Ni![[thin space (1/6-em)]](https://www.rsc.org/images/entities/char_2009.gif) :Ce atomic stoichiometry calculated by XPS is found 12:88 ± 2%, close to the expected stoichiometry of Ni0.1Ce0.9O2−x particles (10:90). This stoichiometry remains constant after calcination which indicates the stability of the NPs during this process and excludes surface segregation phenomena. Overall XRD, Raman and XPS analysis of the NiCe NPs provides solid evidence for the formation of Ni doped-ceria particles with the expected stoichiometry and high stability to the calcination procedure.
:Ce atomic stoichiometry calculated by XPS is found 12:88 ± 2%, close to the expected stoichiometry of Ni0.1Ce0.9O2−x particles (10:90). This stoichiometry remains constant after calcination which indicates the stability of the NPs during this process and excludes surface segregation phenomena. Overall XRD, Raman and XPS analysis of the NiCe NPs provides solid evidence for the formation of Ni doped-ceria particles with the expected stoichiometry and high stability to the calcination procedure.
The SEM micrograph of the NiCe NPs applied by drop casting on a SiO2/Si substrate is shown in Fig. 2a. The texture of the fresh film is not homogenous and consists of flat areas interrupted by parts where the texture is porous. After calcination at 400 °C and removal of the capping oleylamine layer, the NPs have the tendency to agglomerate and form a flat and homogenous film on both SiO2/Si and Au foil substrates as shown in Fig. 2b and c. Apparently, the flat nature of the NiCe NPs film demonstrates the tendency of the solution to wet the support and form layers instead of agglomerated particles. Based on the quantitative analysis of the SEM images using EDX the Ni atomic ratio was found 11.0 ± 1.5%, which is in good agreement with both XPS findings and the nominal Ni loading.
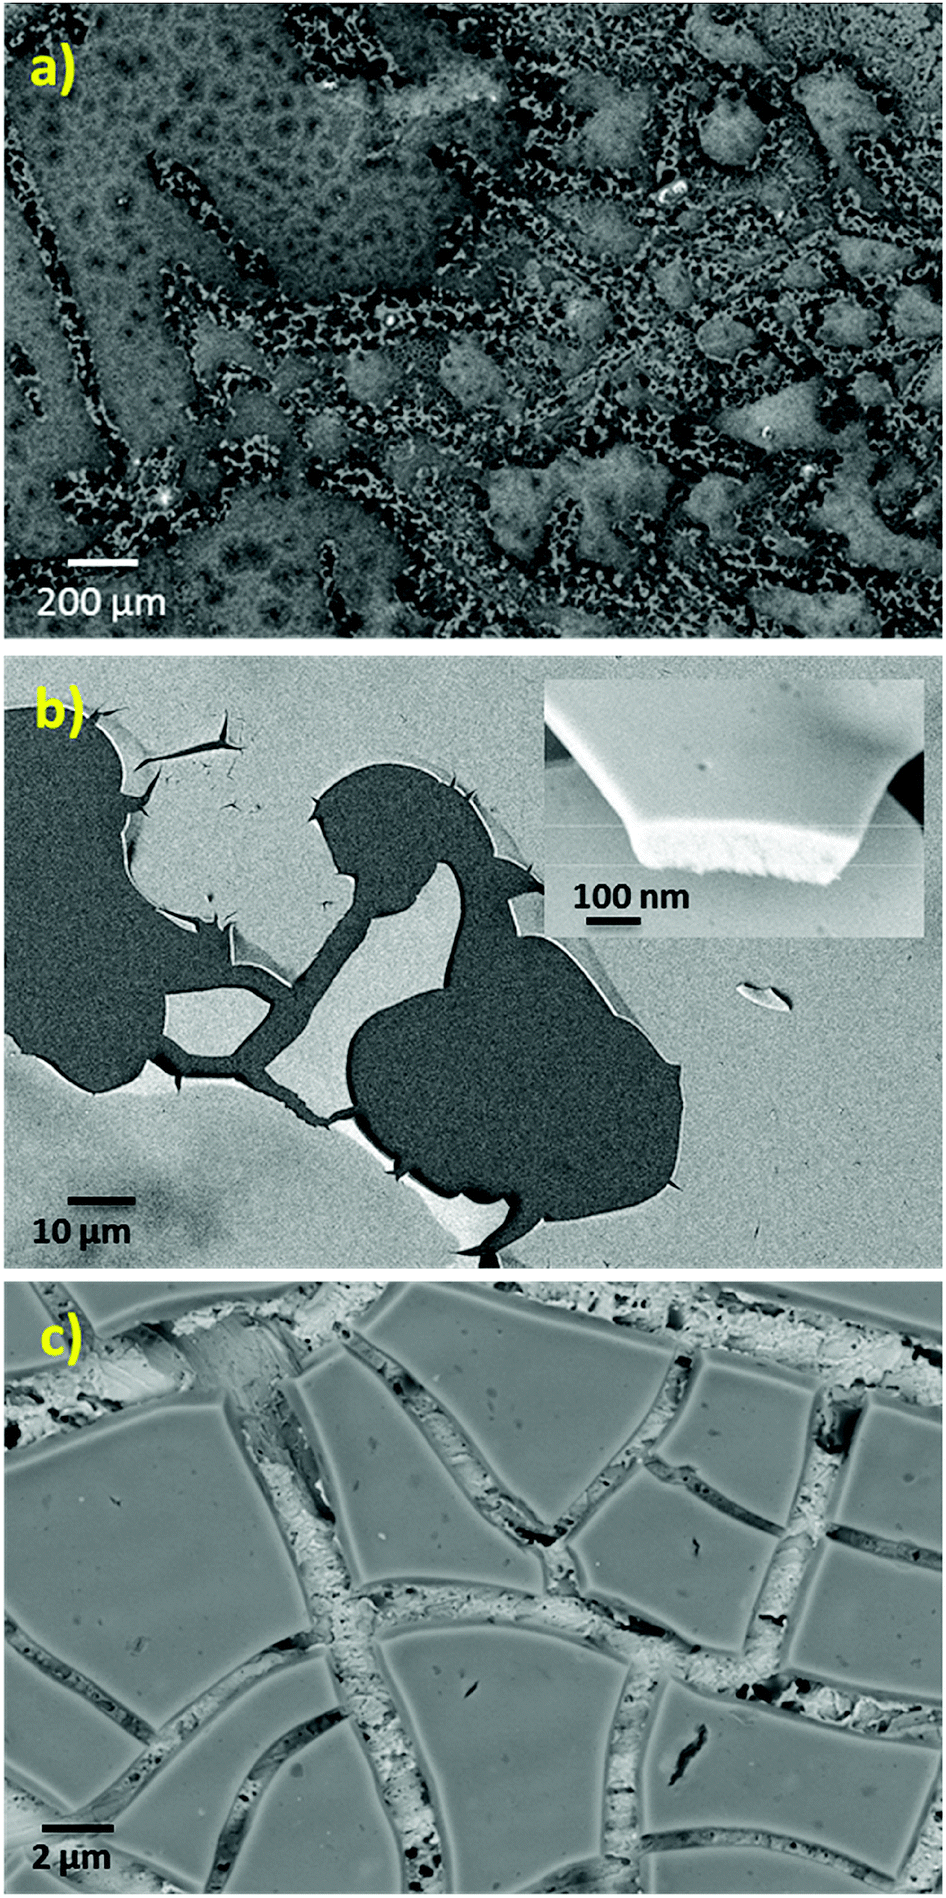 | ||
| Fig. 2 SEM images of a Ni0.1Ce0.9O2−x layer (a) fresh after drop casting the solution on a SiO2/Si wafer (b) after calcination at 400 °C on a SiO2/Si wafer and (c) after calcination at 400 °C on a Au polycrystalline foil. | ||
The HR-TEM images (Fig. 3a and S2 (ESI)†) after calcination shows aggregated NiCe NPs with a mean diameter of about 4 nm, similar to previous work.11 Typical high resolution STEM images (Fig. 3b and c) show the high crystallinity of the calcined NiCe NPs and reveal that the crystallites are formed in truncated octahedral crystal habits. The corresponding Fast Fourier Transform (FFT) patterns (Fig. 3d) suggest that the {111} and {100} are the mainly exposed facets of the NPs.
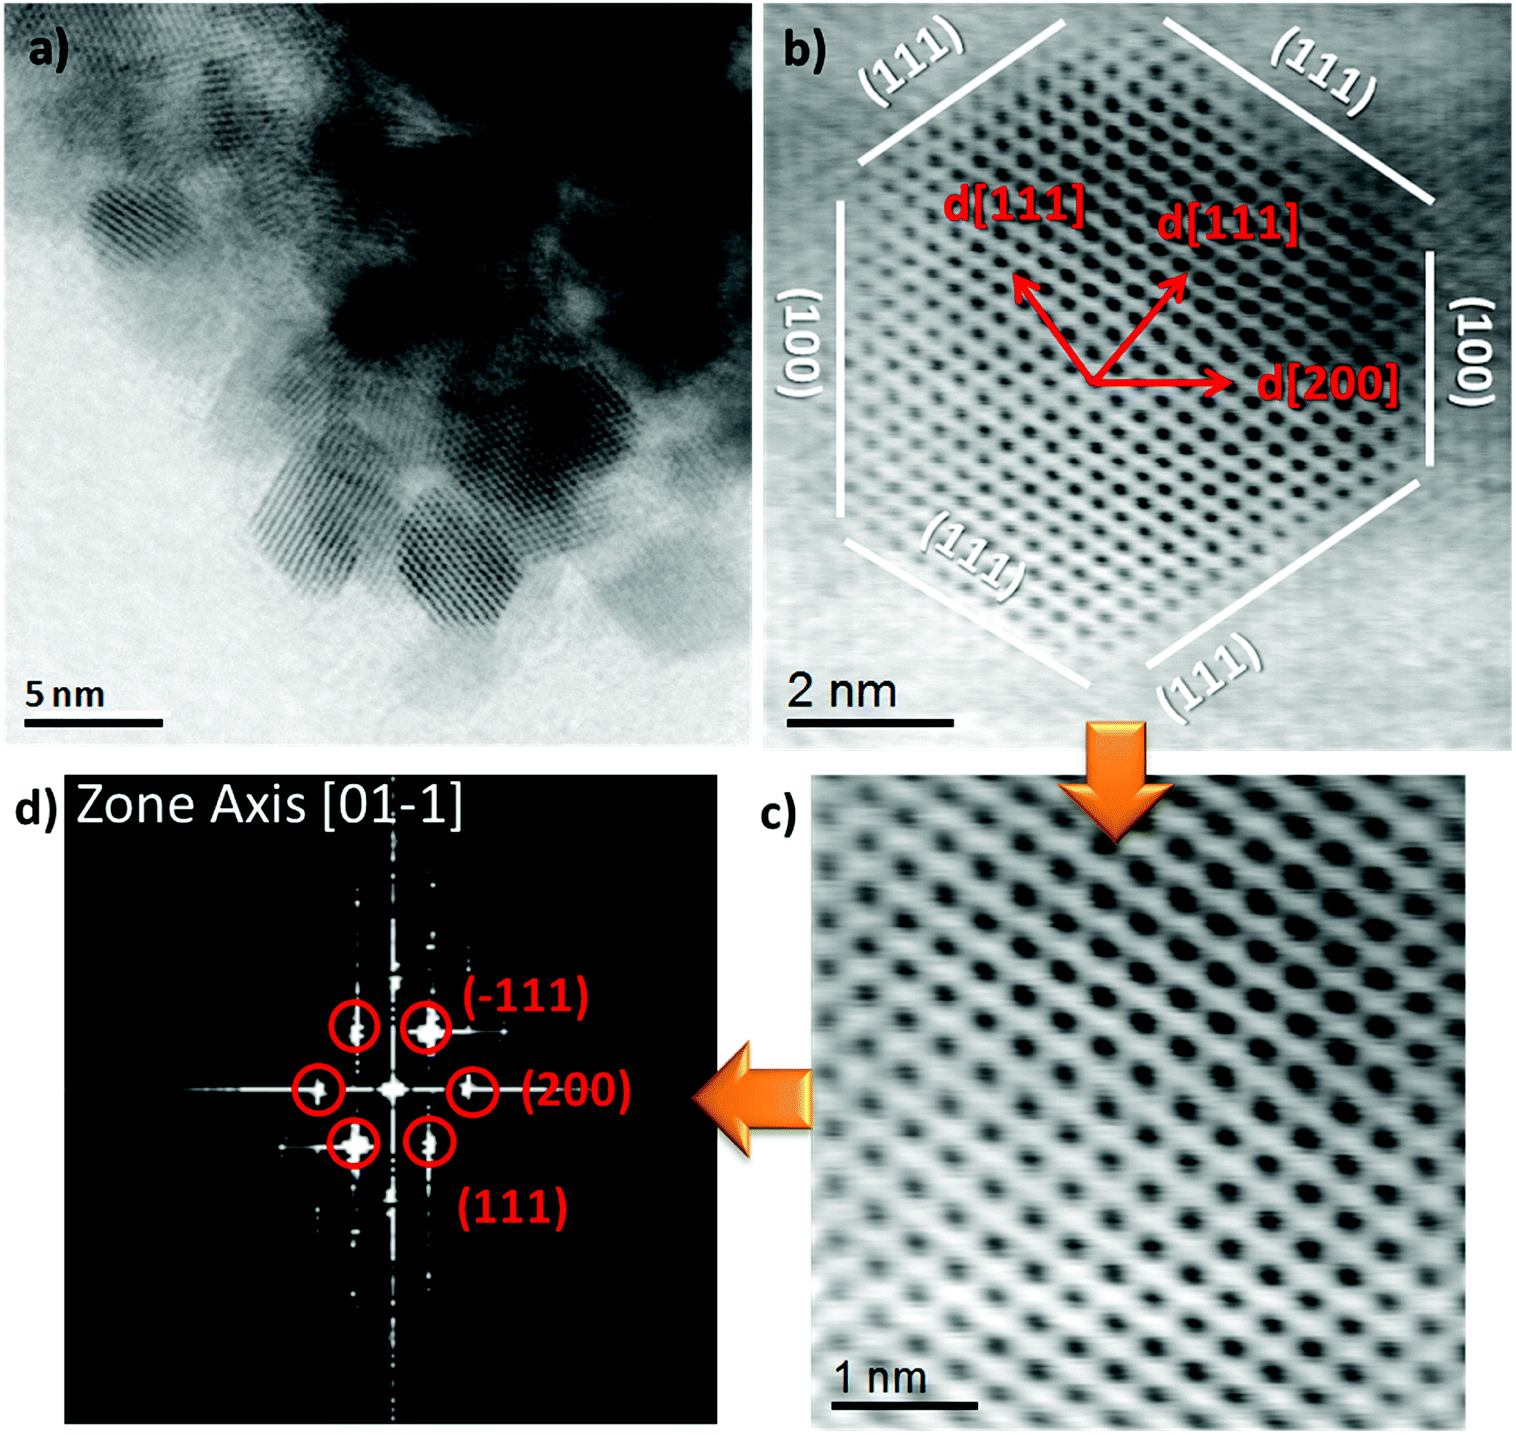 | ||
| Fig. 3 High resolution bright field STEM image and the corresponding FFT diffraction pattern of Ni0.1Ce0.9O2−x formed after calcination at 400 °C. | ||
Investigation of the redox properties of Ni0.1Ce0.9O2−x nanoparticles
The redox stability of NiCe NPs is investigated next, in comparison with supported Ni/CeO2 of the same nominal composition. Generally in catalytic studies temperature programmed methods (TP) are employed to examine the redox properties. However such methods are not suitable for NiCe NPs since require a relatively high solid sample loading, which bypass the capacity of the synthesis method and needs scale up. Furthermore, TP methods present some drawbacks mostly related to the overlapping of the peak profiles and the difficulty to identify with certainty surface and bulk processes. Alternatively, analytical methods can be used to provide direct information about the oxidation state during, or after, redox treatments.28,29 Although this is a more elaborate approach, is preferential for the purpose of this study since it can be specific on the surface redox properties providing that surface sensitive methods are used.In ESI 3† in situ temperature controlled XRD experiments obtained during consecutive reduction and oxidation (redox) cycles of pre-calcined NiCe NPs and Ni/CeO2 are compared in Fig. S3.† The diffraction patterns of the NiCe are similar to that of pure CeO2 cubic structure and remain almost identical in both H2 and O2 atmospheres for all annealing temperatures (Fig. S3†). Notably, there is no appearance of diffraction peaks related to Ni or NiO. The calculated cubic unit cell parameter of NiCe NPs remains practically constant in both atmospheres (Table 1). Therefore, within the XRD detection limits, the NiCe NPs are stable during the redox treatment in terms of dispersion and nature of the presented phases in good agreement with previous ex situ XRD reports.30 The average apparent size of the NiCe crystallites determined at room temperature (by refinement after removing the instrumental line broadening) was 20(2) Å, and 37(4) Å after calcination at 400 °C in O2 and H2, respectively, which is in good agreement with the HR-TEM results. The results show that the NPs can be reduced inducing a large amount of oxygen vacancies while keeping their structure practically stable. In contrast to NiCe NPs, in the XRD pattern of Ni/CeO2 in addition to the CeO2 diffraction, Ni-related peaks are detected (Fig. S3†). In particular, the calcined Ni/CeO2 contains a large (200) Bragg peak at around 43.3° in 2θ assigned to NiO. When annealed in H2, a complete reduction of NiO into Ni occurs at 300 °C (appearance of the (111) peak at around 44.5° in 2θ assigned to Ni in Fig. S3†). In a consecutive reoxidation cycle, a large amount of metallic Ni remains present even after annealing in O2 at 400 °C the reoxidation is therefore partial (Fig. S3†). The diffraction peaks related to CeO2 and accordingly the cubic unit cell parameters of Ni/CeO2 sample remain practically stable during both redox treatments (Table 1).
| Sample | aCeria (Å) at 25 °C, after annealing at 400 °C, under 96%N2–4%O2 | aCeria (Å) at 25 °C, after annealing at 400 °C, under 96%N2–4%H2 |
|---|---|---|
| CeO2/NiO (10 mol%) | 5.4103(1) | 5.4109(1) |
| Ni0.1Ce0.9O2−x | 5.421(1) | 5.424(1) |
The XPS analysis performed under gas and temperature conditions similar to XRD is informative of the stability in the near surface region. The Ce 3d and Ni 2p spectra of the NiCe NPs and Ni/CeO2 after H2 and O2 treatments at two characteristic temperatures are shown in Fig. 4. Comparison of the relative Ni 2p to Ce 3d peak intensities between the two samples shows that in case of Ni/CeO2 the intensity of Ni 2p peak is enhanced as compared to the NiCe NPs. In particular, the atomic ratio of Ni from about 12 ± 2 at Ni0.1Ce0.9O2−x increases to 35 ± 2 in case Ni/CeO2, which seems surprising since both samples have the same nominal Ni loading. This is rationalized by taking into account the differences in the morphology of the two samples. The co-precipitation forms Ni particles dispersed on the ceria surface,31 while Ni in the case of NiCe NPs is inserted into ceria lattice. Given that XPS is surface sensitive, Ni particles dispersed over ceria support (Ni/CeO2) is expected to have an enhanced Ni atomic ratio in XPS, as compared to Ni atoms inserted into the fluorite lattice of ceria (NiCe NPs).
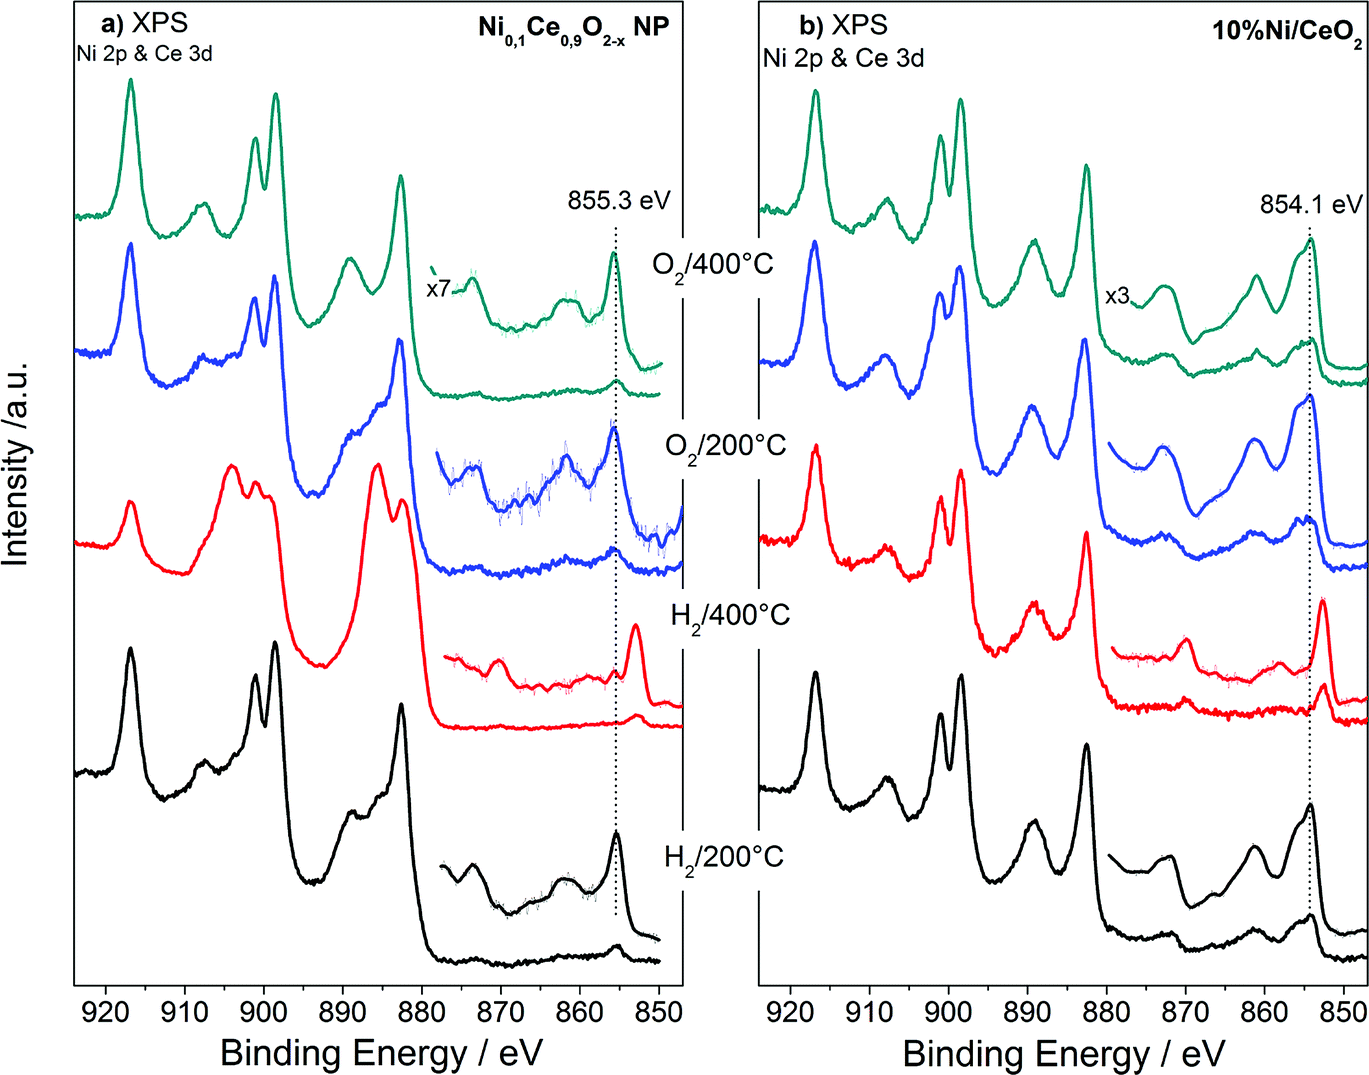 | ||
| Fig. 4 Ni 2p and Ce 3d XPS spectra of Ni0.1Ce0.9O2−x NPs (a) and 10%Ni/CeO2 (b) upon treatment up to 400 °C in O2 and H2 atmospheres. | ||
Apart of the differences in the peak area ratio, the two samples exhibit clear differences also in the peak shape (Fig. 5). As discussed above, in O2 and low temperature H2 the Ni 2p3/2 peak of NiCe NPs is likely due to Ni3+ species. In case of Ni/CeO2 the main Ni 2p3/2 peak at 854.1 eV is accompanied by a prominent shoulder around 855.3 eV and an intense satellite feature (50 ± 5% of the main Ni 2p3/2 peak height) shifted 6.9 eV of the main peak (Fig. 5a), typical characteristics of the Ni 2p spectrum for bulk NiO.22–25 These differences confirms that in the case of NiCe NPs nickel is mainly in the Ni3+ state, while for Ni/CeO2 is oxidized to NiO (Ni2+ valence) and reveals a fundamental chemical modification of nickel impended in the ceria lattice as compared to supported nickel particles. The oxidation state of nickel remains unchanged up to 200 °C in H2, while at 400 °C in H2 Ni 2p3/2 shifts at 852.7 eV and the satellite peak intensity drops considerably. This is a clear indication of reduction of nickel to the metallic state for both samples and completes the XRD observations shown above.
 | ||
| Fig. 5 (a) Comparison of the Ni 2p3/2 spectra between 10% Ni/CeO2 and NiCe NPs samples recorded after calcination at 400 °C (b) deconvolution procedure of two characteristic Ce 3d XPS spectra using Ce4+ and Ce3+ line shapes derived from reference samples recorded under identical reduction conditions (400 °C in H2). | ||
The Ce 3d spectra of the two samples differ considerably after H2 and O2 treatments. The % Ce3+ species obtained after deconvolution of Ce 3d peak in Ce3+ and Ce4+ components (Fig. 5b) are given in Table 2. From this table it is clear that under identical H2 treatment conditions the amount of Ce3+ species for NiCe NPs is up to 7 times higher as compared to Ni/CeO2. The ceria stoichiometry in case of NiCe NPs, as calculated by the % Ce3+ at 400 °C in H2, is CeO1.63. Such a composition adopts a Bixbyite type C–Ce2O3+δ structure,32 which has a cubic superstructure (a ≈ 11.11 Å), originating from the ordering of oxygen vacancies along the [111] direction of the fluorite type structure. The calculated XRD pattern of C–Ce2O3+δ contains several superstructure peaks of low intensity at 2θ 19.5°, 34.2°, 37.9° and 41.4°, in addition to intense peaks at 2θ 27.8°, 32.2°, 46.2° similar to those observed for CeO2. However the detection of the small superstructure peaks characteristic of the C–Ce2O3+δ phase in the XRD pattern of NiCe NPs (Fig. S3†), is impossible due to a broadening of all Bragg peaks induced by the small size of coherent diffraction domains (37(4) Å).
| Conditions | % Ce3+ | |
|---|---|---|
| Ni0.1Ce0.9O2−x | 10%Ni/CeO2 | |
| Calcined | 0 | 0 |
| 200 °C in H2 | 27 | 5 |
| 400 °C in H2 | 74 | 10 |
| 200 °C in O2 | 31 | 10 |
| 400 °C in O2 | 0 | 0 |
Doped-ceria nanoparticles have been studied for a number of applications including catalytic CO oxidation10,11 and electrocatalytic CO2 reduction,33 showing an excellent performance as compared to standard supported catalysts. The reducibility of ceria, i.e. the facile transformation of Ce cations from Ce4+ to Ce3+, is a crucial property for the catalytic applications since it is related to the ability of the material to release and uptake O atoms during reactions.34 The present findings show that the reducibility of ceria is enhanced when Ni is doped into the lattice, as compared to Ni deposited over ceria supports. The enhanced reducibility of NiCe NPs can be used to design improved catalysts when enhanced ceria reducibility is required. For example, facile ceria reduction is known to promote heterogeneous catalytic reactions following the Mars–van-Krevelen reaction mechanism.35,36
Apart of the apparent influence on the ceria reducibility, the synthetic strategy reported here has an additional advantage which is related to the fact that the NiCe NPs are solved in hexane solution. This solvent has a high viscosity (0.30 mPa s@25 °C) which allows facile access of the solution containing NiCe NPs via capillary forces into the channels of porous supports as compared to NPs in aqueous media. High viscosity can find direct application for the use of this material in the preparation of solid oxide cell electrodes (SOCE). In recent years there is an increase interest to fabricate SOCE by direct infiltration of the electrode material on a porous electrolyte scaffold.37–40 Typically, ceria is deposited from nitrate solutions which have much lower viscosity than hexane, often resulting in a non-uniform in depth distribution of ceria into the pores of the scaffold. The application of doped ceria nanoparticles prepared by the method described in this work for the development of highly efficient SOCE, will be explored in future studies. We expect that the enhanced reducibility of ceria which was evident in this study, in combination with the facile application of the nanoparticles into the channels of the scaffold, based on the high viscosity of hexane solutions, is a promising combination which can contribute to the development of more robust and active solid oxide electrodes for fuel cell and electrolysis applications.
Conclusions
In summary, Ni0.1Ce0.9O2−x nanoparticles with mean diameter of about 4 nm, were synthesized from heterobimetallic Schiff base complexes precursors using a two-step process. The as prepared particles are dispersed in hexane solution and later dropped casted onto planar supports for characterization. A variety of analytical methods including, XPS, XRD, Raman, STEM, and SEM were applied to ascertain the structure, morphology and chemical state of the nanoparticles before and after calcination at 400 °C. Among other things, the results illustrated the presence of trivalent Ni3+ ions and a considerably high amount of defect sites into the ceria particles. The reduction/oxidation of the Ni0.1Ce0.9O2−x nanoparticles in H2/O2 ambients respectively, was studied by XPS and in situ XRD. For comparison ceria-supported nickel particles prepared by standard co-precipitation method, were examined under the same conditions. Notably, the surface reducibility of ceria is enhanced when Ni is doped into the ceria lattice, as compared to ceria acting just as the Ni support. Considering that the reducibility of ceria determines to a large extent the facility of this material to store and release oxygen, the Ni0.1Ce0.9O2−x nanoparticles prepared by this method can be potentially exploited in a variety of technological fields such as heterogeneous catalysis and solid oxide electrochemical cells.Conflicts of interest
There are no conflicts to declare.Acknowledgements
S. Z., F. P. and B. M. acknowledge financial support from the Fuel Cells and Hydrogen 2 (H2020) Joint Undertaking under Project SElySOs with Grant Agreement 671481. We thank Dr T. Dintzer for the SEM images and Prof. A. Ourari for his suggestions regarding the synthesis.References
- T. Montini, M. Melchionna, M. Monai and P. Fornasiero, Chem. Rev., 2016, 116, 5987–6041 CrossRef CAS PubMed.
- J. Wang, H. Chen, Z. Hu, M. Yao and Y. Li, Catal. Rev.: Sci. Eng., 2015, 57, 79–144 CrossRef CAS.
- X. Liu, K. Zhou, L. Wang, B. Wang and Y. Li, J. Am. Chem. Soc., 2009, 131, 3140–3141 CrossRef CAS PubMed.
- Y. Ma, W. Gao, Z. Zhang, S. Zhang, Z. Tian, Y. Liu, J. C. Ho and Y. Qu, Surf. Sci. Rep., 2018, 73, 1–36 CrossRef.
- A. Trovarelli and J. Llorca, ACS Catal., 2017, 7, 4716–4735 CrossRef CAS.
- X.-F. Yang, A. Wang, B. Qiao, J. Li, J. Liu and T. Zhang, Acc. Chem. Res., 2013, 46, 1740–1748 CrossRef CAS PubMed.
- M. Flytzani-Stephanopoulos and B. C. Gates, Annu. Rev. Chem. Biomol. Eng., 2012, 3, 545–574 CrossRef CAS PubMed.
- S. Mahammadunnisa, P. Manoj Kumar Reddy, N. Lingaiah and C. Subrahmanyam, Catal. Sci. Technol., 2013, 3, 730–736 RSC.
- W. L. Wang, W. Y. Liu, X. L. Weng, Y. Shang, J. J. Chen, Z. G. Chen and Z. B. Wu, J. Mater. Chem. A, 2018, 6, 866–870 RSC.
- C. D. Curran, L. Lu, C. J. Kiely and S. McIntosh, J. Mater. Chem. A, 2018, 6, 244–255 RSC.
- J. S. Elias, M. Risch, L. Giordano, A. N. Mansour and Y. Shao-Horn, J. Am. Chem. Soc., 2014, 136, 17193–17200 CrossRef CAS PubMed.
- J. Rodríguez-Carvajal, Phys. B, 1993, 192, 55–69 CrossRef.
- Z. Weng, W. Liu, L. C. Yin, R. Fang, M. Li, E. I. Altman, Q. Fan, F. Li, H. M. Cheng and H. Wang, Nano Lett., 2015, 15, 7704–7710 CrossRef CAS PubMed.
- G. Zhou, L. Barrio, S. Agnoli, S. D. Senanayake, J. Evans, A. Kubacka, M. Estrella, J. C. Hanson, A. Martínez-Arias, M. Fernández-García and J. A. Rodriguez, Angew. Chem., Int. Ed., 2010, 49, 9680–9684 CrossRef CAS PubMed.
- R. D. Shannon, Acta Crystallogr., Sect. A: Cryst. Phys., Diffr., Theor. Gen. Crystallogr., 1976, 32, 751–767 CrossRef.
- T. Taniguchi, T. Watanabe, N. Sugiyama, A. K. Subramani, H. Wagata, N. Matsushita and M. Yoshimura, J. Phys. Chem. C, 2009, 113, 19789–19793 CrossRef CAS.
- B. Xu, Q. Zhang, S. Yuan, M. Zhang and T. Ohno, Appl. Catal., B, 2016, 183, 361–370 CrossRef CAS.
- C. A. Chagas, E. F. de Souza, R. L. Manfro, S. M. Landi, M. M. V. M. Souza and M. Schmal, Appl. Catal., B, 2016, 182, 257–265 CrossRef CAS.
- M. Li, U. Tumuluri, Z. Wu and S. Dai, ChemSusChem, 2015, 8, 3651–3660 CrossRef CAS PubMed.
- B. Paul, K. Kumar, A. Chowdhury and A. Roy, J. Appl. Phys., 2017, 122, 135108 CrossRef.
- V. Papaefthimiou, M. Shishkin, D. K. Niakolas, M. Athanasiou, Y. T. Law, R. Arrigo, D. Teschner, M. Hävecker, A. Knop-Gericke, R. Schlögl, T. Ziegler, S. G. Neophytides and S. Zafeiratos, Adv. Energy Mater., 2013, 3, 762–769 CrossRef CAS.
- V. V. Kaichev, D. Teschner, A. A. Saraev, S. S. Kosolobov, A. Y. Gladky, I. P. Prosvirin, N. A. Rudina, A. B. Ayupov, R. Blume, M. Hävecker, A. Knop-Gericke, R. Schlögl, A. V. Latyshev and V. I. Bukhtiyarov, J. Catal., 2016, 334, 23–33 CrossRef CAS.
- B. P. Payne, M. C. Biesinger and N. S. McIntyre, J. Electron Spectrosc. Relat. Phenom., 2009, 175, 55–65 CrossRef CAS.
- M. C. Biesinger, L. W. M. Lau, A. R. Gerson and R. S. C. Smart, Phys. Chem. Chem. Phys., 2012, 14, 2434 RSC.
- M. C. Biesinger, B. P. Payne, L. W. M. Lau, A. Gerson and R. S. C. Smart, Surf. Interface Anal., 2009, 41, 324–332 CrossRef CAS.
- A. F. Carley, S. D. Jackson, J. N. O'Shea and M. W. Roberts, Surf. Sci., 1999, 440, L868–L874 CrossRef CAS.
- A. F. Carley, S. D. Jackson, J. N. O'Shea and M. W. Roberts, Phys. Chem. Chem. Phys., 2001, 3, 274–281 RSC.
- H. Sohn, I. I. Soykal, S. Zhang, J. Shan, F. Tao, J. T. Miller and U. S. Ozkan, J. Phys. Chem. C, 2016, 120, 14631–14642 CrossRef CAS.
- W. Luo, W. Baaziz, Q. Cao, H. Ba, R. Baati, O. Ersen, C. Pham-Huu and S. Zafeiratos, ACS Appl. Mater. Interfaces, 2017, 9(39), 34256–34268 CrossRef CAS PubMed.
- W. Qi, K. Xie, M. Liu, G. Wu, Y. Wang, Y. Zhang and Y. Wu, RSC Adv., 2014, 4, 40494–40504 RSC.
- B. Nematollahi, M. Rezaei and E. N. Lay, Int. J. Hydrogen Energy, 2015, 40, 8539–8547 CrossRef CAS.
- E. Kümmerle and G. Heger, J. Solid State Chem., 1999, 147, 485–500 CrossRef.
- Y. Wang, Z. Chen, P. Han, Y. Du, Z. Gu, X. Xu and G. Zheng, ACS Catal., 2018, 8, 7113–7119 CrossRef CAS.
- W. Zou, C. Ge, M. Lu, S. Wu, Y. Wang, J. Sun, Y. Pu, C. Tang, F. Gao and L. Dong, RSC Adv., 2015, 5, 98335–98343 RSC.
- M. Lykaki, E. Pachatouridou, S. A. C. Carabineiro, E. Iliopoulou, C. Andriopoulou, N. Kallithrakas-Kontos, S. Boghosian and M. Konsolakis, Appl. Catal., B, 2018, 230, 18–28 CrossRef CAS.
- I. Y. Kaplin, E. S. Lokteva, E. V. Golubina, K. I. Maslakov, N. E. Strokova, S. A. Chernyak and V. V. Lunin, RSC Adv., 2017, 7, 51359–51372 RSC.
- J. M. Vohs and R. J. Gorte, Adv. Mater., 2009, 21, 943–956 CrossRef CAS.
- P. Boldrin, E. Ruiz-Trejo, J. W. Yu, R. I. Gruar, C. J. Tighe, K. C. Chang, J. Ilavsky, J. A. Darr and N. Brandon, J. Mater. Chem. A, 2015, 3, 3011–3018 RSC.
- A. Chrzan, S. Ovtar, P. Jasinski, M. Chen and A. Hauch, J. Power Sources, 2017, 353, 67–76 CrossRef CAS.
- X. Lou, Z. Liu, S. Wang, Y. Xiu, C. P. Wong and M. Liu, J. Power Sources, 2010, 195, 419–424 CrossRef CAS.
Footnote |
| † Electronic supplementary information (ESI) available: Experimental details of synthesis and characterization, STEM images of NiCe NPs, in situ XRD analysis during redox cycles. See DOI: 10.1039/c8ra07995a |
| This journal is © The Royal Society of Chemistry 2018 |