 Open Access Article
Phase separation behavior of poly(methyl methacrylate)/poly(styrene-co-maleic anhydride) in the presence of hollow silica nanotubes
Xiong Lv,
Min Zuo *,
Haimo Zhang,
An Zhao,
Weipu Zhu
 and
Qiang Zheng
MOE Key Laboratory of Macromolecule Synthesis and Functionalization, Ministry of Education, Department of Polymer Science and Engineering, Zhejiang University, Hangzhou 310027, China. E-mail: kezuomin@zju.edu.cn
First published on 5th December 2018
Abstract
The phase separation behavior of poly(methyl methacrylate) (PMMA)/poly(styrene-co-maleic anhydride) (SMA) blends with and without one-dimensional hollow silica nanotubes (HSNTs) was investigated using time-resolved small-angle laser light scattering. During isothermal annealing over a range of 100 °C above the glass transition temperature, the Arrhenius equation is applicable to describe the temperature dependence of phase separation behavior at the early and late stages of spinodal decomposition (SD) for unfilled and filled PMMA/SMA systems. The mechanical barrier effect of HSNTs on the macromolecular chain diffusion of the blend matrix may retard the concentration fluctuation at the early stage and slow down the domain coarsening at the late stage of SD phase separation for the blend matrix to result in the decrease of apparent diffusion coefficient Dapp, the postponement of the relaxation time and the decline of temperature sensitivity for the phase separation rate.
1. Introduction
The incorporation of nanofillers into a polymeric matrix, such as homopolymers, block copolymers or blends can open pathways to engineer composite materials with advantageous conductivity,1,2 flame resistance,3 and mechanical4,5 and optical properties.6,7 If the polymeric matrix is multicomponent, these above-mentioned properties strongly depend on the morphology and microstructure for the blend matrix and the location of nanofillers. Hence, the influence of nanofillers on the miscibility and phase separation for binary polymer blends should be explored to obtain the variation of morphology and microstructure for multicomponent systems. Partially miscible polymer blends are often used as model systems to investigate their critical phase behaviors, such as lower critical solution temperature (LCST) blends8–10 and upper critical solution temperature (UCST) blends.11–13 In general, there are two types of phase separation mechanism upon variation in temperature, pressure or composition: nucleation and growth (NG) in the metastable region and spinodal decomposition (SD) in the unstable region.14–17Extensive research has been mainly focused on the effect of spherical particles on the phase separation of polymer blends, for instance SiO2 filled systems, such as polystyrene (PS)/poly(vinyl methyl ether) (PVME)/SiO2 nanocomposites,8,10,18–20 poly(methyl methacrylate) (PMMA)/poly(styrene-co-acrylonitrile) (SAN)/SiO2 nanocomposites,9,21–23 and polycarbonate (PC)/PMMA/SiO2 nanocomposites.24 The influence of nanofillers with other topological shapes on the phase separation of blend matrix has been also reported for one or two dimensional nanofillers filled systems, such as PS/PVME/multiwall carbon nanotubes (MWCNTs) nanocomposites,25–27 PMMA/SAN/MWCNTs nanocomposites,1,28,29 PMMA/SAN/clay nanocomposites,30,31 PMMA/SAN/GO nanocomposites,32 PMMA/SAN/chemically reduced graphene oxide (CRGO) nanocomposites33,34 and PS/PVME/reduced graphene oxide (RGO) nanocomposites.35,36 As a one-dimensional rod-like filler, hollow silica nanotubes (HSNTs) have attracted special interest because of its easy surface functionalization, porous wall structure, hydrophilic nature, and biocompatibility,37 which may have some potential applications in reinforced materials, catalyst carriers, sensors, hydrogen storage materials, drug storage and delivery. However, the effect of HSNTs on the phase separation behavior of polymer blends has never been concerned and reported. The effective control for the morphology of blend matrix and distribution of HSNTs can be achieved to improve the ultimate properties of nanocomposites.
It is well known that the relaxation time (τ) of amorphous polymers controlled by the diffusion of segments and the temperature dependence of segment diffusion follow the time–temperature superposition (TTS) principle in the glass transition region.38,39 It was found that in our previous works,40–42 the TTS principle and Williams–Landel–Ferry (WLF) function could be used to describe the temperature dependence of apparent diffusion coefficient Dapp(T) and τ at the early and late stage of SD phase separation for binary polymer blends and ternary CRGO filled PMMA/SAN nanocomposites. However, all the investigated temperatures were between the glass transition temperature (Tg) and Tg + 100 °C in the abovementioned works. When the temperature is above Tg + 100 °C, the whole chain of polymer can move, and the temperature dependence of relaxation process follows the Arrhenius equation. The temperature dependence of diffusion coefficient,43 mobility44 for polymeric materials and phase separation behavior for binary polymer blends,45,46 the apparent activation energy and the temperature dependence of relaxation time for aqueous polymer solutions47 can be described by the Arrhenius equation. It is a doubt that whether the incorporation of nanofillers may affect the applicability of Arrhenius equation to the phase separation behavior of blend matrix above Tg + 100 °C.
The phase separation behavior for PMMA/poly(styrene-co-maleic anhydride) (SMA) blends with LCST characteristic has been investigated using dynamic rheological measurements.48–50 The relation between morphology and dynamic modulus during the phase separation process indicates that the phase separation temperature of PMMA/SMA system is above Tg + 100 °C and beyond the glass transition region. In this work, PMMA/SMA was chosen as a model blend matrix and the effect of one-dimensional HSNTs on the phase separation behavior of such blend matrix was investigated over wide appropriate temperature above Tg + 100 °C using small-angle laser light scattering (SALLS) to explore the applicability of Arrhenius equation to describe the temperature dependence of SD phase separation for unfilled and filled PMMA/SMA systems.
2. Experimental
2.1 Materials
Poly(methyl methacrylate) (PMMA, IF850) with Mw = 8.1 × 10⁴, Mw/Mn = 1.9 and Tg = 95 °C was purchased from LG Co. Ltd, South Korea. Poly(styrene-co-maleic anhydride) (SMA, 210) with Mw = 2.6 × 10⁵, Mw/Mn = 3.7, Tg = 118 °C and MA content of 10 wt% was supplied by SINOPEC Shanghai Research Institute of Petrochemical Technology, China. Polyoxyethylene (20) cetyl ether (Brij 58) was purchased from Sigma-Aldrich. Hydrazine hydrate (100%, hydrazine 64%), tetraethyl orthosilicate (TEOS), nickel chloride (NiCl2·6H2O), diethylamine, hydrochloric acid (HCl, 37.5%), cyclohexane, methyl ethyl ketone, ethanol, and isopropanol were purchased from Beijing Chemical Reagent Co., China. All the chemicals were used as received without further purification.2.2 Sample preparation
Hollow silica nanotubes (HSNTs) were synthesized by templating of nickel-hydrazine complex nanorods.51 8.0 g of Brij58 was dissolved in 20 mL of cyclohexane at 50 °C. 2 mL of NiCl2 solution (0.8 M) was added under stirring and stirred until homogeneity. Next, 0.5 mL of hydrazine hydrate was added dropwise. After 3 h stirring, 1 mL of diethylamine and subsequently 3 mL of TEOS were added into the system. The silica coating process was carried out for 4 h during which the TEOS deposited on the surface of the rod-like template to form a coating of silica layer. The coated sample was centrifuged and washed with isopropanol and ethanol. The as-synthesized nickel-hydrazine@silica nanorods were dispersed in 50 mL of HCl solution (4 M) to obtain the silica nanotubes. The dispersion was stirred at room temperature for 2 h. The silica nanotubes were collected by centrifugation and washed with water and ethanol until the pH value was neutral. Finally, the nanotubes were then dispersed in methyl ethyl ketone and stored.PMMA and SMA were dried for more than 24 h at 80 °C in vacuum oven. HSNTs were dispersed in methyl ethyl ketone and the suspension was ultrasonicated for 15 min. PMMA/SMA were dissolved by continuous stirring in aforementioned suspension at a weight fraction of 5% and the mixture was then ultrasonicated for another 15 min to form the uniform dispersion of HSNTs in the PMMA/SMA solution. Subsequently, the suspensions were cast onto the cover glasses at 30 °C. After the solvent evaporated at 30 °C for 24 h, the sample samples were dried at 60 °C, 90 °C, 120 °C for another 3 days in vacuum oven to remove the residual solvent. The PMMA/SMA blends are denoted by A/B and PMMA/SMA/HNSTs samples are denoted by A/B/x, where A and B are the weight fraction of PMMA and SMA in the binary blend, respectively, and x is the weight fraction of HNSTs compared to the total amount of polymers.
2.3 Characterizations
A custom-made, time-resolved SALLS apparatus described in previous papers40,42 was used in this work. The principle and details of the SALLS system were presented elsewhere.16,52 During the isothermal annealing experiment, homogeneous samples were first annealed at 160 °C for 10 min, and then heated to the appointed temperature for isothermal measurement. In nonisothermal phase-separation experiments, homogeneous samples were put on a hot stage and annealed at 160 °C for 10 min, then heated to 250 °C at various heating rates. And the cloud points were obtained from the intersections of the tangents of the scattering intensity vs. temperature curves. The accuracy of temperature control was about ±0.1 °C. None of the samples exhibited any yellowing during the whole measurement process, indicating that no obvious degradations had occurred.The morphology evolution of PMMA/SMA blends and PMMA/SMA/HSNTs nanocomposites was observed by phase contrast microscope (PCM, BX51, Olympus, Japan) with a temperature-control hot stage (THMS600, Linkam, UK) in combination with a digital camera.
Transmission electron microscope (TEM, JEM 1200EX, Japan) was adopted to observe the morphology of HSNTs and the distribution of HSNTs in the blend matrix. HSNTs samples were prepared by casting one drop of HSNTs dilute suspension (0.3 wt%) onto a copper grid and volatilize the solvent thoroughly. TEM specimens of the nanocomposites were prepared by embedding the samples in the epoxy resin (solidified at ambient temperature for 24 h) and ultramicro-toming them into the sections of 100 nm thick with a diamond knife.
The surface tensions of PMMA and SMA was deduced by the contact angle measurement which was carried out on the surface of compression-molded films of pure PMMA and SMA. The contact angle was measured at 25 °C with a drop shape analysis system (Harke-SPCA, China). Measurement of a given contact angle was carried out for at least 5 times. Double distilled water (H2O) and formamide (CH3ON) were used as probe liquids.
3. Theoretical background
Generally, the linear Cahn–Hilliard theory can be used to described the scattering intensity evolution at the early stage of SD phase separation for binary blends.53,54 On the premise of unchanged mechanism of phase separation for ternary polymer nanocomposites, their phase separation at the early stage can also be described by the Cahn–Hilliard theory. Considering the thermal fluctuation of homogeneous polymer blends, Cook55 modified Cahn–Hilliard function into| I(q, t) = Is(q, 0) + [I(q, 0) − Is(q, 0)]exp[2R(q)t] | (1) |
 | (2) |
 | (3) |
We can see that plots of ln[(I(q, t) − Is(q, 0))/(I(q, 0) − Is(q, 0))] versus t can yield R(q) from eqn (1) and the Dapp and 2Mk values can be obtained from the intercept and slope of the plot of R(q)/q2 versus q2. Differentiation of eqn (3) with respect to q yields the characteristic scattering vector qm with maximum scattering intensity Im at the early stage of phase separation, the scattering vector corresponding to the correlation length of maximal growth Λ = 1/qm, which has no time dependence as related by
 | (4) |
At the late stage of SD, the prevalent mechanism is the nonlinear phase growth that causes the scattering halo to shrink to a smaller diameter, which is the coarsening process of phase domains. Such process follows power laws, in which the time evolution of qm and I(qm) at the late stage is described as56,57
| I(qm(t)) ∝ tβ | (5) |
| qm(t) ∝ t−α | (6) |
4. Results and discussion
4.1 Morphology of HSNTs
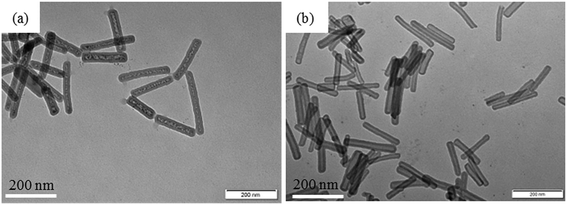
Here, TEM is used to observe the morphology of HSNTs synthesized by a sol–gel method. Fig. 1(a) shows a TEM image of the nickel-hydrazine@silica nanorods with the core–shell structure. From the contrast between the core and the shell in the TEM image, we can easily identify a silica shell of about 10 nm thickness coated on the surface of the nanocrystals. Some particle-like dots in the core can be observed, which are the products of the decomposition and recrystallization of the nickel-hydrazine complex formed under electron beam radiation during TEM imaging. When the core–shell nanostructures are treated with HCl, the silica shell can be retained, while the nickel-hydrazine nanocrystals are removed by forming water soluble NiCl2, resulting in hollow silica nanotubes, as shown in Fig. 1(b). The HSNTs with a length 200–300 nm, an inner diameter of 20 nm and an outer diameter of 30 nm were obtained by the complete removal of the rod-like template from the core–shell structure.4.2 Effect of HSNTs on the isothermal phase separation behavior of PMMA/SMA blends
In order to avoid the negative effect of sample thickness and background light, the real-time scattering intensity I(t) at given q(t) is normalized as (I(t) − I(0))/(Im − I(0)), in which I(0) is the initial scattering intensity at the beginning of the experiment and Im is the maximum scattering intensity during the whole annealing process. Fig. 2 shows the semi-logarithm plots of normalized scattering intensity versus time for PMMA/SMA (80/20) blend and PMMA/SMA/HSNTs (80/20/0.8) nanocomposites during isothermal annealing at different temperatures. It can be found that all the curves are nearly similar and parallel to each other for unfilled and filled systems. The relaxation time (τ) is defined as the time at which the normalized scattering intensity at different temperatures gets to the same degree (for instance 50%), as shown in Fig. 2. The time evolution of scattering intensity for PMMA/SMA (60/40) blends and PMMA/SMA/HSNTs (60/40/0.8) nanoposites are also explored and the details aren't given here due to their similar variation. The critical composition of PMMA/SMA blend is close to 60/40.46 Hence, the near-critical composition (60/40) and the off-critical composition (80/20) were selected as our model blend matrix. Furthermore, all the investigated isothermal annealing temperatures were above Tg + 100 °C. Therefore, the Arrhenius equation should be attempted to describe the phase separation behavior of PMMA/SMA blends and PMMA/SMA/HSNTs nanocomposites, rather than the WLF equation.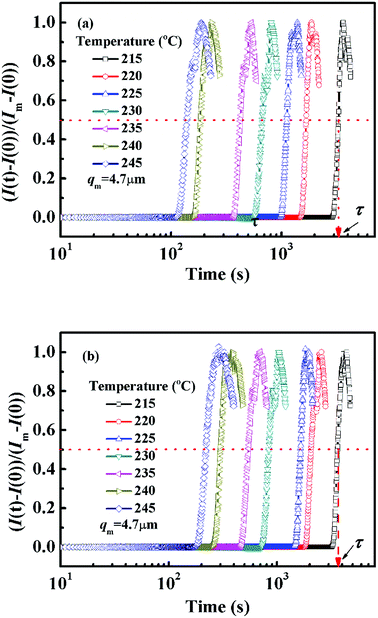 | ||
| Fig. 2 Time dependence of normalized scattering intensity of (a) PMMA/SMA (80/20) blends and (b) PMMA/SMA/HSNTs (80/20/0.8) nanocomposites at different annealing temperatures and q = 4.7 μm−1. | ||
Fig. 3 presents the temperature dependence of ln![[thin space (1/6-em)]](https://www.rsc.org/images/entities/char_2009.gif) τ for unfilled and filled PMMA/SMA systems with two matrix compositions. It can be seen that τ strongly depends on the annealing temperature and increases with decreasing temperature. Meanwhile, τ values for filled system are longer than those for unfilled system, indicating that the incorporation of HSNTs may increase the phase stability of PMMA/SMA blend matrix and delay the occurrence of concentration fluctuation for the blends matrix at the early stage of SD phase separation. Here, it should be noted that HNSTs tend to be located in the PMMA-rich phase of phase-separated blend matrix during the whole SD process (this willed be discussed in detail in Section 4.3). Furthermore, it is noted that the plots of ln
τ for unfilled and filled PMMA/SMA systems with two matrix compositions. It can be seen that τ strongly depends on the annealing temperature and increases with decreasing temperature. Meanwhile, τ values for filled system are longer than those for unfilled system, indicating that the incorporation of HSNTs may increase the phase stability of PMMA/SMA blend matrix and delay the occurrence of concentration fluctuation for the blends matrix at the early stage of SD phase separation. Here, it should be noted that HNSTs tend to be located in the PMMA-rich phase of phase-separated blend matrix during the whole SD process (this willed be discussed in detail in Section 4.3). Furthermore, it is noted that the plots of ln![[thin space (1/6-em)]](https://www.rsc.org/images/entities/char_2009.gif) τ against 1/T exhibit good linear relationship, indicating that the phase-separation behaviors for unfilled and filled systems both follow an Arrhenius-like equation. Hence, the dependence of τ can be described as
τ against 1/T exhibit good linear relationship, indicating that the phase-separation behaviors for unfilled and filled systems both follow an Arrhenius-like equation. Hence, the dependence of τ can be described as
 | (7) |
![[thin space (1/6-em)]](https://www.rsc.org/images/entities/char_2009.gif) τ against 1/T, respectively, indicating that the presence of HSNTs and the matrix composition may both change the temperature dependence of phase separation rate for PMMA/SMA blend matrix. Furthermore, the time evolution of scattering intensity at other vectors ranging from 3.0–5.0 μm−1 also follows the relationship. Therefore, the temperature dependence of isothermal phase separation for the unfilled and filled PMMA/SMA systems can be described by the Arrhenius equation for all the values of q investigated.
τ against 1/T, respectively, indicating that the presence of HSNTs and the matrix composition may both change the temperature dependence of phase separation rate for PMMA/SMA blend matrix. Furthermore, the time evolution of scattering intensity at other vectors ranging from 3.0–5.0 μm−1 also follows the relationship. Therefore, the temperature dependence of isothermal phase separation for the unfilled and filled PMMA/SMA systems can be described by the Arrhenius equation for all the values of q investigated.
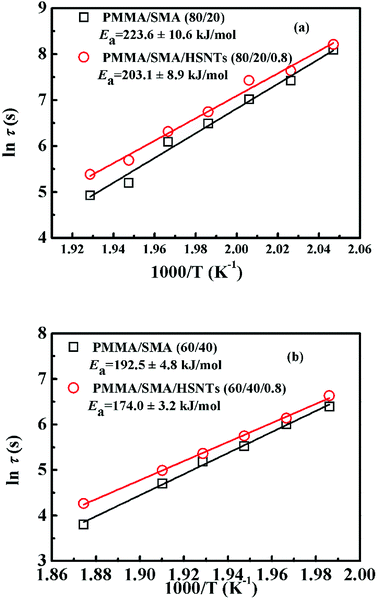 | ||
| Fig. 3 Activation plots of τ for PMMA/SMA (80/20) blends and PMMA/SMA/HSNTs (80/20/0.8) nanocomposites at the early stage of SD. | ||
It is well known that the characteristic scattering vector qm with maximum scattering intensity Im does not vary with time at the early stage of SD phase separation, which is ascribed to the fixed spatial period of concentration fluctuation at this stage.39 The incorporation of HSNTs hardly changes the characteristic of SD behavior for PMMA/SMA blend matrix during all the investigated temperature range.
Fig. 4 shows semi-logarithm plots of ln((I(t) − I(0))/(Im − I(0))) versus time for various q from 4.02 to 4.50 μm−1 at 220 °C for PMMA/SMA (80/20) blends. All the plots exhibit good linear relationship, indicating that the phase separation behavior follows the linear Cahn–Hilliard theory. According to eqn (1), the values of R(q) can be obtained from the initial slopes of ln((I(t) − I(0))/(Im − I(0))) versus time curves. Based on eqn (2), Dapp(T) for the blends and nanocomposites and 2Mk(T) can be obtained from the intercepts and slopes of the plots of R(q)/q2 against q2, respectively, as shown in Fig. 5. It can be found that the curves of R(q)/q2 against q2 follow a linear relationship at large q values, while the intensity is strongly influenced by the central intensity at small q values and the linear relationship is invalid. Hence, the data at small q values are not given in Fig. 5.
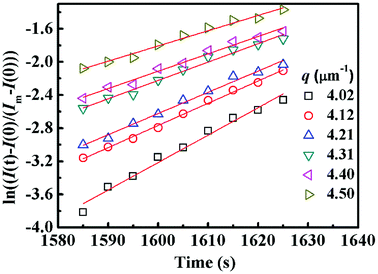 | ||
| Fig. 4 Time evolution of ln((I(t) − I(0))/(Im − I(0))) for PMMA/SMA (80/20) blends for various q during the early stage of phase separation at 220 °C. | ||
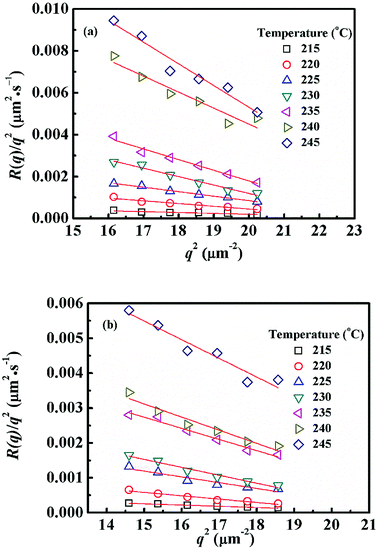 | ||
| Fig. 5 Relationships between R(q)/q2 and q2 for (a) PMMA/SMA (80/20) blends and (b) PMMA/SMA/HSNTs (80/20/0.8) nanocomposites at different temperatures. | ||
Fig. 6 shows the temperature dependence of Dapp(T) and 2Mk(T) for unfilled and filled PMMA/SMA systems with two matrix compositions. It is obvious that for the unfilled and filled systems, Dapp(T) and 2Mk(T) both increase exponentially with temperature in all the investigated annealing temperature range. Hence, the equilibrium spinodal temperature can not be obtained by the linear extrapolation of Dapp(T) and 2Mk(T) to zero, similar with other systems reported previously.40–42,58 Moreover, it can be seen that Dapp values for unfilled blends are remarkably higher than those for the filled nanocomposites, suggesting that the uphill diffusion at the early stage of SD for the filled system is obviously retarded by a small amount of HSNTs.
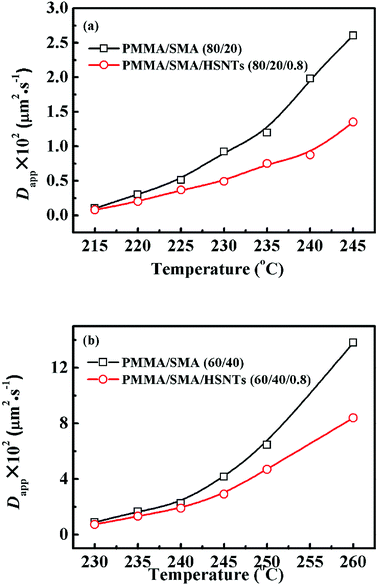 | ||
| Fig. 6 Temperature dependence of (a) Dapp(T) and (b) 2Mk(T) for PMMA/SMA (80/20) blends and PMMA/SMA/HSNTs (80/20/0.8) nanocomposites. | ||
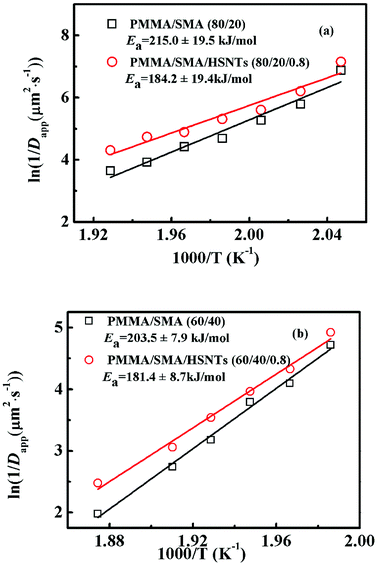
The temperature dependence of τ for unfilled and filled PMMA/SMA systems can be described by the Arrhenius equation in Section 4.2. Hence, the applicability of Arrhenius equation to the temperature dependence of Dapp(T) should be also explored further. As shown in Fig. 7, the plots of ln(1/Dapp) versus 1/T for the unfilled and filled systems are both linear, indicating that their temperature dependence of Dapp(T) can be described by the Arrhenius equation, just like τ. The temperature dependence of Dapp can be expressed as follows
 | (8) |
The constant qm values at the early stage of SD gradually decrease with the extending of annealing time and finally tend to be constant, while the scattering intensity increases continuously during the whole process. At the intermediate stage of SD, both the amplitude and wavelength of the concentration fluctuation increase with time. At the late stage of SD, the concentration fluctuation of each component in the domains approaches equilibrium values. However, the size of domains is still growing to reduce the excess free energy associated with the interfacial area.59 Fig. 8 shows the maximum scattering intensity Im and characteristic scattering vector qm for PMMA/SMA (80/20) blends and PMMA/SMA/HSNTs (80/20/0.8) nanocomposites. Time evolution plots of Im(t) and qm(t) follow the scaling laws: Im(t) ∼ tβ and qm(t) ∼ t−α.57,60 According to Siggia theory,61 the relationship between α and β is β = 3α. It is found in Fig. 8 that the relationships between α and β for the unfilled and filled systems both follow Siggia theory. Moreover, the incorporation of HNSTs decreased α and β values for the blend matrix, indicating that the introduction of HNSTs may slow down the domain coarsening of blend matrix at the late stage of SD.
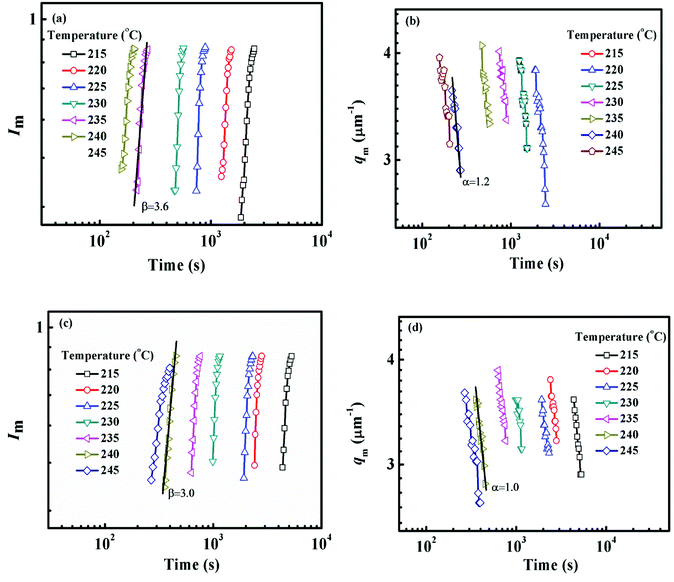 | ||
| Fig. 8 Time evolution of (a) Im, (b) qm for PMMA/SMA (80/20) blends and (c) Im, (d) qm for PMMA/SMA/HSNTs (80/20/0.8) nanocomposites at the late stage of SD at different temperatures. | ||
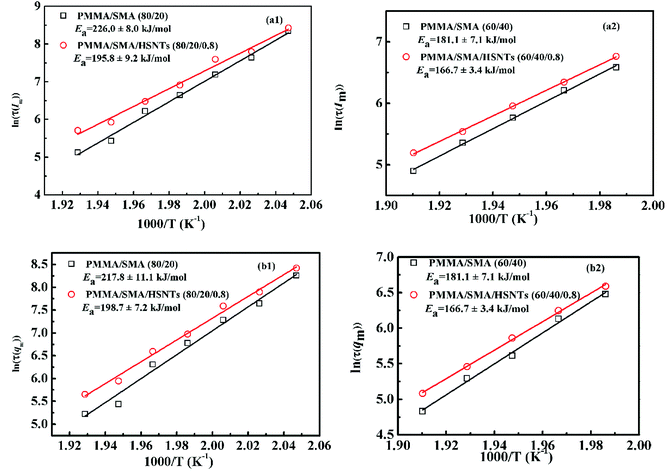
As mentioned above, the temperature dependence of relaxation time τ of normalized scattering intensity and Dapp at the early stage of SD can be described by the Arrhenius equation. Here, the relaxation time τ(Im) and τ(qm) are defined as the time at which Im increases to the same value (for instance 0.5) and qm decreases to the same value (for instance 3.5) at different temperatures. τ(Im) and τ(qm) can be obtained from Fig. 8. Fig. 9 shows the plots of ln(τ(Im)) and ln(τ(qm)) versus 1/T for unfilled, filled PMMA/SMA (80/20) systems and PMMA/SMA (60/40) systems at the late stage of SD. It is found that such plots also follow a linear relationship, indicating that the Arrhenius equation can be also used to describe the temperature dependence of τ(Im) and τ(qm) at the late stage of SD. Hence, such temperature dependence of τ(Im) and τ(qm) can be described as:
 | (9) |
 | (10) |
It should be noted that all the above-mentioned activation energy values obtained from Dapp and τ at the early and late stages of SD for the unfilled and filled systems are different. The incorporation of HSNTs might result in the difference of the concentration fluctuation, interfacial area and interfacial tension at the early and late stages of SD. Hence, the activation energy of blend matrix is affected by the presence of HSNTs and the temperature sensitivity of phase separation rate for the nanocomposites decreases, implying the hindering effect of HSNTs on the SD phase separation behavior of PMMA/SMA blend. Besides the effect of HSNTs on the activation energy of blend matrix, different composition of blend matrix also results in different activation energy values. The composition of PMMA/SMA (60/40) is near-critical composition, while PMMA/SMA (80/20) is off-critical composition, which may lead to different phase-separated morphology and different temperature dependence of phase-separation kinetics. Moreover, when a different IN, qm or Im value is selected, the relaxation time may be different and the resultant activation energy values may be also somewhat different. However, all the activation energy values for the same system are similar to each other (errors no more 10%). Hence, all the activation energy values for unfilled and filled systems are believed to be reliable. The activation energies obtained from Dapp, IN, qm or Im for a given system are very close and may be thought as the temperature dependence of phase separation kinetics for the blend matrix, which is not only related to the viscous activation energy of PMMA or SMA, but also related with the destruction of miscibility induced by the temperature variation. Based on the obtained activation energies, the temperature dependence of SD phase-separation behavior for unfilled and filled PMMA/SMA systems during isothermal annealing may be predicted by the Arrhenius equation when the temperature are above Tg + 100 °C.
4.3 Effect of HSNTs on the cloud points and morphology evolution of PMMA/SMA blends
In order to explore the effect of HSNTs on the phase-separation temperature of PMMA/SMA blends, the cloud points (Tc) of unfilled and filled PMMA/SMA systems were also determined by SALLS upon heating at a given rate. The dependence of Tc on the heating rate for PMMA/SMA blends and PMMA/SMA/HSNTs nanocomposites with two matrix compositions is shown in Table 1. Tcs for binary blends and ternary nanocomposites both depend intensely on the heating rate and move towards higher temperature as the heating rate increases, due to the delayed effect of macromolecular segment mobility for the fast heating rate. The presence of a small amount of HSNTs causes the increase of Tcs for PMMA/SMA blend matrices with two compositions, indicating that HSNTs may enhance the phase stability of PMMA/SMA blend matrix. Such retarded effect of HSNTs in the nonisothermal phase separation of blend matrix is consistent with that in their isothermal phase separation.| Heating rate (°C min−1) | Cloud point (°C) | |||
|---|---|---|---|---|
| PMMA/SMA (60/40) | PMMA/SMA/HSNTS (60/40/0.8) | PMMA/SMA (80/20) | PMMA/SMA/HSNTS (80/20/0.8) | |
| 0.5 | 228.3 ± 0.4 | 230.3 ± 0.5 | 225.4 ± 0.4 | 228.3 ± 0.6 |
| 1.0 | 232.2 ± 0.5 | 234.0 ± 0.6 | 230.6 ± 0.5 | 232.8 ± 0.5 |
| 5.0 | 245.1 ± 0.5 | 247.7 ± 0.6 | 245.3 ± 0.6 | 246.8 ± 0.6 |
Fig. 10 shows the morphology evolution of PMMA/SMA (80/20) blends and PMMA/SMA/HSNTs (80/20/0.8) nanocomposites annealed at 210 °C for various time observed by PCM. The filled and unfilled systems both exhibit a co-continuous morphology at the early stage of phase separation and then the co-continuous morphological pattern gradually changes to a droplet structure due to the effect of interfacial tension between PMMA and SMA. Moreover, it can be found that the domain size of PMMA/SMA/HSNTs (80/20/0.8) nanocomposites is smaller than that of PMMA/SMA (80/20) blends for the same annealing time, indicating that the incorporation of HSNTs may retard the phase separation process.
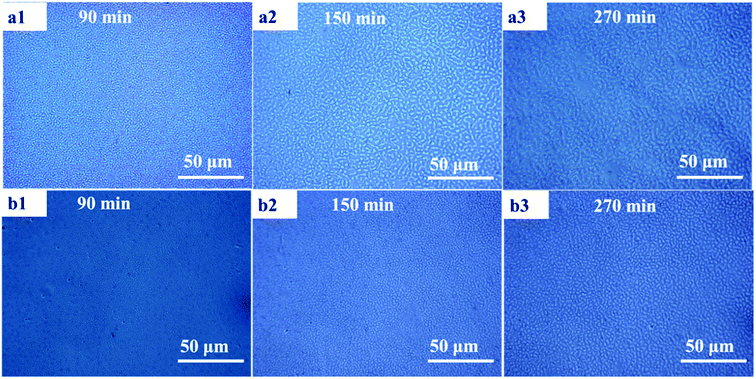 | ||
| Fig. 10 Morphology evolution of (a) PMMA/SMA (80/20) blends and (b) PMMA/SMA/HSNTs (80/20/0.8) nanocomposites annealed at 210 °C for various time. | ||
TEM micrographs of PMMA/SMA (80/20) blend and PMMA/SMA/HSNTs (80/20/0.8) nanocomposites without annealing are shown in Fig. 11. HSNTs were well dispersed in a homogenous PMMA/SMA blend matrix, indicating that the incorporation of HSNTs hardly destroyed the homogeneity of polymer blends. In order to further explore the distribution variation of HSNTs in the blend matrix and their morphology evolution during phase separation, the TEM images for PMMA/SMA (80/20) blends and PMMA/SMA/HSNTs (80/20/0.8) nanocomposites after being annealed at 215 °C for different time are given in Fig. 12. In the bright- field TEM images, the bright region refers to the PMMA-rich phase and the dark region refers to the SMA-rich phase. It can be found that most HNSTs tend to be located in the PMMA-rich phase (bright region) of phase-separated blend matrix during the whole SD process. In general, the fillers prefer to locate in one phase with a lower interfacial tension between the polymer and filler.62 Here, the surface tension of polymers was deduced by the contact angle measurement and the surface tension of fillers was obtained from the literature.63 The interfacial tension of PMMA and HSNTs is calculated to be 10.03 mN m−1, and the interfacial tension of SMA and HSNTs is 15.39 mN m−1. The interfacial tension of PMMA and HSNTs is lower than that of SMA and HSNTs. Therefore, HSNTs tend to be located in the PMMA-rich phase.
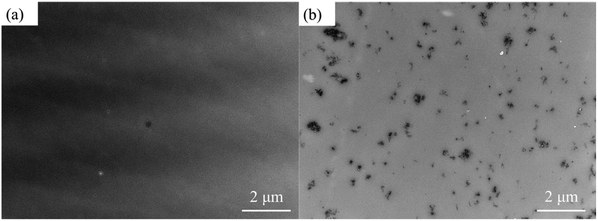 | ||
| Fig. 11 TEM images for (a) PMMA/SMA (80/20) blend and (b) PMMA/SMA/HSNTs (80/20/0.8) nanocomposite without annealing. | ||
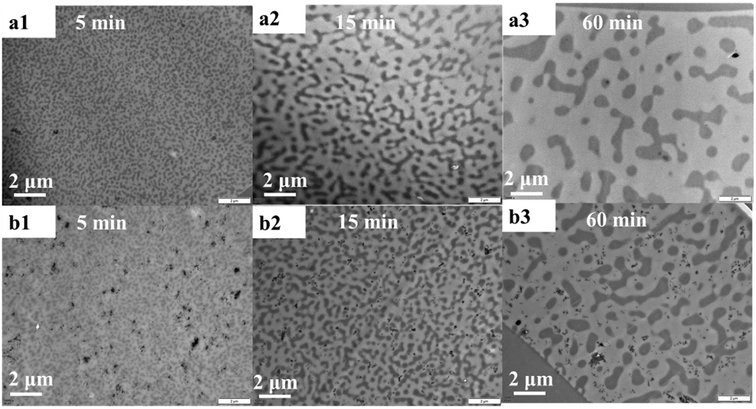 | ||
| Fig. 12 TEM images for (a) PMMA/SMA (80/20) blends and (b) PMMA/SMA/HSNTs (80/20/0.8) nanocomposites after being annealed at 215 °C for different time. | ||
Consistent with the results of PCM, the domain size of PMMA/SMA/HSNTs (80/20/0.8) nanocomposites in the TEM observation is smaller than that of PMMA/SMA (80/20) blends for the same annealing time. The retardation effect of HSNTs on the phase separation of blend matrix may be caused by the mechanical barrier effect of HSNTs on the macromolecular diffusion. Such stabilizing effect of HSNTs on the morphology of blend matrix can be also similar with that in spherical nanosilica filled systems and may be attributed to the confined chain motion due to the adsorption of chains on the surface of nanoparticles.9,10,64,65 Furthermore, it can be found that some HSNTs aggregate in the PMMA-rich phase with the extending of annealing time and the diffusion motion of HSNTs in the phase-separated blend matrix should be mainly controlled by the mobility of PMMA surrounding HSNTs.1 Here, there just exist a very small amount of relatively large aggregates of HSNTs in the PMMA-rich phase and we should explore whether the residual HSNTs form the filler network in the PMMA-rich phase to retard remarkably the SD phase separation of blend matrix in our next work.
5. Conclusions
The phase separation behavior of PMMA/SMA blends during isothermal annealing process has been investigated in the presence of small amount of HSNTs by using time-resolved SALLS. In the investigated annealing temperature range, the Arrhenius equation can be used to described the nonlinear temperature dependence of relaxation time τ of normalized scattering intensity and apparent diffusion coefficient Dapp(T) at the early stage of SD, as well as the phase behavior at the late stage of SD for both PMMA/SMA (80/20) blends and PMMA/SMA/HSNTs (80/20/0.8) nanocomposites. The decline of activation energy of filled systems implies that the phase separation rate of unfilled PMMA/SMA (80/20) system is more sensitive to temperature than that of filled system and the phase separation behavior of blend matrix is retarded by the presence of HSNTs. Such hindering effect is also confirmed by the decrease of Dapp(T) at the early stage and the slowing down of domain coarsening at the late stage of SD for the blend matrix owing to the mechanical barrier effect of HSNTs on the macromolecular chain diffusion of blend matrix. The applicability of Arrhenius equation to describe the phase-separation behavior of unfilled and filled polymer blends would be helpful to predict the temperature dependence of the phase behavior for polymer blends and nanocomposites during isothermal annealing at the temperatures above Tg + 100 °C.Conflicts of interest
There are no conflicts to declare.Acknowledgements
This work was supported by Zhejiang Natural Science Foundation (No. LY16E030001), the National Natural Science Foundation of China (No. 51790503, and 51873181) and the Fundamental Research Funds for the Central Universities (No. 2017QNA4038).References
- H. Li, M. Zuo, T. Liu, Q. Chen, J. Zhang and Q. Zheng, RSC Adv., 2016, 6, 10099–10113 RSC.
- Y. Gao, D. Cao, J. Liu, J. Shen, Y. Wu and L. Zhang, Phys. Chem. Chem. Phys., 2015, 17, 22959–22968 RSC.
- Y. Feng, J. Hu, Y. Xue, C. He, X. Zhou, X. Xie, Y. Ye and Y. Mai, J. Mater. Chem. A, 2017, 5, 13544–13556 RSC.
- W. Zhang, I. Phang and T. Liu, Adv. Mater., 2006, 18, 73–77 CrossRef CAS.
- H. L. Lee, O. H. Kwon, S. M. Ha, B. G. Kim, Y. S. Kim, J. C. Won, J. H. Kim, J. H. Choi and Y. Yoo, Phys. Chem. Chem. Phys., 2014, 16, 20041–20046 RSC.
- S. Mallakpour and A. Nezamzadeh Ezhieh, Polym.-Plast. Technol. Eng., 2016, 56, 1136–1145 CrossRef.
- L. F. Loguercio, C. C. Alves, A. Thesing and J. Ferreira, Phys. Chem. Chem. Phys., 2015, 17, 1234–1240 RSC.
- A. Goharpey and F. Goharpey, Macromolecules, 2008, 41, 3276–3283 CrossRef.
- W. Li, R. M. A. l'Abee and J. G. P. Goossens, Macromol. Chem. Phys., 2013, 214, 2705–2715 CrossRef CAS.
- Q. Chen, M. Zuo, R. Yang, J. Zhang, X. Lv, W. Zhang, Y. Song and Q. Zheng, J. Polym. Sci., Part B: Polym. Phys., 2017, 55, 1337–1349 CrossRef CAS.
- F. Hemmati, H. Garmabi and H. Modarress, Polym. Compos., 2014, 35, 2329–2342 CrossRef CAS.
- F. Hemmati, H. Garmabi and H. Modarress, eXPRESS Polym. Lett., 2013, 7, 996–1011 CrossRef CAS.
- F. Hemmati, H. Garmabi and H. Modarress, Polymer, 2014, 55, 6623–6633 CrossRef CAS.
- R. Zhang, H. Cheng, C. Zhang, T. Sun, X. Dong and C. Han, Macromolecules, 2008, 41, 6818–6829 CrossRef CAS.
- R. Zhang, X. Dong, X. Wang, H. Cheng and C. Han, Macromolecules, 2009, 42, 2873–2876 CrossRef CAS.
- H. Hu, J. Li, C. Zhang and C. Han, Polymer, 2010, 51, 4619–4626 CrossRef CAS.
- J. Yang, X. Chen, R. Fu, W. A. Luo, Y. Li and M. Zhang, Phys. Chem. Chem. Phys., 2010, 12, 2238–2245 RSC.
- J. Khademzadeh Yeganeh, F. Goharpey, E. Moghimi, G. Petekidis and R. Foudazi, Phys. Chem. Chem. Phys., 2015, 17, 27446–27461 RSC.
- T. Xia, Y. Huang, X. Jiang, Y. Lv, Q. Yang and G. Li, Macromolecules, 2013, 46, 8323–8333 CrossRef CAS.
- H. Li, Q. Li, L. Li and Q. Yang, J. Macromol. Sci., Part B: Phys., 2014, 53, 993–1010 CrossRef CAS.
- M. Du, Q. Wu, M. Zuo and Q. Zheng, Eur. Polym. J., 2013, 49, 2721–2729 CrossRef CAS.
- C. Huang, J. Gao, W. Yu and C. Zhou, Macromolecules, 2012, 45, 8420–8429 CrossRef CAS.
- J. Gao, C. Huang, N. Wang, W. Yu and C. Zhou, Polymer, 2012, 53, 1772–1782 CrossRef CAS.
- W. Li, A. B. Spoelstra and J. G. P. Goossens, Polym. Eng. Sci., 2015, 55, 1951–1959 CrossRef CAS.
- P. Xavier and S. Bose, Phys. Chem. Chem. Phys., 2015, 17, 14972–14985 RSC.
- G. P. Kar, P. Xavier and S. Bose, Phys. Chem. Chem. Phys., 2014, 16, 17811–17821 RSC.
- P. Xavier and S. Bose, J. Phys. Chem. B, 2013, 117, 8633–8646 CrossRef CAS PubMed.
- K. Sharma, M. Sharma, A. Chandra and S. Bose, Macromol. Chem. Phys., 2013, 214, 2651–2669 CrossRef CAS.
- M. Lee, H. Jeon, B. H. Min and J. H. Kim, J. Appl. Polym. Sci., 2011, 121, 743–749 CrossRef CAS.
- D. Pang, M. Zuo, J. Zhao and Q. Zheng, Chin. J. Polym. Sci., 2013, 31, 1470–1483 CrossRef CAS.
- M. H. Lee, C. H. Dan, J. H. Kim, J. Cha, S. Kim, Y. Hwang and C. H. Lee, Polymer, 2006, 47, 4359–4369 CrossRef CAS.
- T. S. Muzata, P. L. Jagadeshvaran, G. P. Kar and S. Bose, Phys. Chem. Chem. Phys., 2018, 20, 19470–19485 RSC.
- C. Lin, T. Liu, M. Zuo, H. Li, Q. Chen and Q. Zheng, RSC Adv., 2015, 5, 82259–82270 RSC.
- C. Lin, M. Zuo, H. Li, T. Liu and Q. Zheng, Chin. J. Polym. Sci., 2015, 33, 1162–1175 CrossRef CAS.
- P. Xavier, K. Sharma, K. Elayaraja, K. S. Vasu, A. K. Sood and S. Bose, RSC Adv., 2014, 4, 12376 RSC.
- G. Vleminckx, S. Bose, J. Leys, J. Vermant, M. Wubbenhorst, A. A. Abdala, C. Macosko and P. Moldenaers, ACS Appl. Mater. Interfaces, 2011, 3, 3172–3180 CrossRef CAS PubMed.
- X. Yang, H. Tang, K. Cao, H. Song, W. Sheng and Q. Wu, J. Mater. Chem., 2011, 21, 6122–6135 RSC.
- G. Wisanrakkit and J. K. Gillham, J. Appl. Polym. Sci., 1990, 41, 2885–2929 CrossRef CAS.
- C. W. Wise, W. D. Cook and A. A. Goodwin, Polymer, 1997, 38, 3251–3261 CrossRef CAS.
- M. Peng, Q. Zheng, Y. Song and T. Zhao, Macromolecules, 2001, 34, 8483–8489 CrossRef.
- M. Zuo, M. Peng and Q. Zheng, Polymer, 2005, 46, 11085–11092 CrossRef CAS.
- M. Zuo, Y. Shangguan and Q. Zheng, Polym. Int., 2010, 59, 787–795 CAS.
- F. Roussel and P. Judeinstein, Soft Matter, 2008, 4, 888–892 RSC.
- T. Sato and C. C. Han, J. Chem. Phys., 1988, 88, 2057–2065 CrossRef CAS.
- X. Zhang, X. Yi and Y. Xu, J. Appl. Polym. Sci., 2008, 109, 2195–2206 CrossRef CAS.
- Y. Lin, Y. Shangguan, F. Chen, M. Zuo and Q. Zheng, Polym. Int., 2013, 62, 676–683 CrossRef CAS.
- W. Zhang, X. Chen, W. Luo, J. Yang, M. Zhang and F. Zhu, Macromolecules, 2009, 42, 1720–1725 CrossRef CAS.
- D. Chopra, M. Kontopoulou, D. Vlassopoulos and S. G. Hatzikiriakos, Rheol. Acta, 2002, 41, 10–24 CrossRef CAS.
- R. Li, W. Yu and C. Zhou, Polym. Bull., 2006, 56, 455–466 CrossRef CAS.
- W. Yu, R. Li and C. Zhou, Polymer, 2011, 52, 2693–2700 CrossRef CAS.
- C. Gao, Z. Lu and Y. Yin, Langmuir, 2011, 27, 12201–12208 CrossRef CAS PubMed.
- M. Nishimoto, H. Keskkula and D. R. Paul, Polymer, 1989, 30, 1279–1286 CrossRef CAS.
- J. W. Cahn and J. E. Hilliard, J. Chem. Phys., 1958, 28, 258–267 CrossRef CAS.
- J. W. Cahn, J. Chem. Phys., 1965, 42, 93–99 CrossRef CAS.
- H. E. Cook, Acta Metall., 1970, 18, 297–306 CrossRef CAS.
- J. S. Langer, Acta Metall., 1973, 21, 1649–1659 CrossRef CAS.
- K. Binder and D. Stauffer, Phys. Rev. Lett., 1974, 33, 1006–1009 CrossRef.
- H. Hu, Y. Shangguan, M. Zuo and Q. Zheng, J. Polym. Sci., Part B: Polym. Phys., 2008, 46, 1923–1931 CrossRef CAS.
- V. Edel, Macromolecules, 1995, 28, 6219–6228 CrossRef CAS.
- J. S. Langer, M. Bar-on and H. D. Miller, Phys. Rev. A, 1975, 11, 1417–1429 CrossRef.
- E. D. Siggia, Phys. Rev. A, 1979, 20, 595–605 CrossRef CAS.
- D. Wu, Y. Zhang, M. Zhang and Q. Fu, Macromolecules, 2009, 10, 417–424 CAS.
- S. H. Wu, Polymer Interface and Adhesion, New York, 1st edn, 1982 Search PubMed.
- A. Bharati, P. Xavier, G. P. Kar, G. Madras and S. Bose, J. Phys. Chem. B, 2014, 118, 2214–2225 CAS.
- P. Xavier, A. Bharati, G. Madras and S. Bose, Phys. Chem. Chem. Phys., 2014, 16, 21300–21309 RSC.
| This journal is © The Royal Society of Chemistry 2018 |

