 Open Access Article
Novel indole based hybrid oxadiazole scaffolds with N-(substituted-phenyl)butanamides: synthesis, lineweaver–burk plot evaluation and binding analysis of potent urease inhibitors†
Majid Nazira,
Muhammad Athar Abbasi *ab,
Aziz-ur-Rehmana,
Sabahat Zahra Siddiquia,
Hussain Razab,
Mubashir Hassanb,
Syed Adnan Ali Shahc,
Muhammad Shahidd and
Sung-Yum Seo
 b
b
aDepartment of Chemistry, Government College University, Lahore-54000, Pakistan. E-mail: abbasi@gcu.edu.pk; Tel: +92-42-111000010 ext. 266
bCollege of Natural Science, Department of Biological Sciences, Kongju National University, Gongju, 32588, South Korea
cFaculty of Pharmacy, Atta-ur-Rahman Institute for Natural Products Discovery (AuRIns), Universiti Teknologi MARA, Level 9, FF3, Puncak Alam Campus, 42300 Bandar Puncak Alam, Selangor Darul Ehsan, Malaysia
dDepartment of Biochemistry, University of Agriculture, Faisalabad-38040, Pakistan
First published on 19th July 2018
Abstract
In the study presented herein, 4-(1H-indol-3-yl)butanoic acid (1) was sequentially transformed in the first phase into ethyl 4-(1H-indol-3-yl)butanoate (2), 4-(1H-indol-3-yl)butanohydrazide (3) and 5-[3-(1H-indol-3-yl)propyl]-1,3,4-oxadiazole-2-thiol (4) as a nucleophile. In the second phase, various electrophiles were synthesized by reacting substituted-anilines, 5a–j, with 4-chlorobutanoyl chloride (6) to afford 4-chloro-N-(substituted-phenyl)butanamides (7a–j). In the final phase, nucleophilic substitution reaction of 4 was carried out with different electrophiles, 7a–j, to achieve novel indole based oxadiazole scaffolds with N-(substituted-phenyl)butamides (8a–j). The structural confirmation of all the as-synthesized compounds was performed by spectral and elemental analysis. These molecules were screened for their in vitro inhibitory potential against urease enzyme and were found to be potent inhibitors. The results of enzyme inhibitory kinetics showed that compound 8c inhibited the enzyme competitively with a Ki value 0.003 μM. The results of the in silico study of these scaffolds were in full agreement with the experimental data and the ligands showed good binding energy values. The hemolytic study revealed their mild cytotoxicity towards cell membranes and hence, these molecules can be regarded as valuable therapeutic agents in drug designing programs.
1. Introduction
Indole is an aromatic heterocyclic compound which exhibits a distinct reactivity. Indole is composed of a benzo-pyrrole in which the benzene and pyrrole rings are fused together through the 2- and 3-positions of the pyrrole ring. Indole can be deprotonated at the nitrogen end of the pyrrole ring. The salts thus formed prove to be good nucleophiles. The indole ring is found in many natural products such as fungal metabolites, indole alkaloids, and marine natural products. Highly ionic salts (e.g. Li+, K+) favor N-substitutions. Softer counter ions favor C-3 substitution.1Indoles are found in various natural products and have been identified as compounds of chemical and biological importance. Indole is a highly conserved heterocyclic molecule that acts as a free radical scavenger and has a broad-spectrum of antioxidant activity. It has a unique place in biological systems, playing crucial roles in the form of amino acid, growth hormone and alkaloids. The indole core is also an important component in many recent drugs for treatment of chemotherapy-induced nausea and vomiting, cluster headache, or as antihypertensive, antineoplastic and antimitotic agents.2–4 In addition, 1,3,4-oxadiazole derivatives have played a crucial part in theoretical development in heterocyclic chemistry and also used extensively in organic synthesis.5,6 Considerable attention has been focused on 2,5-disubstituted-1,3,4-oxadiazole containing compounds due to their remarkable biological activity and also their importance in the pharmaceutical field. These compounds are effectively being utilized as antibacterials. Some of these compounds have also been recognized as anticancer, anti-Parkinson, anti-HIV and anti-proliferative agents as well.7–9
Urease belongs to a family of highly conserved urea-hydrolyzing enzymes. Urease is known to be one of the major causes of disease induced by Helicobacter pylori, thus allowing them to survive at low pH of the stomach and therefore, play an important role in the pathogenesis of gastric and peptic ulcer. Proteus mirabilis and Yersinia enterocolitica are responsible for urolithiasis and are involved in the development of acute pyelonephritis and infection-induced reactive arthritis, respectively. The typical remedy for treating bacterial infection with antimicrobials has often proven futile, and only a few combination regiments have reached clinical practice. Thus, the need for alternative or novel treatments is evident.10,11
The bioactivity of indole and oxadiazole moieties prompted us to synthesize some new butanamide molecules bearing these moieties altogether. Hence, in continuation of our previous efforts on bioactivity study of indole containing compounds12,13 and urease inhibitory activity of bi-heterocyclic bi-amide molecules,14 the present investigation was designed to explore the urease inhibitory potential and the kinetic mechanism of newly synthesized bi-heterocyclic butanamides. The binding interactions with the targeted enzyme were ascertained by molecular docking, and the cytotoxicity of these scaffolds was evaluated by hemolysis to identify their therapeutic utility as promising drug candidates in drug discovery programs.
2. Materials and methods
2.1 General
All the chemicals, along with analytical grade solvents, were purchased from Sigma Aldrich, Alfa Aesar (Germany), or Merck, through local suppliers. Pre-coated silica gel Al-plates were used for TLC with ethyl acetate and n-hexane as solvent systems. Spots were detected by UV254. Gallonkamp apparatus was used to detect melting points in capillary tubes. Infrared (IR) spectra (ν, cm−1) were recorded by the pellet method using a Jasco-320-A spectrophotometer. Elemental analyses were performed on a Foss Heraeus CHN-O-Rapid instrument and were within ±0.4% of the theoretical values. Electron Impact Mass Spectrometry (EI-MS) spectra were measured on a JEOL JMS-600H instrument with a data processing system. Proton Nuclear Magnetic Resonance (1H-NMR) spectra (δ, ppm) were recorded at 600 MHz [Carbon Nuclear Magnetic Resonance (13C-NMR) spectra, at 150 MHz] in DMSO-d6 using a Bruker Advance III 600 Ascend spectrometer with a BBO probe. The 1H-NMR spectral peaks for interpretation are abbreviated as follows: s, singlet; d, doublet; dd, doublet of doublets; t, triplet; br.t, broad triplet; q, quartet; quint, quintet; sex, sextet; sep, septet; m, multiplet, dist, distorted. The structural characterization of all compounds is given in the ESI.†2.2 Synthesis of ethyl 4-(1H-indol-3-yl)butanoate (2)
4-(1H-indol-3-yl)butanoic acid (0.2 mol; 1) dissolved in absolute ethanol (70 mL) and a catalytic amount of concentrated sulfuric acid (20 mL) were placed in a 500 mL round bottom (RB) flask and refluxed for 8 h until the maximum completion of reaction, as determined through TLC. At the end, the reaction mixture was neutralized with 10% aqueous sodium carbonate (40 mL). The product was isolated by solvent extraction with chloroform (50 mL × 3). The solvent was distilled off and the required ester, 2, was obtained as a reddish brown liquid.2.3 Synthesis of 4-(1H-indol-3-yl)butanohydrazide (3)
4-(1H-indol-3-yl)butanoate (0.15 mol.; 2) in 60 mL methanol and hydrazine monohydrate (80%; 25 mL) were placed in a 500 mL round bottom flask. The reaction mixture was stirred for 14 h at room temperature (RT). After absolute conversion, the acid hydrazide was obtained by distilling methanol off from the reaction mixture. The precipitates were filtered, washed with cold n-hexane and air-dried to get pure 4-(1H-indol-3-yl)butanohydrazide (3).2.4 Synthesis of 5-[3-(1H-indol-3-yl)propyl]-1,3,4-oxadiazole-2-thiol (4)
4-(1H-indol-3-yl)butanohydrazide (0.13 mol; 3) in absolute ethanol (30 mL) and KOH (0.13 mol) were placed in a round bottom flask. Carbon disulfide (0.26 mol) was added subsequently. The mixture was refluxed for 16 h. On completion of the reaction, excess chilled distilled water and dil. HCl was added to adjust to pH 5–6. The precipitates were filtered, washed and dried to get the desired cyclized product, 4.2.5 Preparation of 4-chloro-N-(un/substituted-phenyl)butanamides (7a–j)
Synthesis of various 4-chloro-N-(un/substituted-phenyl)butanamides (7a–j) was carried out by reaction of various aryl amines (5a–j) with 4-chlorobutanoyl chloride (6) in equimolar quantities (0.001 moles) and shaking manually in 10% aqueous Na2CO3 solution. Solid precipitates were formed after 20–30 min, and then filtered and washed with cold distilled water to obtain the desired electrophiles, 7a–j.2.6 Synthesis of 4-({5-[3-(1H-indol-3-yl)propyl]-1,3,4-oxadiazol-2-yl}sulfanyl)-N-(substituted-phenyl)butanamides (8a–j)
5-[3-(1H-indol-3-yl)propyl]-1,3,4-oxadiazole-2-thiol (0.2 g, 4) was added in DMF (5 mL) contained in a 250 mL round bottom flask at room temperature, and a small amount of LiH was added, followed by stirring for 30 min. Then, different 4-chloro-N-(substituted-phenyl)butanamides (7a–j) were added separately in equimolar amounts to each respective reaction mixture and stirred for 60–70 hours. The completion of the reaction was monitored by TLC; after completion, the reaction mixture was quenched with ice cold water (100 mL). The respective derivatives, 8a–j, were collected through filtration or solvent extraction based on the nature of the product.2.7 In vitro urease inhibitory activity
The Jack bean urease activity was determined by measuring the amount of ammonia produced via the indophenols method, as reported.15,16 The reaction mixtures, comprised of 20 μL of enzyme (Jack bean urease, 5 U/mL) and 20 μL of compounds in 50 μL potassium phosphate buffer (100 mM urea, 10 mM K2HPO4, 1 mM EDTA and 10 mM LiCl, pH 8.2), were incubated for 30 min at 37 °C in 96-well plate. Briefly, 50 μL each of the phenol reagents (1%, w/v phenol and 0.005%, w/v sodium nitroprusside) and 50 μL of the alkali reagent (0.5%, w/v NaOH and 0.1% sodium hypochlorite NaOCl) were added to each well. The absorbance at 625 nm was measured after 10 min, using a microplate reader (OPTIMax, Tunable). All the reactions were performed in triplicate. The urease inhibition activities were calculated according to the following formula:| Urease inhibition activity (%) = (ODcontrol − ODsample × 100)/ODcontrol | (1) |
2.8 Kinetic analysis
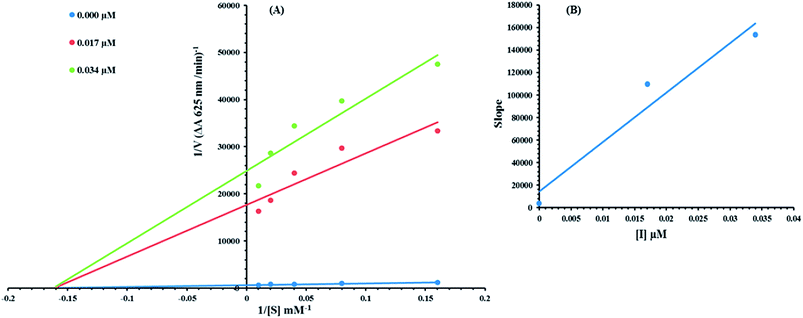
Kinetic analysis was carried out to determine the mode of inhibition. Compound 8c was selected on the basis of the lowest IC50 value. The kinetics was carried out by varying the concentration of urea in the presence of different concentrations of 8c (0.00, 0.017, and 0.034 μM). Briefly the urea concentration was changed from 100, 50, 25, 12.5 and 6.25 mM for the urease kinetics studies and the remaining procedure was the same for all kinetic studies, as described in the urease inhibition assay protocol. Maximal initial velocities were determined from the initial linear portion of absorbance up to 10 minutes after addition of the enzyme at per-minute intervals. The mode of inhibition of the enzyme was assayed via the Lineweaver–Burk plot of the inverse of the velocities (1/V) versus the inverse of the substrate concentration 1/[S] mM−1. The EI dissociation constant, Ki, was determined by secondary plot of 1/V versus the inhibitor concentration. The urease activity was determined by measuring ammonia production using the indophenol method, as reported previously.17,18 The results (change in absorbance per min) were processed by using the SoftMaxPro software.2.9 Computational methodology
2.10 Hemolytic activity
Bovine blood sample was collected in EDTA, which was diluted with saline (0.9% NaCl), and centrifuge at 1000 × g for 10 min. Erythrocytes were separated and diluted in phosphate buffer saline (PBS) of pH 7.4 and a suspension was made. The test compound solution (20 μL, 10 mg mL−1) was mixed with 180 μL of RBCs suspension and incubated for 30 min at room temperature. PBS was used as a negative control and Triton 100-X was taken as a positive control.23,24 The experiments were carried out with the control in triplicate. Statistical analysis was performed by Microsoft Excel 2010 for all the measurements and the results are presented as mean ± SEM. The % age of hemolysis was obtained by using the formula:
 | (2) |
3. Results and discussion
3.1 Chemistry
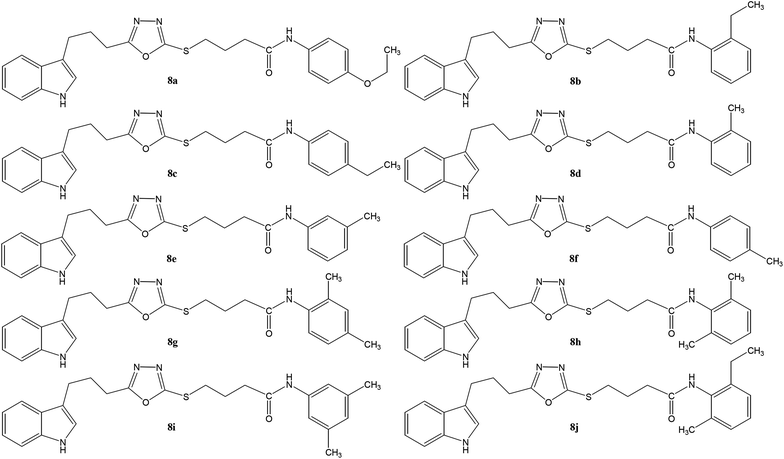
The convergent syntheses of the targeted bi-heterocyclic butamide derivatives was accomplished in superb yields through several steps in three phases of reactions. In the first phase, 4-(1H-indol-3-yl)butanoic acid (1) was subjected to esterification by ethanol in the presence of concentrated sulfuric acid taken in a catalytic amount. Ethanol was used as reactant and also as a solvent in order to push the equilibrium towards the product, as it was a reversible reaction. The product was collected by solvent extraction after the addition of a weak base and excess water. The base was added to neutralize the catalytic sulfuric acid and the unreacted carboxylic acid. The salts of these acids were transferred to the aqueous layer, while the resultant ester was present in the organic phase during solvent extraction. Thus, ethyl 4-(1H-indol-3-yl)butanoate (2) was obtained as a brownish liquid (solid at refrigeration). The second step was performed to convert the ethyl ester to the respective carbohydrazide, 3, by the nucleophilic hydrazine in the presence of an organic solvent such as methanol, and the mixture was set to reflux for 14 hours. Thus, 4-(1H-indol-3-yl)butanohydrazide (3) was obtained as a light brown coloured solid. The third step was a cyclization to form a heterocyclic ring through reaction with CS2 in a basic alcoholic medium. The resulting product was 5-[3-(1H-indol-3-yl)propyl]-1,3,4-oxadiazole-2-thiol (4), which had a mercapto group at its second carbon. In the second phase, different electrophiles were synthesized by reacting substituted-anilines (5a–j) with 4-chlorobutanoyl chloride (6) to afford 4-chloro-N-(substituted-phenyl)butanamides (7a–j). In the final phase, the acidic proton of 4 was replaced with the aforementioned electrophiles, 7a–j, in the presence of LiH using aprotic polar medium to obtain the required molecules, 8a–j, as sketched in Scheme 1 and structures of different derivatives have been drawn in Fig. 1.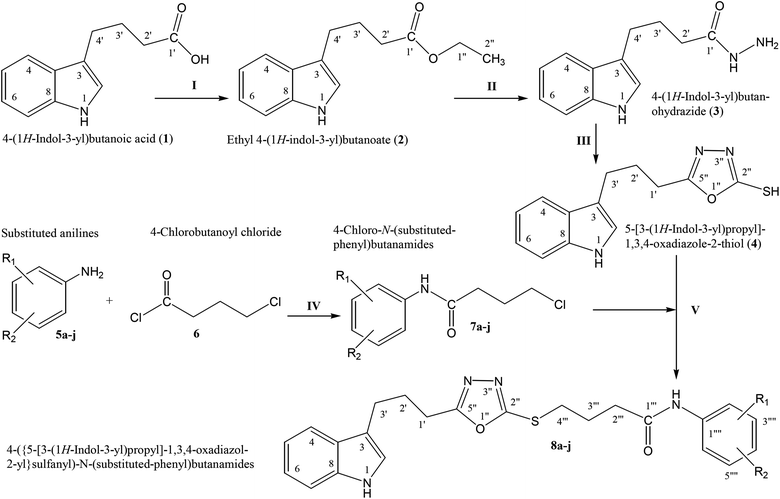 | ||
| Scheme 1 Outline for the synthesis of 4-({5-[3-(1H-indol-3-yl)propyl]-1,3,4-oxadiazol-2-yl}sulfanyl)-N-(substituted-phenyl)butanamides (8a–j). For –R1 and –R2, see structures of derivatives (Fig. 1). Reagents & conditions: (I) EtOH/H2SO4/refluxing for 8 h (II) MeOH/N2H4·H2O/refluxing for 14 h (III) EtOH/CS2/KOH/refluxing for 16 h (IV) Aq. Na2CO3 soln/pH 9–10/vigorous shaking at RT for 20–30 minutes. (V) DMF/LiH/stirring for 60–70 h. | ||
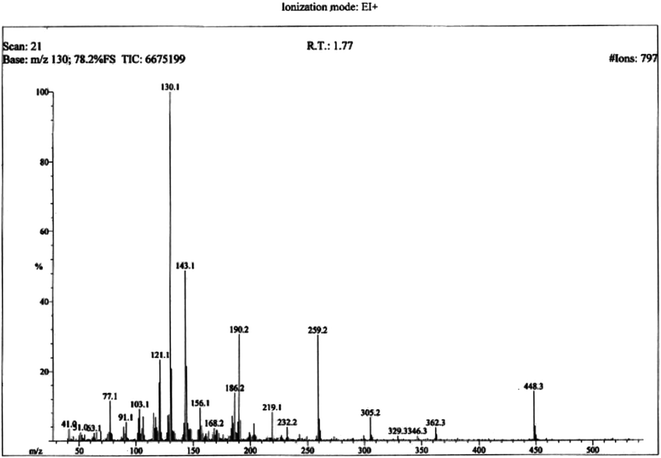
The structural analysis of one of the compounds is discussed here in detail for the articulacy of the reader. The molecule 8g was obtained as a brown sticky liquid. Its molecular formula, C25H28N4SO2, was established by CHN analysis data and its molecular ion peak in its EI-MS spectrum (m/z 448 (Fig. 2)). The number of proton and carbon resonances in its 1H-NMR and 13C-NMR spectra were also in agreement with its deduced molecular formula. Different functionalities in this molecule were depicted by absorption bands in its IR spectrum at ν 3226 (N–H str.), 2942 (C–H str. of aromatic ring), 1673 (C![[double bond, length as m-dash]](https://www.rsc.org/images/entities/char_e001.gif) O str.), 1648 (C
O str.), 1648 (C![[double bond, length as m-dash]](https://www.rsc.org/images/entities/char_e001.gif) N Str.), 1585 (C
N Str.), 1585 (C![[double bond, length as m-dash]](https://www.rsc.org/images/entities/char_e001.gif) C aromatic str.), 1520, 1477, 1415 (Str. for oxadiazole), 1159 (C–O–C Str.), 644 (C–S str.) cm−1.
C aromatic str.), 1520, 1477, 1415 (Str. for oxadiazole), 1159 (C–O–C Str.), 644 (C–S str.) cm−1.
With the help of 1H-NMR spectrum of this molecule, the indole heterocyclic core was identified clearly by the characteristic signals at δ 10.80 (s, 1H, NH-1), 7.51 (br.d, J = 7.8 Hz, 1H, H-7), 7.34 (br.d, J = 8.1 Hz, 1H, H-4), 7.14 (dist.d, J = 1.8 Hz, 1H, H-2), 7.06 (br.t, J = 7.2 Hz, 1H, H-6) and 6.97 (br.t, J = 7.2 Hz, 1H, H-5) ppm.12 Similarly, the resonances at δ 7.21 (br.d, J = 7.9 Hz, 1H, H-6′′′′), 7.00 (br.s, 1H, H-3′′′′), 6.94 (br.d, J = 7.7 Hz, 1H, H-5′′′′), along with two methyl signals at δ 2.23 (s, 3H, CH3-4′′′′) and 2.12 (s, 3H, CH3-2′′′′) ppm, were typical for a 2,4-dimethylphenyl group in the molecule. The C and N-substituted butanamide group was identified by four signals at δ 9.25 (s, 1H, CONH-1), 3.27 (t, J = 7.1 Hz, 2H, CH2-4′′′), 2.47 (t, J = 7.2 Hz, 2H, CH2-2′′′) and 2.06–2.01 (m, 4H, CH2-3′′′ & CH2-2′). In the up-field region of the spectrum, the signals of three intervening methylene groups at δ 2.87 (t, J = 7.4 Hz, 2H, CH2-3′), 2.77 (t, J = 7.3 Hz, 2H, CH2-1′), and 2.06–2.01 (m, 4H, CH2-3′′′ & CH2-2′), were helpful in ascertaining the connectivity of the indole moiety from its 3-position to the 5-position of the 1,3,4-oxadiazole scaffold. The 1H-NMR spectrum of this compound is shown in Fig. 3(a, b and c).
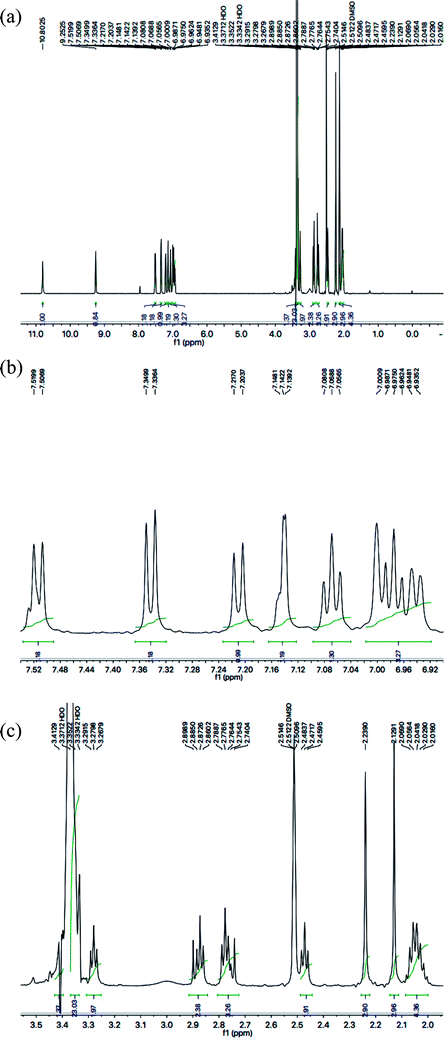 | ||
| Fig. 3 (a) 1H-NMR spectrum of 8g. (b) Expanded aromatic region of 1H-NMR spectrum of 8g. (c) Expanded aliphatic region of 1H-NMR spectrum of 8g. | ||
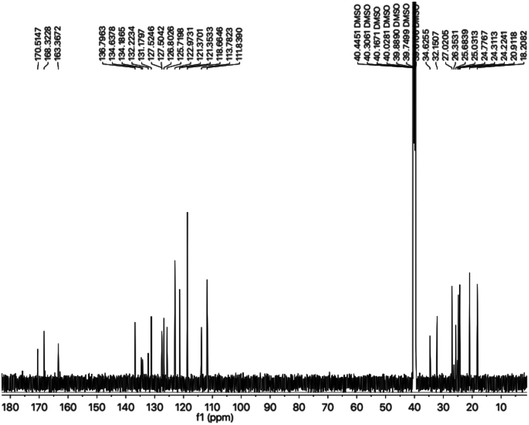
The carbon skeleton of this molecule was also fully corroborated by its 13C-NMR spectrum, shown in the Fig. 4. The signals in its 13C-NMR spectrum were rational for all the twenty five carbons, where the most downfield quaternary carbons signals at δ 168.32 (C-5′′) and 163.36 (C-2′′) belonged to the cyclized 1,3,4-oxadiazole ring, thus confirming the formation of this heterocyclic core. The other three quaternary carbons appearing at δ 136.79 (C-8), 127.50 (C-9), and 113.78 (C-3) ppm, were attributed to the indole moiety. The methine carbon resonances appearing at δ 122.97 (C-2), 121.35 (C-6), 118.66 (C-5 & 7), 111.83 (C-4) were also coherent with the indole moiety.13 The C and N-substituted butanamido group was confirmed by two discrete resonances, one for a carbonyl group at δ 170.51 (C-1′′′) and other for three methylene groups at δ 34.62 (C-2′′′), 32.15 (C-4′′′) and 25.68 (C-2′′′). The 2,4-dimethylphenyl group attached to a nitrogen atom was thoroughly substantiated by three quaternary signals at δ 134.63 (C-1′′′′), 134.18 (C-2′′′′) and 132.22 (C-4′′′′), three methine signals at δ 131.17 (C-5′′′′), 126.80 (C-3′′′′) and 125.71 (C-6′′′′), and two methyl signals at δ 20.91 (CH3-4′′′′) and 18.20 (CH3-2′′′′). In the up-field region of the spectrum, three signals at δ 27.02 (C-1′), 24.77 (C-3′), and 24.31 (C-2′) were characteristic for three connected methylenes, which adjoined the indole moiety with the heterocyclic oxadiazole core in the molecule. So, on the basis of the aforesaid cumulative evidences, the structure of 8g was confirmed and it was named N-(2,4-dimethylphenyl)-4-({5-[3-(1H-indol-3-yl)propyl]-1,3,4-oxadiazol-2-yl}sulfanyl)butanamide. A similar methodology was implemented for the structural characterization of the other derivatives in the synthesized series.
3.2 Urease inhibition and structure–activity relationship
The synthesized bi-heterocyclic butanamides, 8a–j, were screened against urease of Canavalia ensiformis (Jack bean) and were found to have potent inhibitory potential against this enzyme, as was evident from their low IC50 (μM) values (Table 1), relative to the standard, thiourea, which has an IC50 value of 4.7455 ± 0.0546 μM. The jack bean urease was used only as a surrogate because the human urease is highly expensive and is not feasible for such in vitro investigations.16–18| Compounds | Aryl part | Urease activity IC50 ± SEM (μM) | Hemolysis (%) (Mean ± SEM) |
|---|---|---|---|
| a SEM = Standard error of the mean; values are expressed in mean ± SEM. PBS Hemolysis = 2.93 ± 0.01%. | |||
| 8a |  |
0.0523 ± 0.0044 | 3.16 ± 0.05 |
| 8b |  |
0.0542 ± 0.0211 | 2.41 ± 0.03 |
| 8c |  |
0.0175 ± 0.0065 | 0.62 ± 0.02 |
| 8d |  |
0.0717 ± 0.0152 | 5.18 ± 0.03 |
| 8e |  |
0.0323 ± 0.0119 | 5.92 ± 0.02 |
| 8f |  |
0.1017 ± 0.0299 | 3.51 ± 0.04 |
| 8g |  |
0.2002 ± 0.0122 | 1.41 ± 0.01 |
| 8h |  |
0.0251 ± 0.0083 | 2.63 ± 0.02 |
| 8i |  |
0.1244 ± 0.0318 | 7.32 ± 0.03 |
| 8j |  |
0.0375 ± 0.0058 | 9.63 ± 0.05 |
| Thiourea | 4.7455 ± 0.0546 | — | |
| Triton X | — | 89.11 ± 0.01 | |
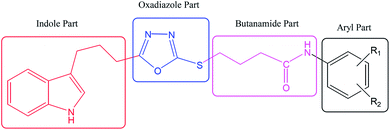
Although the observed activity is the resultant of the whole molecule, a limited structure–activity relationship (SAR) was rationalized by analyzing the effect of different aryl moieties on the inhibitory potential. Fig. 5 displays the general structural features of the synthetic compounds.
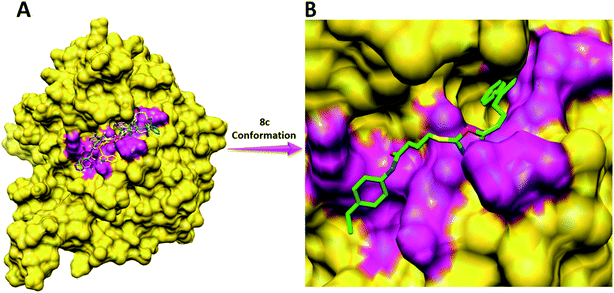
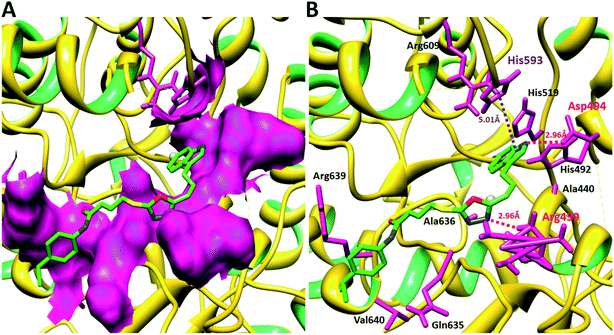
Compound 8a (IC50 = 0.0523 ± 0.0044 μM) having a 4-ethyoxyphenyl ring showed a comparable activity with that of 8b (IC50 = 0.0542 ± 0.0211 μM) which bears a 2-ethylphenyl group. This indicates that the phenyl ring either having a 4-ethoxy or 2-ethyl group behaves almost similarly with the active site of the enzyme. However, compound 8c, bearing an ethyl group at the 4-position of the phenyl ring, showed excellent inhibitory potential (IC50 = 0.0175 ± 0.0065 μM) and was identified as the most active among all the synthetic analogues. This may be due to an appropriate interaction of the 4-ethylphenyl ring with the active site of enzyme (Fig. 6).
Among the three regio-isomers, 8d, 8e and 8f, the molecule 8e, bearing a 3-methylphenyl group, exhibited better inhibitory potential (IC50 = 0.0323 ± 0.0119 μM), although, 8d with a 2-methylphenyl moiety, also possessed very similar activity (IC50 = 0.0717 ± 0.0152 μM). A minute reducing trend in activity was observed in 8f which had the same methyl group at the 4-position of the phenyl ring (IC50 = 0.1017 ± 0.0299 μM), which means that more efficient interactions are made with the enzyme when a methyl group is present at the meta position instead of the ortho or para position (Fig. 7).
Among the di-substituted molecules, compound 8h and 8j, having di-ortho substitutions, were found to be more suitable than the other analogues, and exhibited similar IC50 values: 0.0251 ± 0.0083 and 0.0375 ± 0.0058 μM, respectively, although a methyl group at the 2-position in 8h was replaced with an ethyl group in 8j. The compound, 8h, was the second most active compound of the series. In other two, di-methylated regio-isomers, 8g and 8i, the presence of two methyl groups at 3 and 5-positions of the phenyl ring in 8i attributed this molecule with slightly better inhibitory potential (IC50 = 0.1244 ± 0.0318 μM) as compared to 8g (IC50 = 0.2002 ± 0.0122 μM) in which the two methyl groups were present at the 2- and 4-positions of the phenyl ring (Fig. 8).
3.3 Kinetic analysis
Based on our results, we selected the most potent compound 8c to determine their inhibition type and inhibition constant on jack bean urease. The potential of these compounds to inhibit the free enzyme and enzyme substrate complex was determined in terms of the EI and ESI constants respectively. The kinetic studies of the enzyme by the Lineweaver–Burk plot of 1/V versus 1/[S] in the presence of different compound concentrations gave a series of straight lines (Fig. 9A). The results of compound 8c showed that the compound intersected within the second quadrant. The analysis showed that Vmax decreased with the increase in inhibitor dosage, while Km remained the same. This behavior indicated that compound 8c inhibited the urease non-competitively to form an enzyme inhibitor complex. The secondary plot of slope against the concentration of inhibitors showed the enzyme-inhibitor dissociation constant (Ki) (Fig. 9B).The kinetic results are presented in the Table 2.
| Concentration (μM) | Vmax (ΔA/Min) | Km (mM) | Inhibition type | Ki (μM) |
|---|---|---|---|---|
| a Vmax is the reaction velocity, Km is the Michaelis–Menten constant, Ki is the EI dissociation constant. | ||||
| 0.00 | 0.001724017 | 5.9 | Non-competitive | 0.003 |
| 0.017 | 6.11923 × 10⁻⁵ | 5.9 | ||
| 0.034 | 4.59941 × 10⁻⁵ | 5.9 | ||
3.4 Structural and physiochemical assessment of jack bean urease
Jack bean urease is a class of hydrolase protein containing couple of nickel atoms in the active region of target protein. The VADAR analysis justified that the Jack bean urease architecture consists of 27% α-helices, 31% β-sheets and 41% coils. Moreover, Ramachandran plots also indicated that 97.5% of the residues were present in the favored regions, which shows good precision of phi (φ) and psi (ψ) angles among the coordinates of the jack bean urease structure (Fig. S1†).| Docking complexes | Binding affinity (kcal mol−1) |
|---|---|
| 8a | −8.3 |
| 8b | −8.4 |
| 8c | −8.4 |
| 8d | −8.5 |
| 8e | −8.6 |
| 8f | −9.5 |
| 8g | −8.6 |
| 8h | −9.4 |
| 8i | −8.5 |
| 8j | −9.1 |
3.5 Hemolytic activity
All the as-synthesized bi-heterocyclic butamides, 8a–j, were also subjected to hemolytic assay to find out their cytotoxicity profile. The results of the percentage hemolysis (%) are shown in Table 1. Our results showed that all the compounds of this series have moderate toxicity towards red blood cell membrane. Maximum membrane toxicity was shown by the compound 8j (9.63 ± 0.05%) which is feeble relative to the positive control, Triton X having hemolysis of 89.11 ± 0.01%. The minimum toxicity was pragmatic in 8c (0.62 ± 0.02%). Precisely, a very low toxicity was also observed for molecules 8g (1.41 ± 0.01%), 8b (2.41 ± 0.03%) and 8h (2.63 ± 0.02%) respectively, relative to that of Triton-X.4. Conclusion
The targeted 2-({5-[3-(1H-indol-3-yl)propyl]-1,3,4-oxadiazol-2-yl}sulfanyl)-N-(substituted-phenyl)butanamides (8a–j) were synthesized in good yields and these molecules, owing to their unique skeleton, possessed potent inhibitory potential against urease. The molecular docking results were in complete agreement with enzyme inhibition data. These molecules were screened for their in vitro inhibitory potential against urease enzyme and were found to be potent inhibitors. The enzyme inhibitory potential (0.0175 ± 0.0065) and kinetics results showed that compound 8c inhibited the enzyme competitively with Ki value 0.003 μM. The in silico study of these scaffolds was in full agreement with the experimental data and 8c showed good interaction within the active region of the target protein, having a good binding energy value (−8.4 kcal mol−1). Almost all the molecules also demonstrated low cytotoxicity. Therefore, these studies conclude that the newly synthesized molecules might serve as promising drug candidates for further structural optimizations and drug designing studies.Conflicts of interest
There are no conflicts to declare.Acknowledgements
The authors acknowledge the Higher Education Commission (HEC) of Pakistan for financial support regarding EI-MS analysis.References
- P. Hardik, D. Nilesh, P. Jagath and P. Bhagirath, Int. J. Drug Res. Technol., 2012, 2(3), 225–230 Search PubMed
.
- S. Agarwal, S. Cammerer, S. Filali, W. Frohner, J. Knoll and M. P. Krahl, Curr. Org. Chem., 2005, 9, 1601–1614 CrossRef
.
- J. Hajicek, Czech. Chem. Commun., 2007, 72, 821–898 CrossRef
.
- M. A. Metwally, S. Shaaban, B. F. Abdel-Wahab and G. A. El-Hiti, Curr. Org. Chem., 2009, 13, 1475–1496 CrossRef
.
- M. S. Chande, K. A. Puthamane, P. A. Brave, R. R. Khanwelkar and D. S. Venkatraman, J. Braz. Chem. Soc., 2008, 19(1), 42–52 CrossRef
.
- M. Yar, M. Bajda, R. A. Mehmood, L. R. Sidra, N. Ullah, L. Shahzadi, M. Ashraf, T. Ismail, S. A. Shahzad, Z. A. Khan, S. A. R. Naqvi and N. Mahmood, Lett. Drug Des. Discovery, 2014, 11, 331–338 CrossRef PubMed
.
- M. Amir and S. Shahani, Indian J. Heterocycl. Chem., 1998, 8, 107–110 Search PubMed
.
- J. Hazarika and J. C. S. Kataky, Indian J. Heterocycl. Chem., 1998, 7, 83–92 Search PubMed
.
- B. S. Holla, C. S. Prasanna, B. Poojary, K. S. Rao, K. Shridhara and U. G. Bhat, Indian J. Chem., 2004, 43B, 864–868 Search PubMed
.
- M. I. Choudhary, US pat. 20150368214 A1, 2015
.
- M. A. Lodhi, J. Hussain, M. A. Abbasi, A. R. Jassbi, M. I. Choudhary and V. U. Ahmad, J. Enzyme Inhib. Med. Chem., 2006, 21(5), 531–535 CrossRef PubMed
.
- K. Rubab, M. A. Abbasi, Aziz-ur-Rehman, S. Z. Siddiqui and M. N. Akhtar, Trop. J. Pharm. Res., 2016a, 15(7), 1515–1524 Search PubMed
.
- K. Rubab, M. A. Abbasi, Aziz-ur-Rehman, S. Z. Siddiqui, M. Ashraf and A. Shaukat, Trop. J. Pharm. Res., 2016b, 15(7), 1525–1533 Search PubMed
.
- M. A. Abbasi, M. Hassan, Aziz-ur-Rehman, S. Z. Siddiqui, H. Raza, S. A. A. Shah and S.-Y. Seo, Bioorg. Med. Chem., 2018, 26, 3791–3804 CrossRef PubMed
.
- M. W. Weatherburn, Anal. Chem., 1967, 39(8), 971–974 CrossRef
.
- H. Raza, Q. Abbas, M. Hassan, S.-H. Eo, Z. Ashraf, D. Kim, A. R. Phull, S. J. Kim, S. K. Kang and S.-Y. Seo, Pharm. Biol., 2017, 55(1), 218–226 CrossRef PubMed
.
- P. A. Channar, A. Saeed, F. Albericio, F. A. Larik, Q. Abbas, M. Hassan, H. Raza and S.-Y. Seo, Molecules, 2017, 22(8), 1352–XXXC CrossRef PubMed
.
- A. Saeed, F. A. Larik, P. A. Channar, H. Mehfooz, M. H. Ashraf, Q. Abbas, M. Hassan and S.-Y. Seo, Chem. Biol. Drug Des., 2017, 90, 764–777 CrossRef PubMed
.
- E. F. Pettersen, T. D. Goddard, C. C. Huang, G. S. Couch, D. M. Greenblatt, E. C. Meng and T. E. Ferrin, J. Comput. Chem., 2004, 25, 1605–1612 CrossRef PubMed
.
- L. Willard, A. Ranjan, H. Zhang, H. Monzavi, R. F. Boyko, B. D. Sykes and D. S. Wishart, Nucleic Acids Res., 2003, 31, 3316–3319 CrossRef PubMed
.
- S. Dallakyan and A. J. Olson, Methods Mol. Biol., 2015, 1263, 243–250 CrossRef PubMed
.
- Studio D., Discovery,version 2.1. Accelrys,San Diego, CA, 2008 Search PubMed
.
- M. Shahid, S. A. Bukhari, Y. Gul, H. Munir, F. Anjum, M. Zuber, T. Jamil and K. M. Zia, Int. J. Biol. Macromol., 2013, 62, 172–179 CrossRef PubMed
.
- C. R. Yang, Y. Zhang, M. R. Jacob, S. I. Khan, Y. J. Yhang and X. C. Li, Antimicrob. Agents Chemother., 2006, 50(5), 1710–1714 CrossRef PubMed
.
- T. Abdul-Fattah, A. Saeed, P. A. Channar, Z. Ashraf, Q. Abbas, M. Hassan and F. A. Larik, Chem. Biol. Drug Des., 2018, 91, 434–447 CrossRef PubMed
.
- P. A. Channar, A. Saeed, F. Albericio, F. A. Larik, Q. Abbas, M. Hassan, H. Raza and S. Y. Seo, Molecules, 2017, 22, E1352 CrossRef PubMed
.
- A. Saeed, S. Ur-Rehman, P. A. Channar, F. A. Larik, Q. Abbas, M. Hassan, H. Raza and S. Y. Seo, Drug Res., 2017, 67, 596–605 CrossRef PubMed
.
- A. Saeed, P. A. Mahesar, P. A. Channar, F. A. Larik, Q. Abbas, M. Hassan, H. Raza and S. Y. Seo, Chem. Biodiversity, 2017, 14, e1700035 CrossRef PubMed
.
- A. Saeed, S. Rehman, P. A. Channar, F. A. Larik, Q. Abbas, M. Hassan, H. Raza, U. Flörke and S. Y. Seo, J. Taiwan Inst. Chem. Eng., 2017, 77, 54–63 CrossRef
.
- A. Saeed, F. A. Larik, P. A. Channar, H. Mehfooz, M. H. Ashraf, Q. Abbas, M. Hassan and S. Y. Seo, Chem. Biol. Drug Des., 2017, 90, 764–777 CrossRef PubMed
.
Footnote |
| † Electronic supplementary information (ESI) available. See DOI: 10.1039/c8ra04987d |
| This journal is © The Royal Society of Chemistry 2018 |

