 Open Access Article
Eco-friendly seeded Fe3O4-Ag nanocrystals: a new type of highly efficient and low cost catalyst for methylene blue reduction†
Y. Liu‡
ab,
Y. Y. Zhangab,
Q. W. Kouab,
Y. Chenab,
D. L. Han‡c,
D. D. Wangd,
Z. Y. Lue,
L. Chen ab,
J. H. Yang
 *ab and
S. Xing*f
aCollege of Physics, Jilin Normal University, Siping 136000, China. E-mail: jhyang1@jlnu.edu.cn
bKey Laboratory of Functional Materials Physics and Chemistry of the Ministry of Education, Jilin Normal University, Changchun 130103, China
cSchool of Materials Science and Engineering, Changchun University of Science and Technology, Changchun 130022, China
dTechnology Development Department, GLOBALFOUNDRIES (Singapore) Pte. Ltd., 60 Woodlands Industrial Park D, Street 2, Singapore 738406, Singapore
eSchool of Environment and Safety Engineering, Jiangsu University, Zhenjiang 212013, China
fUnited Microelect Corp. Ltd., 3 Pasir Ris Dr 12, Singapore 519528, Singapore. E-mail: Scott_Xing@UMC.com; Fax: +86 434 3294566; Tel: +86 434 3294566
First published on 9th January 2018
Abstract
Hybrid Fe3O4-Ag nanocrystals, a new type of highly efficient and reusable catalyst for methylene blue (MB) reduction, are fabricated by a novel seed deposition process. X-ray diffraction and Mössbauer spectroscopy results show that the developed iron oxides are in a pure magnetite Fe3O4 phase. Upon manipulating the amount of Ag seeds capsuled on the modified surfaces of Fe3O4 nanocrystals, the catalytic capacities on the reduction of MB can be precisely adjusted with a tunable fabrication cost control. The linear correlation of the reduced MB concentration versus reaction time catalyzed by our developed hybrid Fe3O4-Ag nanocrystals is coherent with pseudo first order kinetics. Importantly, with remarkable recyclability features, the hybrid Fe3O4-Ag nanocrystals can be easily separated by applying an external magnetic field. The tailored catalytic performances of the hybrid Fe3O4-Ag nanocrystals during MB reduction are attributed to the optimized dynamic electron transfer process, which dominates the electrochemical mechanism wherein the nucleophilic BH4− ions donate electrons to electrophilic organic MB through Ag seeds in a regulated amount. Such developed hybrid Fe3O4-Ag nanocrystals pave the way towards the mass production of highly efficient and low cost catalysts for methylene blue reduction.
1. Introduction
Organic dyes with considerable coloring capacity are widely employed in the manufacturing of consumer products, including textiles, paints, printing inks, cosmetics, plastics and paper.1–3 However, the massive discharge of dye-containing effluents into the water environment have led to severe environmental issues, which have attracted extensive attention.4 The immoderate release of wastewater containing organic dyes could impede sunlight penetration into water, thus reducing the photosynthetic reaction of plants and destroying the ecological balance of water bodies.5 Most seriously, most of the organic dyes have toxic, carcinogenic and teratogenic properties, which will severely threaten the health of human beings.6 For example, as an important basic dye used for printing calico, dyeing cotton and leather, methylene blue (MB), a heterocyclic aromatic dye, may cause various harmful effects such as eye burns, irritation to the gastro-intestinal tract and to the skin.7There are many approaches, such as chemical oxidation, adsorption, photocatalytic degradation and catalytic reduction have been widely studied and exploited to decolorize and remove these organic dyes.8–10 Among them, the photocatalytic degradation in the presence of semiconductor photocatalysts (e.g., typically, ZnO and TiO2) and catalytic reduction of noble metal catalysts (e.g., typically, Ag and Au) are two of the most common ways for the treatment of organic dyes.11–16 Although semiconductor photocatalysts have many advantages such as nontoxicity, high photostability and relatively low cost, the photocatalytic efficiency for all these photocatalysts is still low, hindering them far away from the practical applications. Catalytic reduction of noble metal catalysts is one of the most effective methods for the treatment of organic dyes. Unfortunately, on one hand, noble metal nanocrystals tend to aggregate easily because of their high surface energy which originates from the high surface area to volume ratio.17 On the other hand, noble metal catalysts encounter an obstacle that are difficult to be separated by the traditional methods such as centrifugation or filtration. To solve aforementioned two problems, immobilizing the noble metal nanocrystals onto the surface of the suitable magnetic nanocrystal supports has been a new trend, which may not only prevent aggregation of noble metal nanocrystals, but also be efficiently separated and recycled by an external magnetic field.18
Magnetite Fe3O4 nanocrystals with the insoluble and superparamagnetic properties are the most popular “support materials” for catalysts due to the relatively high saturation magnetization and fast magnetic responsiveness.19–23 In addition, noble metal nanoparticles have received considerable attention because of their facile and robust interaction with different molecules.24–27 Compared with other noble metal nanocatalysts such as Au, Pt and Pd, Ag nanocrystals are cheaper and possess good chemical and physical properties, which can act as catalysts for the degradation of a variety of organic dye pollutants.28 Recently, the considerable efforts have been devoted to the design and preparation of Fe3O4-Ag nanocrystals for the degradation of the MB. Xie et al. prepared Fe3O4@PDA-Ag microspheres and investigated the catalytic capabilities on the reduction of MB at different pH values.29 Amir et al. synthesized Fe3O4@His@Ag and Fe3O4@HA@Ag nanocrystals, respectively, to catalyze the degradation of MB and studied the rate constants for the reduction of MB.30 However, there are relatively few systematic studies devoted to the relation between the amount of silver seeds deposited on the surfaces of Fe3O4 nanocrystals and catalytic capacities on the reduction of MB. Therefore, it is necessary to effectively control the amount of silver seeds adhered to the surfaces of Fe3O4 nanocrystals.
In this work, the polyethyleneimine dithiocarbamate (PEI-DTC) were employed as polymers to prepare Fe3O4-Ag seeds nanocrystals by the seed deposition process. By adjusting the adding times of silver seeds or the additive amount of Fe3O4 nanocrystals, we control the amount of silver seeds deposited on the modified surfaces of Fe3O4 nanoparticles and investigate the effects of the amount of silver seeds on the catalytic capacities on the reduction of MB. In comparison with the previous results, the following features are evident: (1) the utilization of PEI-DTC polymers can enhance the adhesive force of the silver seeds on the surfaces of Fe3O4 nanocrystals; (2) the silver seeds are uniformly deposited on the surfaces of the Fe3O4 nanocrystals; (3) Fe3O4 nanocrystals coated with the silver seeds instead of the continuous silver shell can avoid the decrease of the saturation magnetization (Ms) of Fe3O4-Ag seeds nanocrystals to the most extent; (4) Fe3O4-Ag seeds nanocrystals not only exhibit excellent catalytic capacities on the reduction of MB, but also are easily separated and recycled by applying an external magnet field.
2. Experimental
2.1 Materials
The initial materials included iron(III) acetylacetonate (Fe(C5H7O2)3), benzyl ether (C14H14O), oleic acid (C18H34O2), polyethyleneimine (PEI, branched, MW ≈ 25![[thin space (1/6-em)]](https://www.rsc.org/images/entities/char_2009.gif) 000 g mol−1), potassium hydroxide (KOH), carbon disulfide (CS2), sodium citrate dihydrate (Na3C6H5O7·2H2O), sodium borohydride (NaBH4) and silver nitrate (AgNO3). All chemical reagents in this experiment were used as received with no further purification.
000 g mol−1), potassium hydroxide (KOH), carbon disulfide (CS2), sodium citrate dihydrate (Na3C6H5O7·2H2O), sodium borohydride (NaBH4) and silver nitrate (AgNO3). All chemical reagents in this experiment were used as received with no further purification.
2.2 Preparation of Fe3O4 nanocrystals
Rather than general nanomaterials or quantum dots synthesis,31–36 in present work, the cubic Fe3O4 nanocrystals were synthesized by the thermal decomposition method, which was described in our previous work.37 Typically, 1.268 mL of C18H34O2 was added to a mixture of 706 mg of Fe(C5H7O2)3 and 25 mL of C14H14O, which was heated to 300 °C and maintained for 2 h under an argon ambient. After being cooled down to room temperature, the solution was rinsed with a mixture of toluene and hexane and dried under vacuum overnight.2.3 Preparation of Fe3O4@PEI-DTC
This process involved two steps. The first step is the synthesis of PEI-DTC. In brief, 250 mg of PEI and 325 mg of KOH were dissolved in 25 mL methanol. After the mixture solution was degassed, 347.5 μL of CS2 was added dropwise to the mixture solution. The second step is the synthesis of Fe3O4@PEI-DTC. The 10 mg of Fe3O4 nanocrystals was well dispersed in 20 mL of methanol, and the obtained PEI-DTC solution was added drop by drop. After the reaction, mixture was kept at room temperature for 1 h, the resultant product was separated and collected with a magnet and subsequently put through 3 wash cycles with deionized water. The obtained Fe3O4@PEI-DTC nanocrystals were stored in 4 mL of deionized water.2.4 Preparation of silver seeds
The silver seeds were prepared based on the work by Dasgupta et al.38 Some experimental conditions were modified. 20 mL of 0.5 mM NaBH4 and 25 mL of 3.5 mM Na3C6H5O7·2H2O were mixed. The mixture was heated up to and kept at 60 °C under vigorous stirring for 0.5 h in the dark. Subsequently, 5 mL of 1 mM AgNO3 was injected drop by drop. The pH of the solution was adjusted to 10.8 by using 0.1 M NaOH while heating process was continued for another 20 min. Finally, the reaction mixture was allowed to cool down to room temperature and stored in the dark.2.5 Preparation of Fe3O4@PEI-DTC-Ag seeds nanocrystals
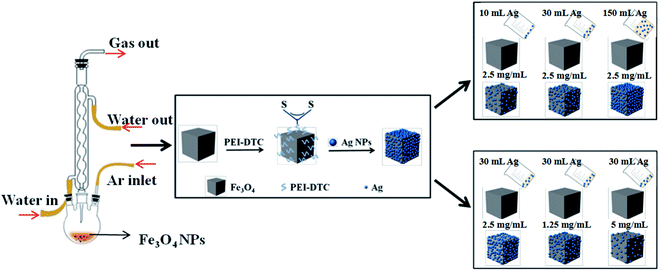
10 mL of silver seeds was added dropwise to obtain Fe3O4@PEI-DTC nanocrystals dispersed in deionized water under ultrasonic treatment. After 2 h of sonication, the Fe3O4@PEI-DTC-Ag seeds nanocrystals were washed three times with the deionized water and finally dispersed in 4 mL of deionized water, named as Fe3O4-Ag 10 mg-10 mL. The experiment was carried out under the same conditions as Fe3O4-Ag 10 mg-10 mL. But the addition of the silver seeds was changed to 30, 50, 100 and 150 mL (10 mL each time), named as Fe3O4-Ag 10 mg-30 mL, Fe3O4-Ag 10 mg-50 mL, Fe3O4-Ag 10 mg-100 mL and Fe3O4-Ag 10 mg-150 mL, respectively. Furthermore, to study the effect of the concentration of Fe3O4 nanocrystals on the quantity of silver seeds deposited on the surface of Fe3O4 nanocrystals, the volume of the silver seeds was fixed in 30 mL, but the mass of the cubic Fe3O4 nanocrystals was adjusted to 1, 5, 15 and 20 mg, which were named as Fe3O4-Ag 1 mg-30 mL, Fe3O4-Ag 5 mg-30 mL, Fe3O4-Ag 15 mg-30 mL and Fe3O4-Ag 20 mg-30 mL, respectively. Fig. 1 shows schematic illustration of the synthesis of Fe3O4-Ag seeds nanocrystals.2.6 Application of the Fe3O4-Ag seeds nanocrystals for catalytic reduction of MB
The catalytic reduction of MB by the Fe3O4-Ag seeds nanocrystals in the presence of NaBH4 was performed to explore the catalytic activity and the reusability of the Fe3O4-Ag seeds nanocrystals. 1 mg of Fe3O4-Ag seeds nanocrystals was added to 2 mL of MB aqueous solution (pH = 5.8, 40 mg L−1). Subsequently, 0.1 mL of NaBH4 aqueous solution (0.1 M, freshly prepared each time before use) was injected into the solution under mechanical agitation. MB with blue color could be gradually reduced to colorless, and the catalytic process was monitored by measuring the absorbance changes of MB at 660 nm with a UV-Vis absorbance spectroscopy. To study the recyclability of the Fe3O4-Ag seeds nanocrystals, the used samples were separated from the reaction solution using a magnet after the catalytic reduction, and were first rinsed with 2 mL of 1.5 mM NaBH4 aqueous solution and then washed three times with ethanol and deionized water. As is described above, the procedure for catalytic reduction of MB was repeated four times.2.7 Characterization methods
Structure characterization of the as-synthesized samples was carried out on a Rigaku D/Max-2500 copper rotating-anode X-ray diffractometer (XRD) using CuKα radiation (40 kV, 200 mA). The Mössbauer spectrum was collected on a FAST Comtec Mössbauer system at room temperature, using a source of 57Co(Pd) and a conventional constant acceleration mode. The isomer shift and velocity were given relative to that of α-Fe and the spectrum was fitted with Lorentzian lines via the least square method. Detailed structure of the obtained samples were characterized by a JEOL JSM-7800F field-emission scanning electron microscopy (FESEM) at an acceleration voltage of 20 kV and a JEOL 2100 transmission electron microscope (TEM) operating at 200 kV. X-ray photoelectron spectrum was measured with Thermo Scientific ESCALAB 250Xi X-ray photoelectron spectroscopy (XPS). Magnetic properties were taken by a Quantum Design MPMS3 superconducting quantum interference device (SQUID) magnetometer. Ultraviolet-visible spectroscopy (UV-Vis) absorbance spectra were recorded on a Shimadzu UV 3600 spectrophotometer in the range of 350–800 nm.3. Results and discussion
3.1 Structure of Fe3O4-Ag seeds nanocrystals
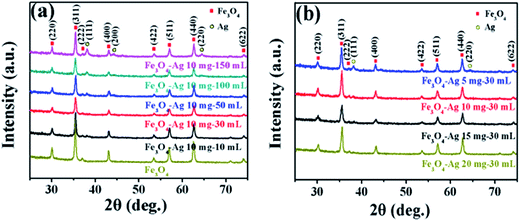
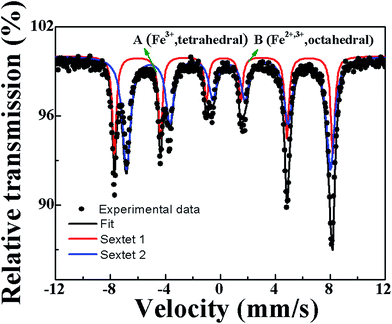
Fig. 2a and b presents XRD patterns of the pure Fe3O4 nanocrystals and the Fe3O4-Ag seeds nanocrystals with the different addition quantities of the silver seed colloids (Fe3O4-Ag 10 mg-10 mL, Fe3O4-Ag 10 mg-30 mL, Fe3O4-Ag 10 mg-50 mL, Fe3O4-Ag 10 mg-100 mL and Fe3O4-Ag 10 mg-150 mL) and the different addition quantities of the Fe3O4 nanocrystals (Fe3O4-Ag 5 mg-30 mL, Fe3O4-Ag 10 mg-30 mL, Fe3O4-Ag 15 mg-30 mL and Fe3O4-Ag 20 mg-30 mL), respectively. As for the pure Fe3O4 nanocrystals, all of the diffraction peaks can be indexed to the cubic spinel structured Fe3O4 (JCPDS card no. 65-3107) and no trace of other impurities is detected.39 Pawley refinement is selected to consider asymmetry correction to the whole diffraction peaks of pure Fe3O4 nanocrystals (shown in Fig. S1†). The residual Rwp of the sample is 10.93%, which is in good agreement with the standard pattern of the magnetite Fe3O4.Because the crystal structures of the magnetite Fe3O4 and the maghemite γ-Fe2O3 almost possess the same lattice constant and atomic arrangement, they have similar XRD patterns.40 In order to confirm that the formed phase is the magnetite Fe3O4 and not the maghemite γ-Fe2O3, the further characterization was used before attaching silver seeds to Fe3O4 nanocrystals. Mössbauer spectrum is an effective method to differentiate magnetite Fe3O4 from maghemite γ-Fe2O3. Mössbauer spectrum and the fitting curves of pure Fe3O4 nanocrystals are presented in Fig. 3, and the fitted Mössbauer parameters are listed in Table 1. The spectrum is fitted using two sextets. The acute and strong lines of the magnetic sextets show a double six-peak structure and testifies the presence of magnetite Fe3O4. The hyperfine field is 49.3 and 46.1 T, and the value of isomer shift is 0.230 and 0.600 mm s−1, which correspond to Fe3+ ions at site A (tetrahedral interstitial site) and Fe2+ and Fe3+ ions at site B (octahedral interstitial site), respectively. The result is in agreement with the result obtained by Zhang et al.41
| Composition | IS (mm s−1) | QS (mm s−1) | HIN (T) | HWHM (mm s−1) | AREA (%) |
|---|---|---|---|---|---|
| A | 0.230 | 0.034 | 49.3 | 0.179 | 34.1 |
| B | 0.600 | 0.002 | 46.1 | 0.355 | 65.9 |
For all the samples coated with silver seeds, besides the characteristic diffraction peaks corresponding to the Fe3O4, there also exist other three diffraction peaks indexed to the cubic Ag phase (JCPDS card no. 04-0783),42 which preliminarily illustrates that the silver seeds have attached to Fe3O4 surfaces. Fig. S2† displays UV-Vis absorption spectra of the as-prepared colloidal Ag solution (red curve line) and the Ag solution after immobilization on the Fe3O4@PEI-DTC nanocrystals after the magnetic separation (black curve line). The characteristic UV-Vis peak of the as-prepared colloidal Ag solution is observed at 403 nm.38 A broad full width at half maximum suggests the polydispersity of the silver seeds.43 The UV-Vis peak of the Ag solution after depositing onto the Fe3O4@PEI-DTC nanocrystals disappears, which indicates that almost all of the silver seeds are adsorbed effectively on the surfaces of the Fe3O4@PEI-DTC nanocrystals.
With the increase of the adding times of Ag seeds or the decrease of the additive amount of Fe3O4 nanocrystals, there is no obvious variation in the peak positions. But there is a noticeable enhancement in the intensity of Ag diffraction peaks, which indicates that the amount of Ag seeds deposited onto the surfaces of Fe3O4 nanoparticles can be adjusted by changing the adding times of Ag seeds or the additive amount of Fe3O4 nanocrystals.
3.2 Morphology of Fe3O4-Ag seeds nanocrystals
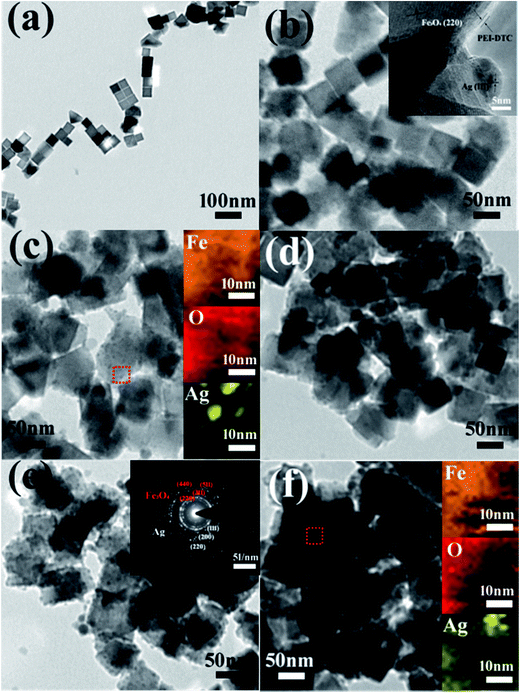
The morphology and detailed structure of the samples were characterized by SEM and TEM. Fig. 4 and S3† show typical low-magnification TEM and SEM images of the pure Fe3O4, Fe3O4-Ag 10 mg-10 mL, Fe3O4-Ag 10 mg-30 mL, Fe3O4-Ag 10 mg-50 mL, Fe3O4-Ag 10 mg-100 mL and Fe3O4-Ag 10 mg-150 mL nanocrystals. The shape of the pure Fe3O4 nanocrystals is cubic and the average particle size is about 50 nm. Histogram of the pure Fe3O4 nanocrystals from SEM image of Fig. S3a is shown in Fig. S4,† which indicates that the Fe3O4 nanocrystals have a narrow distribution of particle size. As is shown in Fig. 4b, silver seeds with average particle diameter of about 7 nm are uniformly located on the surfaces of Fe3O4 nanocrystals for the Fe3O4-Ag 10 mg-10 mL. The inset of Fig. 4b is the corresponding high-resolution TEM (HRTEM) image, which shows that the distinct lattice fringes with interplanar spacings of 0.290 and 0.235 nm well match the d-values indexed as the (220) plane of Fe3O4 and the (111) plane of Ag, respectively.44,45 A close observation reveals that the thin PEI-DTC shell layers with the thickness of about 2 nm form around the Fe3O4 nanocrystals. Selected area electron diffraction (SAED) pattern of Fe3O4-Ag 10 mg-100 mL is presented in the inset of Fig. 4e. The bright and discrete diffraction spots can be assigned to the diffractions of either Fe3O4 nanocrystals or silver seeds, and this result is consistent with that of the XRD pattern of Fe3O4-Ag 10 mg-100 mL. HRTEM and SAED results confirm the coexistence of Fe3O4 and Ag.46 In addition, with the increase of adding times of silver seeds, the amount of the silver seeds deposited on the surfaces of Fe3O4 nanocrystals significantly increases (Fig. 4c–f), which can be verified by their corresponding SEM images of Fig. S3.† Although the silver seeds are difficult to be distinguished in SEM images due to the small silver seeds sizes, the corresponding energy-dispersive spectroscopy (EDS) spectra (insets in Fig. S3†) demonstrate that Ag peaks increase when increasing the adding times of silver seeds. Similar results were observed by Zhong et al.47 EDS-mappings were applied to analyze the distributions of Fe, O and Ag atoms. The insets of Fig. 4c and f are the EDS elemental mapping images (Fe, O and Ag) of the corresponding red dash line square for Fe3O4-Ag 10 mg-30 mL and Fe3O4-Ag 10 mg-150 mL nanocrystals, respectively. The EDS maps not only impress us directly that the silver seeds are uniformly deposited on the surfaces of Fe3O4 nanoparticles, but further illustrate that the number of silver seeds on the Fe3O4 surfaces may be adjusted by changing the adding times of silver seeds.TEM and SEM images of the Fe3O4-Ag seeds nanocrystals with the different addition quantities of the Fe3O4 nanocrystals (Fe3O4-Ag 5 mg-30 mL, Fe3O4-Ag 10 mg-30 mL, Fe3O4-Ag 15 mg-30 mL and Fe3O4-Ag 20 mg-30 mL) are exhibited in Fig. 5 and S5.† It can be seen from Fig. 5 and S5,† the amount of silver seeds adhered to the surfaces of Fe3O4 nanocrystals decreases with the increase in the addition amount of the Fe3O4 nanocrystals. These results suggest that both the adding times of silver seeds and the additive quantity of Fe3O4 nanocrystals play critical roles in adjusting the amount of silver seeds attached on the Fe3O4 surfaces.
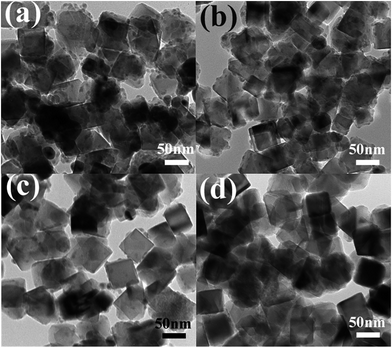 | ||
| Fig. 5 TEM images of Fe3O4-Ag 5 mg-30 mL (a), Fe3O4-Ag 10 mg-30 mL (b), Fe3O4-Ag 15 mg-30 mL (c) and Fe3O4-Ag 20 mg-30 mL (d). | ||
3.3 XPS studies of Fe3O4-Ag seeds nanocrystals
Surface analysis of the pure Fe3O4 nanocrystals and the Fe3O4-Ag seeds nanocrystals (Fe3O4-Ag 10 mg-10 mL, Fe3O4-Ag 10 mg-30 mL and Fe3O4-Ag 10 mg-150 mL) was carried out using XPS (Fig. 6 and S6†). With the exception of Fe, O, Ag and C peaks, no impurities are observed from the XPS survey scan spectra in Fig. S6.† The high resolution XPS spectrum of Fe 2p for the pure Fe3O4 nanocrystals shows two contributions, Fe 2p3/2 and Fe 2p1/2 (resulting from the spin–orbit splitting), locating at respectively 711.2 and 724.5 eV (Fig. 6a), which can be assigned to magnetite Fe3O4.48,49 In addition, the core level binding energy observed for Ag 3d5/2 and Ag 3d3/2 of the Fe3O4-Ag 10 mg-10 mL nanoparticles locates at 367.4 and 373.4 eV with a spin–orbit splitting of 6 eV between Ag 3d5/2 and Ag 3d3/2 (Fig. 6b), which matches well with the standard reference XPS spectrum of metallic Ag.50 It should be pointed out that the increase of adding times of silver seeds deposited onto the surfaces of Fe3O4 nanocrystals results in the shift of the Fe 2p peaks to lower binding energy and the simultaneously opposing changes of Ag 3d peaks, which demonstrates an electronic exchange interaction between Fe3O4 nanocrystals and Ag seeds.51 Another interesting finding is that the intensity of Fe 2p peaks become weaker, whereas that of Ag 3d peaks become stronger with the increase of the adding times of Ag seeds, indicating the increase in the number of silver seeds on the Fe3O4 surfaces.52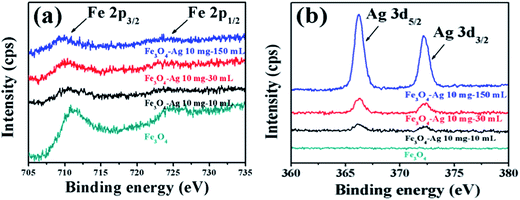 | ||
| Fig. 6 High resolution XPS scans of Fe 2p (a) and Ag 3d (b) for pure Fe3O4, Fe3O4-Ag 10 mg-10 mL, Fe3O4-Ag 10 mg-30 mL and Fe3O4-Ag 10 mg-150 mL. | ||
3.4 Magnetism of Fe3O4-Ag seeds nanocrystals
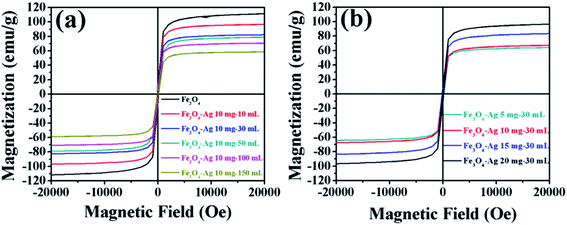
The effects of the number of silver seeds deposited on the surfaces of the magnetic properties of Fe3O4 nanocrystals were also investigated. Fig. 7a and b show the magnetization versus magnetic field (M–H) loops of the pure Fe3O4 nanocrystals and the Fe3O4-Ag seeds nanocrystals with the different addition quantities of the silver seed colloids and the different addition quantities of the Fe3O4 nanocrystals, respectively. All the samples exhibit the superparamagnetic behavior without the obvious observation of the coercivity and the remanence. Magnetic saturation (Ms) value of the pure Fe3O4 nanocrystals is 110.5 emu g−1. It is noticed that the Ms value linearly decreases with the increase of the addition quantity of the silver seed colloids or the decrease of the addition quantity of the Fe3O4 nanocrystals. The decrease of Ms value may be attributed to the increase of the mass owing to the adherence of silver seeds on the surfaces of the Fe3O4 nanocrystals53 or the interaction between Fe3O4 nanocrystals and silver seeds.54 Even if Ms value decreases to 59.1 emu g−1 for the Fe3O4-Ag 10 mg-150 mL and 63.6 emu g−1 for Fe3O4-Ag 10 mg-30 mL, the samples still have the strong magnetic responsivity and can be magnetically separated easily from aqueous solution by imparting an external magnetic field, which renders them economic and reusable for various applications.The temperature-dependent magnetization (M–T) of pure Fe3O4 and Fe3O4-150 mL Ag was measured under zero-field-cooled (ZFC) and 1000 Oe field-cooled (FC) conditions (Fig. S7†). The magnetic characterization was carried out in the temperature range of 10 K to 300 K. In the ZFC process, the samples were cooled down from room temperature to 10 K in the absence of an external magnetic field, and the magnetic data were acquired during the warming run in a constant external field (1000 Oe). In the FC measurements, the samples were initially cooled down to 10 K in the presence of 1000 Oe magnetic field and the FC data were recorded during the warm-up cycle in the same magnetic field. Typical ZFC-FC magnetization curves of superparamagnetic results are observed. From the maximum of the ZFC curve, the blocking temperature (TB) of pure Fe3O4 and Fe3O4-Ag 10 mg-150 mL is 112 and 99 K, respectively. Generally, TB value is determined by the particle size and the magnetic interaction between the particles.55,56 It is rational to eliminate the contribution of the Fe3O4 particle size to the shift of the peak of the ZFC magnetization curve in our experiment. Therefore, it is apparent that the silver seeds attached on the Fe3O4 surface disrupt the magnetic coupling between adjacent Fe3O4 nanocrystals and lead to the slight decrease of TB value.57
3.5 Catalytic studies of Fe3O4-Ag seeds nanocrystals
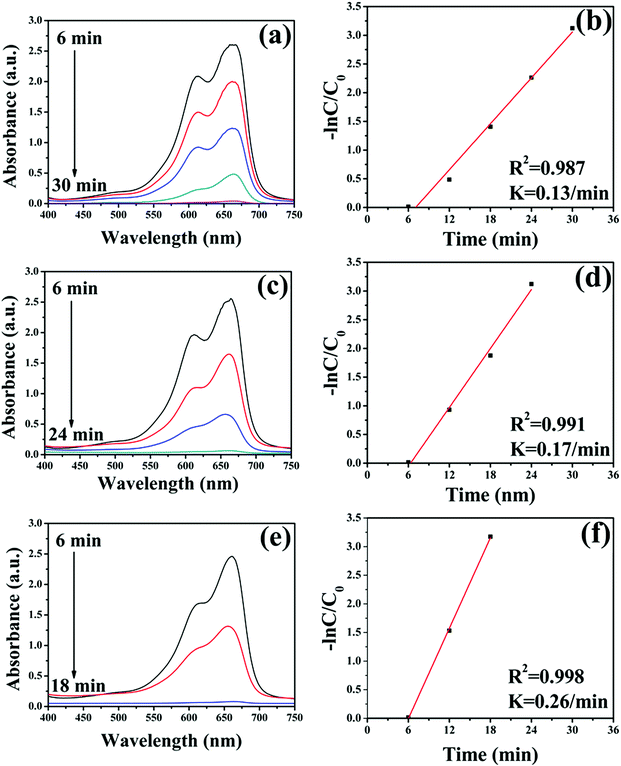
The application in the field of catalysis is an important applied aspect of nanomaterials.58–63 To investigate the catalytic performance of the Fe3O4-Ag seeds nanocrystals to organic dyes, the MB was chosen as a core sample. The changes in UV-Vis absorption spectra of MB aqueous solution over time catalyzed by the different Fe3O4-Ag seeds nanocrystals are shown in Fig. 8. The intensity of the typical absorption peaks at 665 nm shows a decreasing trend and disappears completely after 30, 24 and 18 min for Fe3O4-Ag 10 mg-10 mL, Fe3O4-Ag 10 mg-50 mL and Fe3O4-Ag 10 mg-100 mL, respectively.64 This indicates the catalytic reduction and the complete removing of MB has been achieved by the Fe3O4-Ag seeds nanocrystals, which can be verified by the color variation of MB over time from blue to colorless (Fig. S8†). The pseudo first order kinetics was applied to study the rate constants of MB.65 The concentration of MB at time t is denoted as C, and the initial concentration of MB at t = 0 is regarded as C0. The C/C0 is obtained from the relative intensity of absorption. The linear relationship of ln(C/C0) versus reaction time represents that the reduction of MB by the Fe3O4-Ag seeds nanocrystals matches well with the pseudo first order kinetics. The correlation coefficients R2 are all higher than 0.9 and the rate constants of MB are 0.13 min−1, 0.17 min−1 and 0.26 min−1 for Fe3O4-Ag 10 mg-10 mL, Fe3O4-Ag 10 mg-50 mL and Fe3O4-Ag 10 mg-100 mL, respectively. It is worthy to note that the calculated rate constant is much higher than those previously reported values for the degradation of MB by using semiconductor photocatalysts,66–68 moreover, the rate constant for the Fe3O4-Ag seeds nanocrystals is significantly higher than the previous works by utilizing noble metal catalysts.69–71It can been noticed that the time required to catalytic reduce decreases with the increase of the amount of silver seeds deposited on the Fe3O4 surfaces. It is generally accepted that the catalytic reaction of silver nanocrystals occurs through electron transfer.72 The electrochemical mechanism that the nucleophilic BH4− ions donate electrons to electrophilic organic MB through silver seeds is proposed. Therefore, the increase of the number of silver seeds immobilized on the surfaces of Fe3O4 nanocrystals supplies more opportunities to the catalytic reaction of MB, resulting in the increase of reduction rate of MB.
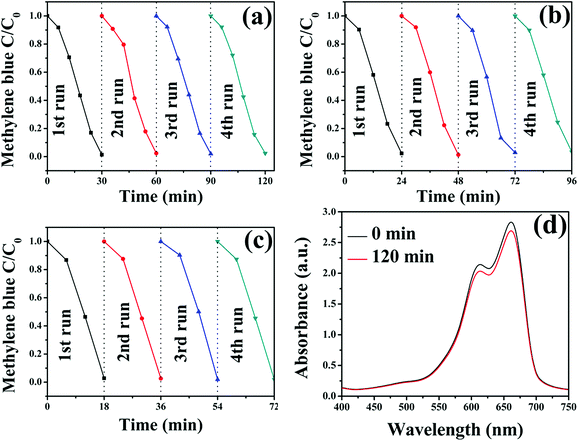
In order to test the reusability of the Fe3O4-Ag seeds nanocrystals, the catalytic reaction experiments of MB with the same sample were repeated for four times. As is shown in Fig. 9, the catalytic reaction ability of all the samples maintains almost consistent even after at least four circles, which demonstrates that these Fe3O4-Ag seeds nanocrystals can serve as recyclable catalysts for organic dyes. For the purpose of comparison, it can be observed that no significant change occurred in the reduction of MB even after 120 min in the presence of the pure Fe3O4 nanocrystals only (Fig. 9d).
4. Conclusions
In this study, magnetically retrievable Fe3O4-Ag seeds nanocrystals were successfully synthesized through a novel seed deposition process. XRD, TEM and SEM results indicate that the adding times of silver seeds or the additive amount of Fe3O4 nanocrystals is essential to control the number of silver seeds deposited on the modified surfaces of Fe3O4 nanocrystals. The increase of the number of silver seeds attached to the Fe3O4 nanocrystals surfaces results in the shift of the Fe 2p peaks to lower binding energy and the simultaneously opposing changes of Ag 3d peaks due to the enhancement of the electronic exchange interaction between Fe3O4 nanocrystals and Ag seeds. Although the silver seeds decrease the Ms value and TB value, Fe3O4-Ag seeds nanocrystals can be easily separated by applying a magnetic field. The time required to catalytic reduce to MB decreases with the increase of the amount of silver seeds deposited on the Fe3O4 surfaces. The catalytic reaction ability of Fe3O4-Ag seeds nanocrystals is almost consistent even after at least four circles, demonstrating that the Fe3O4-Ag seeds nanocrystals can serve as recyclable catalysts for MB. Therefore, this newly synthesized Fe3O4-Ag seeds nanocrystals can be promising nanocatalysts for the reduction of the organic dyes during the wastewater treatment.Conflicts of interest
There are no conflicts to declare.Acknowledgements
This work was supported by the National Natural Science Foundation of China (Grant Numbers 21676115, 51609100, 61575080, 61405072, 61675090 and 21546013); Program for the development of Science and Technology of Jilin Province (Grant Numbers 20160101287JC, 20150520015JH, 20150519024JH and 20140519003JH); and Technology of Education Department of Jilin Province (Grant Number JJKH20170374KJ).References
- A. L. Antaris, H. Chen, S. Diao, Z. Ma, Z. Zhang, S. Zhu, J. Wang, A. X. Lozano, Q. Fan, L. Chew, M. Zhu, K. Cheng, X. Hong, H. Dai and Z. Cheng, Nat. Commun., 2017, 8, 15269 CrossRef CAS PubMed.
- A. Venkateswararao, K. R. J. Thomas, C.-P. Lee, C.-T. Li and K.-C. Ho, ACS Appl. Mater. Interfaces, 2014, 6, 2528 CAS.
- S. P. Pitre, C. D. McTiernan and J. C. Scaiano, ACS Omega, 2016, 1, 66 CrossRef CAS.
- C. O'Neill, F. R. Hawkes, D. L. Hawkes, N. D. Lourenço, H. M. Pinheiro and W. Delée, J. Chem. Technol. Biotechnol., 1999, 74, 1009 CrossRef.
- T. Zhu, J. S. Chen and X. W. Lou, J. Phys. Chem. C, 2012, 116, 6873 CAS.
- Y. Zhang, Y. Yan, J. Wang and J. Huang, RSC Adv., 2016, 6, 33295 RSC.
- X. He, K. B. Male, P. N. Nesterenko, D. Brabazon, B. Paull and J. H. T. Luong, ACS Appl. Mater. Interfaces, 2013, 5, 8796 CAS.
- M. Massaro, C. G. Colletti, G. Lazzara, S. Guernelli, R. Noto and S. Riela, ACS Sustainable Chem. Eng., 2017, 5, 3346 CrossRef CAS.
- X. Meng, P. Yao, Y. Xu, H. Meng and X. Zhang, RSC Adv., 2016, 6, 61920 RSC.
- H. Hu, J. H. Xin, H. Hu, X. Wang, D. Miao and Y. Liu, J. Mater. Chem. A, 2015, 3, 11157 CAS.
- S. G. Kumar and K. S. R. K. Rao, RSC Adv., 2015, 5, 3306 RSC.
- A. Ajmal, I. Majeed, R. N. Malik, H. Idriss and M. A. Nadeem, RSC Adv., 2014, 4, 37003 RSC.
- M. B. Gawande, A. Goswami, T. Asefa, H. Guo, A. V. Biradar, D.-L. Peng, R. Zboril and R. S. Varma, Chem. Soc. Rev., 2015, 44, 7540 RSC.
- X. Liu, J. Iocozzia, Y. Wang, X. Cui, Y. Chen, S. Zhao, Z. Li and Z. Lin, Energy Environ. Sci., 2017, 10, 402 CAS.
- Z. Lu, Z. Zhu, D. Wang, Z. Ma, W. Shi, Y. Yan, X. Zhao, H. Dong, L. Yang and Z. Hua, Catal. Sci. Technol., 2016, 6, 1367 CAS.
- Y. Hua, S. Wang, J. Xiao, C. Cui and C. Wang, RSC Adv., 2017, 7, 28979 RSC.
- J. Polte, CrystEngComm, 2015, 17, 6809 RSC.
- T. Yao, T. Cui, H. Wang, L. Xu, F. Cui and J. Wu, Nanoscale, 2014, 6, 7666 RSC.
- Y. Wang, H. Li, J. Zhang, X. Yan and Z. Chen, Phys. Chem. Chem. Phys., 2016, 18, 615 RSC.
- Z. Lu, X. Zhao, Z. Zhu, Y. Yan, W. Shi, H. Dong, Z. Ma, N. Gao, Y. Wang and H. Huang, Chem.–Eur. J., 2015, 21, 18528 CrossRef PubMed.
- Z. Lu, F. Chen, M. He, M. Song, Z. Ma, W. Shi, Y. Yan, J. Lan, F. Li and P. Xiao, Chem. Eng. J., 2014, 249, 15 CrossRef CAS.
- M. M. Ayad, W. A. Amer, M. G. Kotp, I. M. Minisy, A. F. Rehab, D. Kopecký and P. Fitl, RSC Adv., 2017, 7, 18553 RSC.
- M. Massaro, C. G. Colletti, G. Lazzara, S. Milioto, R. Noto and S. Riela, J. Mater. Chem. A, 2017, 5, 13276 CAS.
- M. Svedendahl, R. Verre and M. Kall, Light: Sci. Appl., 2014, 3, e220 CrossRef CAS.
- T. Pulli, T. Donsberg, T. Poikonen, F. Manoocheri, P. Karha and E. Ikonen, Light: Sci. Appl., 2015, 4, e332 CrossRef CAS.
- Z. Zhu, B. Bai, O. You, Q. Li and S. Fan, Light: Sci. Appl., 2015, 4, e296 CrossRef CAS.
- P. Wang, Y. Wang and L. Tong, Light: Sci. Appl., 2013, 2, e102 CrossRef.
- C. Ray and T. Pal, J. Mater. Chem. A, 2017, 5, 9465 CAS.
- Y. Xie, B. Yan, H. Xu, J. Chen, Q. Liu, Y. Deng and H. Zeng, ACS Appl. Mater. Interfaces, 2014, 6, 8845 CAS.
- M. Amir, S. Güner, A. Yıldız and A. Baykal, J. Magn. Magn. Mater., 2017, 421, 462 CrossRef CAS.
- D. D. Wang, G. Z. Xing, F. Yan, Y. S. Yan and S. Li, Appl. Phys. Lett., 2014, 104, 022412 CrossRef.
- B. Fazio, P. Artoni, M. Antonia Iati, C. D'Andrea, M. J. Lo Faro, S. Del Sorbo, S. Pirotta, P. Giuseppe Gucciardi, P. Musumeci, C. Salvatore Vasi, R. Saija, M. Galli, F. Priolo and A. Irrera, Light: Sci. Appl., 2016, 5, e16062 CrossRef CAS.
- G. Z. Xing, Y. Wang, J. I. Wong, Y. M. Shi, Z. X. Huang, S. Li and H. Y. Yang, Appl. Phys. Lett., 2014, 105, 143905 CrossRef.
- Y. Huang, Y. Fang, Z. Zhang, L. Zhu and M. Sun, Light: Sci. Appl., 2014, 3, e199 CrossRef CAS.
- G. Z. Xing, D. D. Wang, C. J. Cheng, M. He, S. Li and T. Wu, Appl. Phys. Lett., 2013, 103, 022402 CrossRef.
- Q. D. Xia, S. S. Fu, G. J. Ren, F. Chai, J. J. Jiang and F. Y. Qu, New J. Chem., 2016, 40, 818 RSC.
- Y. Liu, Q. Kou, D. Wang, L. Chen, Y. Sun, Z. Lu, Y. Zhang, Y. Wang, J. Yang and S. G. Xing, J. Mater. Sci., 2017, 52, 10163 CrossRef CAS.
- N. Dasgupta, S. Ranjan, B. Rajendran, V. Manickam, C. Ramalingam, G. S. Avadhani and A. Kumar, Environ. Sci. Pollut. Res., 2016, 23, 4149 CrossRef CAS PubMed.
- Y. Yin, M. Zeng, J. Liu, W. Tang, H. Dong, R. Xia and R. Yu, Sci. Rep., 2016, 6, 25075 CrossRef CAS PubMed.
- J. Park, K. An, Y. Hwang, J.-G. Park, H.-J. Noh, J.-Y. Kim, J.-H. Park, N.-M. Hwang and T. Hyeon, Nat. Mater., 2004, 3, 891 CrossRef CAS PubMed.
- X. Zhang, X. Wang, L. Le, A. Ma and S. Lin, J. Mater. Chem. A, 2015, 3, 19273 CAS.
- Y. Zhao, C. Tao, G. Xiao, G. Wei, L. Li, C. Liu and H. Su, Nanoscale, 2016, 8, 5313 RSC.
- S. Agnihotri, S. Mukherji and S. Mukherji, RSC Adv., 2014, 4, 3974 RSC.
- Y. Zhang, M. Liu, L. Zhang, Z. Zhou, B. Peng, C. Wang, Q. Lin, Z.-D. Jiang, W. Ren and Z.-G. Ye, Appl. Phys. Lett., 2017, 110, 082902 CrossRef.
- A. A. AbdelHamid, M. A. Al-Ghobashy, M. Fawzy, M. B. Mohamed and M. M. S. A. Abdel-Mottaleb, ACS Sustainable Chem. Eng., 2013, 1, 1520 CrossRef CAS.
- J. H. Yang, Q. W. Kou, Y. Liu, D. D. Wang, Z. Y. Lu, L. Chen, Y. Y. Zhang, Y. X. Wang, Y. J. Zhang, D. L. Han and S. Xing, Powder Technol., 2017, 319, 53 CrossRef CAS.
- Y. Zhong, Y. Ni, S. Li and M. Wang, RSC Adv., 2016, 6, 15831 RSC.
- Q. D. Xia, S. S. Fu, G. J. Ren, F. Chai, J. J. Jiang and F. Y. Qu, RSC Adv., 2016, 6, 55248 RSC.
- A. Maleki, H. Movahed, P. Ravaghi and T. Kari, RSC Adv., 2016, 6, 98777 RSC.
- Q. J. Du, L. F. Tan, B. Li, T. L. Liu, J. Ren, Z. B. Huang, F. Q. Tang and X. W. Meng, RSC Adv., 2014, 4, 56057 RSC.
- D.-H. Yu, X. Yu, C. Wang, X.-C. Liu and Y. Xing, ACS Appl. Mater. Interfaces, 2012, 4, 2781 CAS.
- J. Ma, K. Wang and M. Zhan, ACS Appl. Mater. Interfaces, 2015, 7, 16027 CAS.
- L. Sun, J. He, S. An, J. Zhang, J. Zheng and D. Ren, Chin. J. Catal., 2013, 34, 1378 CrossRef CAS.
- Q. Wang, Y. J. Li, B. C. Liu, Q. Dong, G. G. Xu, L. Zhang and J. Zhang, J. Mater. Chem. A, 2015, 3, 139 CAS.
- V. Victor, M. Laura, M. Eva, M. Nieves, H. Pilar, H. Antonio and C. Patricia, J. Phys. D: Appl. Phys., 2015, 48, 035502 CrossRef.
- L. Kwan, J. Jung-tak, N. Hiroshi, N. Shigeki, P. Sun Ha and B. Seongtae, Nanotechnology, 2017, 28, 075710 CrossRef PubMed.
- M. Freitas, M. Sá Couto, M. F. Barroso, C. Pereira, N. de-los-Santos-Álvarez, A. J. Miranda-Ordieres, M. J. Lobo-Castañón and C. Delerue-Matos, ACS Sens., 2016, 1, 1044 CrossRef CAS.
- M. Ranjani, Y. Sathishkumar, Y. S. Lee, D. J. Yoo, A. R. Kim and G. G. kumar, RSC Adv., 2015, 5, 57804 RSC.
- N. Senthilkumar, G. G. kumar and A. Manthiram, Adv. Energy Mater., 2017, 1702207 CrossRef.
- J. Salamon, Y. Sathishkumar, K. Ramachandran, Y. S. Lee, D. J. Yoo, A. R. Kim and G. G. kumar, Biosens. Bioelectron., 2015, 64, 269 CrossRef CAS PubMed.
- H. P. Jing, C. C. Wang, Y. W. Zhang, P. Wang and R. Li, RSC Adv., 2014, 4, 54454 RSC.
- G. G. Kumar, G. Amala and S. M. Gowtham, RSC Adv., 2017, 7, 36949 RSC.
- V. B. Nguyen, A. D. Nguyen, Q. V. Nguyen and S. L. Wang, Res. Chem. Intermed., 2017, 43, 259 CrossRef CAS.
- Y. Qin, J. Xiong, W. Zhang, L. Liu, Y. Cui and H. Gu, J. Mater. Sci., 2015, 50, 5865 CrossRef CAS.
- T. Chen, Y. Xiong, Y. Qin, H. Yang, P. Zhang and F. Ye, RSC Adv., 2017, 7, 336 RSC.
- C. Yang, W. Dong, G. Cui, Y. Zhao, X. Shi, X. Xia, B. Tang and W. Wang, RSC Adv., 2017, 7, 23699 RSC.
- X. Shao, W. Lu, R. Zhang and F. Pan, Sci. Rep., 2013, 3, 3018 CrossRef PubMed.
- A. Balcha, O. P. Yadav and T. Dey, Environ. Sci. Pollut. Res., 2016, 23, 25485 CrossRef CAS PubMed.
- C. Karunakaran and P. Vinayagamoorthy, New J. Chem., 2016, 40, 1845 RSC.
- T. A. Devi, N. Ananthi and T. P. Amaladhas, J. Nanostruct. Chem., 2016, 6, 75 CrossRef CAS.
- M. Wu, Y. Li, R. Yue, X. Zhang and Y. Huang, Sci. Rep., 2017, 7, 42773 CrossRef CAS PubMed.
- M. X. Hu, Q. Guo, J. N. Li, C. M. Huang and G. R. Ren, New J. Chem., 2017, 41, 6076 RSC.
Footnotes |
| † Electronic supplementary information (ESI) available: Pawley refinement and size distribution histogram of the XRD pattern of the pure Fe3O4; UV-Vis spectra of the as-prepared colloidal Ag solution and the Ag solution after immobilization on the Fe3O4@PEI-DTC nanocrystals after the magnetic separation; SEM images of Fe3O4, Fe3O4-Ag 10 mg-10 mL, Fe3O4-Ag 10 mg-30 mL, Fe3O4-Ag 10 mg-50 mL, Fe3O4-Ag 10 mg-100 mL, Fe3O4-Ag 10 mg-150 mL, Fe3O4-Ag 5 mg-30 mL, Fe3O4-Ag 15 mg-30 mL and Fe3O4-Ag 20 mg-30 mL; XPS survey scan spectra of pure Fe3O4, Fe3O4-Ag 10 mg-10 mL, Fe3O4-Ag 10 mg-30 mL and Fe3O4-Ag 10 mg-150 mL; ZFC and FC curves of pure Fe3O4 and Fe3O4-Ag 10 mg-150 mL; color variation of MB over time catalyzed by Fe3O4-Ag 10 mg-100 mL. See DOI: 10.1039/c7ra11348j |
| ‡ The authors have the equal contribution to the manuscript. |
| This journal is © The Royal Society of Chemistry 2018 |

