
 Open Access Article
 This Open Access Article is licensed under a Creative Commons Attribution-Non Commercial 3.0 Unported Licence
Study of structural, optical and magnetic properties of cobalt doped ZnO nanorods
Anupama Chanda *a,
Shipra Guptab,
M. Vasundhara*c,
Shalik R. Joshid,
Geeta R. Muttae and
Jai Singh*a
*a,
Shipra Guptab,
M. Vasundhara*c,
Shalik R. Joshid,
Geeta R. Muttae and
Jai Singh*a
aDepartment of Physics, Dr Harisingh Gour Central University, Sagar, M.P-470003, India. E-mail: anupamamatsc@gmail.com; jai.bhu@gmail.com
bIndian Institute of Technology (BHU), Varanasi, Uttar Pradesh-221005, India
cCSIR-National Institute for Interdisciplinary Science and Technology, Trivandrum-695 019, Kerala, India. E-mail: mvas@niist.res.in
dInstitute of Physics, Bhubaneswar, Odisha-751005, India
eNano-Materials Laboratory, School of Engineering and Physical Sciences, Heriot Watt University, Edinburgh EH14 4AS, UK
First published on 3rd November 2017
Abstract
Cobalt doped zinc oxide nanoparticles (NPs) and nanorods (NRs) were synthesized by a simple chemical method. An increase in the formation of nanorods with an increase in cobalt doping is found to occur from scanning electron microscopy and transmission electron microscopy studies. Powder X-ray diffraction, high-resolution transmission electron microscopy, and selected area electron diffraction confirm the formation of a wurtzite crystal structure of ZnO. Shifting and broadening of the bands at 437 cm−1 and 579 cm−1 in the micro-Raman study of Co-doped ZnO nanostructures indicates the incorporation of Co in ZnO. Shifting of the absorption edge to lower wavelength and blue shift of the band gap is observed in UV-visible spectra of Co-doped ZnO samples. Field-dependent magnetization measurements exhibit diamagnetic behavior down to 2 K in the case of ZnO whereas Co-doped ZnO samples show coexistence of superparamagnetic and ferromagnetic behavior at room temperature and at 2 K. The observed ferromagnetism may have originated due to the exchange interaction between the localized d electrons in Co2+ atoms and free carriers generated due to Co-doping as well as due to cobalt clustering in the Co-doped samples.
Introduction
There has been an increasing interest in utilizing carrier spin along with charge to develop a new class of devices like spin light-emitting diodes (spin-LEDs), spin field effect transistors (spin-FET) and spin qubits for quantum computers and spin-based memory devices like MRAM etc.1–4 Diluted magnetic semiconductors (DMS)5 formed by doping a semiconductor with a small concentration of transition metals, have attracted considerable attention due to their possible applications in spintronics6 devices in which both spin and charge of the electrons can be used and have the potential for various technological advancements like non-volatility, increased data processing speed, decreased electronic power consumption and increased integration densities as compared to the conventional semiconductor devices. The realization of such DMS is still a widely discussed issue due to the questionable magnetic behavior of the material. Among them Mn-doped II–V and III–V compound semiconductors have been extensively studied. For data storage room temperature ferromagnetism is one of the key parameters. One of the major challenges for semiconductor spintronics devices is to develop suitable magnetic semiconducting materials that will effectively allow spin-polarized carriers to be injected, transported, and manipulated.A lot of research has been done on diluted magnetic semiconductors based on II–VI semiconductors such as CdMnTe and ZnMnSe7–9 in which the valence of the cation matches with common magnetic ions such as Mn. Although it is easy to prepare such materials, it is difficult to make p- or n-type II–VI based DMS, which make these materials less attractive for applications. After discovery of the hole induced ferromagnetic order in p-type InMnAs10 and GaMnAs,11 a lot of studies have been carried out on III–V based DMS system12–17 but unfortunately room temperature ferromagnetism could not be observed in GaMnAs. Since then a large number of efforts has been carried out to find the possibility of room temperature ferromagnetism in III–V based DMS such as GaN, GaSb, InAs18–21 and oxide-based DMS such as ZnO, TiO2, SnO2, In2O3 etc.22–29
Zinc oxide (ZnO), a direct and wide band gap (3.37 eV) II–VI oxide semiconductor has high exciton binding energy (nearly 60 meV at room temperature), good transparency and long term stability.30,31 It has been given due importance because of its excellent optoelectronic, sensing and piezoelectric properties.32 It finds various technological applications like sensors, light emitting diodes, lasers, solar cells, resistive switching devices, photocatalysts and most recently in spintronics, etc.33–42 It has strong room temperature luminescence properties like ZnS nanoparticles43 but the luminescence efficiency can be enhanced by using ZnO/ZnS nanocomposites44 or core shell of ZnS:Mn/ZnO nanocrystals.45 ZnO is biocompatible and has been used as good antibacterial agent as well.46 After the theoretical prediction of Dietl et al.47 about the room temperature ferromagnetism of GaN and ZnO thin films, Lin et al.48 experimentally demonstrated room temperature ferromagnetism in Co-doped ZnO thin films. Optical properties such as absorption and photoluminescence can enhance the understanding of the mechanisms of high temperature ferromagnetism in transition metal doped ZnO. As a dopant, Co is able to modulate both the optical and magnetic behavior of ZnO due to its abundant electron states.49 Its ionic radius as well as its divalent state ensures a high solubility in ZnO50 due to which it has been widely used for tuning the optical as well as the magnetic behavior of ZnO. According to the ab initio calculations by Sato and Yoshida51 antiferromagnetism is stable in Mn-doped ZnO while ferromagnetism is stable in other transition metal doped ZnO (V, Cr, Fe, Co, Ni). Although several experimental investigations have shown room temperature ferromagnetism in Co-doped ZnO,52–55 still there is a lack of clear explanations regarding the origin of ferromagnetism. Various techniques like sol–gel, hydrothermal, chemical synthesis, chemical vapor deposition, thermal evaporation, etc.56–60 have been used for the production of Co-doped ZnO nanoparticles as well as thin films. It has been observed that magnetic behavior of the materials varies due to variation in growth synthesis and dimensionality.61 Both intrinsic parameters like oxygen vacancy, Zn interstitial and extrinsic parameters like magnetic clusters or separate phase formation have been observed to be responsible for different kind of magnetic behaviour.62–65 Several studies have reported on the grain boundary defect mediated ferromagnetism in Co-doped films.66–69 Recently, Aravindh et al. predicted room temperature ferromagnetism arising due to exchange coupling of a pair of Co atoms at the grain boundary, a new observation based on first-principle calculations.69 Numerous studies have been done on the behavior of Co-doped ZnO thin films and nanoparticles, but one dimensional DMS materials are not widely reported.70–73 Li et al.74 observed that enhancement in ferromagnetism in Co-doped ZnO films was correlated to the degree of orientation of the films while a high degree of c-axis orientation is desirable in Co-doped ZnO nanorods to optimize the magnetic behavior. Liu et al.75 studied photoluminescence behavior of vertically aligned Zn1−xCoxO nanorods grown by hydrothermal route while Cui et al.76 reported the magnetic behavior of Zn1−xCoxO nanorods. Although there are several reports on the synthesis of nanoparticles (NPs) by wet chemical route, there are very few reports on the formation of nanorods (NRs) without using any substrate/seed layer by this method.55,60,65,77 The present study investigates the structural, optical and magnetic behavior of pure and Co-doped ZnO NPs as well as NRs synthesized by a simple, low-cost chemical method.
Experimental details
Synthesis of un-doped and Co-doped (5 at%, 10 at%) ZnO nanostructures were carried out using zinc chloride (ZnCl2), sodium hydroxide (NaOH) and cobalt chloride (CoCl2) as the starting materials. Zinc chloride was first dissolved in 50 ml of distilled water, and after complete dissolution of ZnCl2, some amount of NaOH solution (dissolved in 50 ml distilled water) was added under constant stirring drop by drop (during this period calculated amount of cobalt chloride (CoCl2·6H2O) was added for cobalt doping). The reaction was allowed to proceed for two hours at room temperature. After complete addition of NaOH into the solution of ZnCl2, the solid and the solution phases were separated by the centrifugation process and then the solid was washed with distilled water several times to make that free of salt and at the end with ethanol to absorb all the water molecules present in that solid solution. A white color solid was obtained which was dried at 800 °C for 24 hours and then grinded for the uniformities of the powder (NPs/NRs). The crystal structure and phase purity of the powdered samples were analyzed by X-ray powder diffraction (XRD) technique (PANalytical-Empyrean Diffractometer) using Cu Kα radiation of wavelength 1.5404 Å and scanning size of 0.01° from 15° ≤ θ ≤ 100°. Rietveld refinement of the diffraction patterns was carried out using the Fullprof software. The morphologies of the NPs and NRs were investigated by scanning electron microscope (SEM, (JEOL-SEM 5601v, Tokyo, Japan)) and transmission electron microscope, (TEM, (FEI Tecnai F20, operated at 300 kV)) and the crystal planes were found out from selected area electron diffraction (SAED) pattern. Micro-Raman scattering study was carried out with 514 nm laser in backscattering geometry on a T64000 triple monochromator Horiba Jobin Yvon system having a liquid nitrogen cooled CCD detector. A Shimadzu (model UV2401) UV-visible-spectrophotometer coupled with an integrating sphere was used for performing UV-visible absorbance measurements. An excitation wavelength of 325 nm from a xenon lamp of Varian fluorescence spectrometer (Fluorolog Jobin Yvon, Horiba, JAPAN) was employed to study the steady-state photoluminescence (PL) properties. Magnetic measurements of the samples were made as a function of temperature and applied field using a vibrating sample magnetometer attached to a physical property measurement system supplied by Quantum Design Inc., USA.Results and discussion
The morphology of the samples was studied by scanning electron microscope. Fig. 1(a–c) shows SEM image and the corresponding EDS pattern (d, e and f) taken on ZnO, 5% and 10% Co-doped ZnO samples respectively. Nanoparticles can be clearly seen in ZnO samples while 5% Co-doped sample shows few nanorods along with nanoparticles and large number of nanorods can be seen in 10% Co-doped sample. SEM analysis shows increase in nanorods formation with increase in cobalt doping concentration which is discussed more in TEM section analysis. Elemental analysis was done by EDS which shows presence of zinc and oxygen in ZnO powder while Co-doped ZnO samples show presence of cobalt along with zinc and oxygen. Energy-dispersive X-ray spectroscopy analysis confirms the presence of Co in ZnO matrix.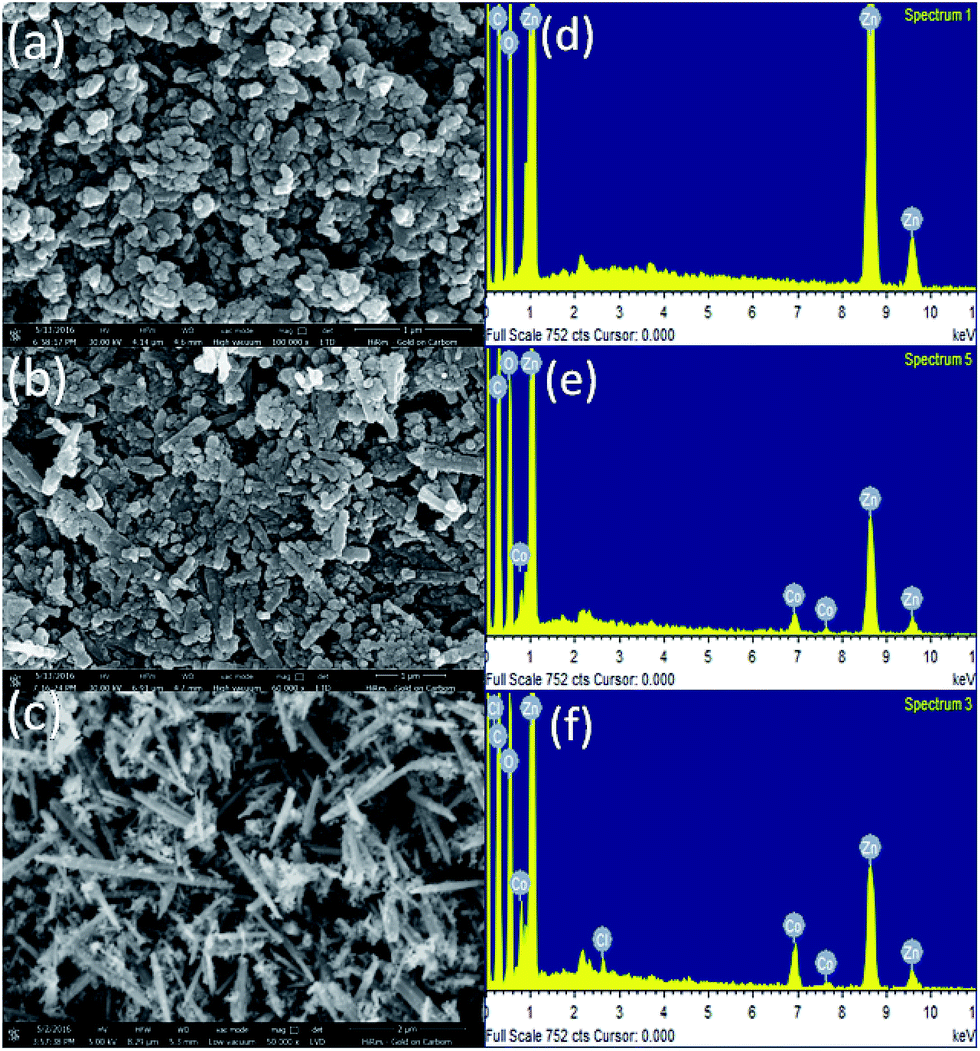 | ||
| Fig. 1 SEM images of (a) ZnO (b) ZnO–5% Co (c) ZnO–10% Co (d) EDS taken on ZnO, (e) ZnO–5% Co (f) ZnO–10% Co with proper indexing. | ||
To further elucidate the size and structures of nanoparticles and nanorods TEM was carried out. Fig. 2 shows the TEM image of all the samples. Fig. 2(a) indicates the TEM image of un-doped ZnO nanoparticles of sizes varying from 22 to 28 nm. The varying size is due to agglomeration of particles. NRs of sizes 60–80 nm diameter and length 400–500 nm can be seen in 5% and 10% Co-doped ZnO samples (Fig. 2(b and c)). It can be seen that with increasing Co concentration the density of NRs has been increased which are thought to be due to participation of more Co atoms in producing NRs. It can be inferred that ZnO sample shows nearly spherical shaped NPs while 5% Co doped sample shows NRs along with irregular shaped particles and high concentration (10%) Co-doped sample produces large number of NRs. The difference of the crystal growth velocities in different directions causes changes in surface morphology. In ZnO, c-axis exhibits the highest growth rate due to the structure and surface anisotropy.77 The addition of Co ion in precursor solution induces thermodynamic barrier,65,78 which slows down the nucleation as well as the growth rate of primary nuclei. The effective ions have more time to deposit uniformly on the nuclei along the c-axis. So, the growth along c-axis direction has a faster rate than that along other directions due to which aspect ratio of Co doped ZnO nanorods increases as well as there is increase in the density of NRs with more dopant incorporation. From HRTEM image of 5% and 10% Co-doped samples the d-spacing of the crystal plane is found out to be of 0.271 and 0.269 nm respectively which corresponds (200) plane of hexagonal wurtzite structure. From this it can be inferred that the nanorod growth takes place along the c-axis i.e. along (200) as shown by the arrow in Fig. 2(d and e) for 5% and 10% doped samples. It has been observed that Co doping plays an important role in producing nanorods of different sizes which is in corroboration with the earlier reports.77
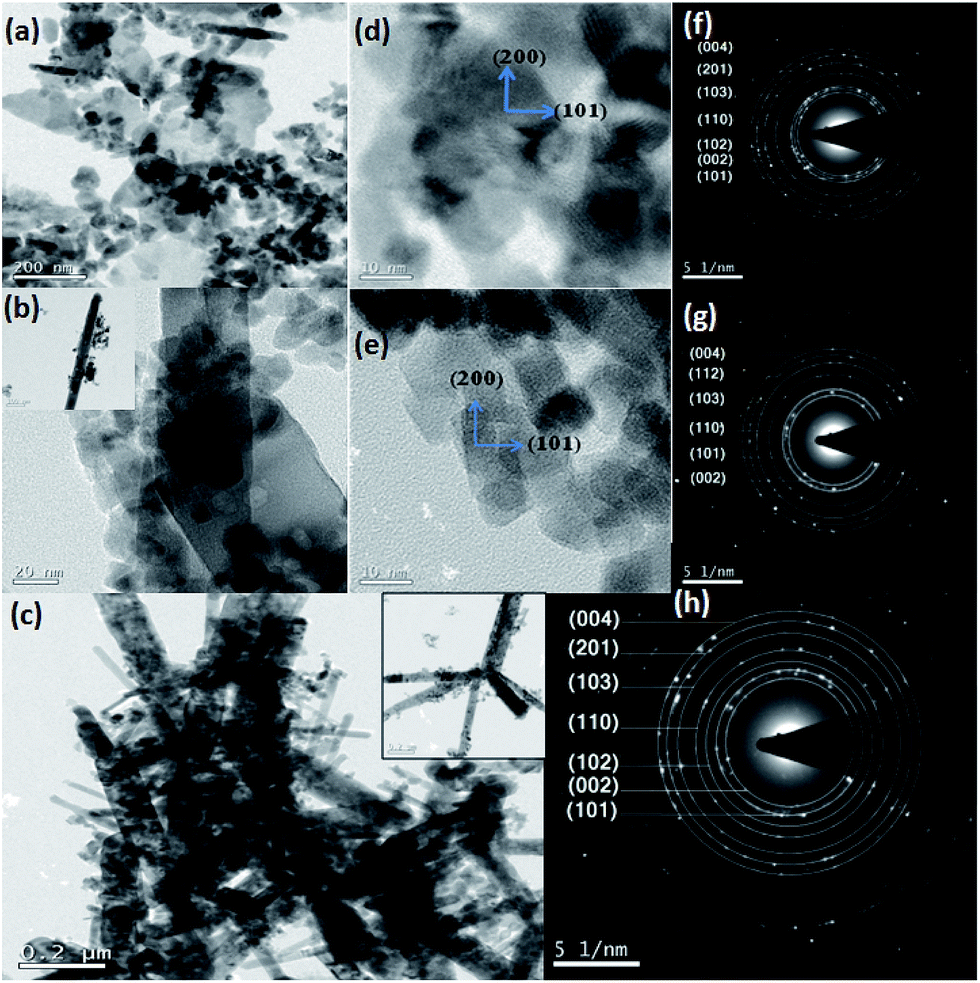 | ||
| Fig. 2 TEM images of (a) ZnO (b) ZnO–5% Co (inset shows a single nanorod) (c) ZnO–10% Co (inset shows distinct nanorods), HRTEM image of (d) ZnO–5% Co (e) ZnO–10% Co, SAED patterns of (f) ZnO (g) ZnO–5% Co (h) ZnO–10% Co indexed properly. | ||
The SAED pattern taken on un-doped and Co-doped samples show clear distinct rings corresponding to different planes of hexagonal wurtzite ZnO structures (shown in Fig. 2(f–h)). The planes corresponding to different rings have been found out by calculating the d-spacing using Image-J software which is in agreement with the planes obtained in XRD.
The structural parameters and phase purity have been studied using powder X-ray diffraction and Full-proof software. The XRD patterns of Co-doped ZnO samples with varying dopant concentrations from 0% to 10% are shown in Fig. 3(a). All the samples are found to crystallize in single phase hexagonal crystal structure (P63mc space group). All the peaks are sharp, properly indexed and well in agreement with that of standard datasheet (JCPDS-036-1451) corresponding to the hexagonal wurtzite.79 The most intense peak (101) (shown in the inset of Fig. 3(a)) shows a clear shift towards lower 2θ value as well as a decrease in intensity in Co-doped ZnO samples indicating the incorporation of Co in ZnO.80 No other diffraction peak has been detected related to Co metal or oxides in any of the samples doped up to 5%. However, an additional diffraction peak related to secondary phases of Co metal has been found in the XRD pattern of 10% Co-doped ZnO samples.
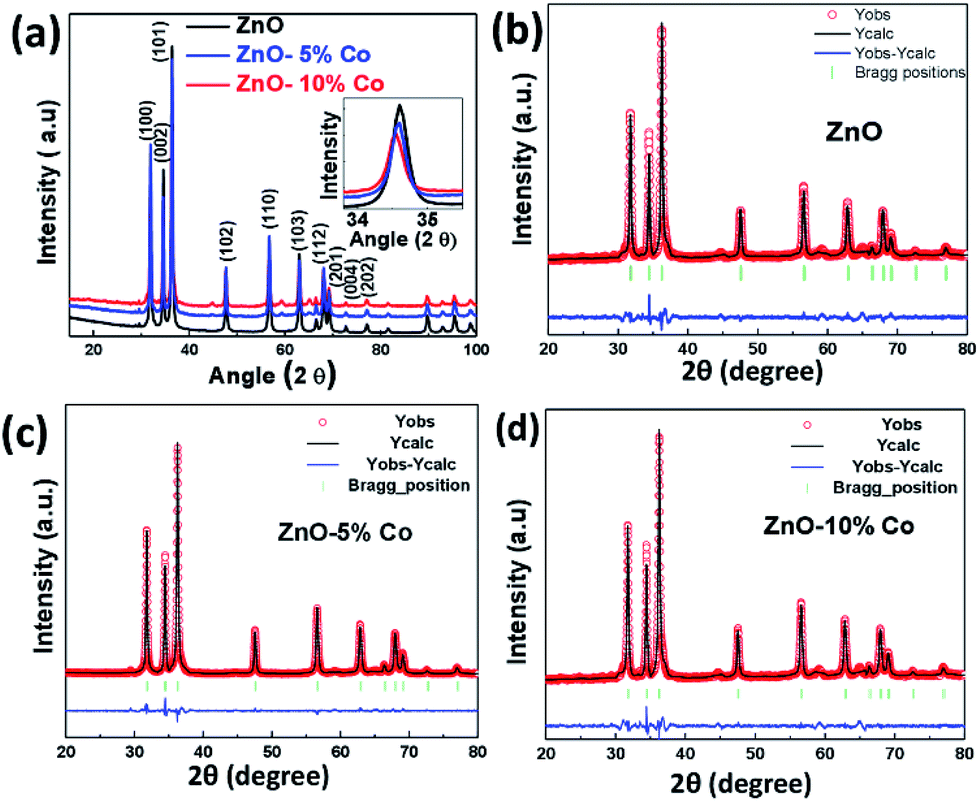 | ||
| Fig. 3 (a) XRD patterns of ZnO and Co-doped ZnO at room temperature, (b–d) Rietveld refined XRD patterns of ZnO and Co-doped ZnO samples at room temperature. Dotted circles correspond to the XRD data and the lines are theoretical fits to the observed XRD data. The difference pattern between the observed data and the theoretical fit is shown at the bottom. | ||
There are several reports which indicate that Co has a limited solubility in ZnO.81 Yeng et al. synthesized Co-doped ZnO materials followed by the hydrothermal process using zinc and cobalt nitride and observed the appearance of the second phase at 9.9% Co in ZnO.82 In our case, we have seen very small and extra peaks at 44.8° and 59.3° in 5% and 10% Co-doped ZnO sample. However, the new and very small peaks are analyzed to be Co metal impurity phase (JCPDS-01-1259) and Co3O4 (JCPDS-76-1802) which may have appeared due to the clustering of cobalt either in the grain boundary or interstitial position.69 This grain boundary defect clustering may be responsible for the observed magnetic behavior in our samples. For further understanding, Rietveld refinement of the data was done which is shown in Fig. 3(b) and the refined parameters are given in Table 1. From the refined data, it can be seen that lattice parameter is not changed appreciably in 5% Co-doped ZnO sample (slight decrease) which is expected due to the small difference between the ionic radius of Co (0.58 Å) and Zn (0.60 Å). But in 10% Co-doped ZnO sample the lattice parameter is increased which might be due to the incorporation of Co2+ in interstitial sites.60 It may be inferred from the XRD data that in 5% Co-doped sample lattice parameter is slightly decreased due to the substitution of Co2+ with Zn2+ and in 10% Co-doped sample due to more amount of Co, there is an interstitial incorporation along with the substitutional incorporation of Co. The crystallite size is calculated from the positions of Bragg's reflection (from 110 planes) using the well known Debye–Scherrer's formula.83 The calculated crystallite size is found to increase with the increase in Co i.e. for ZnO crystal it is 27 nm while for 5% and 10% Co-doped ZnO crystals it is 30 and 33 nm respectively. This might be due to increased cobalt concentration in ZnO matrix which has increased the nucleation of particles as well as has enhanced the growth of crystallites.
| Sample | Lattice parameters | Positions | Agreement factors | ||||||||||
|---|---|---|---|---|---|---|---|---|---|---|---|---|---|
| a (Å) | b (Å) | c (Å) | α | β | γ | x | y | z | Occ | Rp | Rwp | χ2 | |
| ZnO, Zn, O | 3.2505 | 3.2505 | 5.2067 | 90 | 90 | 120 | 0.333 | 0.667 | 0.0063 | 1.00 | 5.97 | 3.51 | 6.394 |
| 0.333 | 0.667 | 0.3780 | 1.00 | ||||||||||
| ZnO(Co-5%), Zn, O, Co | 3.2503 | 3.2503 | 5.2059 | 90 | 90 | 120 | 0.3149 | 0.6297 | 0.0049 | 0.96 | 2.19 | 2.98 | 2.58 |
| 0.6406 | 0.2812 | 0.3838 | 1.00 | ||||||||||
| 0.0768 | 0.1535 | 0.0638 | 0.05 | ||||||||||
| ZnO(Co-10%), Zn, O, Co | 3.2522 | 3.2522 | 5.2080 | 90 | 90 | 120 | 0.3149 | 0.6299 | 0.0040 | 0.98 | 2.20 | 3.16 | 3.82 |
| 0.3323 | 0.6645 | 0.3830 | 1.00 | ||||||||||
| 0.0952 | 0.1904 | 0.0230 | 0.10 | ||||||||||
Raman spectroscopy has been used to detect the disorder induced due to dopant incorporation in the host lattice, the presence of defects, etc. Fig. 4 shows the micro-Raman spectra of pure and Co-doped ZnO samples taken at room temperature in the range 65–715 cm−1. The optical phonons of wurtzite-type ZnO which belongs to point group C6v have an irreducible representation A1 + 2B1 + E1 + 2E2.84 A1 and E1 are polar modes and hence can be split into transverse optical (TO) and longitudinal optical (LO) phonon modes. The B1 modes are silent in Raman scattering.85,86 The nonpolar E2 modes are Raman active and have two frequencies E2 (high) associated with vibration of the oxygen atom and E2 (low) associated with vibration of Zn atoms.87
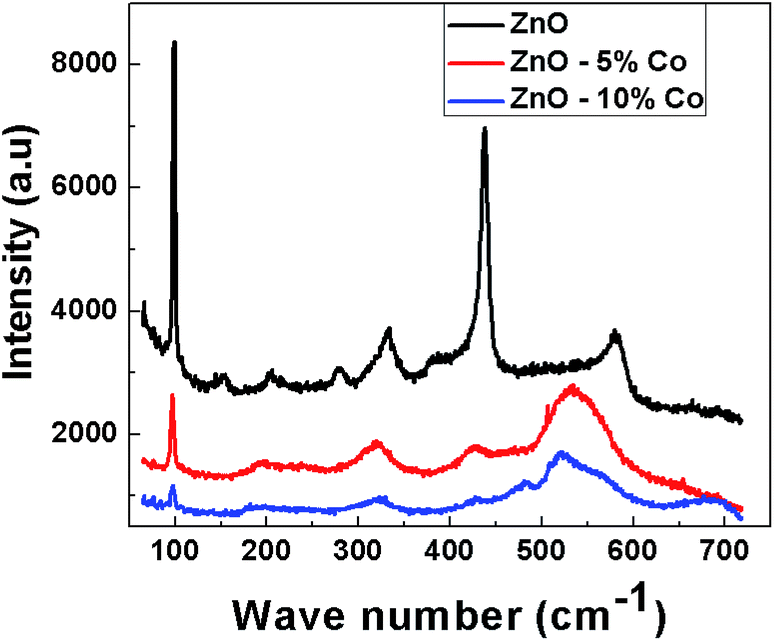 | ||
| Fig. 4 Raman spectra recorded on ZnO and Co-doped ZnO samples at room temperature. | ||
The sharp and strong peak at 437 cm−1 in the Raman spectra of ZnO can be assigned to E2 (high) mode of ZnO which is the strongest mode in wurtzite crystal structure. In the Co-doped ZnO samples, this peak is found to be broadened and weakened with increasing Co content indicating that the crystal structure is disordered due to Co incorporation in the lattice. The peak at 99 cm−1 has been assigned to E2 (low) phonon mode of ZnO. The E2 (low) mode is predominantly associated with nonpolar vibration of the heavier Zn-atom while E2 (high) mode is associated with the displacement of lighter O-atom. The Raman bands at 332 and 380 cm−1 are attributed to 2E2 (M) and A1 (TO) mode respectively. The intensity of the peak at 332 cm−1 has been decreased in Co-doped ZnO, and even the peak at 380 cm−1 has disappeared due to disorder induced due to Co doping. The peak at 156 cm−1 may be related to defect induced mode.88 The peaks at 277 and 580 cm−1 are attributed to B1 (low) and B1 (high) phonons respectively.89 The peak at 580 cm−1 in ZnO has been shifted and broadened in Co-doped ZnO sample giving a remarkable feature around 532 cm−1 which can be assigned to local vibration mode related to Co that is bound with donor defects like doubly ionized oxygen vacancies and zinc interstitials.90–92 From XRD, and Raman spectra it can be deduced that incorporation of Co in ZnO leads to a decrease in crystal quality, but there is no change in wurtzite crystal structure.
Fig. 5(a) shows the UV-visible absorption spectra of ZnO and Co-doped ZnO samples taken at room temperature. UV-Vis absorption spectra have been used to find out the changes in the energy band structure of ZnO due to Co doping. Primarily it is used to find out the band gap of the material. As shown in Fig. 4(a) the optical absorption of all the three samples show a strong absorption around 370–395 nm, and the absorption edge is shifted to lower wavelength upon cobalt doping in ZnO. The band gap energy of the samples can be calculated by using the following equation93 i.e.
| αhν = A(hν − Eg)1/2 | (1) |
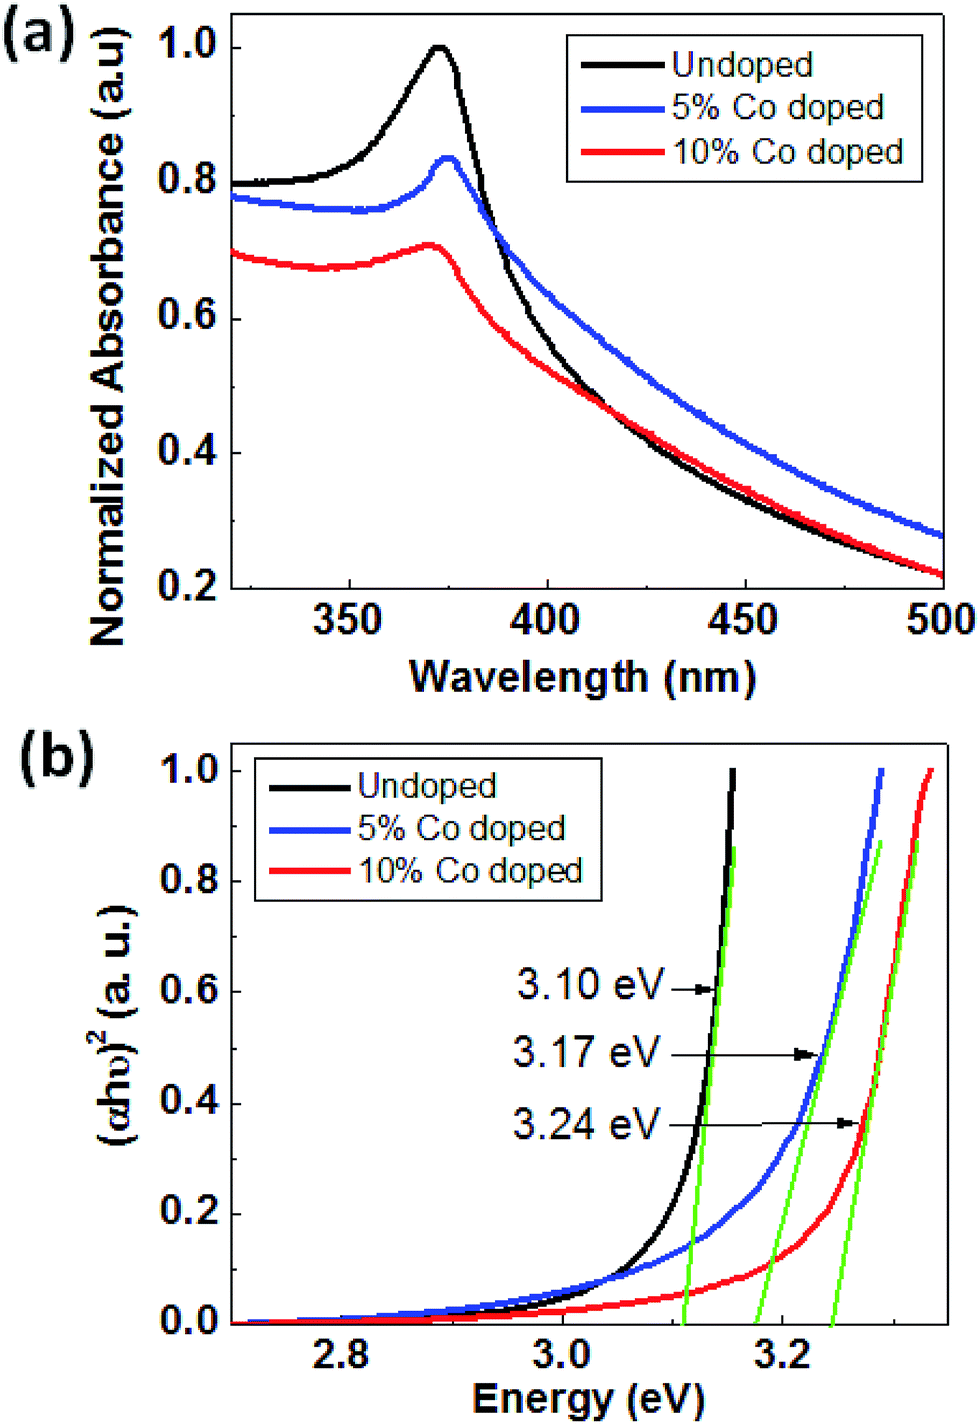 | ||
| Fig. 5 (a) Absorbance vs. wavelength plot of ZnO, 5% Co-doped and 10%-doped ZnO and (b) plot to estimate the direct optical band gap of ZnO, 5% Co doped and 10% doped ZnO. | ||
The optical behavior of ZnO NPs and NRs is also studied by photoluminescence (PL) spectroscopy. Fig. 6(a and b) below show the normalized PL spectra of ZnO and Co-doped ZnO taken in two parts: first one from 370 to 550 nm and second one from 550 to 650 nm. The signature of strong excitonic band at 386 nm with no defect emission except a comparable weak band at 408 nm is observed in pure ZnO NPs. With doping several defect related peaks have appeared around 433 nm, 460 nm, 486 nm, 520 and 530 nm. All these peaks are related to the transition of electrons from zinc interstitial (Zni) in giving emission peak in violet-blue region (405–440 nm), from oxygen vacancy (VO) giving green emission (490–610 nm) and zinc vacancy (VZ) giving blue emission (450–460 nm). The defect emission peak is gradually increased with increasing doping concentration. From Fig. 6(b) it can be noticed that the defect peak around 520 nm has blue shifted and become broader with doping. Here it can be inferred that visible emission has enhanced with increase in doping concentration and this emission is due to the presence of VO and Zni.106 There are several reports of quenching of visible emission in Co-doped ZnO NRs107–109 due to the dopant complexes acting as non-radiative centres110 as well as anhilation of oxygen vacancy centres due to the presence of Co3+ ions111 in the sample. But in our case, luminescence intensity of Co-doped ZnO nanorods has been increased in visible region which indicates that Co-doping can improve surface states, enhance the number of defects and oxygen vacancies in doped nanorods112 which is in agreement with Raman spectra.
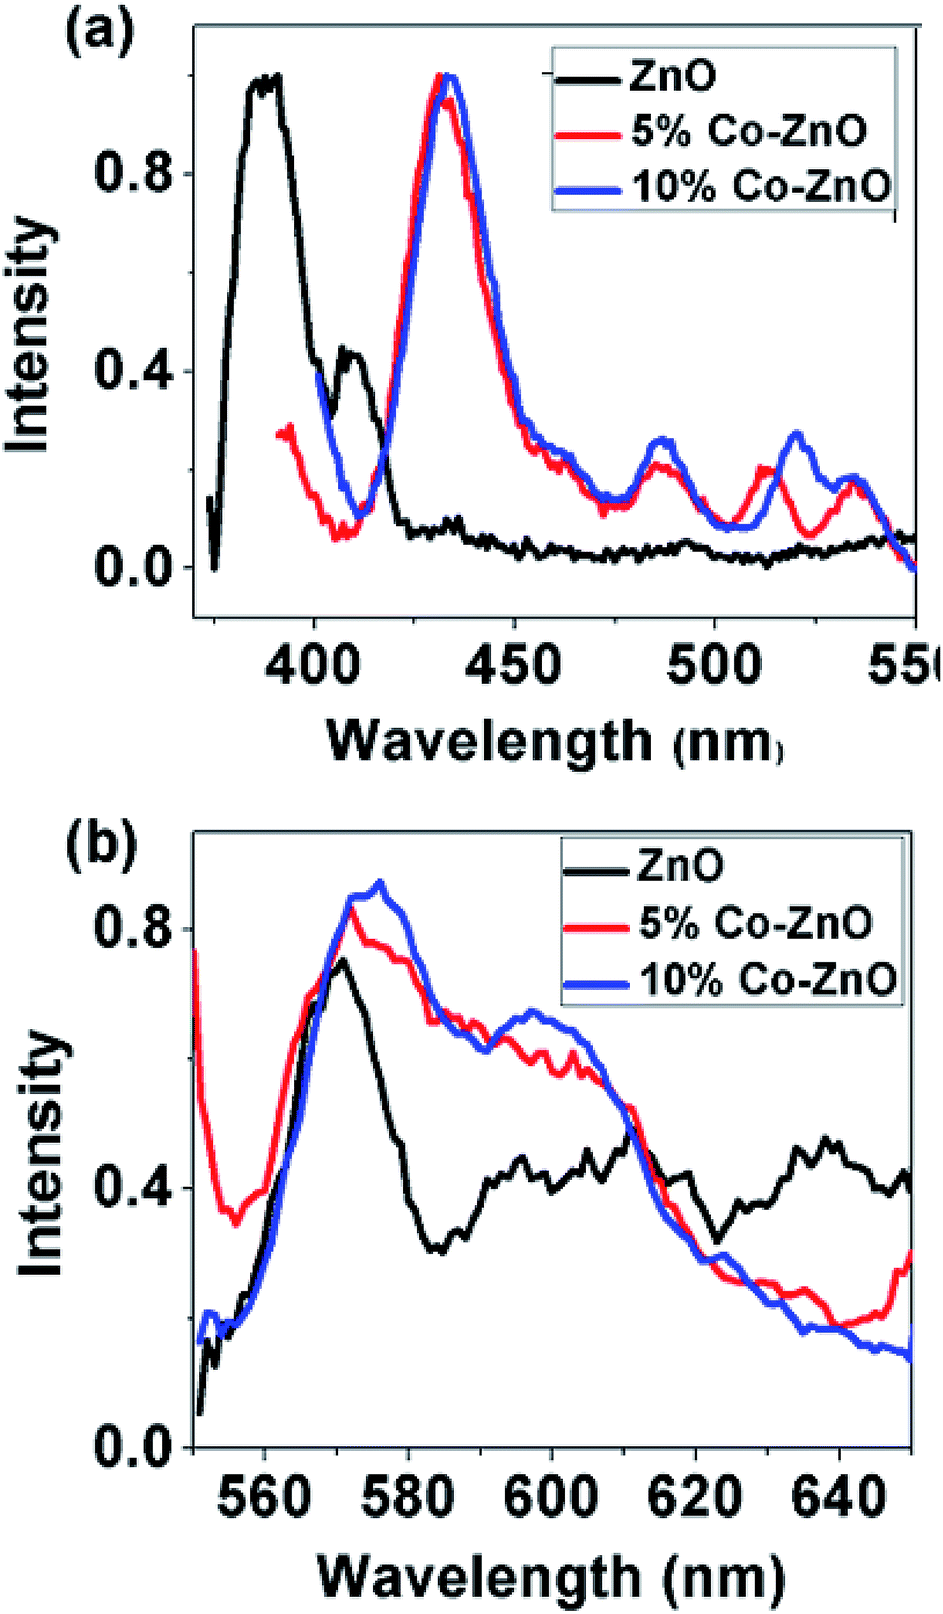 | ||
| Fig. 6 Photoluminescence spectra of ZnO, 5% Co doped and 10% doped ZnO at room temperature from (a) 370–550 nm and (b) 550–650 nm. | ||
To get information about the magnetic behavior of the Co-doped ZnO nanostructures, field dependent magnetization (M–H) measurements were carried out at 300 K and 2 K. The M–H curves measured at 300 K and 2 K show a diamagnetic nature for ZnO NPs which is shown in Fig. 7(a). However, the M–H curves for doped (5% and 10%) samples show a small paramagnetic (PM) and superparamagnetic (SPM) like ordering at 300 K and 2 K respectively along with a definite FM ordering which is attested by the presence of hysteric nature at lower field region (shown as the inset in Fig. 7(b and c)). The remanent magnetization (MR) and coercivity (HC) estimated are very small in the doped samples, but the MR value is increased and the HC is decreased at low temperature, i.e., at room temperature the HC is more in both 5% (210 Oe) and 10% (80 Oe) Co-doped samples than at 2 K (135 Oe for 5% and 54 Oe for 10% Co-doped samples). The MR is increased from 1.8 × 10⁻⁴ emu g−1 at 300 K to 0.008 emu g−1 at 2 K for 5% and from 6.6 × 10⁻⁴ emu g−1 at 300 K to 0.011 emu g−1 at 2 K for 10% Co-doped sample. Although the magnetization is enhanced 10–15 times at 2 K from that at 300 K, it is noted that the M–H curves of doped samples do not saturate at high applied magnetic fields as 9 T. Also, the net magnetization is increased in 10% Co-doped sample in comparison to 5% Co-doped ZnO which indicates more dopant (Co) incorporation in 10% doped sample. Similar kind of behavior is observed in Co-doped and Mn-doped ZnO nanocrystalline films prepared by pulsed laser deposition.113–115
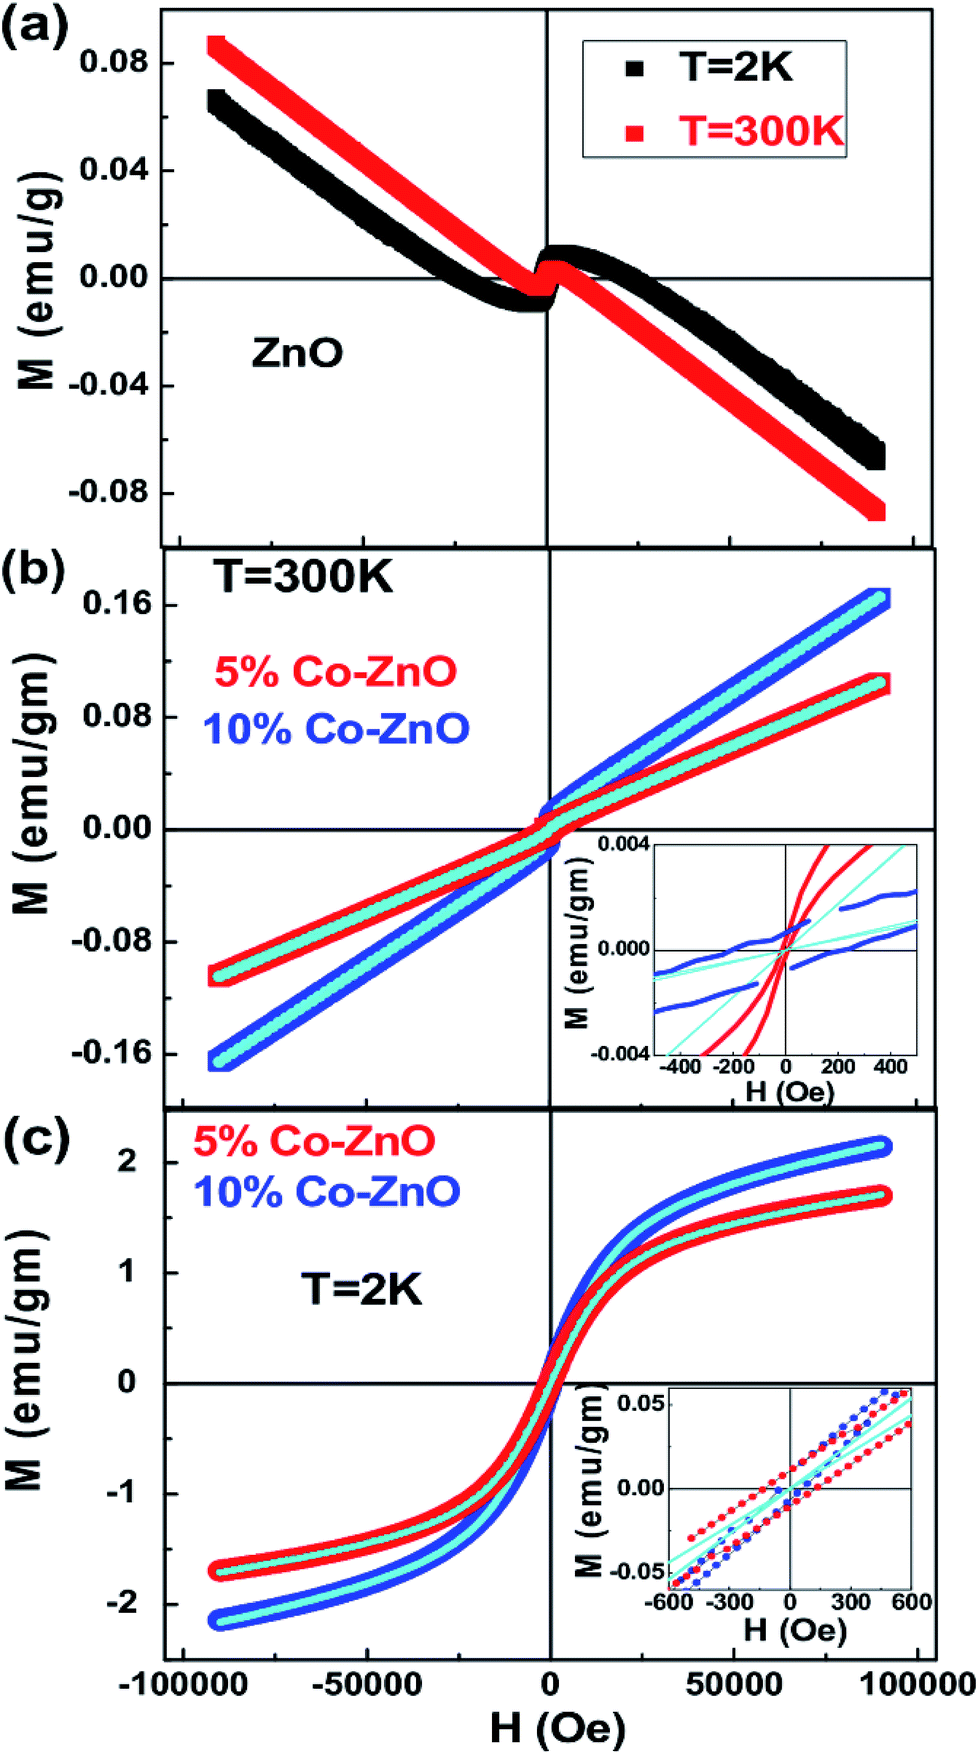 | ||
| Fig. 7 Field variation of magnetization (a) M–H curves at 2 K and 300 K for ZnO (b) M–H curves measured at 300 K for Co-doped ZnO samples. (c) M–H curves measured at 2 K for Co-doped ZnO samples. The solid lines represent the fit to the eqn (3) and the insets show the closure picture of the M–H loops in the lower field regions. | ||
In general, this kind of an unusual magnetic behaviour can be understood due to the presence of two-magnetic components, i.e., a FM component that is easily saturated at very low fields and a linear component possible due to SPM or PM. But, there are not models which can be explained to describe the combined FM and SPM/PM behaviors in magnetization curves. Therefore, we have attempted to explain the FM and SPM contributions quantitatively using several theories, and in this attempt, we tried to fit the isothermal M–H curve at 2 K with Langevin function:
| M = MSL(μH/KBT) | (2) |
| M = MSL(μH/KBT) + χH | (3) |
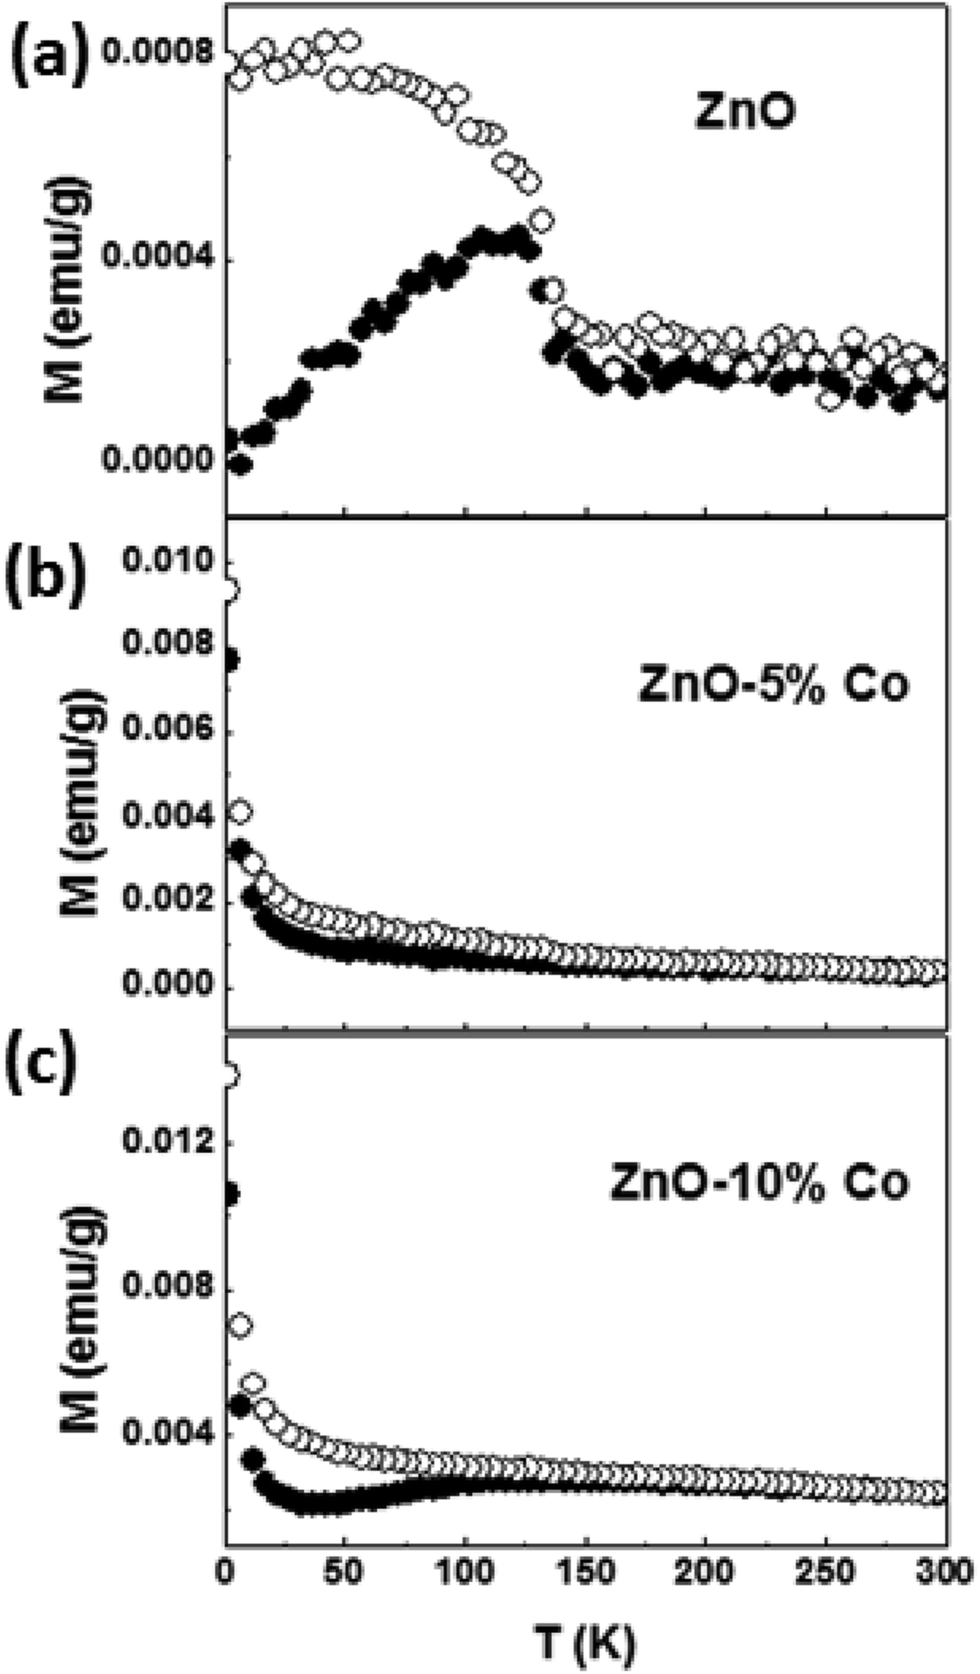 | ||
| Fig. 8 Temperature variation of magnetization for the Co-doped ZnO samples measured under 100 Oe in zero-field-cooled (ZFC) and field cooled (FC) modes. Closed and open symbols represent ZFC and FC respectively. | ||
Conclusions
In summary, structural, optical and magnetic properties of ZnO and 5%, 10% Co-doped ZnO NPs and NRs synthesized by a simple wet chemical route have been studied. Powder X-ray diffraction, high-resolution transmission electron microscopy, selected area electron diffraction pattern confirm the formation of NPs and NRs in un-doped as well as Co-doped ZnO samples. However, the production of NRs is more visible with the increase in Co-content. Raman spectroscopy indicates the disorder and defects induced due to Co-doping and shifting and broadening of the bands at 437 cm−1 and 579 cm−1 in micro-Raman study of Co-doped ZnO samples indicate the incorporation of Cobalt in ZnO. Blue shift in band gap attributed due to Burstein–Moss effect may be a consequence of the incorporation of Co2+ in ZnO lattice. Field-dependent magnetization (M–H curve) measurement exhibits the diamagnetic behavior of un-doped ZnO at 2 K and room temperature while Co-doped ZnO samples show coexistence of superparamagnetic and ferromagnetic behavior at room temperature and 2 K. Observed ferromagnetism may have originated due to the exchange interaction between the localized d electrons in Co2+ atoms and free carriers generated due to Co-doping as well as due to cobalt clustering in the Co-doped samples.Conflicts of interest
There are no conflicts of interest to declare.Acknowledgements
The authors (Anupama Chanda and Jai Singh) wish to acknowledge, University Grants Commission for providing UGC-BSR Research Start-Up-Grant (No. F.30-12/2014(BSR)) to carry out this work. M. Vasundhara would like to thank Department of Science and Technology for partially supporting this work. A. Chanda would also like to acknowledge Dr Prashant Shukla for his valuable discussion regarding curve-fitting and Image J software.References
- M. S. von and D. Read, Proc. IEEE, 2003, 91, 715 CrossRef.
- S. A. Wolf, D. D. Awschalom, R. A. Buhrman, J. M. Daughton, M. S. von, M. L. Roukes, A. Y. Chtchelkanova and D. M. Treger, Science, 2001, 294, 1488 CrossRef CAS PubMed.
- T. Dietl, Semicond. Sci. Technol., 2002, 17, 377 CrossRef CAS.
- C. Chappert, A. Fert and F. Nguyen Van Dau, Nat. Mater., 2007, 6, 813 CrossRef CAS PubMed.
- J. K. Furdyna and J. Kossut, in Semiconductors and Semimetals, ed. R. K. Williardson and A. C. Beer, Academic, New York, 1988, p. 25 Search PubMed.
- (a) Y. Ohno, D. K. Young, B. Beschoten, F. Matsukura, H. Ohno and D. D. Awschalom, Nature, 1999, 402, 790 CrossRef CAS; (b) H. Ohno, D. Chiba, F. Matsukura, T. Omiya, E. Abe, T. Dietl, Y. Ohno and K. Ohtani, Nature, 2000, 408, 944 CrossRef CAS PubMed.
- Semiconductor and Semimetals, Diluted Magnetic Semiconductors, ed. J. Furdyna and J. Kossut, Academic Press, Boston, 1988, vol. 25 Search PubMed.
- J. Kossut and W. Dobrowolski, Handbook of Magnetic Materials, ed. K. H. J. Buschow, North-Holland, Amsterdam, 1993, vol. 7 Search PubMed.
- T. Dietl, J. Jaroszynski, G. Grabecki, J. Wrobel, M. Sawicki, T. Skoskiewicz, E. Kaminskaz, A. Piotrowskaz, G. Karczewski, T. Wojtowicz and J. Kossut, Semicond. Sci. Technol., 1996, 11, 1618 CrossRef CAS.
- H. Ohno, H. Munekata, T. Penny, S. von Molnar and L. L. Chang, Phys. Rev. Lett., 1992, 68, 2664 CrossRef CAS PubMed.
- H. Ohno, A. Shen, F. Matsukura, A. Oiwa, A. Endo, S. Katsumoto and Y. Iye, Appl. Phys. Lett., 1996, 69, 363 CrossRef CAS.
- M. Overby, A. Chernyshov, L. P. Rokhinson, X. Liu and J. K. Furdyna, Appl. Phys. Lett., 2008, 92, 192501 CrossRef.
- Z. Li, J. A. Mol, L. Lagae, G. Borghs, R. Mertens and W. V. Roy, Appl. Phys. Lett., 2008, 92, 112513 CrossRef.
- D. Wu, P. Wei, E. Johnston-Halperin, D. D. Awschalom and J. Shi, Phys. Rev. B: Condens. Matter Mater. Phys., 2008, 77, 125320 CrossRef.
- M. Watanabe, J. Okabayashi, H. Toyao, T. Yamaguchi and J. Yoshino, Appl. Phys. Lett., 2008, 92, 082506 CrossRef.
- S. Mack, R. C. Myers, J. T. Heron, A. C. Gossard and D. D. Awschalom, Appl. Phys. Lett., 2008, 92, 192502 CrossRef.
- D. Chiba, M. Yamanouchia, F. Matsukuraa, T. Dietl and H. Ohno, J. Magn. Magn. Mater., 2007, 310, 2078 CrossRef CAS.
- M. Zajac, J. Gosk, E. Grzanka, S. Stelmakh, M. Palczewska, A. Wysmolek, K. Korona, M. Kaminska and A. Twardowski, J. Alloys Compd., 2008, 456, 324 CrossRef CAS.
- V. V. Rylkov, B. A. Aronzon, Y. A. Danilov, Y. N. Drozdov, V. P. Lesnikov, K. I. Maslakov and V. V. Podolíski, J. Exp. Theor. Phys., 2005, 100, 742 CrossRef CAS.
- N. A. Sobolev, M. A. Oliveira, R. M. Rubinger, A. J. Neves, M. C. Carmo, V. P. Lesnikov, V. V. Podolskii, Y. A. Danilov, E. S. Demidov and G. N. Kakazei, J. Supercond. Novel Magn., 2007, 20, 399 CrossRef CAS.
- T. Schallenberg and H. Munekata, J. Cryst. Growth, 2007, 301, 623 CrossRef.
- D. L. Hou, R. B. Zhao, H. J. Meng, L. Y. Jia, X. J. Ye, H. J. Zhou and X. L. Li, Thin Solid Films, 2008, 516, 3223 CrossRef CAS.
- A. I. Rykov, K. Nomura, J. Sakuma, C. Barrero, Y. Yoda and T. Mitsui, Phys. Rev. B: Condens. Matter Mater. Phys., 2008, 77, 014302 CrossRef.
- Y. Wang, G. Pang, Y. Chen, S. Jiao, D. Wang and S. Feng, J. Solid State Chem., 2008, 181, 217 CrossRef CAS.
- J. Zhang, R. Skomski, L. P. Yue, Y. F. Lu and D. J. Sellmyer, J. Phys.: Condens. Matter, 2007, 19, 256204 CrossRef.
- P. F. Xing, Y. X. Chen, S. S. Yan, G. L. Liu, L. M. Mei, K. Wang, X. D. Han and Z. Zhang, Appl. Phys. Lett., 2008, 92, 022513 CrossRef.
- D. Berardan, E. Guilmeau and D. Pelloquin, J. Magn. Magn. Mater., 2008, 320, 983 CrossRef CAS.
- Q. Xu, H. Schmidt, H. Hochmuth, M. Lorenz, A. Setzer, P. Esquinazi, C. Meinecke and M. Grundmann, J. Phys. D: Appl. Phys., 2008, 41, 105012 CrossRef.
- S. Zhou, K. Potzger, G. Talut, H. Reuther, K. Kuepper, J. Grenzer, Q. Xu, A. Mucklich, M. Helm, J. Fassbender and E. Arenholz, J. Phys. D: Appl. Phys., 2008, 41, 105011 CrossRef.
- J. Fan and R. Freer, J. Mater. Sci., 1993, 28, 1391 CrossRef CAS.
- J. Jie, G. Wang, Q. Wang, Y. Chen, X. Han, X. Wang and J. G. Hou, J. Phys. Chem. B, 2004, 108, 11976 CrossRef CAS PubMed.
- X. Wang, R. K. Zheng, Z. Liu, H. P. Ho, J. B. Xu and S. P. Ringer, Nanotechnology, 2008, 19, 455702 CrossRef PubMed.
- T. Polek, M. Semen'ko, T. Endo, Y. Nakamura, G. S. Lotey and A. Tovstolytkin, Nanoscale Res. Lett., 2017, 12, 180 CrossRef PubMed.
- S. J. Pearton, D. P. Norton, K. Ip, Y. W. Heo and T. Steiner, Superlattices Microstruct., 2003, 34, 3 CrossRef CAS.
- M. H. Huang, S. Mao, H. Feick, H. Yan, Y. Wu, H. Kind, E. Weber, R. Russo and P. Yang, Science, 2001, 292, 1897 CrossRef CAS PubMed.
- Q. Wan, Q. H. Li, Y. J. Chen, T. H. Wang, X. L. He, J. P. Li and C. L. Lin, Appl. Phys. Lett., 2004, 84, 3654 CrossRef CAS.
- S. Sakthivel, B. Neppolian, M. V. Shanka, B. Arabindoo, M. Palanichamy and V. Muruguesan, Sol. Energy Mater. Sol. Cells, 2003, 77, 65 CrossRef CAS.
- A. Mclaren, T. Valdes-Solis, G. Li and S. C. Tsang, J. Am. Chem. Soc., 2009, 131, 12540 CrossRef CAS PubMed.
- K. Kim, T. Moon, M. Lee, J. Kang, Y. Jeon and S. Kim, Solid State Sci., 2011, 13, 1735 CrossRef CAS.
- E. Guillen, E. Azaceta, L. M. Peter, A. Zukal, R. Tena-Zaera and J. A. Anta, Energy Environ. Sci., 2011, 4, 3400 CAS.
- K. Matsubara, P. Fons, K. Iwata, A. Yamada, K. Sakurai, H. Tampo and S. Niki, Thin Solid Films, 2003, 431, 369 CrossRef.
- G. S. Lotey, J. Singh and N. K. Verma, J. Mater. Sci.: Mater. Electron., 2013, 24(9), 3611 CrossRef CAS.
- G. S. Lotey, Z. Jindal, V. Singhi and N. K. Verma, Mater. Sci. Semicond. Process., 2013, 16(6), 2044 CrossRef.
- P. V. Raleaooa, A. Roodt, G. G. Mhlongo, D. E. Motaung, R. E. Kroon and O. M. Ntwaeaborwa, Phys. B, 2017, 507, 13 CrossRef CAS.
- N. Karar, H. Chander and S. M. Shivaprasad, Appl. Phys. Lett., 2004, 85, 5058 CrossRef CAS.
- N. Padmavathy and R. Vijayaraghavan, Sci. Technol. Adv. Mater., 2008, 9, 035004 CrossRef PubMed.
- T. Dietl, H. Ohno, F. Matsukura, J. Cibert and D. Ferrand, Science, 2000, 287, 1019 CrossRef CAS PubMed.
- H. T. Lin, T. S. Chin, J. C. Shih, S. H. Lin, T. M. Hong, R. T. Huang, F. R. Chen and J. J. Kai, Appl. Phys. Lett., 2004, 85, 621 CrossRef CAS.
- Z. Jin, T. Fukumura, M. Kawasaki, K. Ando, H. Saito, T. Sekiguchi, Y. Z. Hoo, M. Murakami, Y. Matsumuto, T. Hasegawa and H. Koinuma, Appl. Phys. Lett., 2001, 78(24), 3824 CrossRef CAS.
- R. D. Shannon, Acta Crystallogr., Sect. A: Cryst. Phys., Diffr., Theor. Gen. Crystallogr., 1976, 32(5), 751 CrossRef.
- K. Sato and H. K. Yoshida, Phys. E, 2001, 10(1–3), 251 CrossRef CAS.
- K. Ueda, H. Tabota and T. Kawai, Appl. Phys. Lett., 2001, 79, 988 CrossRef CAS.
- C. C. Wang, M. Liu, B. Y. Man, C. S. Chen, S. Z. Jiang, S. Y. Yang, X. G. Gao, S. C. Xu, B. Hu, Z. C. Sun, J. J. Guo and J. Hou, AIP Adv., 2012, 2, 012182 CrossRef.
- J. Mohapatra, D. K. Mishra, D. Mishra, A. Perumal, V. R. R. Medicherla, D. M. Phase and S. K. Singh, Mater. Res. Bull., 2012, 47, 1417 CrossRef CAS.
- B. Pal, S. Dhara, P. K. Giri and D. Sarkar, J. Alloys Compd., 2014, 615, 378 CrossRef CAS.
- S. Chakraborty, S. Sarwar and P. Chakrabarty, J. Phys. Chem. B, 2013, 117, 13397 CrossRef PubMed.
- L. Zhang, X. Liu, C. Geng, H. Fang, Z. Lian, X. Wang, D. Shen and Q. Yan, Inorg. Chem., 2013, 52, 10167 CrossRef CAS PubMed.
- E. W. Seeling, B. Tang and A. Yamilov, Mater. Chem. Phys., 2003, 80, 257 CrossRef.
- S. J. Chen, G. R. Wang and Y. C. Liu, J. Lumin., 2009, 129, 340 CrossRef CAS.
- I. Djerdj, G. Garnweitner, D. Arcon, M. Pregeli, Z. Jaqlicic and M. Niedegrberger, J. Mater. Chem., 2008, 18, 5208 RSC.
- R. Podila, W. Queen, A. Nath, J. T. Avantes, A. L. Schoenhalz, A. Fazzio, G. M. Dalpian, J. He, S. J. Hwu, M. J. Skove and A. M. Rao, Nano Lett., 2010, 10, 1383 CrossRef CAS PubMed.
- J. M. D. Coey, M. Venkatesan and C. B. Fitzgerald, Nat. Mater., 2005, 4, 173 CrossRef CAS PubMed.
- N. Khare, M. J. Kappers, M. Wei, M. G. Blamire and J. L. MacManus-Driscoll, Adv. Mater., 2006, 18, 1449 CrossRef CAS.
- S. A. Chambers, T. Droubay, C. M. Wang, A. S. Lea, R. F. C. Farrow, L. Folks, V. Deline and S. Anders, Appl. Phys. Lett., 2003, 82, 1257 CrossRef CAS.
- F. C. Kartawidjaja, Z. Y. Lim, S. L. G. Ng, Y. Zhang and J. Wang, J. Am. Ceram. Soc., 2010, 93, 3798 CrossRef CAS.
- X. J. Liu, X. Y. Zhu, J. T. Luo, F. Zeng and F. Pan, J. Alloys Compd., 2009, 482, 224 CrossRef CAS.
- M. N. Lin, H. S. Hsu, J. Y. Lai, M. C. Guo and C. Y. Lin, et al., Appl. Phys. Lett., 2011, 98, 212509 CrossRef.
- H. S. Hsu, J. C. A. Huang, S. F. Chen and C. P. Liu, Appl. Phys. Lett., 2007, 90, 102506 CrossRef.
- A. Aravindh, S. Devi and I. S. Roqan, RSC Adv., 2016, 6, 50818 RSC.
- N. S. Singh, S. D. Singh and S. K. Bandopadhyaya, Phys. Procedia, 2014, 54, 2 CrossRef CAS.
- V. Gandhi, R. Ganesan, H. H. A. Syedahamed and M. Thaiyan, J. Phys. Chem. C, 2014, 118, 9715 CAS.
- J. Cui, Q. Zeng and U. J. Gibson, J. Appl. Phys., 2006, 99, 08M113 CrossRef.
- L. Yanmei, F. Qingqing, W. Mingzai, Li. Yan, Lv. Qingrong, Z. Jun and W. Baoming, J. Phys. D: Appl. Phys., 2007, 40, 4592 CrossRef.
- W. L. Li, Y. Zhao and W. D. Fei, J. Sol-Gel Sci. Technol., 2010, 54(3), 335 CrossRef CAS.
- Y. Liu, Q. Fang, M. Wu, Y. Li, Q. Lv, J. Zhou and B. Wang, J. Phys. Appl. Phys., 2007, 40(15), 4592 CrossRef CAS.
- J. Cui, Q. Zeng and U. J. Gibson, J. Appl. Phys., 2006, 99(8), 08M113 CrossRef.
- K. L. Foo, U. Hashim, K. Muhammad and C. H. Voon, Nanoscale Res. Lett., 2014, 9, 429 CrossRef PubMed.
- D. A. Schwartz, N. S. Norberg, Q. P. Nguyen, J. M. Prker and D. R. Gamelin, J. Am. Chem. Soc., 2003, 125, 13205 CrossRef CAS PubMed.
- J. Singh, P. Kumar, D. J. Late, T. Singh, M. A. More, D. S. Joag, R. S. Tiwari, K. San Hui and O. N. Srivastava, Dig. J. Nanomater. Bios., 2012, 7, 525 Search PubMed.
- V. K. Sharma, M. Najim, A. K. Srivastava and G. D. Varma, J. Magn. Magn. Mater., 2012, 324, 683 CrossRef CAS.
- E. Gungor, T. Gungor, D. Caliskanb, A. Ceylanc and E. Ozbay, Appl. Surf. Sci., 2014, 318, 309 CrossRef CAS.
- L. W. Yeng, X. L. Wu, T. Qui, G. G. Siu and P. K. Chu, J. Appl. Phys., 2006, 99, 074303 CrossRef.
- S. Singhal, J. Kaur, T. Namgyal and R. Sharma, Phys. B, 2012, 407, 1223 CrossRef CAS.
- S. Sahoo, G. L. Sharma and R. S. Katiyar, J. Raman Spectrosc., 2012, 43, 72 CrossRef CAS.
- Y. Q. Chang, P. W. Wang, S. L. Ni, Y. Long and X. D. Li, J. Mater. Sci. Technol., 2012, 23, 313 Search PubMed.
- R. Loudon, Adv. Phys., 1964, 13, 423 CrossRef CAS.
- B. Pal and P. K. Giri, J. Nanosci. Nanotechnol., 2011, 11, 1 CrossRef.
- C. Bundesmann, N. Ashkenov, M. Schubert, D. Spemann, T. Buzz, E. Kaidaschev, M. Lorenz and M. Grundmann, Appl. Phys. Lett., 2003, 83, 4631 CrossRef.
- F. J. Manjon, B. Mari, J. Serrano and A. H. Romero, J. Appl. Phys., 2005, 97, 053516 CrossRef.
- J. M. D. Coey, M. Venkatesan and C. B. Fitzgerald, Nat. Mater., 2005, 4, 173 CrossRef CAS PubMed.
- J. H. Lee, C. H. Park, S. Y. Jeong, K. J. Yee, C. R. Cho, M. H. Jung and D. J. Chadi, Appl. Phys. Lett., 2006, 88, 062504 CrossRef.
- X. Wang, J. Xu, B. Zhang, H. Yu, J. Wang, X. Zhang, J. Yu and Q. Li, Adv. Mater., 2006, 18, 2476 CrossRef CAS.
- R. A. Vanleeuwen, C. J. Hung, D. R. Kammler and J. A. Swizer, J. Phys. Chem., 1995, 99, 15247 CrossRef CAS.
- U. Koch, A. Fojtik, H. Weller and A. Henglein, Chem. Phys. Lett., 1985, 122, 507 CrossRef CAS.
- L. Brus, J. Phys. Chem., 1986, 90, 2555 CrossRef CAS.
- B. E. Sernelius, K. F. Berggren, Z. C. Jin, I. Hamberg and C. G. Graqvist, Phys. Rev. B: Condens. Matter Mater. Phys., 1988, 37, 10244 CrossRef CAS.
- Z. Sun, H. J. Sue and N. Miyatake, J. Phys. Chem. C, 2008, 112, 16002 Search PubMed.
- S. Das, S. Kar and S. Chaudhuri, J. Appl. Phys., 2006, 99, 114303 CrossRef.
- C. Du and H. Yang, RSC Adv., 2013, 3, 13990 RSC.
- Z. B. Bahsi and A. Y. Oral, Opt. Mater., 2007, 29, 672 CrossRef.
- M. Ivill, S. J. Pearton, S. Rawal, L. Leu, P. Sadik, R. Das, A. F. Hebard, M. Chisholm, J. D. Budai and D. P. Norton, New J. Phys., 2008, 10, 065002 CrossRef.
- J. Mera, C. Cordoba, J. Doria, A. Gomez, C. Paucar, D. Fuchs and O. Moran, Thin Solid Films, 2012, 525, 13 CrossRef CAS.
- Y. Caglar, J. Alloys Compd., 2013, 560, 181 CrossRef CAS.
- S. Husain, L. A. Alkhtaby, I. Bhat, E. Giorgetti, A. Zoppi and M. M. Miranda, J. Lumin., 2014, 154, 430 CrossRef CAS.
- P. Koidl, Phys. Rev. B: Solid State, 1977, 15, 493 CrossRef.
- X. Liu, X. Wu, H. Cao and R. P. H. Chang, J. Appl. Phys., 2004, 95, 3141 CrossRef CAS.
- H. Hao, M. Qin and P. Li, J. Alloys Compd., 2012, 515, 143 CrossRef CAS.
- D. S. Bohle and C. J. Spina, J. Phys. Chem. C, 2010, 114, 18139 CAS.
- S. Shi, Y. Yang, J. Xu, X. Zhang, G.-H. Hu and Z.-M. Dang, J. Alloys Compd., 2013, 576, 59 CrossRef CAS.
- V. A. L. Roy, A. B. Djurisic, H. Liu, X. X. Zhang, Y. H. Liung, M. H. Xie, J. Gao, H. F. Lui and C. Surya, Appl. Phys. Lett., 2004, 84, 756 CrossRef CAS.
- S. Ezhilvalvan and T. R. N. Kutty, J. Mater. Sci., 1996, 7, 137 Search PubMed.
- W. Baiqi, S. Xudong, F. Qiang, J. Iqbal, L. Yan, F. Honggang and Y. Dapeng, Phys. E, 2009, 41, 413 CrossRef.
- Q. Li, Y. Wang, L. Fan, J. Liu, W. Konga and B. Yea, Scr. Mater., 2013, 69, 694 CrossRef CAS.
- S. Venkatesh, A. Baras, J.-S. Lee and I. S. Roqan, AIP Adv., 2016, 6, 035019 CrossRef.
- A. Ney, V. Ney, S. Ye, K. Ollefs and T. Kammermeier, Phys. Rev. B: Condens. Matter Mater. Phys., 2010, 82, 041202(R) CrossRef.
| This journal is © The Royal Society of Chemistry 2017 |