
 Open Access Article
 This Open Access Article is licensed under a Creative Commons Attribution-Non Commercial 3.0 Unported Licence
Versatile design and synthesis of nano-barcodes
Swati
Shikha
a,
Thoriq
Salafi
 ab,
Jinting
Cheng
*c and
Yong
Zhang
*ab
ab,
Jinting
Cheng
*c and
Yong
Zhang
*ab
aDepartment of Biomedical Engineering, Faculty of Engineering, National University of Singapore (NUS), 4 Engineering Drive 3, Block E4 #04-08, 117583 Singapore. E-mail: biezy@nus.edu.sg
bNUS Graduate School for Integrative Sciences and Engineering, Centre for Life Sciences (CeLS), 05-01 28 Medical Drive, 117456 Singapore
cInstitute of Materials Research and Engineering (IMRE), Agency for Science, Technology and Research (A*STAR), 2 Fusionopolis Way, Innovis, #08-03, 138634, Singapore
First published on 12th October 2017
Abstract
Encoded nano-structures/particles have been used for barcoding and are in great demand for the simultaneous analysis of multiple targets. Due to their nanoscale dimension(s), nano-barcodes have been implemented favourably for bioimaging, in addition to their security and multiplex bioassay application. In designing nano-barcodes for a specific application, encoding techniques, synthesis strategies, and decoding techniques need to be considered. The encoding techniques to generate unique multiple codes for nano-barcodes are based on certain encoding elements including optical (fluorescent and non-fluorescent), graphical, magnetic, and phase change properties of nanoparticles or their different shapes and sizes. These encoding elements can generally be embedded inside, decorated on the surface of nanostructures or self-assembled to prepare the nano-barcodes. The decoding techniques for each encoding technique are different and need to be suitable for the desired applications. This review will provide a thorough discussion on designing nano-barcodes, focusing on the encoding techniques, synthesis methods, and decoding for applications including bio-detection, imaging, and anti-counterfeiting. Additionally, associated challenges in the field and potential solutions will also be discussed. We believe that a comprehensive understanding on this topic could significantly contribute towards the advancement of nano-barcodes for a broad spectrum of applications.
 Swati Shikha | Swati Shikha completed her bachelor's degree in Biotechnology from Vellore Institute of Technology, India, in 2011 and received her master's degree in Biotechnology from the Indian Institute of Technology, Kharagpur, India, in 2013. Currently, she is a PhD student at the National University of Singapore (NUS). Her research focuses on the use of encoded beads for multiplexed bio-detection. |
 Thoriq Salafi | Thoriq Salafi earned his bachelor degree in Biomedical Engineering from the National University of Singapore (NUS). Currently, He is enrolled for PhD and MBA double degree program at NUS Graduate School for Integrative Sciences & Engineering (NGS) and NUS Business School. His current research focuses on multiplexed detection of biomolecules and microfluidic bioparticle sorting and detection for medical diagnostics. |
 Jinting Cheng | Jinting Cheng is a research scientist at the Institute of Materials Research and Engineering (IMRE), Agency for Science, Technology and Research (A*STAR), Singapore. Her current research focuses on the development of functional bead platforms and other functional surfaces and materials for medtech, healthcare and consumer care applications. |
 Yong Zhang | Yong Zhang is a Provost's Chair Professor of the Department of Biomedical Engineering, National University of Singapore (NUS), and a senior member of NUS Graduate School for Integrative Sciences and Engineering (NGS). His current research interests include nanobiophotonics, nanomedicine, biomaterials and biomedical microdevices. |
1. Introduction
Barcodes are readable tags used widely to track and identify vast amount of information of the macroscopic world in our daily lives. Traditional barcodes are composed of parallel lines/bars of different widths with spaces in between, which led to the origin of the term “bar-codes”. Unlimited number of unique codes could be generated by changing the number of bars, their width, and spaces in between. These macroscopic barcodes are present in different products from grocery stores, stationery stores, parcels, letters, as well as in healthcare settings for rapid, simple, and accurate identification of the target.1,2 Owing to their benefits, use of barcodes has been immensely explored at much smaller scales with micron- and nano-sizes for their desired use in a wide range of applications ranging from bio-detection to anti-counterfeiting.Micron- and nano-sized structures can be encoded with different elements to form micro- and nano-barcodes with varied properties including different sizes, shapes, colour, etc., unlike the parallel line bars of typical macroscopic barcoding. Consequently, the definition of barcode has relaxed to include readable tags of all shapes, sizes, colours and other properties, thereby going beyond the bars as codes. Micro-barcodes display efficient binding, and are easy to handle and detect, thereby accelerating their wide use in multiplex bioassays.3–5 Luminex's xMAP technology using dye encoded microbeads is one such example that has been commercially established.6 However, the size of micro-barcodes becomes a limiting factor for certain applications such as imaging and labelling of cells and biomolecules. In this regard, nano-barcodes have been utilized for various applications due to their advantages pertaining to nanoscale dimension, including large surface area to volume ratio, unique physical and optical properties and widely established preparation strategies.7–13 The smaller size of nano-barcodes allows them to identify smaller sized targets for use in imaging applications. The nanostructures as encoding carriers are encoded by unique signatures to prepare distinct codes. These signatures can be referred to as encoding elements and could be optical (fluorescent and non-fluorescent), magnetic, and phase change nanoparticles or different shapes and sizes. These encoding elements can be embedded inside, decorated on the surface of nanostructures or self-assembled to prepare the nano-barcodes. The encoding carriers and encoding elements being used can be pre-formed or synthesized from precursors during the encoding process. The nano-barcodes, in general, should be easy to prepare, robust and reproducible, and have large coding capacity.
Wide varieties of nano-barcodes such as encoded nano-beads, -wires, -clusters, -rods, -tubes, -sheets, -stars, -disks, -pillars, nanoscale metal organic frameworks (NMOF), and -bio-barcodes have been developed thus far. With the availability of a plethora of nano-barcodes, they have been employed for many applications such as detection of biomolecules (nucleic acid and proteins), imaging, security, drug delivery, theranostics, etc.7,11,14–21 Decoding of signals from these nano-barcodes depends on their encoding technique. For instance, nano-barcodes with fluorescent encoding elements requires fluorescence microscopy or spectra measurement for detection, whereas nano-barcodes of different light reflectivity pattern can be read out by reflectance optical microscopy. Despite the tremendous progress made so far, each type of nano-barcode has certain limitations pertaining to the method of encoding. Fluorescent nano-barcodes have a limited number of barcodes due to spectral overlap of fluorescent encoding elements such as organic dyes. Barcodes based on the sequence of biomolecules, on the other hand, are not stable under extreme conditions of temperature and pH. Moreover, detection instruments employed are mostly bulky, costly and require trained personnel for operation, making the readout difficult. Additionally, unlike micro-barcodes, the use of nano-barcodes for point-of-care diagnostics is challenging because of their smaller size and complex decoding. Therefore, the design of nano-barcodes for specific applications needs to be carefully considered.
This review first discusses different encoding techniques to prepare nano-barcodes and the benefits/limitations of each type along with their decoding methods. Next, diverse strategies to prepare different types of nano-barcodes, their advantages and disadvantages in generating nano-barcodes with desired properties are presented. To keep the scope of the review narrow, the use of nano-barcodes is kept restricted for bio-detection, imaging and security applications. Lastly, current challenges and potential solutions in the field are discussed.
2. Encoding techniques
Nanostructures of different geometries have been encoded by different encoding elements to prepare vast varieties of barcodes including encoded nanobeads, nanoclusters, nanowires, nanorods, nanotubes, nanostars, nanodisks, nanopillars, NMOF, and sequence-barcodes, as shown in Fig. 1.11–16,21–28 The geometry of nano-barcodes influences their role in different applications. For instance, compared to the spherical shape, encoded nano-disks were demonstrated to be helpful in cell labelling or drug delivery applications, where it was found to bind to the cell without perturbing the cellular functions.27 On the other hand, architecture of nanosheets provided flexibility and accessibility to incorporate the encoding elements.28 Similarly, the tunability and biodegradability of NMOF make them favourable nanostructures for use in imaging applications.29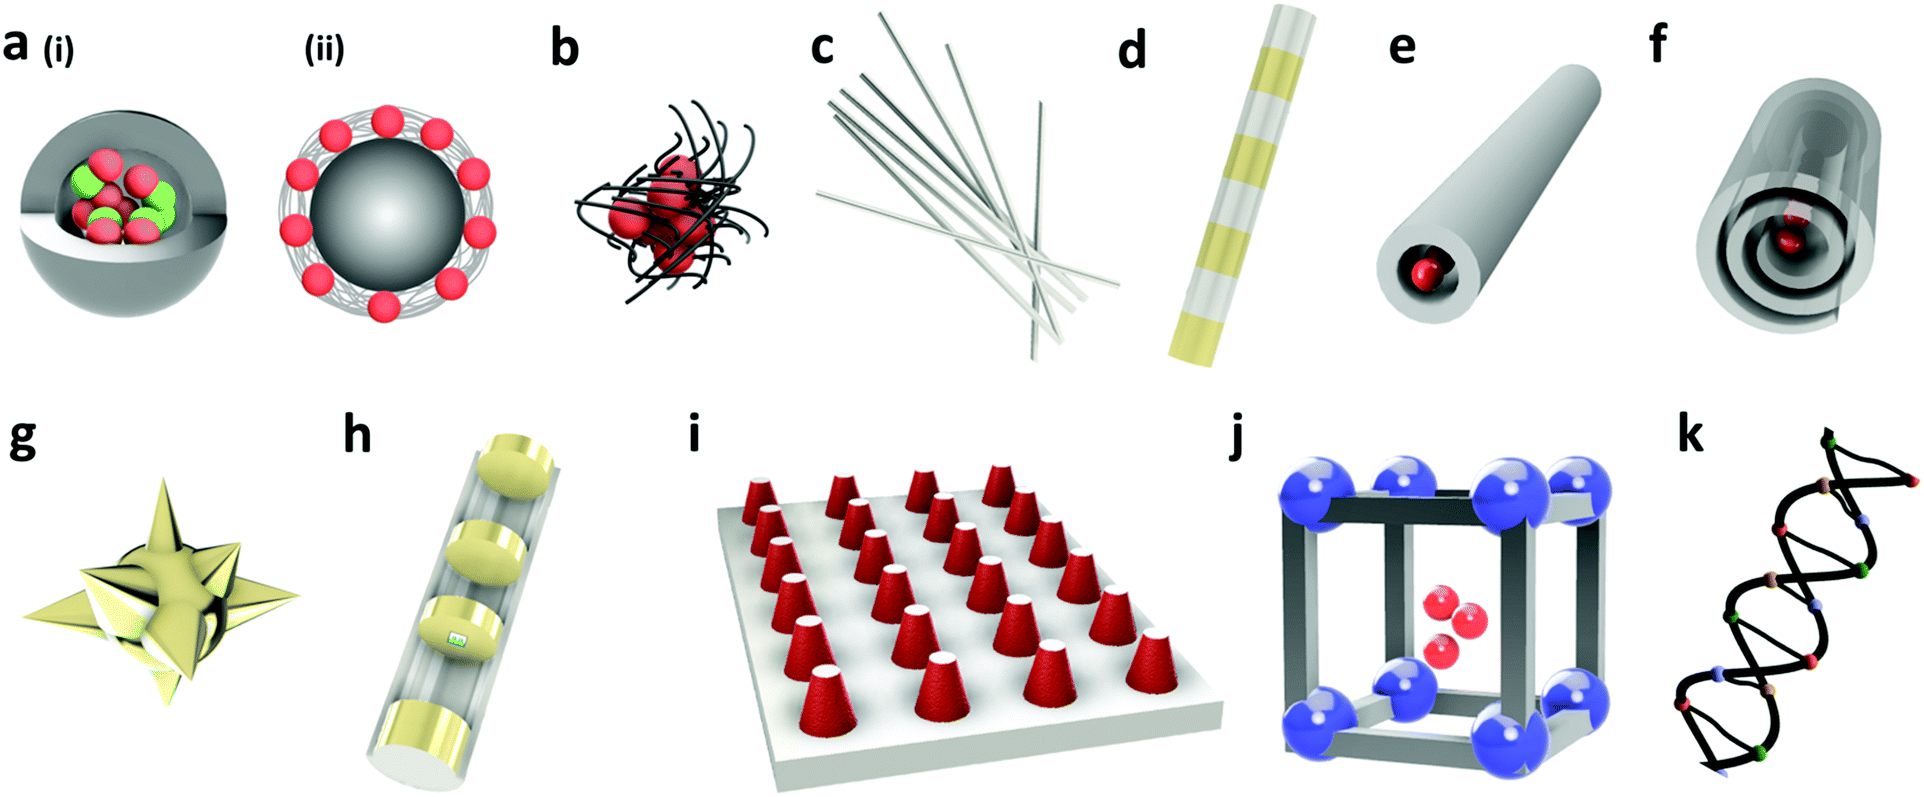 | ||
| Fig. 1 Schemas for different barcoded nanostructures of different geometries. Encoded (a) nanobeads with encoding elements (i) encapsulated inside, and (ii) decorated on the surface; (b) nano-clusters, where nanoparticles are assembled as super-particles and stabilized by polymers; (c) nano-wire array which has nanoscale diameter and length up to several microns; (d) nanorods with different metal compositions in a striped pattern; (e) nano-tube cross-section showing nanoparticles encapsulated inside; (f) nano-sheets with nanoparticles loaded inside; (g) nano-stars that are branched nanostructures with small cores prepared from metal nanoparticles; (h) nano-disks with disk-shaped structures; (i) nano-pillars with pointed top ends and tapered bases; (j) NMOFs consisting of coordination bonds between metal ions and organic linkers with fluorescent nanoparticles encapsulated inside and (k) sequence-barcodes made of oligonucleotide (or peptides) sequences as encoding elements. Note that the encoding elements on each nanostructure depicted are only for representation and can be changed to other elements. | ||
Synthesis of these nano-barcodes relies on different properties of encoding elements including optical, graphical, morphological, magnetic and thermal encoding to cater to a wide range of applications (Table 1). Combinations of different encoding methods have also been explored which utilizes the advantages of different encoding techniques and increases the number of barcodes. The selection of nano-barcodes varies based on the application and each encoding technique has a unique read out mechanism. For instance, imaging application prefers fluorescence encoding with an easier readout method. On the other hand, anti-counterfeiting application favours a barcode that is covert or invisible to the naked eye, and difficult to be decoded. Notably, a particular geometry of barcode can be encoded with different encoding elements and vice versa (one encoding element can be used to encode nanostructures with different geometries). The detection method, however, depends on the type of encoding technique used to prepare the nano-barcode. For instance, fluorescent nanoparticle encoded barcodes (optical encoding) can be detected by fluorescent spectroscopy or microscopy, whereas nano-barcodes of different melting peaks (phase change encoding) would require differential scanning calorimetry for detection. In another scenario, when the barcode combines more than one different types of encoding techniques, the method of detection could also be integrated accordingly. In general, the encoding technique should provide a desired number of stable nano-barcodes, with least overlap between the codes, sample, and labels used in the whole system. In some cases, they should be biocompatible and uniform in shape, size and encoding element distribution in the encoding carrier. This section discusses the different encoding methods with their advantages and disadvantages.
| Encoding methods | Encoding element | Advantages | Disadvantages | Reported number of barcodes | Readout | Ref. |
|---|---|---|---|---|---|---|
| Fluorescence emission-based nano-barcodes | Organic dye | Inexpensive, wide range of commercial availability | Photobleaching, requires multiple wavelength excitation, broad emission spectra | 7 codes have been reported, can go up to Yn codes43 | Fluorescence microscopy and spectroscopy | 36–39 and 43 |
| QDs | Photostable, tunable excitation and emission spectra, narrow emission band, high quantum yield due to quantum confinement | Cytotoxicity, photoblinking | 8 codes have been reported, can go to more than one million33 | Fluorescence microscopy and spectroscopy | 12, 23 and 166–169 | |
| CDs | Low toxicity, high biocompatibility, bright fluorescence | Excitation by UV, fluorescence mechanism not well understood | 4 different codes for GQDs, 4 for CNDs, and 3 for PDs85 | Fluorescence microscopy and spectroscopy | 86, 87 and 89 | |
| Lanthanide-doped nanocrystals (down- and upconverting) | Photostable, tunable excitation and emission spectra | Multi-colour emission, lower quantum yield compared to organic dye and QD | 6 codes have been reported, can go up to Xn codes13 | Fluorescence microscopy and spectroscopy | 13, 24, 111, 118, 143 and 170 | |
| Fluorescence kinetics-based nano-barcodes | Fluorescence lifetime (time-domain) | Nil autoflourescence, non-blinking, can be excited by low energy | Complex and slower decoding method | 8 codes have been reported118 | Orthogonal scanning automated microscopy | 118 |
| Phase angle (frequency-domain) | Nil autofluorescence, high signal to noise ratio | Requires several modulation cycles for decoding | 19 codes have been reported17 | Frequency-domain fluorescence lifetime measurement system | 17 | |
| Non-fluorescent optical barcodes | Structural colour code | No photobleaching | Limited number of barcodes | 6 codes have been reported, can go up to Xn codes124 | Reflection spectroscopy, optical microscope in reflection mode | 123–125 |
| SERS | Very sensitive, narrow spectra | Requires gold/silver surface | 10 codes have been reported, can go up to 2n − 1 codes132 | Raman spectrophotometer, confocal Raman microscopy | 128, 129, 132 and 171 | |
| Graphical | Fluorescence pattern, optical pattern | Unlimited codes, easy decoding method | Long fabrication process required for each code | 7 codes have been reported, can go up to 26n codes to 300 million136 | Fluorescence and optical microscopy | 140 and 171–174 |
| Sequence | DNA | Easy to generate the code, unlimited code | Unstable at extreme temperature and pH | 96 codes have been reported, can go up to 4n![[thin space (1/6-em)]](https://www.rsc.org/images/entities/char_2009.gif) 153 153 |
DNA sequencer | 149–151 |
| Peptide | 11 peptides design has been reported, can go up 20n to 500n148 |
Mass spectrophotometry | 147, 148 and 152 | |||
| Morphological | Shape | Generate distinct barcode | Complex preparation step, limited number of encoding | 4 shapes have been reported, limited capacity154 | Electron microscopy | 154 |
| Size | Easy to prepare | Limited number of encoding | 3 codes have been reported, limited capacity155 | Atomic force microscopy, Electron microscopy | 155 | |
| Magnetic | Magnetic property | Easy to handle and separation using an external magnetic field | Limited number of encoding | 3 codes have been reported, limited capacity156 | Vibrational sample magnetometer | 9, 156 and 157 |
| Phase change | Solid–liquid phase change | Stable under harsh conditions, e.g. explosion, can generate high number of distinct barcodes | Difficult read out mechanism | 15 codes have been reported, can go up to 1023 codes with 10 different metals160 | Differential scanning calorimetry, infra-red camera | 10 and 158–160 |
2.1 Optical encoding
In optical encoding, optical properties of the encoding element such as fluorescence spectra, lifetime, and light scattering properties are utilised. Depending on the type of optical material used, optically encoded nano-barcodes can be emission colour based fluorescent (organic dyes, quantum dots, carbon dots, lanthanide nanocrystals) or non-fluorescent (photonic crystals, Raman codes). Some barcodes also harness additional encoding parameters such as fluorescence kinetics, including lifetimes and phase angle of the fluorophores.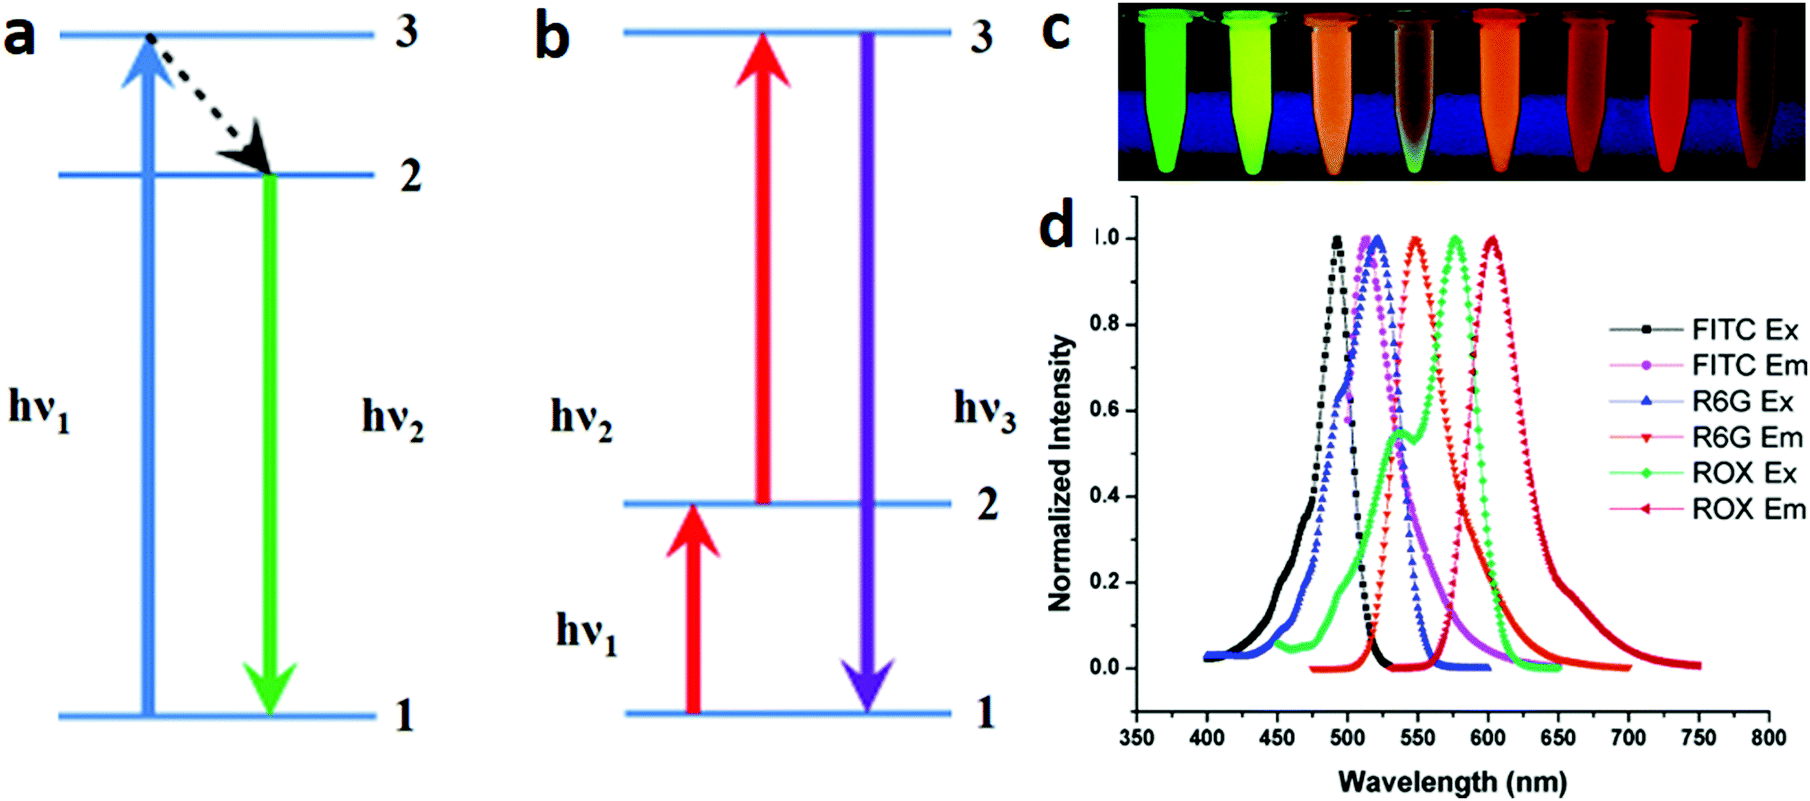 | ||
| Fig. 2 Fluorescent encoding element based optical barcodes. Schemas showing the mechanisms of (a) the downconversion emission process, where a high-energy excitation photon (hν1) gets absorbed by the system in ground state 1 and excites the electron to excited state 3. The unstable electron undergoes non-radiative decay to a lower-excited state 2, followed by relaxation to the ground state accompanied by the emission of a lower-energy photon (hν2), and (b) upconversion emission processes, where excitation photon (hν1) gets absorbed by the system in ground state 1 and excites the electron to metastable excited state 2. The electron gets further excited to state 3 with the sequential absorption of another photon (hν2) and finally, relaxes back to the ground state accompanied by the emission of a photon with higher energy (hν3) than the individual excitation photons.34 (c) Organic dye based encoding of nanoparticles doped with different ratios of fluorescein isothiocyanate (FITC), rhodamine 6G (R6G) and carboxy-X-rhodamine (ROX) dyes to generate fluorescence resonance energy transfer (FRET) mediated codes.35 The selection of these dyes was based on their spectral overlapping to enable the FRET process and generate multiple emission signal under single wavelength excitation. (d) Spectra showing normalised excitation and emission peaks of the three dyes.35 Figure panels reproduced from ref. 34, with permission from Nature Publishing Group, copyright 2013; ref. 35 with permission from the American Chemical Society, copyright 2006. | ||
2.1.1.1 Organic dye encoded nano-barcodes. Out of the previously mentioned candidates of fluorescent encoding elements, organic dyes have been widely used with advantages of high quantum yield, low cost, and commercial availability of different types. Because of their small size, organic dyes could be used for detection down to the molecular level. Organic dyes have been used to encode nanoparticles, nanobeads, nanotubes, nanowires, NMOF and sequences to generate nano-barcodes.36–39 Dye encoded nanobeads are also available commercially which are vastly used for different applications. However, organic dyes suffer from several disadvantages such as photobleaching, limited number of colour codes due to spectral overlap and the need to use multiple excitation light sources for each dye, thereby making the readout complex and costly.30 Furthermore, most of the conventional organic dyes suffer from aggregation at the high loading concentration used to prepare the nano-barcodes. During aggregation, the structure of these dyes allows their molecules to arrange in π–π stacking. This leads to aggregation-caused quenching (ACQ) that subsequently causes significant loss of emission intensity, thereby restricting their use in the preparation of nano-barcodes. Some efforts have been made to overcome these shortcomings. Inorganic dyes, such as Rubpy and Osbpy, with better photostability have been developed to be encapsulated inside silica nanoparticles to prepare the nano-barcodes.40 To achieve single wavelength excitation, fluorescence resonance energy transfer (FRET) has been employed to generate tunable codes by using different dyes as FRET donors and acceptors, as shown in Fig. 2c and d.35,41,42 To increase the encoding capacity, the organic dye-based nano-barcodes can be prepared by mixing the organic dyes in different ratios. For instance, organic fluorophores of red and green emissions have been used for DNA nano-barcodes to achieve 7 different codes.43
Additionally, to solve the problem of ACQ pertaining to conventional organic dyes, aggregation-induced emission (AIE) active dyes were developed that exhibit enhanced fluorescence upon aggregation, with emission ranging from red to blue colour. The structure of these dyes restricts the intramolecular rotation for π–π stacking to happen, thereby allowing enhanced emission in aggregated form.44 AIE-active dyes have been encapsulated inside silica nanoparticles to prepare the nano-barcodes.45,46 Very recently, a 1,8-naphthalimide derivative fluorophore, a new organic dye, was designed to prepare encoded silica nanoparticles and demonstrated for mitochondrial imaging.46 Another AIE-active dye, 10-cetyl-10H-phenothiazine-3,7-(4,40-aminophenyl)acetonitrile, has also been used to prepare nano-barcodes and was demonstrated for successful uptake by HeLa cells, thereby unleashing their potential to be used for biological applications.45
Despite the improvements, inorganic fluorescent nanoparticles such as QDs and lanthanide-doped nanocrystals have proven to be better alternatives with several advantages over organic dyes as discussed next.
2.1.1.2 Quantum dot encoded nano-barcodes. Quantum dots (QDs) are semiconductor nanocrystals usually composed of elements of groups II–VI (e.g. CdSe, CdTe, ZnSe), III–V (e.g. InAs, InP), IV–VI (e.g. PbSe, PbS), and I–III–VI (e.g. CuInS2, CuInSe, AgInS2) of the periodic table. They have dimensions typically in the range of 1–20 nm that is smaller than the exciton Bohr radius of the bulk material.47,48 Compared to organic dyes, QDs have numerous benefits such as photostability, brighter fluorescence, narrow and tunable emission peaks and single wavelength excitation favouring their use for preparing fluorescent barcodes (Fig. 3a). Tunability can be achieved by changing the composition or size (for the same composition), thereby generating multiplex codes. The encoding capacity of the QDs is C = Nm − 1, where N is the number of emission intensity and m is the number of emission colours, based on which theoretically more than one million codes can be achieved. Like organic dyes, most of them are downconverting in nature and possess broad excitation band and emission range from the UV-visible to the NIR region.49,50 However, use of QDs for certain applications is challenging due to their cytotoxicity and photoblinking.51,52 For instance, in cell labelling, QD precipitation on the cell surface or release of QD precursor ions (Cd2+) damages cell functioning.53,54 Photoblinking, on the other hand, leads to intensity fluctuations thereby hampering the signal efficiency and reliability.49 Preparing Cd-free QDs, surface coating and incorporating QDs into polymer or silica matrices are ways developed to address the toxicity issue.55–58 Preparing core–shell (e.g., CdSe/CdS) or core-alloyed interface-shell QDs with thicker shells has helped suppress the blinking behaviour.59–63 QDs have been explored to prepare barcodes for bio-detection, cell labelling, imaging, anti-counterfeiting and other applications by putting them in/on nanospheres, nanoclusters, nanosheets, nanorods, nanotubes, nanowires and nanodisks.33,64–79
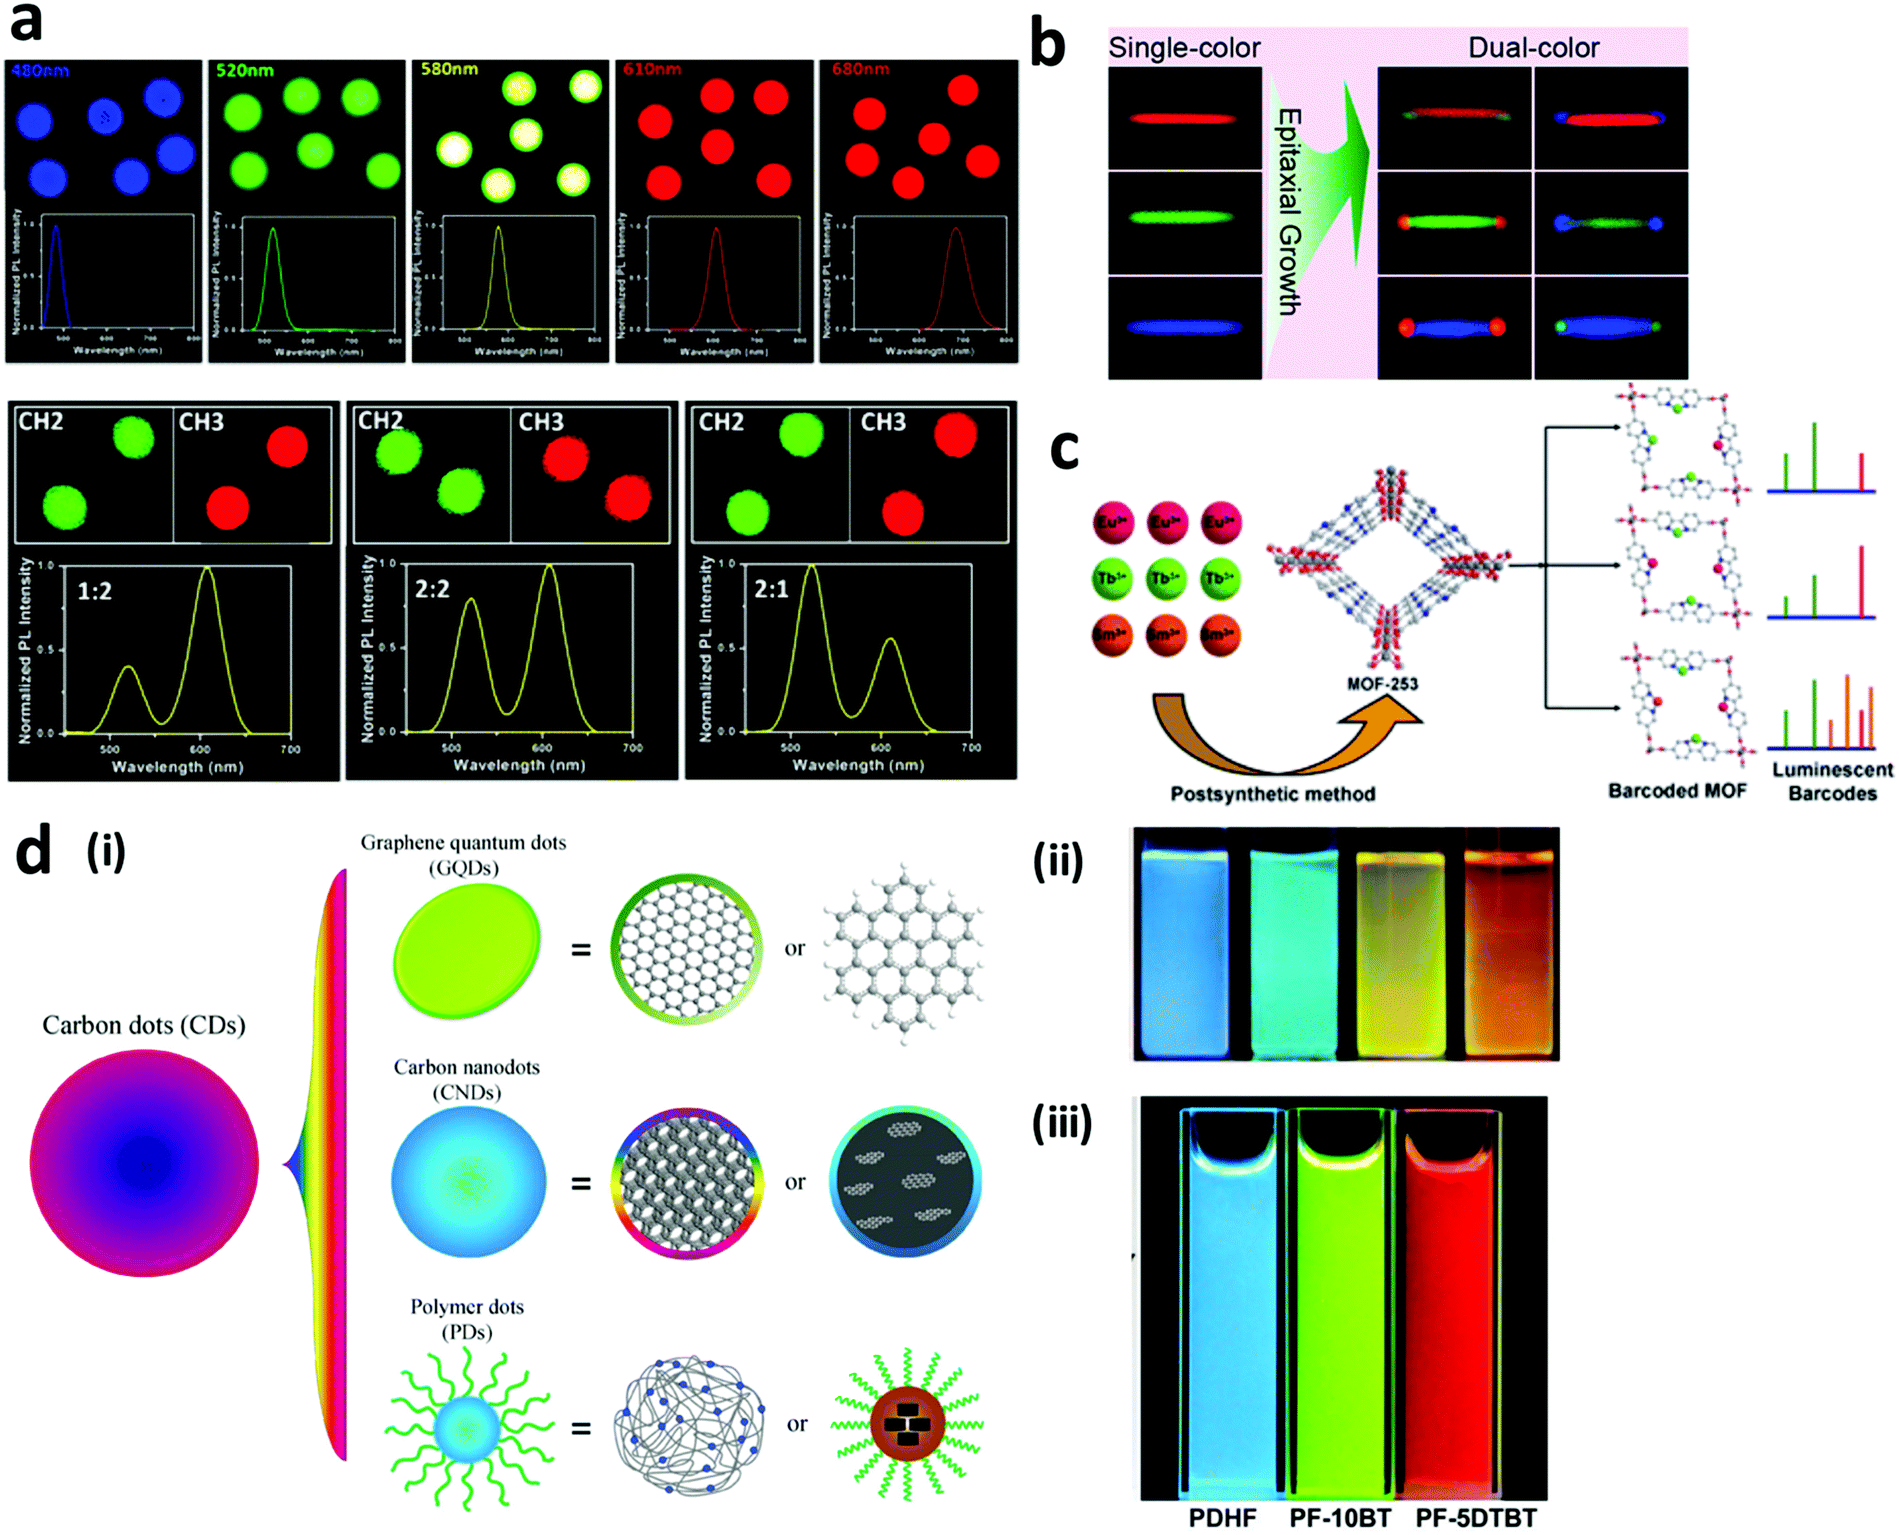 | ||
| Fig. 3 Inorganic fluorescent nanoparticle based barcodes. (a) Fluorescent microscopy and corresponding spectra for QD barcodes with single colour (top panel) and dual colours (down panel) excited by single excitation wavelength at 488 nm.3 (b) Upconversion nanocrystal encoded nanorods displaying dual-colours based on different combinations of three primary colours.80 (c) NMOF encoded with different lanthanide ions (Eu3+, Tb3+ and Sm3+) to generate fluorescent barcodes.81 (d) Carbon dots of (i) three types: graphene quantum dots, carbon nanodots, and polymer dots.82 Photographs of (ii) carbon nanodots,83 and (iii) polymer dots under UV light excitation.84 Figure panels reproduced from ref. 3 with permission from American Chemical Society, copyright 2013; ref. 80 with permission from American Chemical Society, copyright 2014; ref. 81 with permission from the Royal Society of Chemistry, copyright 2014. ref. 82 with permission from Springer, copyright 2014; ref. 83 with permission from Wiley, copyright 2010; ref. 84 with permission from Wiley, copyright 2014. | ||
2.1.1.3 Fluorescent carbon dot encoded nano-barcodes. Fluorescent carbon dots (CDs) are small carbon nanoparticles of size less than 10 nm. They can be classified as graphene quantum dots (GQDs), carbon nanodots (CNDs), and polymer nanodots (PDs), as depicted in Fig. 3d. GQDs are composed of small graphene fragments arranged in one or more layers and their fluorescence behaviour is mainly attributed to the quantum effect. On the other hand, CNDs are spherical in shape and the fluorescence properties do not arise from the dot. The fluorescence emission can be tuned from blue to NIR by modulating the synthesis and/or purification steps. When a polymer is conjugated with the dots, the resulting CDs are referred to as PDs, with the polymer providing the fluorescent properties and imparting stabilization and passivation.82,85
These CDs are in high demand owing to their advantages including lower toxicity, higher biocompatibility and higher fluorescence compared to QDs. Most of the CDs, however, are excited by UV light, thereby posing limitations such as autofluorescence and inability to use in some of the biological applications. Additionally, high-throughput and efficient synthesis processes need to be developed for fabricating high quality CDs. Furthermore, the fluorescence mechanism of CDs is not studied sufficiently and needs to be understood further to harness their potential.
Thus far, these fluorescent CDs have been used to prepare nano-barcodes for various applications.82 For instance, GQDs have been encapsulated in silica nanoparticles and decorated on the surface of nanobeads or other substrates for bioimaging and detection applications.86,87 Fluorescent GQDs have also been incorporated into a matrix of NMOF and hold potential for biological applications.88 Similarly, fluorescent CNDs have been encapsulated in NMOF with potential to serve as a multifunctional platform for biological applications.89–92 Fluorescent CNDs have also been decorated on the surface of silver nanoparticles for bio-detection.93 Compared to the GQDs and CNDs, PDs are very novel and not yet explored very well. Fluorescent PDs were encapsulated in silica nanoparticles to prepare fluorescent nano-barcodes to be used for bio-detection and bioimaging applications.94,95
2.1.1.4 Lanthanide nanocrystal encoded nano-barcodes. Lanthanide-doped nanocrystals consist of an inorganic host matrix doped with various lanthanide ions as sensitizers and activators. The energy is absorbed by sensitizers and transferred to activators, which then emit light of a certain wavelength. Based on the process of energy conversion they can be downconversion or upconversion nanocrystals.96–100 In the downconversion process, the doped lanthanide ions absorb high energy and generate Stokes-shifted emission. On the other hand, in upconversion nanocrystals absorption of two or multiple photons of lower energy leads to the emission of higher energy light with a narrow emission band. The phenomenon is referred to as anti-Stokes shift and the emission of a specific wavelength is governed by the energy levels of the activator. Both lanthanide-doped down- and upconversion nanocrystals offer advantages such as photostability, single wavelength excitation, narrow and tunable spectra with little spectral overlap.96,101,102 Upconversion nanocrystals offer additional benefits over downconversion nanocrystals such as large anti-Stokes shift, minimal background noise due to low autofluorescence, and low photodamage to biological samples due to NIR excitation.103,104 Lanthanide nanocrystal-based nano-barcodes can generate up to Nm − 1 codes, where N is the number of emission intensity and m is the number of colours. Using this principle, 6 different fluorescence codes have been reported.13 However, lanthanide-doped upconversion nanocrystals have a major disadvantage of fluorescence quenching due to dopant ion concentration based cross-relaxation, surface ligands, crystal defects and choice of solvent.101,104–106 Attempts have been made to solve these issues by careful selection of solvent and concentration, and engineering the design of nanocrystals and distance between the dopant ions.103,107–110 Exploiting the benefits of lanthanide-doped down-conversion and up-conversion nanocrystals, fluorescent nano-barcodes (Fig. 3b and c) have been developed.80,111–114 Furthermore, lanthanide ions have also been encapsulated in NMOF to prepare fluorescent barcodes.81,115
2.1.2.1 Fluorescence lifetime encoding. Tuning of the luminescence lifetime is one of the methods that utilize the temporal domain of the luminescence instead of its spectral domain. Although fluorescence lifetime encoding with organic dyes and QDs has been developed, these materials have short lifetimes, ranging from <10 ns for organic dyes and 10 to 100 ns for QDs.116 This results in the interference of excitation signals and difficulty in distinguishing the different lifetime codes. In this regard, rare earth metals with a wide luminescence lifetime ranging from micro to milliseconds are preferred. A lanthanide based downconversion nanoparticle has been used for lifetime encoding using the luminescence resonance energy transfer (LRET). The usage of different concentrations of europium ions and cationic coumarin as the donor and acceptor dyes in the LRET resulted in different luminescence lifetimes.117 Furthermore, the luminescence lifetime decay of upconversion nanoparticles, referred to as “τ-dots”, has been explored for multiplex bioassay.11 This upconversion luminescence lifetime decay can be tuned by changing the distance of the sensitizer to the emitter to obtain unique lifetime decay codes. By modulating the Tm doping concentration from 4 to 0.2 mol% with 20 mol% of Yb, the lifetime is tuned from 48.6 μs to 668 μs, as can be seen in Fig. 4a.118 The work reported 8 different distinct lifetime codes using this method, and the number of codes can be further increased by fine-tuning the ratio of Tm doping.
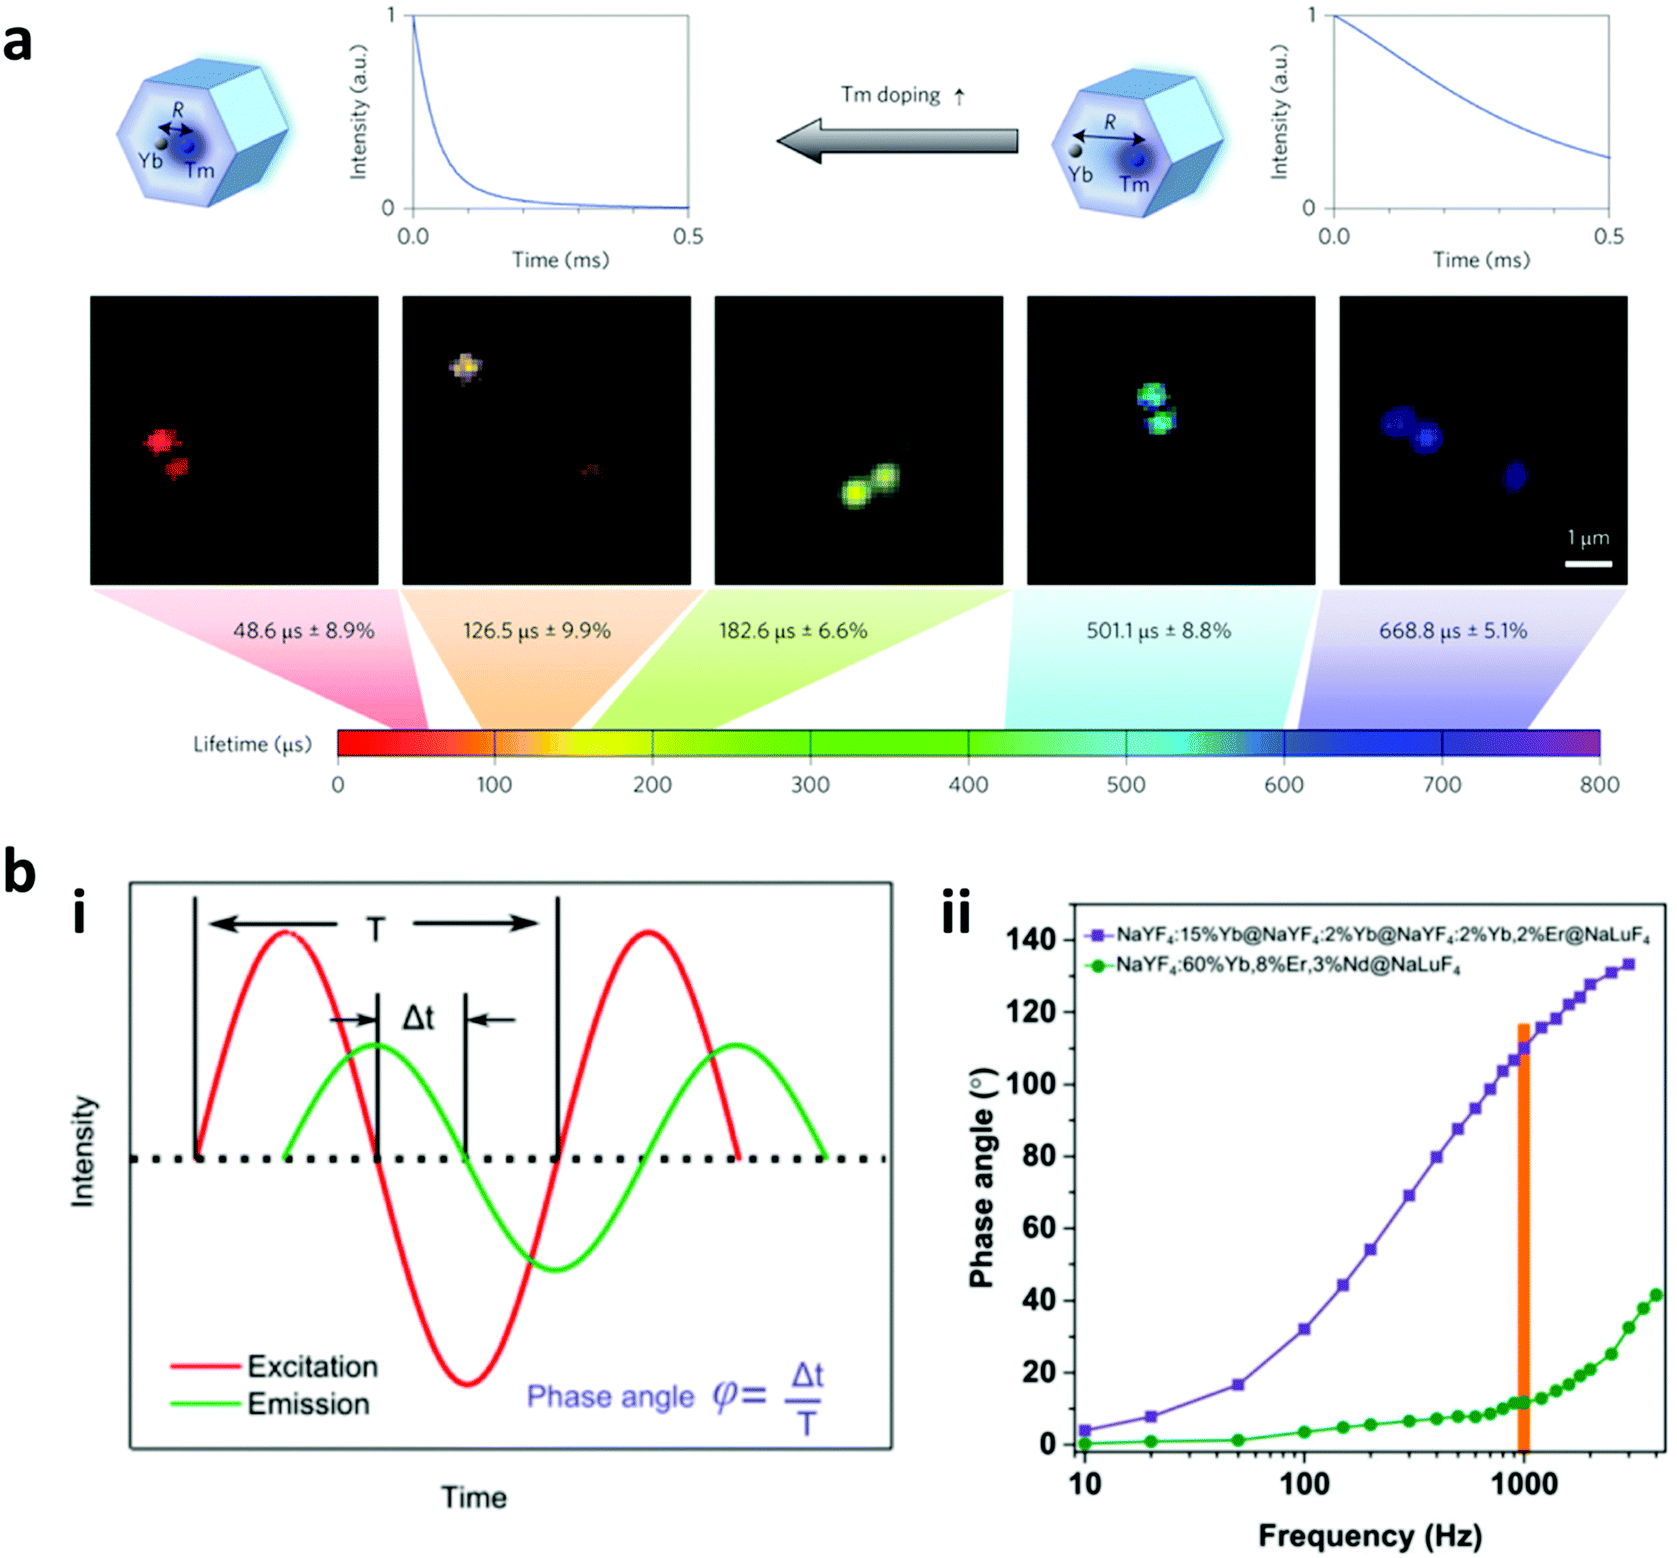 | ||
| Fig. 4 Fluorescence lifetime and phase angle encoding. (a) Lifetime encoding is produced by changing Tm doping in the upconversion nanoparticle, and the luminescence lifetime can be tuned from 48.6 to 668.8 μs;118 (b) Frequency-domain fluorescence encoding shows that (i) the ratio between the phase lag of sinusoidal excitation light and the emission with the modulation period results in the phase angle encoding. (ii) The management of kinetics of the upconversion nanoparticles is able to achieve high difference in the phase angle measurement at different frequencies.17 Figure panels reproduced from ref. 118 with permission from Nature Publishing Group, copyright 2014; ref. 17 with permission from the Royal Society of Chemistry, copyright 2017. | ||
Of note, the fluorescence lifetime of an organic fluorophore can be increased from a few nanoseconds to more than 100 ns by coupling the organic fluorophore with CdS/ZnS QDs by the process of FRET.119 The QDs act as the FRET donor and the excitation of QDs results in the transfer of energy to the acceptor of the organic fluorophore which leads to the longer emission lifetime of the fluorophore, as the effective lifetime of this emission depends on the lifetime of the donor. Multiplex measurements of the fluorescence lifetime, hence, can be performed by using the organic fluorophore coupled with different donor nanoparticles with different lifetimes.120 For instance, the organic fluorophore ATTO590 dye coupled with CdS/ZnS QDs displayed a higher lifetime of more than 100 ns as compared to the coupling with gold nanoparticles with a lifetime of a few nanoseconds. Furthermore, the doping of transition metals such as Mn inside the ZnS shell was able to significantly improve the fluorescence lifetime of the dye to the millisecond range and hence increased the multiplexing range of the method.121 This luminescence lifetime is read by time-gated orthogonal scanning automated microscopy (OSAM), which was further improved to the next generation time-resolved scanning cytometry system.122 Furthermore, a fast fitting algorithm has been developed to create an on-the-fly decoding system upon scanning cytometry.117 The lifetime measurement can also be decoded using fluorescence lifetime imaging microscopy.
The lifetime based barcode is robust as the detection is independent of the intensity of the fluorescence, has no blinking and autofluorescence.
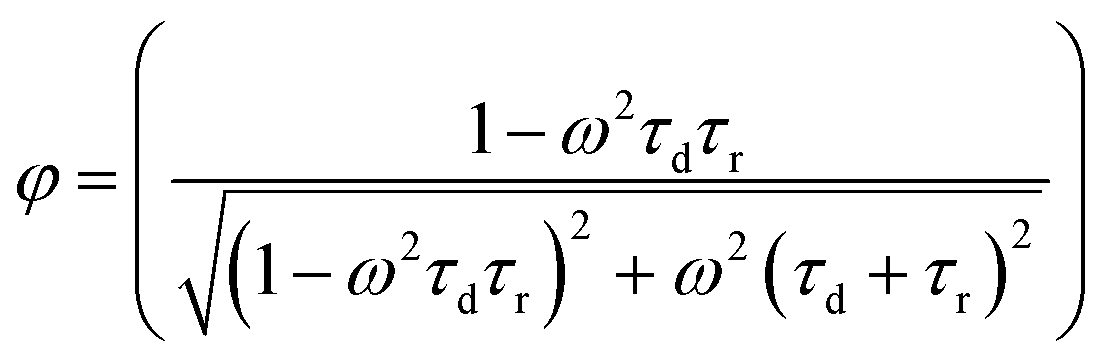
2.1.2.2 Phase angle encoding. Compared to the fluorescence lifetime encoding which uses the temporal domain, phase angle encoding uses the frequency-domain to create the barcode. After getting excited with harmonic wave excitation, the upconversion luminescence responds to the harmonic excitation with the same frequency, but with a phase lag. The phase angle depends on the ratio of the time lag to the harmonic wave modulation period (Fig. 4b). The phase angle (φ) is governed by both rise and decay times and can be expressed by the following equation:
where ω = modulation circular frequency, τd = decay time constant, and τr = rise time constant. By changing the rise and decay times, a wide range of phase angles can be obtained for generating a large number of unique codes. The rise/decay times of lanthanide-doped upconversion nanoparticles can be modulated by controlling the energy transfers between dopants present in their functional layer including the pumping layer (with sensitizer ions only), emitting layer as well as the quenching layer to create high capacity encoding.17 By tuning these parameters, 19 different combinations of codes have been reported, and the number of codes can be further expanded with finer tuning of the ratio compositions.8 As reported, high concentration of emitting layer dopants leads to short rise and decay times with a small phase angle following excitation under harmonic-waves. Furthermore, the addition of the pumping layer impacted the rise process by prolonging it, thereby leading to a larger phase angle, whereas the addition of the quenching layer caused a faster decay, which in turn led to a smaller phase angle. The phase angle is measured using a frequency-domain fluorescence lifetime measurement system.
The phase angle encoding has a superior signal-to-noise ratio as compared to lifetime encoding as the excitation intensity can be kept at a high level leading to strong emission while the lifetime excitation uses short pulses yielding a weak emission intensity. Furthermore, the dynamic range of the phase angle encoding (0°–180°) is larger than the lifetime encoding (equivalent to ∼0°–90°).17 However, the phase angle decoding method takes a relatively longer time due to the requirement of a few modulation cycles to get the reliable phase angle reading, thereby limiting the throughput of the decoding.17
2.1.3.1 Structural colour encoding. Structural colour is produced by the modulation or interference of light due to a structured surface. One of the structural colours can be generated through a photonic crystal as it is able to manipulate the light intensity and spectrum to create a structural colour code. A photonic crystal is typically nanoparticles in the form of periodic nanostructures which can modulate the refractive index, lattice constant or spatial symmetry, resulting in photonic bandgap properties.123,124 Light energy that falls in the bandgap will be reflected, which creates the different structural colour codes as can be seen in Fig. 5a and b.
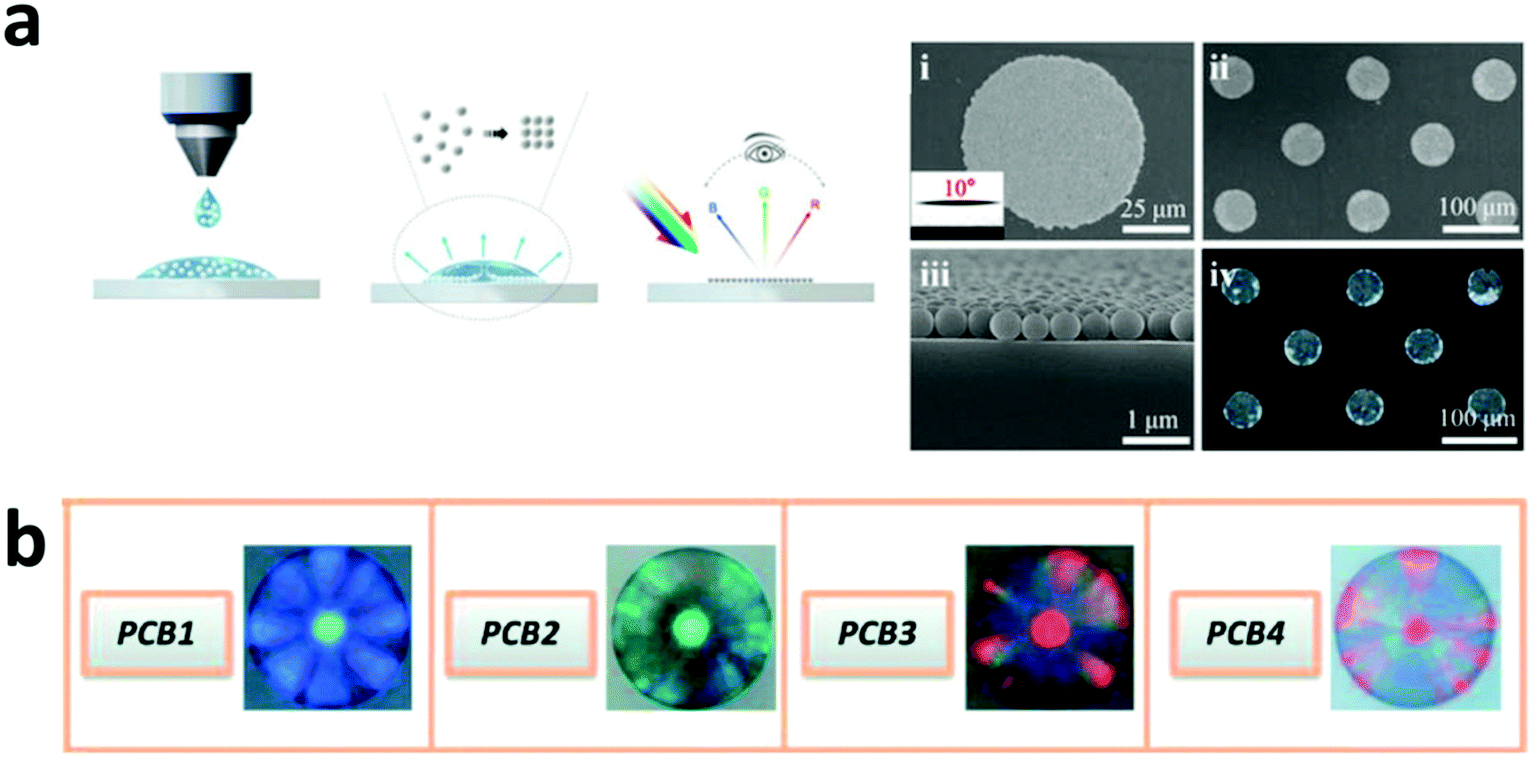 | ||
| Fig. 5 Structural colour encoding. (a) Photonic crystal based structural coding by the self-assembled monolayer method.123 (b) Microscope image of silica photonic crystal beads (PCBs) with wavelengths of 476 (PCB1), 505 (PCB2), 623 (PCB3), and 650 nm (PCB4).125 Figure panels reproduced from ref. 123 from Nature Publishing Group (CC BY); ref. 125 with permission from American Chemical Society, Copyright 2011. | ||
Monolayered self-assembled photonic crystals have been developed to provide interchangeable covert to overt structural colours based on the diffraction mechanism. The different light intensities and background influence the covert to the overt property of the photonic crystal code which can be used for anti-counterfeiting strategy.123 Colloidal photonic crystals dispersed in photocurable resins have also been proposed for anti-counterfeiting purposes.124 Furthermore, structural code from photonic crystal beads conjugated with antibody has also been used for multiplexed bioassays.125 Similar to the fluorescence emission codes, the structural colour from the colloidal photonic crystals can be combined in different ratios to achieve higher number of codes.124 For instance, red, green and blue colloidal photonic crystals can be combined to produce 3 additional structural colour codes.124 As compared to the fluorescence encoding, the photonic crystal encoding does not bleach, quench or suffer from interference. However, the photonic crystal codes are limited as the reflection peak is typically in the range of visible light.
2.1.3.2 SERS encoding. Raman scattering occurs due to the shift of monochromatic light based on the inelastic scattering due to the vibration or rotation of molecules. This scattering has very low efficiency and hence is difficult to detect. The development of surface enhanced Raman spectroscopy (SERS) improves the Raman scattering efficiency by using noble metal surfaces, including copper, silver, or gold layer on the detection surface. This SERS encoding can be in the form of nanowires of silver and gold,126,127 produced via an electrodeposition process. Furthermore, the SERS signal can be enhanced through the fabrication of nano gaps, which is achieved through the development of nanodisks with on-wire lithography (Fig. 6a). Additionally, there are different Raman reporter molecules with distinct Raman spectra that can be used to tag nanostructures/particles to produce barcodes, referred to as “SERS dots” as can be seen in Fig. 6b–d. Nano-barcodes based on nanobeads, nanostars, and nanopillar arrays conjugated with different Raman reporters have been reported.19,128,129 The signal decoding for SERS based encoding can be achieved through a Raman spectrometer and a Raman microscope.128 In addition to the traditional spectrometers, a confocal Raman microscope has been used to decode the SERS signal from silver and gold nanodisk codes.126,127 A Raman microscope was also used for decoding the SERS-based molecular beacon for multiplexed detection of viral RNA.130
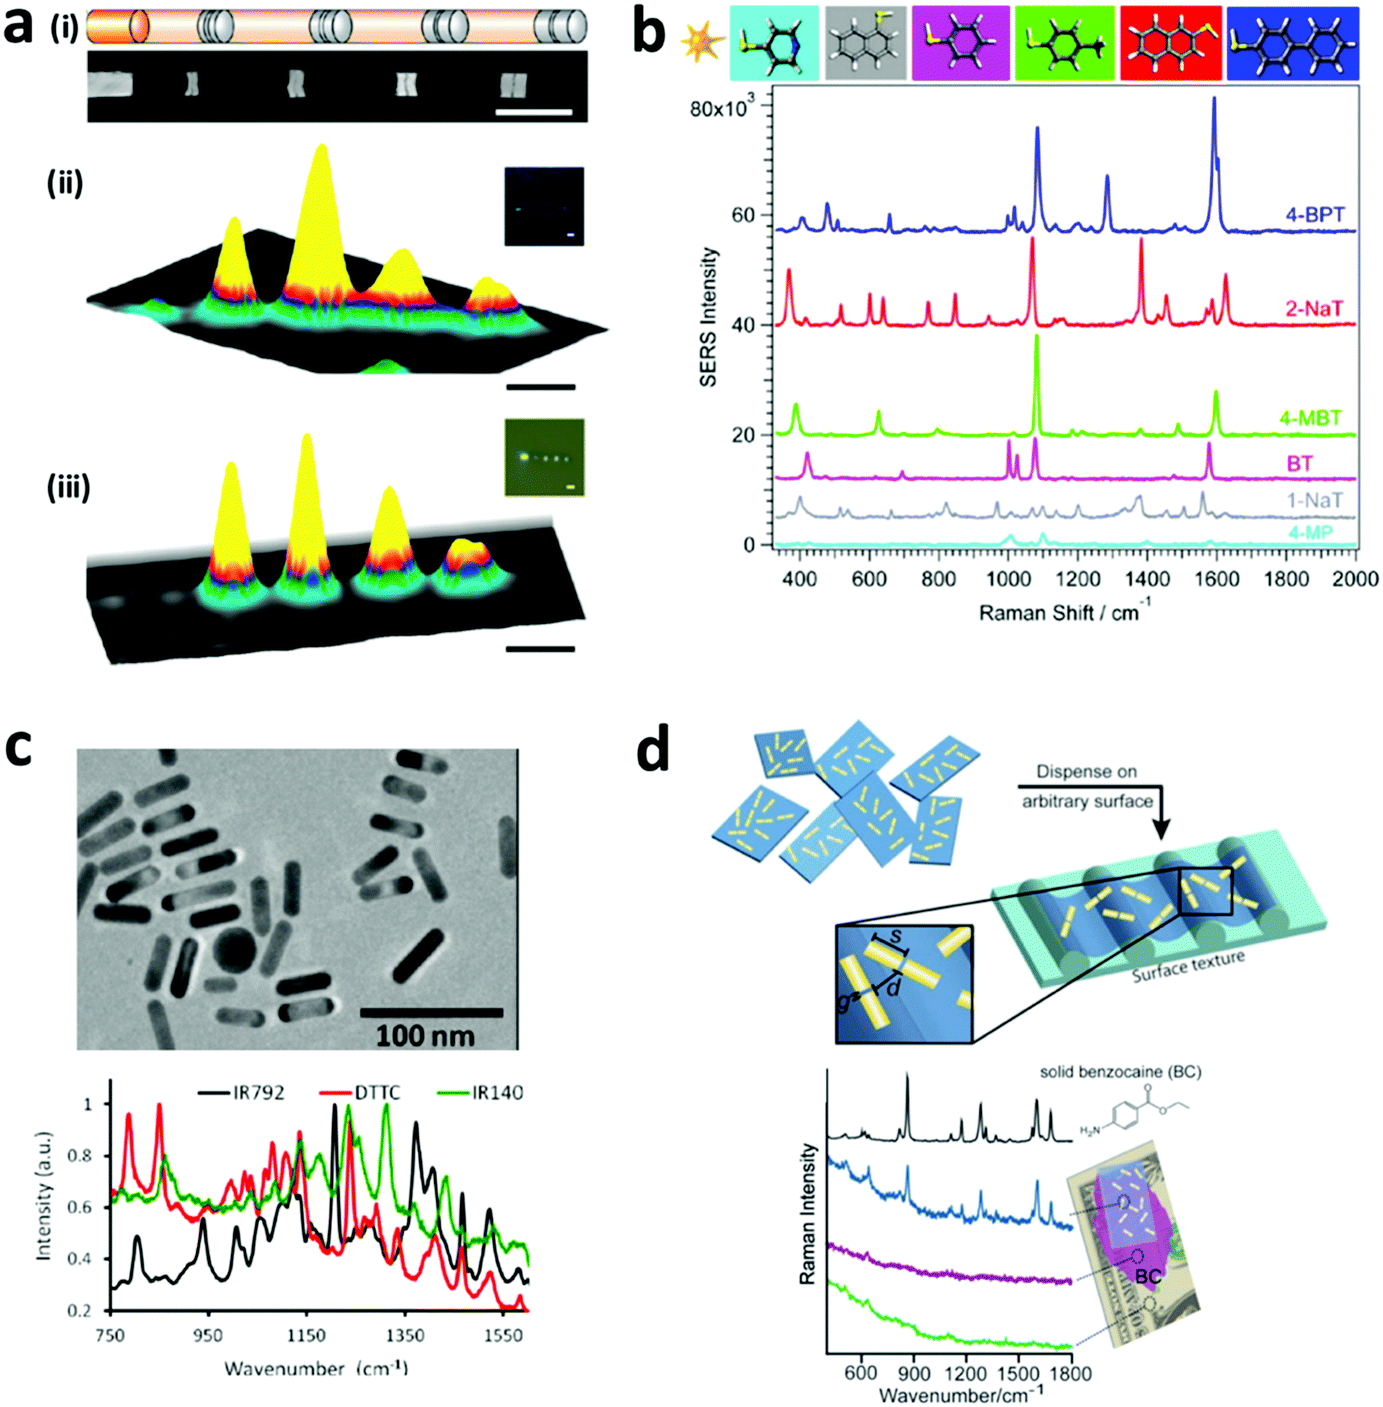 | ||
| Fig. 6 SERS encoding. (a) Silver nanodisk barcodes with nano gaps. (i) The presence of the dimer nanodisk shows as a peak in the Raman map corresponding to “1” code, while the gap is “0” at (ii) 633 nm and (iii) 532 nm excitation.126 (b) SERS hotspots from the gold nanostars functionalized with different Raman reporters.128 (c) Gold nanorods with different Raman reporters,133 and (d) SERS nanosheets based on the dispersed gold nanorod dimer on a solid surface.134 Figure panels reproduced from ref. 126 with permission from American Chemical Society, copyright 2010; ref. 128 with permission from American Chemical Society, copyright 2016; ref. 133 with permission from American Chemical Society, copyright 2012; ref. 134 with permission from Wiley, copyright 2012. | ||
SERS based codes provide ultrahigh sensitivity, very narrow spectra and large encoding capacities. However, SERS requires a silver or gold surface and the resulting SERS signal can be interfered by fluorescence signals, which limits the combination with fluorescence probes. To overcome this, signal processing methods have been reported to resolve the Raman signal from fluorescence interference.131 Thus far, 10 different SERS-based nano-barcodes have been reported for their application in multiplexed in vivo imaging.132
2.2 Graphical encoding
Graphical encoding employs a pattern of optical elements to generate nano-barcodes. This graphic can be in the form of a distinct pattern generated during the synthesis or the arrangement of the nanoparticles after they have been synthesized. The pattern generated during the synthesis can be in the form of striped metal nanowires composed of different metals such as gold (Au), silver (Ag), cobalt (Co), platinum (Pt), nickel (Ni), and copper (Cu) which are synthesized with the help of an electrodeposition method, as shown in Fig. 7a.135,138 The striped metal barcode corresponds to the different reflectivities of the metal composition under the optical microscope, for example gold (Au) has high reflectivity when it is exposed to 430 nm light, making the Au segment appear brighter as compared to the silver segment of the nanowires.135 Furthermore, the length of the segment can be varied depending on the deposition time. Nanowires with distinctive Morse codes based on a Pt segment and a Co spacer have been used to generate nano-barcodes (Fig. 7b). This distinct code is represented by the dot and dash reflectivity pattern of the metal.136,139 Furthermore, nano-barcodes based on the multilayer core–shell rare earth metal pattern with different layer contrasts due to the difference in the atomic numbers on each layer have been reported as seen in Fig. 7c.11,140 These layers can be distinctively observed with high-angle annular dark-field scanning transmission electron microscopy (HAADF-STEM) as it is a powerful tool to obtain the imaging contrast of different atomic numbers.11 The graphical nanowire barcodes based on the different reflectivity patterns can have unlimited codes and the reflectance pattern can be read out simply by using optical microscopy.139 Furthermore, nanowires can be characterized using X-ray fluorescence (XRF) and voltammetry. XRF can determine the composition of the alloy nanowire barcode and voltammetry electrochemically determines the composition through reading the redox peaks of each composed metal.141 The graphical encoding technique can generate high number of barcodes. The metallic nanowires from electrodeposition have theoretical Yn, where Y is the number of metal composition and n is the number of depositions. Meanwhile, the Morse code pattern on nanorods can generate up to 26n codes, which can be more than 300 million codes.136 However, the electrodeposition approach used to prepare the nanowires can only generate one type of code each cycle and requires another synthesis for additional code.139 Furthermore, due to the high density of the metal nanowires, the particles settle down quickly and requires continuous agitation to suspend the particles.139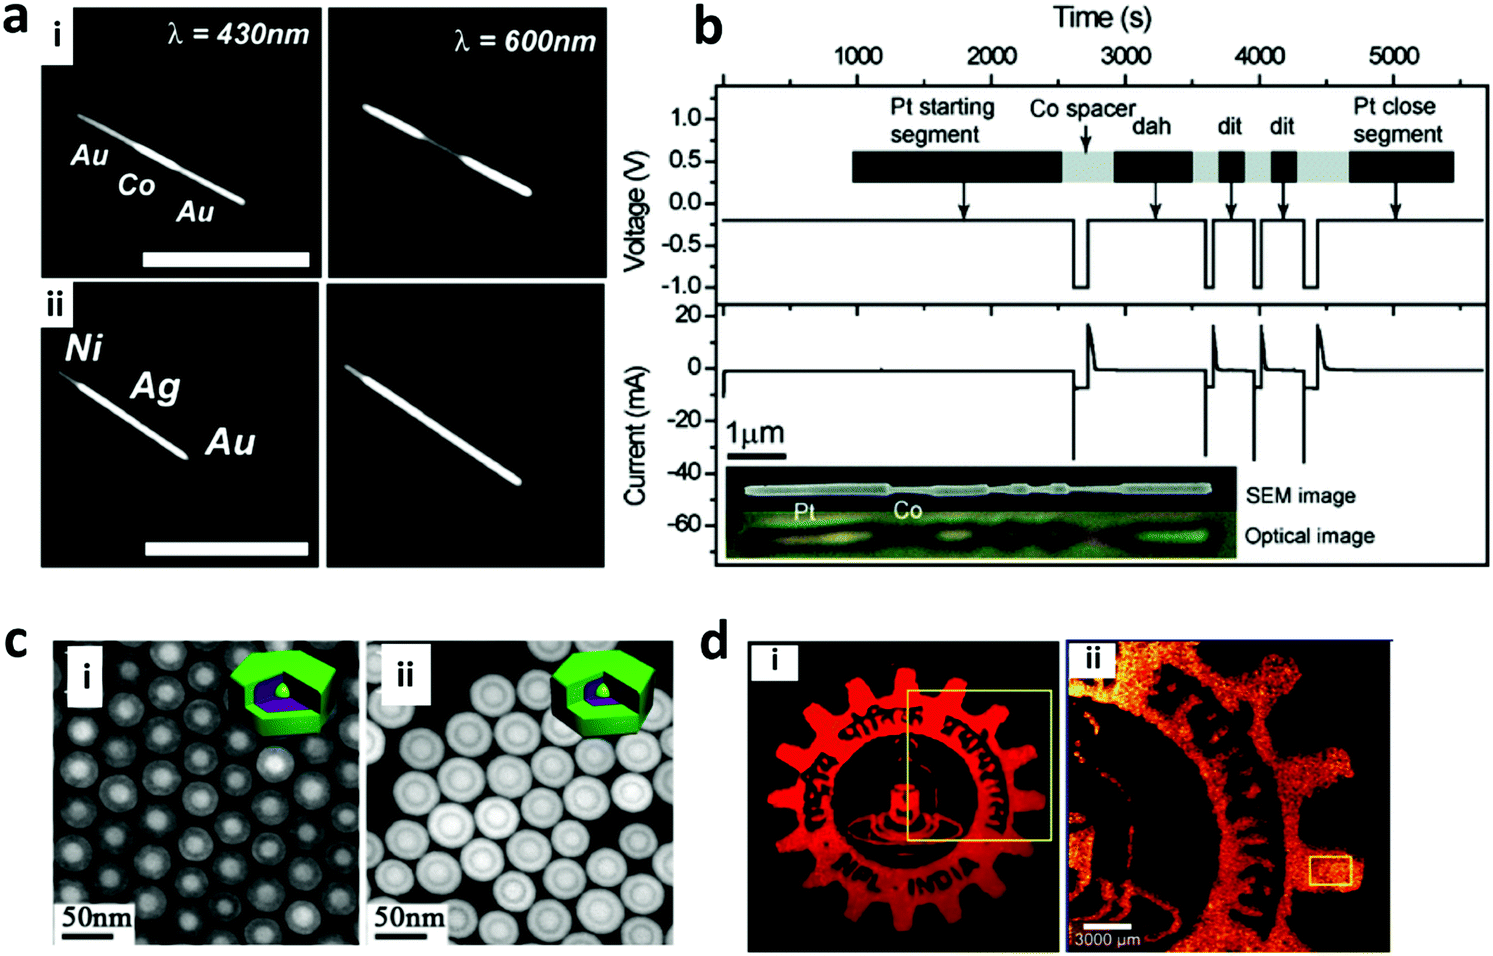 | ||
| Fig. 7 Graphical encoding. (a) Optical reflectivity images (scale bar = 5 μm) of nanowires encoded with stripes of Cu, Au, Ni and Ag at 430 and 600 nm illumination for (i) Au–Co–Au nanowires: the reflectivity of the Co segment compared to the Au segment is higher at 430 nm but lesser at 600 nm illumination; (ii) Ni–Ag–Au nanowires: the reflectivity of each metal is distinct at 430 nm which changes relatively at 600 nm.135 (b) Nanorods patterned with Morse code showing time dependent voltage and the corresponding current values with regard to time. The top inset shows the schema of the nanorod design and the bottom inset shows SEM and corresponding optical images of the encoded nanorod.136 (c) Multilayer core–shell rare earth metal pattern due to difference in atomic number under HAADF-STEM of (i) Gd,Y,Y,Gd (core, shell 1, shell 2, shell 3) and (ii) Gd,Gd,Y,Gd.11 (d) Graphical logo pattern from printed lanthanide doped Y2O3 nanorods;137 (i) is magnified in (ii). Figure panels reproduced from ref. 135 with permission from American Chemical Society, copyright 2003; ref. 136 with permission from American Chemical Society, copyright 2009; ref. 11 with permission from American Chemical Society, copyright 2015; ref. 137 with permission from American Chemical Society, copyright 2017. | ||
The arrangement of the pattern after synthesis can be in the form of controlled or random codes.142 In the generated pattern, the pattern can be controlled, carefully designed and memorized for the decoding process. The most popular controlled design is based on spatial encoding through the inkjet printing of covert fluorescence or photonic crystal nanoparticles.15,123 The patterns are designed using a computer and printed onto materials such as paper, tape or others.111,143 The pattern can be in the form of QR codes, letters/words or icons which can be easily distinguished.123,124,144 On the other hand, the random pattern is an unclonable tag which cannot be reproduced due to the randomness. This includes the random dispersion of fluorescence nanowires which acts as a unique fingerprint.21 This method is popular for anti-counterfeiting due to its easy fabrication and labelling process for the secured item. Theoretically, by changing the design of the pattern, unlimited number of graphical barcodes can be generated via this approach.
2.3 Sequence encoding
Polymers are formed from individual monomers linked by chemical bonding. The composition of the monomer can be homogeneous or heterogeneous. Heterogeneous monomers can generate polymers with a different sequence for encoding. Bio-based polymers, such as DNA, are made up of four bases, while peptides are built from more than 20 amino acids. The unique combinations of monomers in DNA or peptides have been reported to serve as a taggant, which has been referred to as bio-barcodes as seen in Fig. 8a.145–147 In addition to the sequence, additional encoding can be obtained from synthesizing different lengths of the polymer, or a set of different oligomers with different codes (Fig. 8b). Synthetic polymers based on the sequence encoding of oligo(alkoxyamine amide)s and different mass mixtures of the polymer have been reported.148 To decode the DNA sequence from the sample, the DNA needs to be collected and amplified using the polymerase chain reaction before being processed for DNA sequencing such as using the Sanger technique.149–151 On the other hand, the peptide or polymer sequences are decoded with a mass spectrophotometer which can capture the mass-per-charge ratio of the peptides.147,148,152 | ||
| Fig. 8 Sequence encoding. (a) DNA sequence based bio-barcodes. (i) The different DNA sequences are encapsulated in silica and (ii) decoded by Sanger sequencing for use in oil tracing.151 (b) Synthetic polymer-based barcode. (i) 1D, with different lengths and sequences of the monomers and (ii) 2D, with different sets of monodisperse oligomers with different mass.148 Figure panels reproduced from ref. 151 with permission from American Chemical Society, copyright 2014; ref. 148 with permission from Wiley, copyright 2016. | ||
Sequence based encoding provides a high capacity of code and the production of synthetic DNA or peptide has been easily implemented. The number of codes that can be produced from DNA sequences is 4n, while the capacity of peptides and polymers is from 20n to 500n, where n is the length of the DNA/polymer sequences, respectively. So far, 96 different DNA sequence barcodes have been reported for the gene sequencing process, and 11 synthetic peptides have been designed for nano-barcodes.148,153 Although a sequence barcode has a very high encoding capacity, the biopolymers such as DNA and peptides are prone to denaturation at extreme temperatures or pH as well as enzymatically by DNAse or proteinase in the environment. Therefore, additional protection molecules on each end of the sequences or nanoparticle shells can be used to stabilize the DNA or peptide.147,148,151,152
2.4 Morphological encoding
Morphological encoding relies on the physical characteristics of the particles such as size and shape for preparing different nano-barcodes.154,155 Different sizes of nanobeads have been used to generate unique codes. For example, the height of the closely packed silica nanoparticles of size 160 nm and 300 nm can be distinguished with tapping mode AFM.155 Shape encoding uses different shapes to generate the codes. Silica nanotubes have been synthesized with different hollow structures and shapes from different synthesis templates to create 4 distinct codes, as shown in Fig. 9.154 DNA self-assembly has also been used to generate barcodes with regards to the shape of its 3D nanostructure.20 The different shapes of the self-assembled DNA can be well observed and distinguished under TEM imaging.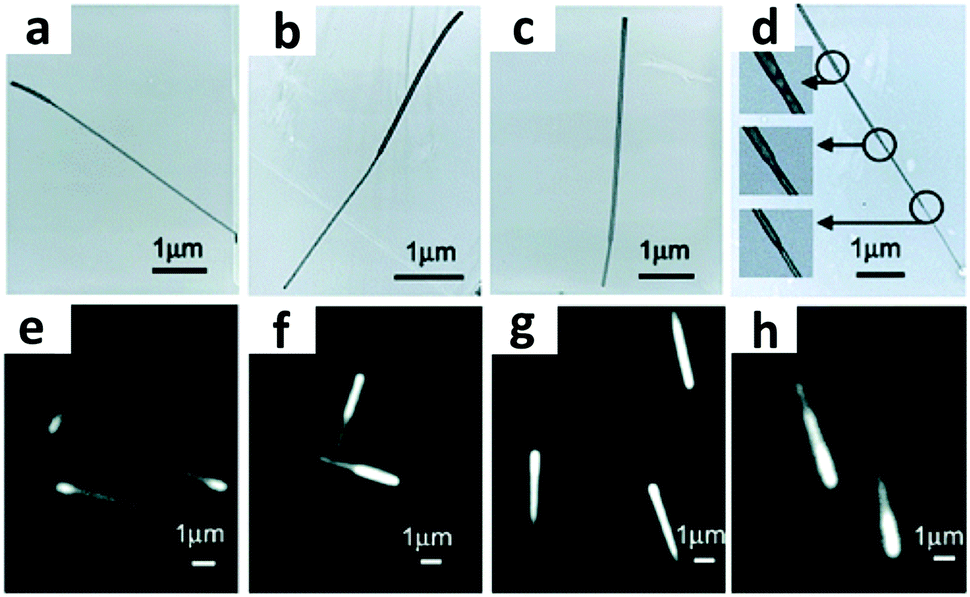 | ||
| Fig. 9 Morphological encoding. (a–d) TEM images of shape-coded silica nanotubes and (e–h) optical microscopy images of differently shaped nanotubes prepared using different alumina templates.154 Reproduced from ref. 154 with permission from American Chemical Society, copyright 2006. | ||
However, the size and shape based barcode technique cannot generate many distinct and unique barcodes as compared to other encoding techniques. Moreover, decoding for most of the size and shape encoding involves equipment such as an electron microscope or AFM that requires complex operating procedures and trained personnel to measure the size or shape of the nano-barcode.
2.5 Magnetic encoding
Magnetic encoding relies on the magnetic properties of nanoparticles. Ferromagnetic materials like iron (Fe) possess a magnetization value (Ms) that can be measured using vibrational sample magnetometry (VSM). The magnetic properties of an alloy can be modulated by mixing magnetic and non-magnetic materials such as Fe and Au which results in different magnetization parameters under VSM.156,157 In the presence of external parallel and perpendicular magnetic fields, the hysteresis curve, the saturation magnetization and the coercivity value of the alloys depend on the magnetic compositions. Yoon et al. developed 3 different CoFe/Au nano-barcodes with different compositions of the metals including Co-rich, Co and Fe equiatomic as well as Fe-rich. The difference in the composition of Fe resulted in a different shifting position in the hysteresis curves and magnetization and coercivity parameter for each composition under VSM measurement, as depicted in Fig. 10.156 Jeon et al. similarly used NiFe/Au nanowires with different compositions of Fe and Ni to produce magnetic codes to the nanowires.157 Magnetic encoding based on superparamagnetic iron oxide nanoparticles and gadolinium ions has also been utilized for contrast agents for Magnetic Resonance Imaging (MRI).9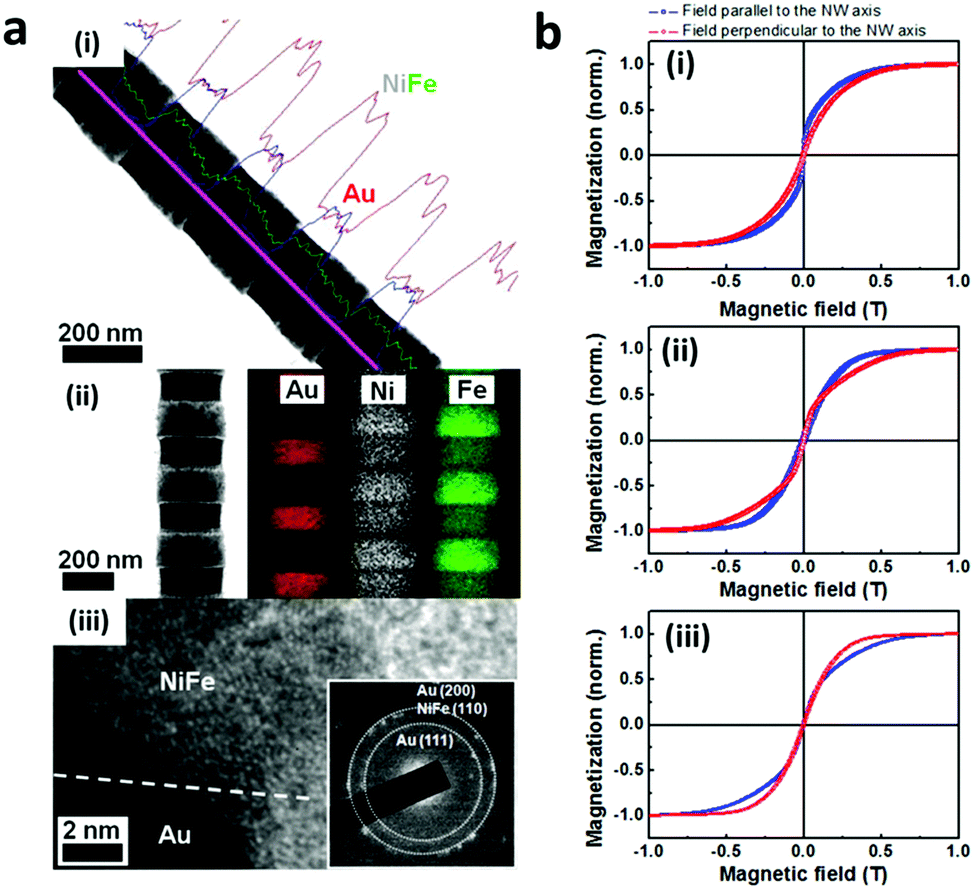 | ||
| Fig. 10 Magnetic encoding. (a) NiFe/Au nanowire barcodes (i) TEM image of nanowires with elemental line scan showing homogeneity of barcode (ii) Elemental mapping showing nanowire composition (iii). (b) Magnetic hysteresis curves of (i) Fe-rich, (ii) NiFe-equiatomic and (iii) Ni-rich nanowires in a vibrating sample magnetometer.157 Reproduced from ref. 157 with permission from AIP Publishing, copyright 2011. | ||
Composition based ferromagnetic materials allow only for a limited number of unique codes due to the low sensitivity of the decoding instruments to evaluate the different ratios of the magnetic composition on the barcodes. Therefore, this barcoding is commonly combined with other barcode types to increase the encoding capacity.
2.6 Phase change based encoding
The phase change property of nanoparticles is considered a new covert encoding technique with the capacity to generate a large number of codes. This encoding technique uses the solid-to-liquid phase change property of nanoparticles due to a temperature change, which is also referred to as the thermal barcode. The barcoding is achieved by mixing pure metals with different melting peaks to make nanoparticles, as can be seen in Fig. 11a.158 The nanoparticle melting during phase change upon exposure to high temperature can be observed using a differential scanning colorimeter (DSC) as a sharp and distinct peak (Fig. 11b).159 Ten different metal peaks including aluminium, bismuth, cadmium, copper, gadolinium, indium, lead, magnesium, palladium and silver can be combined to create up to 2n − 1 (n = number of distinct melting peaks), which can generate a total of 1023 different codes. So far, Duong et al. prepared 15 different barcodes by combining four different phase change nanoparticles.160 The approximate melting temperature of the mixed metals can be obtained by calculating the phase diagram based on the atomic ratio of the different metals. The metal can be encoded inside a silica shell for protection against leakage, simultaneously increasing the long term stability.158 In addition to metals, organic solid nanoparticles such as stearic acid, palmitic acid, paraffin wax, and polyethylene can be used for phase change encoding as they have different melting temperatures.159 Organic-solid nanoparticles are synthesized using water–oil emulsion and are encapsulated inside the polymer shell to avoid aggregation. The mixing of the different mass ratios of these organic solid nanoparticles can achieve multiple codes.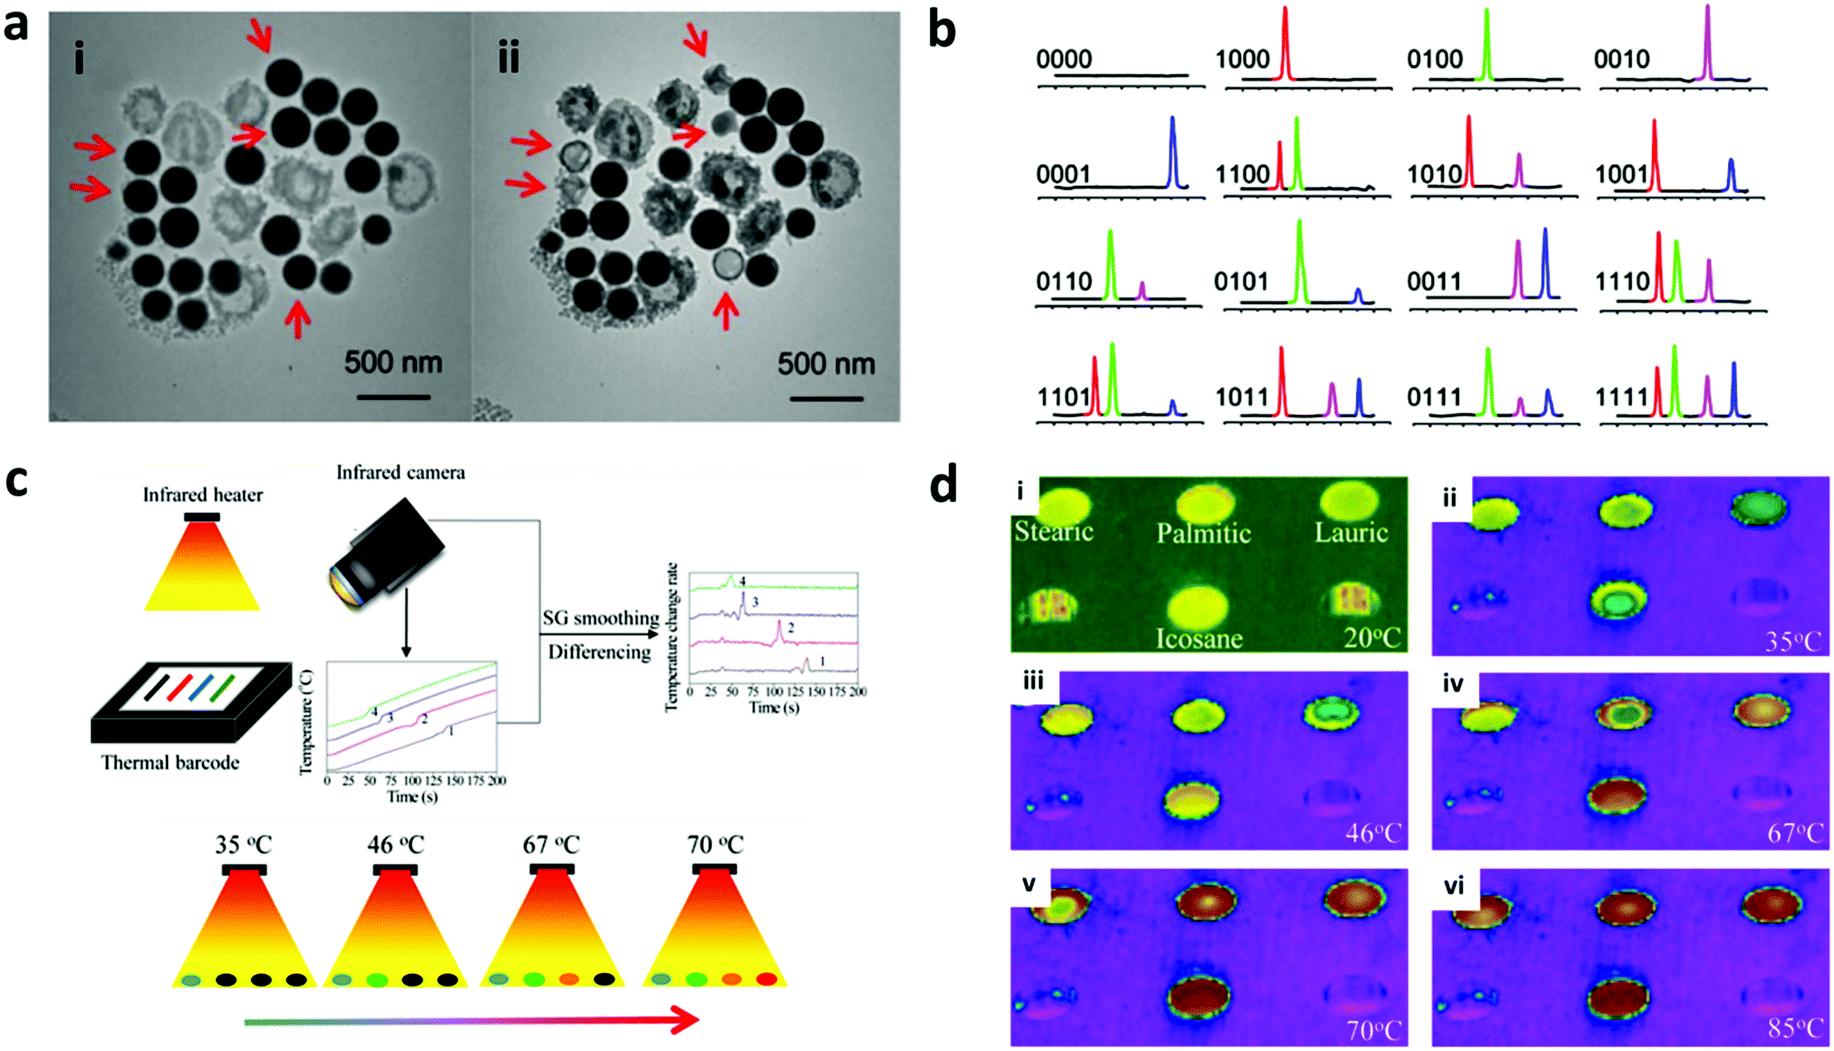 | ||
| Fig. 11 Phase change encoding. (a) The melting of silica encapsulated lead–bismuth based nano-barcode at 650 °C. (i) is two minutes before (ii). (b) The melting peak in the DSC curve from 100 to 300 °C.158 (c) Infra-red camera sensor to decode the thermal barcode with colour sensing. (d) (i–iv) Thermal images of materials: stearic, palmitic, lauric acid and icosane at different temperatures captured by the infrared camera.161 Figure panels reproduced from ref. 158 with permission from AIP Publishing, copyright 2009; ref. 161 with permission from American Chemical Society, copyright 2016. | ||
Compared to other encoding techniques, phase change based encoding is suitable for explosive tracking as it can withstand high temperature explosion. However, decoding with DSC requires the sampling and heating of the nanoparticle in an aluminium pan.161 There are some developments in decoding instruments to improve the readout such as using an infra-red camera sensor to detect the abrupt changes in the heating or cooling temperature of the phase change nanoparticle remotely as depicted in Fig. 11c and d.161
2.7 Hybrid encoding approaches
Different encoding techniques have been combined to exploit the benefits of each and increase the number of available barcodes.162–165 Hybrid encoding is the most popular for anti-counterfeiting applications as the combination of the encoding techniques can be used for multi-layer security with different types of covert codes. Moreover, hybrid encoding to generate more number of codes is desirable for multiplex diagnostic and imaging applications. The most common hybrid encoding methods involve fluorescent encoding that can be coupled with morphological, graphical, or Raman encoding methods. For instance, nanorods of different shapes and fluorescence were prepared based on multilayers of fluorescent polymers on them. The different polymers used can be etched to achieve different thicknesses, which in turn imparts multiple shapes to barcodes (Fig. 12a).165 This also improves the barcoding capacity based on shapes, which otherwise can generate limited number of codes. The fluorescence and shape encoded barcodes have the potential for detection and product tracking applications. Furthermore, nanopillar arrays encoded with dual spectroscopic techniques based on Raman and fluorescence are used for anti-counterfeiting applications (Fig. 12b).19 Hybrid encoding has also been used for creating barcodes for multimodal imaging, allowing for multiple imaging analysis. For example, multilayer nanoparticles with magnetic, visible QDs and NIR QDs have been developed for MRI as well as fluorescence imaging of breast cancer (Fig. 12c).68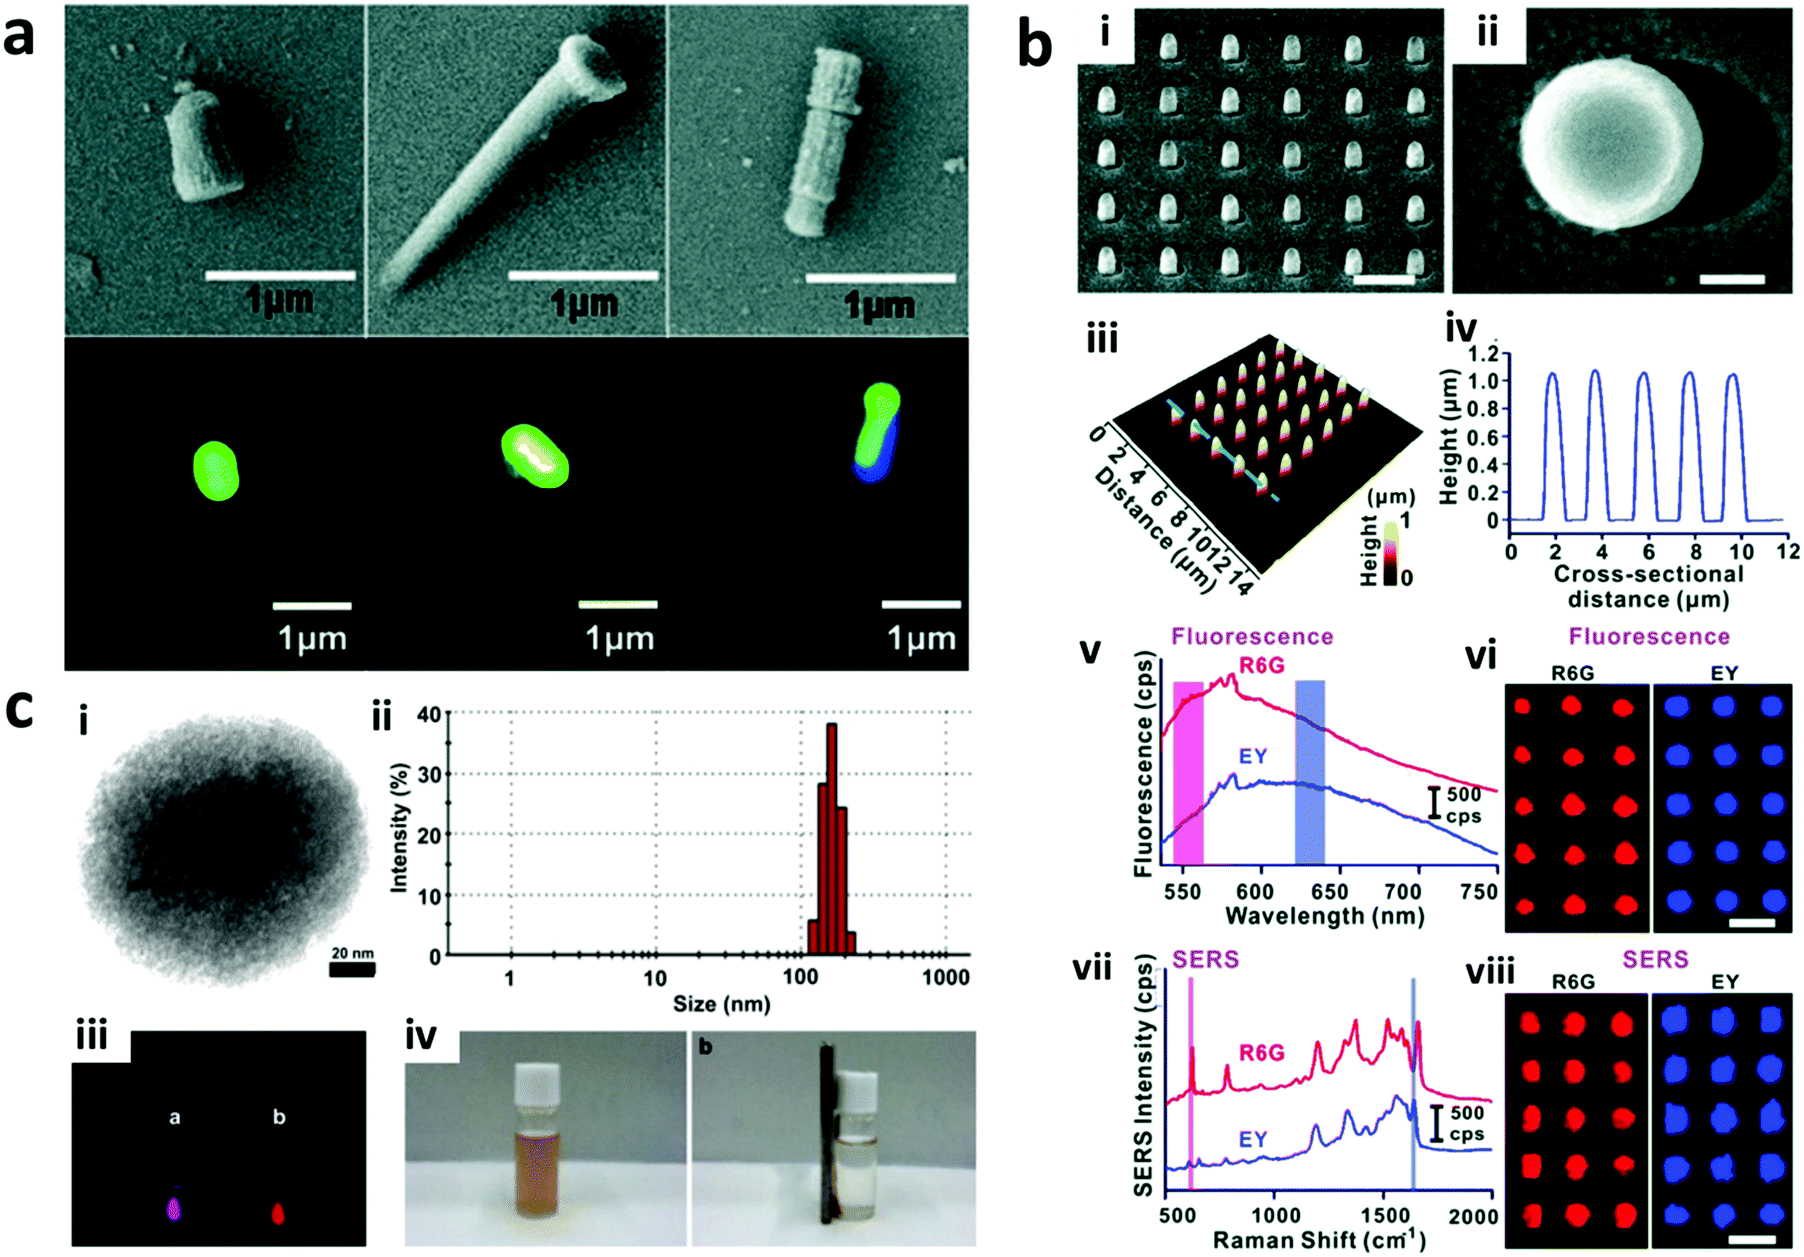 | ||
| Fig. 12 Different hybrid barcodes with dual encoding modalities. (a) Shape and fluorescence coded nanorods. The top panel shows different shapes generated by varying the etching speed. The bottom panel shows different fluorescence based on the layers of fluorescent polymers.165 (b) Raman (Ag deposited) and fluorescence (dye encapsulated) encoded nanopillar barcodes. (i and ii) SEM and (iii and iv) AFM images of nanopillars; (v) fluorescence spectra and (vi) images of R6G (red) and eosin Y (EY) (blue) in nanopillars; (vii) SERS spectra and (viii) images of R6G (red) and EY (blue) in nanopillars.19 (c) Fluorescence QD coated silica nanobeads with magnetite nanoparticles inside. (i) TEM image of barcode; (ii) DLS showing size distribution; (iii) Fluorescent images of barcodes excited at 365 nm showing emissions at 600 nm (purple) and 750 nm (red). (iv) Camera image of barcode solution without (left) and with (right) the magnet.68 Figure panels reproduced from ref. 165 with permission from American Chemical Society, copyright 2010; ref. 19 with permission from Royal Society of Chemistry, copyright 2016; ref. 68 with permission from Elsevier, copyright 2012. | ||
3. Strategies to prepare nano-barcodes
A wide range of strategies to prepare nano-barcodes of different colours, shapes and sizes have been developed. Some strategies embed the encoding elements in the encoding carrier, whereas others deposit them on the surface of the encoding carriers. The embedding or surface decoration could be further classified based on the status of the encoding carrier used, which could be prepared before or during the encoding process. Several other nano-barcodes are prepared by self-assembly methods to generate a highly ordered barcode. Before discussing the preparation strategies of nano-barcodes in detail, some essential criteria for the preparation of nano-barcodes must be considered to obtain the nano-barcodes of desired properties. The choice of preparation strategy depends on their ability to produce uniform barcodes, reproducibility, biocompatibility, number of barcodes and ease of encoding (Table 2). Non-uniformity of encoding and irreproducibility would result in batch-to-batch variations. Depending on the encoding technique of nano-barcodes, their physical, chemical and fluorescent stability must be assessed before employing them for applications. The biocompatibility of the surface of nano-barcodes, for immobilizing biomolecules on their surface, can be modulated based on the raw material chosen to prepare the nano-barcode or by coating the nano-barcodes with functional groups post synthesis. Additionally, preparation strategies involving simple synthesis and purification steps are favoured due to the ease of barcoding.| Strategy | Materials | Shape | Benefits | Limitations | Surface modification | |
|---|---|---|---|---|---|---|
| Embedding | Swelling | Swelling and de-swelling solvents, encoding elements such as organic/inorganic dyes, precursor of encoding elements, porous encoding carriers | Nanosphere | Monodisperse barcodes | Possibility of leakage of encoding element | Silica or polymer material used as encoding carrier that provides the functional groups |
| Ion-exchange | Ionic nanoparticles, porous encoding carriers | Nanosphere, NMOF | Control over proportion and intensity of barcodes | Possibility of leakage of encoding element, not applicable to non-ionic encoding elements | Feasible by surface coating after encoding | |
| Emulsion assembly | Hydrophobic nanoparticles | Nanosphere, NMOF | Applicable for hydrophobic nanoparticles | Non-uniformity in size of barcode | Feasible by surface coating after or during encoding with polymer or gelatin | |
| Polymerization | Encoding elements with monomeric precursors | Nanosphere | Bead synthesis and nanoparticle encapsulation combined in one step, minimal leakage of nanoparticles | Aggregation, little control over polymerization process, efficiency of loading is less | Functional groups are imparted based on the monomeric precursor | |
| Co-precipitation | Lipophilic encoding elements, amphiphilic polymer, organic solvent | Nanosphere | Can be applied for lipophilic encoding elements, surfactant-free, control over barcode size | Possibility of leakage of encoding elements | Typically, the polymer used provides the functional groups | |
| Solvothermal reaction | Pressure vessel, moderate to high temperature (100–1000 °C), surfactant, surface stabilisers | Nanosphere, nanosheets, nanorods, nanoplates, nanocubes | Control over barcode shape, control over loading efficiency | Possible aggregation | As obtained barcodes have surface groups due to the polymer used | |
| Sol–gel | Metal ions, organic dyes, QDs, lanthanide-doped nanocrystals, porous templates (alumina) | Nanosphere, Nanodisks, Nanotubes | Control over size and shape | Long reaction time | Silica group typically appears on the surface of the particle | |
| Surface decoration | Layer-by-layer | Polyelectrolyte polymers | Nanosphere, Nanosheets, Nanopillars | Control over layer thickness and charge | Long reaction time for multilayer | A layer of functional group can be coated after the layer of encoding elements |
| Etching | Wet or dry etchant molecules, mask | Nanorods | The shape can be controlled | Slow reaction process | Surface functional groups can be added on substrate materials | |
| Electrodeposition | Metal ions | Nanowires | Precise and controlled fabrication | Complex instrument setup | The metal can be functionalized with thiol, carboxylic group | |
| On-wire lithography | Metal ions | Nanorod, nanowires, nanodisks | Precise and controlled fabrication | Complex instrument setup | The metal can be functionalized with thiol, carboxylic group | |
| Two photon lithography | Photosensitive material | Nanopillar array | Precise fabrication | Expensive and complex optical setup | Surface group depends on the photosensitive polymer | |
| Epitaxial | Nanocrystals, polymer | Nanorods, nanobeads | Controlled growth of crystals | Difficult to grow heterostructure | Additional functional groups can be added by further coating of particles | |
| Self-assembly | DNA self-assembly | Nucleic acid, commonly DNA scaffold and staple | Any shape, depends on the need | Easy to design and fabricate and inexpensive | Unstable at high temperature and extreme pH | DNA has inherent functional groups for further conjugations |
| Molecular aggregation | Low molecular weight organic dyes | Nanowires, Nanofibers, Nanotubes | Spontaneous and easy method, highly ordered aggregates, different shapes | Only achievable for lower molecular weight fluorophores such as organic dyes | Surface functionality is imparted by the templates used to prepare the aggregates |
3.1 Embedding
Encoding elements such as organic and inorganic fluorophores, Raman dyes, can be embedded inside the pre-formed encoding carriers or encoding carriers formed during the embedding process to create the barcode.3.1.1.1 Swelling. Swelling is a renowned strategy where the encoding elements are suspended in a swelling solution and their encapsulation through the pores of the nanospheres occurs via a concentration gradient. Typically, polymeric nanospheres and encoding elements are mixed in a swelling solvent. The solvent infiltrates through the matrix of the nanospheres and induces swelling of the beads and enlargement of the pores inside the beads. The encoding elements then diffuse into the swollen beads through the enlarged pores. Upon removal of the swelling solvent, the spheres are de-swelled and they shrink, and the nanoparticles are encapsulated inside the spheres (Fig. 13a). Different parameters that govern the process are optimal choice of solvents and their pH, swelling time, concentration, optical properties of encoding elements and their compatibility in solvent systems.175 In a variation of this strategy, precursors of encoding elements are encapsulated in the preformed carrier and are subjected to synthesis in situ to generate the nano-barcodes. Using this process, CdSe QD precursors are embedded and grown directly under high temperature conditions inside porous silica nanospheres to prepare the barcode element.64 The swelling method is advantageous due to its applicability to a wide range of organic and inorganic dyes and nanoparticles to prepare nano- as well as micro-barcodes.36,175,176 The successful embedding using this approach, however, requires a match between the pore size of the nanospheres and the size of the encoding element. While larger pores would lead to leakage of encoding elements, smaller pore size would result in their adsorption on the surface of the nanospheres, both leading to a compromise in the barcode stability and efficiency. The leakage could be avoided by coating a polymer layer on the surface of the prepared barcodes, as has been demonstrated for micro-barcodes.
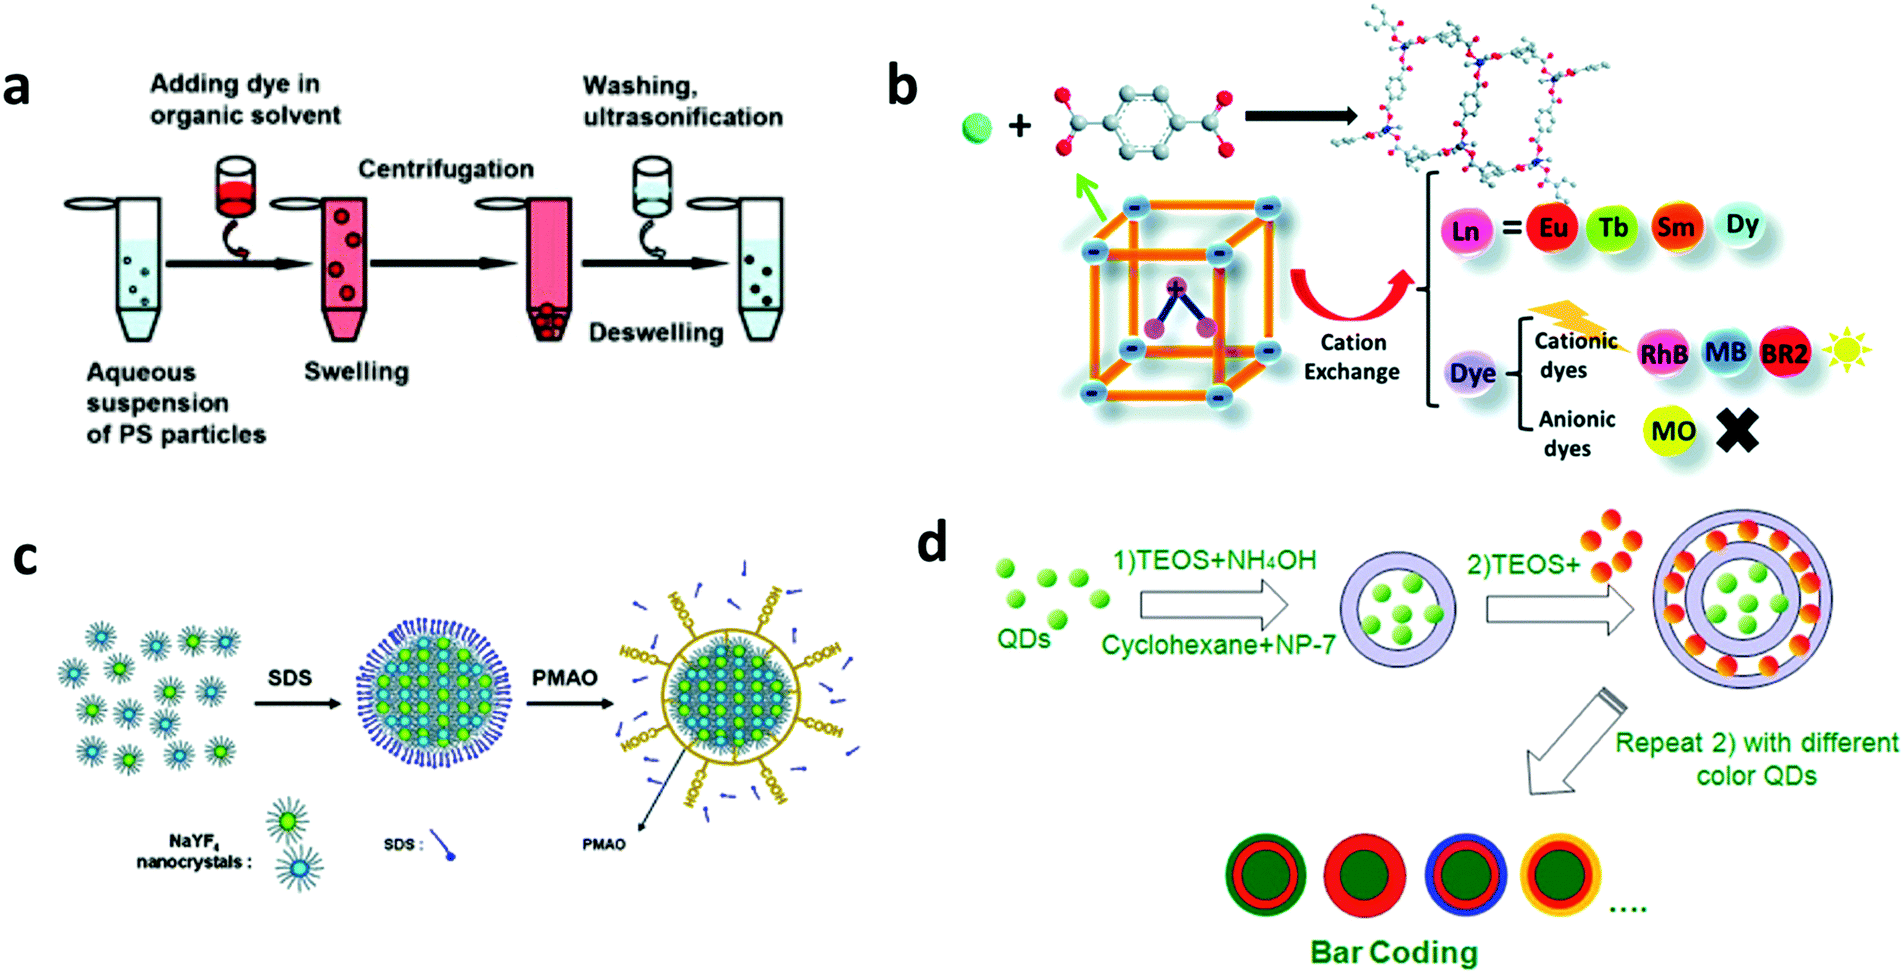 | ||
| Fig. 13 Strategy of embedding in pre-formed encoding carriers. (a) Embedding by swelling.175 (b) Embedding the lanthanide in NMOF by ion exchange.177 (c) Embedding the lanthanide by emulsion assembly170 and (d) Embedding hydrophobic QDs by reverse emulsion.70 Figure panels reproduced from ref. 175 with permission from Elsevier, copyright 2012; ref. 177 with permission from the Royal Society of Chemistry, copyright 2016; ref. 170 with permission from the Royal Society of Chemistry, copyright 2011; ref. 70 with permission from the Royal Society of Chemistry, copyright 2011. | ||
3.1.1.2 Embedding by ion-exchange. In this strategy, barcodes are prepared by exchange of ionic nanoparticles, carried out in the presence or absence of templates. Generally, the cationic nanoparticles to be embedded inside are replaced by existing cationic species present in the porous anionic matrices (Fig. 13b).177,178 The reaction can also be performed via a surfactant-template approach, where the surfactant ions are replaced by cationic nanoparticles that are synthesized directly inside the matrix.179,180 By changing the stoichiometry of nanoparticles, their proportion embedded inside and thereby the emission intensity can be controlled.178 To prevent the leakage of embedded ions from the matrices, the as obtained barcodes are coated with silica.178 This strategy has generated QD doped mesoporous silica179,180 and lanthanide doped MOF, with and without dye.177,178,181
3.1.1.3 Emulsion assembly. In this strategy, general oil-in-water emulsion and microemulsion assembly is used to embed the encoding elements inside the encoding carrier. Typically, nanoparticles and amphiphilic co-polymer emulsion in water stabilised with a surfactant are stirred and eventually, the organic solvent of the oil phase is evaporated at high temperature (∼70 °C). During the solvent evaporation, nanoparticles assemble in a nanocluster, as seen in Fig. 13c, and the polymer solidifies to produce the nano-barcodes. Using this method, superparticles of QDs,182 lanthanide-doped upconversion nanoparticles encapsulated in polymers24,170 and gelatin,183 and fluorescent dye-loaded upconversion nanoparticle nanoplates assembled in colloidal spheres113 have been prepared. The coating of polymer or gelatin over these superparticles provides stability to the barcodes along with the functional groups for biomolecule conjugation. This method is beneficial to load hydrophobic fluorescent nanoparticles and dyes to generate barcodes.24,170 Conversely, water-in-oil reverse microemulsion assembly has also been used to generate stepwise multilayer QD encoded nanobeads (Fig. 13d),68,70 and luminescent lanthanide ions encoded NMOF.115
3.1.2.1 Polymerization. In this approach, encoding elements are pre-formed and mixed with monomer precursors that can polymerize via free radical22,71,184–188 or controlled/living radical polymerization to form the barcodes.189–192 Free radical polymerization methods, such as emulsion and miniemulsion polymerization, use nanoparticles modified with polymerizable ligands to allow their co-polymerization with the monomers by free radical polymerization in a two-phase oil–water system stabilised by a surfactant, as outlined in Fig. 14a. Encoding elements (hydrophobic fluorescent inorganic nanoparticle organic dyes) are present in oil-droplets, whereas monomers are either present in the oil-phase or in both the phases.187,193 Initiators to generate free radicals upon thermal-22 or photo-initiation193 are present in the aqueous phase. In the emulsion system, the surfactant is largely present in the aqueous phase, whereas in the miniemulsion method, the surfactant is mainly on the droplet surface with few molecules in the aqueous phase. While emulsion polymerization does not favour the transfer of encoding elements to the aqueous phase causing inefficient incorporations, miniemulsion polymerization allows direct transfer.71,184 In general, free radical polymerization is a widely established and employed method due to advantages such as relative insensitivity to impurities, adaptability to different solvents and a large number of monomers. Despite these benefits, the process offers very little control because of the slow initiation, fast growth and terminations of the polymer chains happening continuously upon the onset of polymerization. This in turn leads to aggregation and inefficient embedding of nanoparticles to encoding carriers.189,194 Surfactant free approach of polymerization was also adopted, which was found to minimize the formation of pure polymer nanoparticles, and which yielded narrow sized particles and improved the distribution of encoding elements in the barcode.195 Furthermore, controlled/living polymerization was utilized for preparing nano-barcodes, where the radicals reacting at a time are under control by addition of monomers to an active chain instead of addition to another monomer (Fig. 14b). This process was found to be able to handle more number of nanoparticles with insignificant aggregation and required moderate reaction conditions.189,191
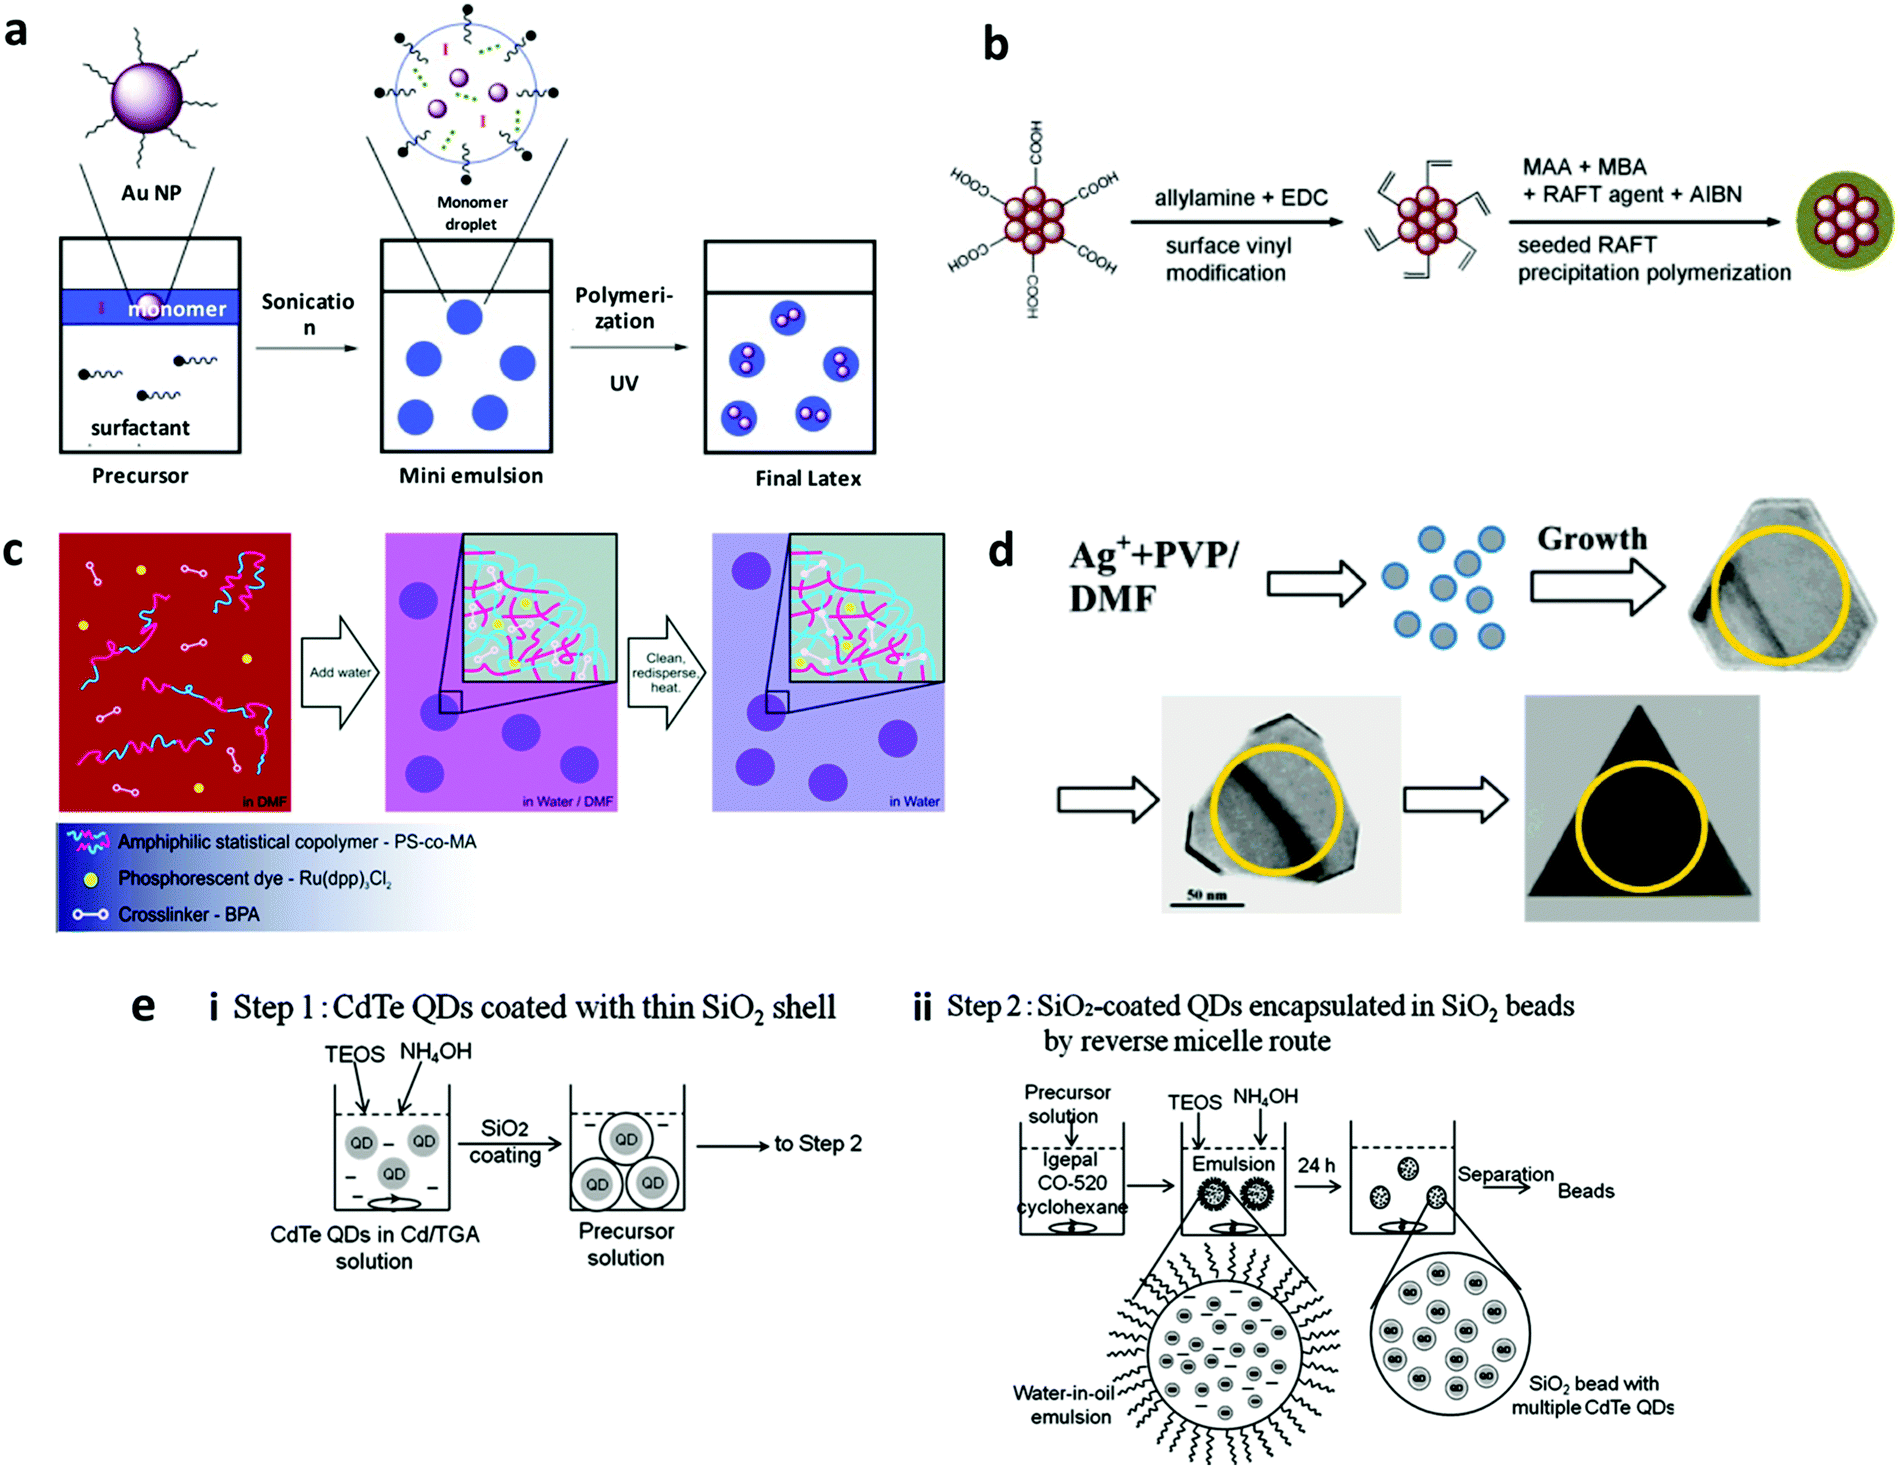 | ||
| Fig. 14 Strategy of embedding in in situ formed encoding carriers. (a) Miniemulsion polymerization to produce gold nanoparticle encapsulated latex193 (b) RAFT polymerization of Fe3O4@poly(methacrylic acid).189 (c) Co-precipitation of the encoding element and the polymer to form the barcodes,196 and (d) Solvothermal method to prepare differently shaped barcodes based on different ratios of Ag+ PVP dispersed in DMF solvent.199 (e) Sol–gel method to prepare QD encoded SiO2 beads.200 QDs are formed prior to encapsulation and mixed with a bead precursor for encapsulation during the bead synthesis. Figure panels reproduced from ref. 193 with permission from Elsevier, copyright 2010; ref. 189 with permission from Elsevier, copyright 2013; ref. 196 with permission from the Royal Society of Chemistry, copyright 2015; ref. 199 with permission from American Chemical Society, copyright 2007; ref. 200 with permission from Elsevier, copyright 2010. | ||
3.1.2.2 Co-precipitation. In this strategy, encoding elements are co-precipitated with polymers to form encoded nanospheres.196–198 Lipophilic encoding elements and amphiphilic polymers (insoluble in a water–organic solvent mixture) are co-dissolved in a small amount of organic solvent miscible in water (Fig. 14c). Next, this mixture is stirred vigorously with simultaneous dropwise addition of a large amount of water, upon which the polymer will precipitate as nanospheres with hydrophilic groups on the surface and encoding elements embedded inside. The as obtained nanospheres are washed and subjected to heating to induce cross-linking mediated by multiple polymers having cross-reactive functional groups or the presence of cross-linkers to yield the nano-barcodes.196,197 Monodisperse nano-barcodes of size range 40–300 nm diameter have been prepared.197 Notably, the barcode size can be controlled by two parameters. First is the polymer/encoding element precipitation speed, whereby the faster the precipitation speed, the smaller the particle size.197 Second is the type of organic solvent used with solvents such as tetrahydrofuran (THF) yielding larger sized barcodes, whereas others such as dimethyl sulfoxide (DMSO) and dimethylformamide (DMF) producing smaller sized ones.197 This method is surfactant free, thereby making it safe for biomolecules. The polymer provides functional groups for the conjugation of biomolecules. Furthermore, the strategy allows the incorporation of lipophilic fluorescent molecules and the post precipitation crosslinking delivers physically and mechanically stable nano-barcodes with better photostability compared to uncrosslinked nanospheres.197
3.1.2.3 Solvothermal method. Solvothermal reactions take place in a pressure vessel at moderate to high temperature (100–1000 °C). Pre-formed nanocrystals or their precursors are added to the organic solvent and dispersed properly by stirring in a solvothermal vessel, usually a Teflon steel vessel to withstand the high pressure. To avoid particle aggregation and control the growth rate, the reaction takes place in the presence of a surface stabiliser or surfactants. Barcodes of different fluorescence, magnetic properties and shapes have been prepared by this approach and the process can be controlled by temperature, surfactants, stabilisers, concentration of encoding elements and reaction time.28,199,201,202 Magnetic nanoparticle loaded scrolled nanosheet barcodes prepared by this method were shown to exhibit temperature dependent loading efficiency; efficient encapsulation for temperature >180 °C, moderate for temperature <180 °C (only 4–5 nanoparticles per scroll).28 Barcodes of different shapes of silver nanocrystals have been prepared by this method (Fig. 14d), which is dependent on the ratio of polyvinylpyrrolidone (PVP) stabiliser to nanocrystal (Ag+), concentration of nanocrystal, reaction time and temperature.199 Furthermore, the Raman enhancement property was found to be tunable based on the shape, which can be arranged in decreasing order as nanorods > triangular plates > hexagonal plates > cubes > spheres.199 Using this strategy, Ln ion loaded fluorescent NMOFs were also prepared, wherein the organic linkers of MOF capture the light and transfer the energy from ligands to Ln ions and the fluorescence can be further enhanced by choosing ligands of different functional groups.201,202
3.1.2.4 Sol–gel. In this strategy, a colloidal solution (sol) gels to form a network of particles (gel). Briefly, precursor tetraethyl orthosilicate (TEOS), in the presence of ammonia as the catalyst, is added to an emulsion of pre-formed encoding element in oil to in situ synthesize silica bead barcodes, as shown in Fig. 14e. The process is employed to prepare dye, QD and rare-earth nanocrystal encoded silica nano-barcodes.200,203,204 Another variation of this strategy generates barcodes by depositing encoding elements in the pores of porous templates (alumina structures). Typically, pre-formed alumina templates were treated with silicon tetrachloride solution followed by immediate washing with hexane, methanol, and ethanol in a sequential manner. The template is immersed in water after nitrogen drying and the whole cycle is repeated multiple times to get the desired thickness of the wall of nanotubes. Using the sol–gel method, magnetic nanocrystals205 and fluorescent particles206 have been incorporated into different nanostructures to prepare different types of barcodes including encoded nanospheres,207 silica nanotubes,154,205,206 and nanodisks.208 Although the strategy is of multiple steps with long reaction times, control over the shape and size of the barcodes is achievable and has been reported to produce uniform barcodes.
3.2 Surface decoration
3.2.1.1 Layer-by-layer. A layer-by-layer (LBL) technique has been used to generate nano-barcodes with fluorophores decorated on the surface of encoding elements. The LBL technique employs electrostatics based adsorption of molecules with opposite charge on a nanoparticle substrate. Fluorescent barcodes based on QDs decorated on the surface of gold nanoparticles have been reported to generate non-blinking fluorescence signal by LBL polyelectrolyte coating as can be seen in Fig. 15a. Negatively charged QDs with different ratios of green and red colour are attached to the gold nanoparticle which has been layered with negatively charged PS-PPA and positively charged PAH. These layers between QDs and the gold nanoparticle also prevent the quenching of QD on the metal substrate.168 The advantage of the LBL technique is that the layer growth can be easily controlled down to the nanometer scale. However, the time taken for building several layers of films can be long.
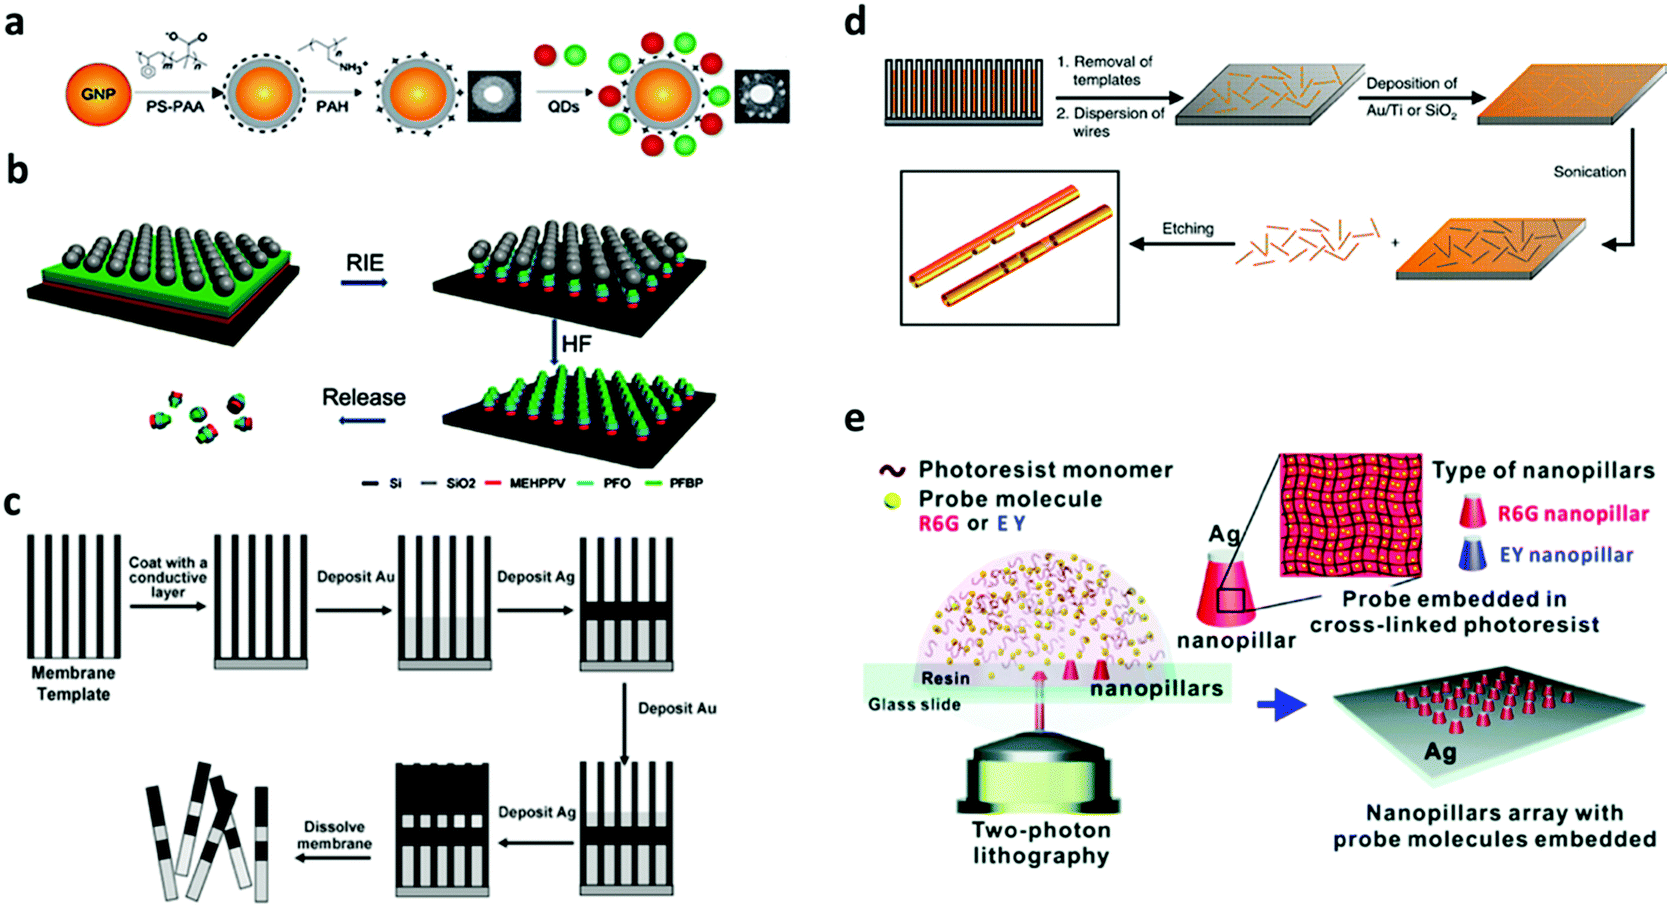 | ||
| Fig. 15 Strategy of surface decoration on preformed encoding carriers. (a) LBL method to fabricate QD barcodes.168 (b) RIE for fabrication of fluorescence barcode nanorods.165 (c) Electrodeposition for synthesis of metal nanowire barcodes.220 (d) On-wire lithography for nanowire synthesis.212 (e) Two photon lithography for the synthesis of plasmonic nanopillar arrays.19 Figure panels reproduced from ref. 168 with permission from Wiley, copyright 2012; ref. 165 from American Chemical Society, copyright 2010; ref. 220 with permission from the Royal Society of Chemistry, copyright 2008; ref. 212 with permission from AAAS, copyright 2005; ref. 19 with permission from the Royal Society of Chemistry, copyright 2016. | ||
3.2.1.2 Etching. The etching process involves removal of materials from a wafer or substrate materials. The etching process can be classified into wet and dry etching. In wet etching, liquid chemicals are used to remove the materials from a mask-less layer while in dry etching, etchant gases or plasma is used to remove the substrate materials. The mask needs to be deposited or patterned before the etching to generate the desired pattern or shape. Porous silicon barcode nanowires with QD loading have been fabricated using metal-assisted electroless etching of single crystal silicon. In this wet etching process, Ag is first deposited on the Si wafer, after that the etching is done with H2O2 and HF solution.209 The etching of silicon with NH4HF2/AgNO3 solution to create silicon nanowires has also been demonstrated.210
Dry etching has been reported for the synthesis of nano-barcodes. The most popular dry etching process is Reactive Ion Etching (RIE) that employs chemically reactive species generated in plasma to remove the materials. The etching gas is pumped into the chamber and the plasma which is created by RF power generates the reactive species, which comprise radicals and ions, to etch the substrate materials. In the etching process, a mask is needed for selective etching of the structure. The mask used to produce nanorods in the dry etching process is a nonclose-packed (ncp) colloidal microsphere. This method is reported to fabricate barcode nanorods with different layer segments such as different fluorescence codes as seen in Fig. 15b.165 The length of this different fluorescence polymer layer can be controlled by changing the spin coating parameters of the polymer. Furthermore, the nanorods generated from this method can have different shapes by controlling the speed of the etching process. After the etching process, the nanorods can be detached from the base wafer with a highly corrosive solution.211 The RIE process is capable of creating very small features down to less than 100 nm scale; however, the process requires expensive equipment and have relatively low throughput.
3.2.1.3 Electrodeposition. Electrodeposition has been used to produce nano-barcodes based on nanowires with different metal compositions.138 The electrodeposition process relies on a porous template membrane coated with a metal film for the electrode to grow the metal as can be seen in Fig. 15c.212 The desired metal plating solution is then added to the electrochemical cells for deposition and the length of the deposition depends on the current passed through the electrode. Traditionally, to add different types of metals on a growing nanowire, the solution is required to be replaced with the desired additional composition.139 However, due to the change in the composition of the electrobath solution, this process is slow and has lower reproducibility. This process can be improved using a single mixed metal solution with different applied voltages to deposit different metals on the nanowires.213 The change in the voltage can be automated using a computer to allow for high throughput fabrication with a reproducible nanowire structure.136 The striped nanowires of Ag–Au for bioassay have been reported to be synthesized by electrodeposition.130,171,214 The synthesis of Sn–Ag, Sn–Pb, and Au–Fe alloy based nanowires has also been demonstrated.10,215
3.2.1.4 Lithography.
3.2.1.4.1 On-wire lithography. On-wire lithography (OWL) is a process pioneered by Qin et al. that combines electrochemical deposition and etching to create nanowires of different materials with a controlled gap feature.212 Furthermore, this method is able to produce nanodisks with 20 nm diameter and gap down to 2 nm.216 Various metals can be used for this method and the most common materials used for this method are Au–Ag, Au–Ni and Co–Pt. This method can create nanowires with optical reflectivity properties and nanodisks/rods with nanogaps of SERS hotspot. Nanodisks of Ag and Ag–Au heterodimers with SERS code have been synthesized using OWL.126,127,217 Furthermore, on-wire lithography has been used to produce gold nanorods with sub-5 nm gaps for SERS enhancement code.218 The protocol for the OWL method has been well established and is illustrated in Fig. 15d. First, anodic aluminium oxide (AAO) is used as a template for the electrodeposition of nanowires. Before the electrodeposition, metal evaporation on the side of the alumina backing is required to be the electrode for electrodeposition. The electrodeposition takes place in the electrochemical cells that deposit the metal and the nanowire grows in length. The produced nanowire is then dissolved and placed on a glass slide to perform Plasma Enhanced Chemical Vapour Deposition or Physical Vapour Deposition to place the backing materials on one half of the nanowires before etching the selected metal materials. The etching results in controlled gap segments in nanowires. After this step, the nanowires can be functionalized with DNA, protein or other molecules by linker ligands such as thiols and carboxylic group. Furthermore, self-assembled monolayer molecules can also be deposited on the metal surface.219
Although this method can produce nanowires with controlled gaps and segments, the type of lattice of different metals needs to be similar to ensure the adhesion of different metal compositions. In addition, the types of metals and etchants used are needed to be considered for the desired selective etching process.216 Re-dispersion of particles produced from smaller templates with diameters of less than 200 nm is also difficult after the vapor deposition process.216 Furthermore, the electrochemical cell needs to be custom built for the templated electrodeposition process.
3.2.1.4.2 Two photon lithography. The two-photon lithography process can produce 3D nanostructures without the need for a complex optical system or photomask. This method uses photosensitive materials which can polymerize only with the exposure of two photons. The usage of two photons improves the precision of the polymerization as the polymerization occurs only in the centre of the intersection of the two photons, which is exposed with the highest laser intensity. Two-photon lithography has been used to synthesize nanopillar arrays based on photosensitive materials with colour probe molecules embedded in the polymer matrix as can be seen in Fig. 15e.19 This method is able to polymerize the photosensitive materials on the surface and inside of the photosensitive materials with high precision. However, the method has not been used for industrial production due to the high cost of the equipment, slow speed and processing volume. In recent years these limitations have been resolved which allows it to be implemented as a manufacturing tool.221
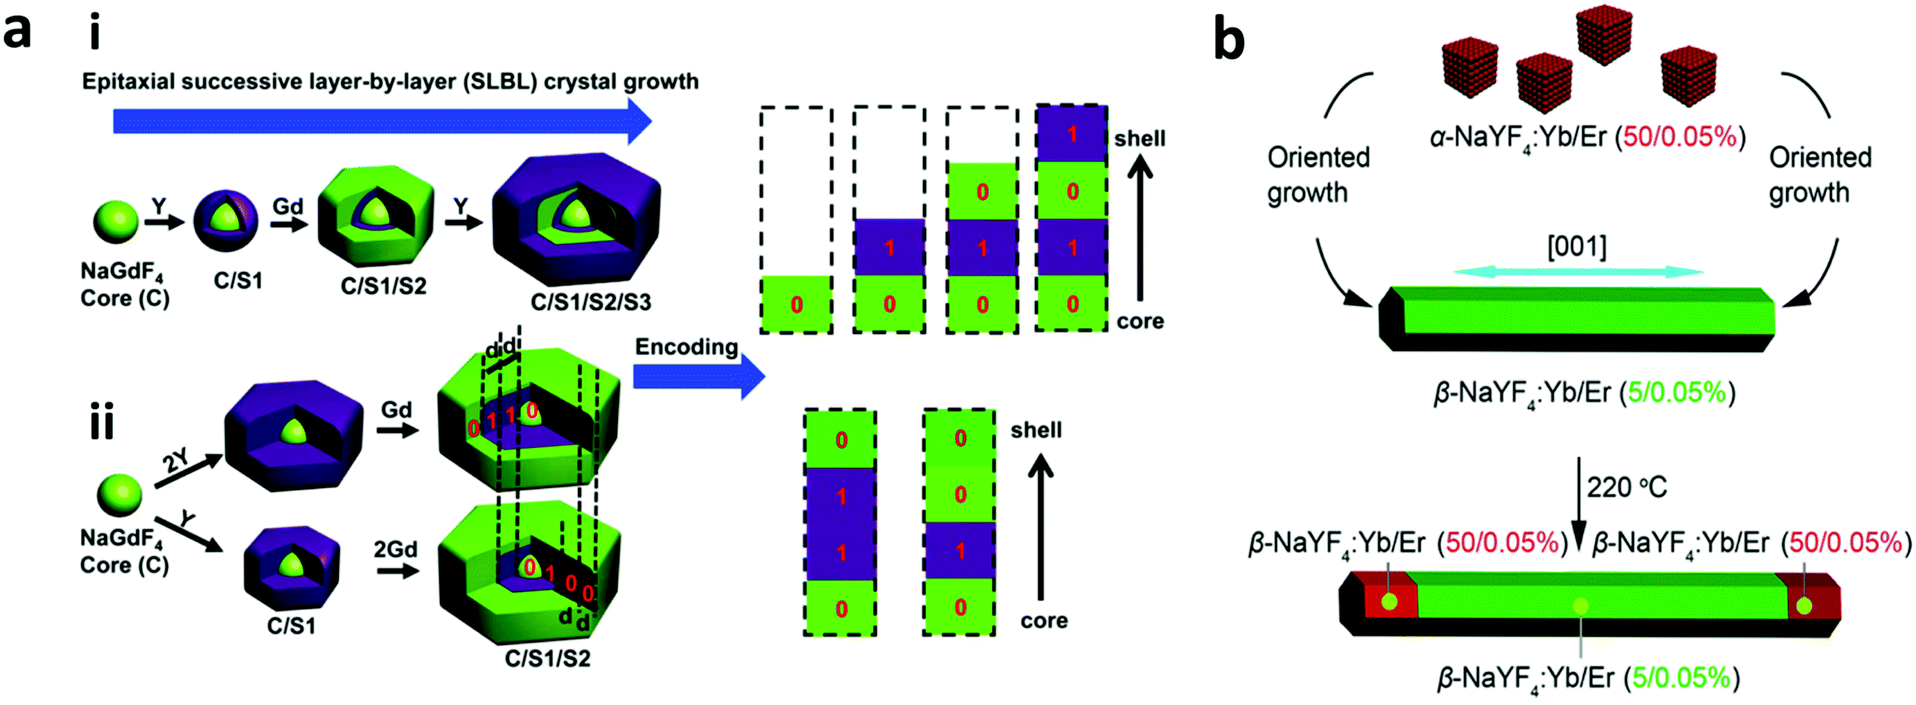 | ||
| Fig. 16 Strategy of surface decoration on in situ formed encoding carriers. (a) Successive LBL epitaxial crystal growth of Y and Gd to produce multilayer core–shell rare earth metal patterns with (i) alternate layer of striped patterns with different contrasts and (ii) different thicknesses of the layers.11 (b) Epitaxial growth of hexagonal NaYF4 upconversion nanocrystals with different activators to achieve multicolour barcodes in a single upconversion crystal.80 Figure panels reproduced from ref. 80 with permission from American Chemical Society, copyright 2014; ref. 11 with permission from American Chemical Society, copyright 2015. | ||
3.3 Self-assembly
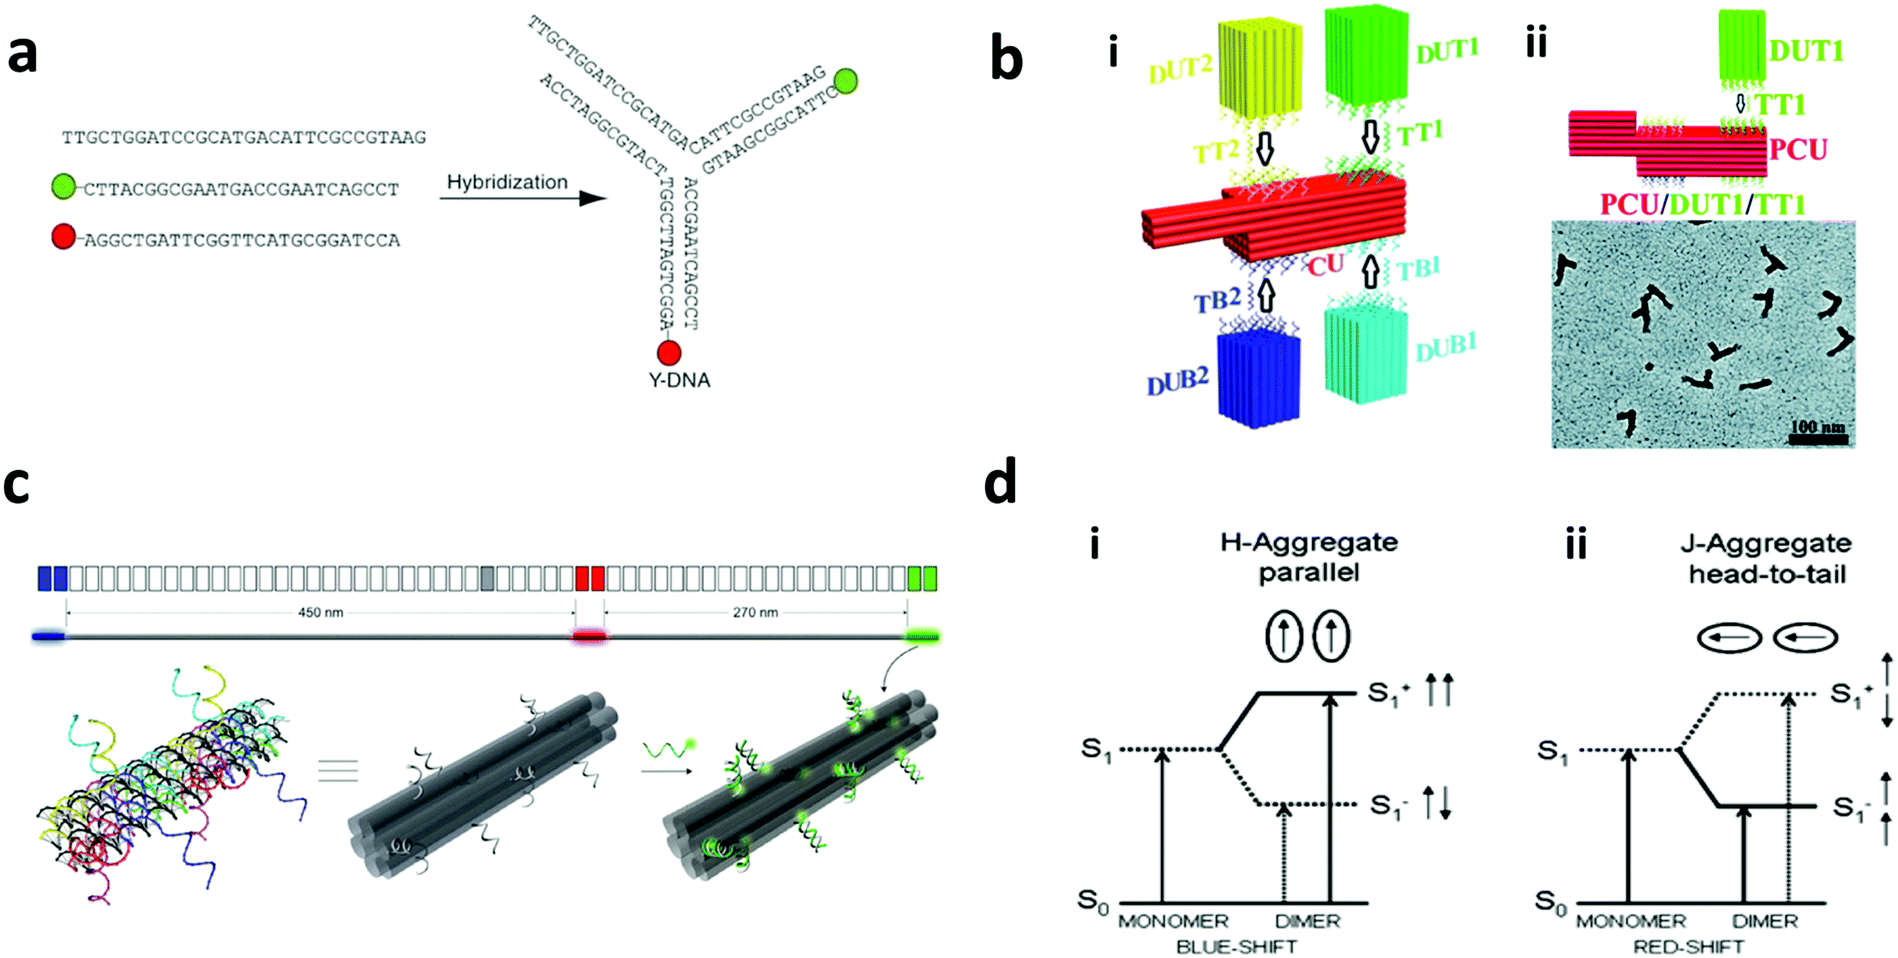 | ||
| Fig. 17 Self-assembly strategy. (a) DNA nano-barcodes with fluorophores attached to the end of the self-assembled Y-shaped DNA building block formed from hybridization of DNA monomers.225 (b) DNA nano-barcodes with positional encoding. (i) DNA 3D nanostructures formed through assembly of several DNA parts at different positions. (ii) TEM image of one DNA nanostructure barcode.20 (c) DNA nanorod structure formed by the dimerization of two DNA origami monomers. The top panel shows the schematics of the blue, red, and green DNA nanorods, and the bottom panel illustrates the 3D DNA nanorod structure conjugated with a green fluorophore at different positions.226 (d) Schema showing the mechanism for H- and J-type molecular aggregates. (i) Stacking of monomers to yield H-aggregates; (ii) head-to-tail arrangement in J-aggregates, where S0 = ground state, S1 = excited state, S1− = higher exciton state, S2− = lower exciton state, and arrows represent the transition dipole.228 Figure panels reproduced from ref. 225, with permission from Nature Publishing Group, copyright 2005; ref. 20 with permission from the Royal Society of Chemistry, copyright 2015; ref. 226 with permission from Nature Publishing Group, copyright 2012; ref. 228 with permission from the Royal Society of Chemistry, copyright 2000. | ||
DNA based self-assembly has been established for more than three decades, and the generation of the DNA strands is fast and relatively cheap. However, the DNA based self-assembly method is not stable at high temperature or extreme pH as the self-assembled DNA can be denatured. Therefore, in several applications such as anti-counterfeiting, the self-assembled DNA is required to be protected inside nanostructures.151 In addition to DNA self-assembly, other biomolecules including peptides can be self-assembled into 3D nanostructures. However, they are not commonly used as nano-barcodes. Sedman et al. modified aromatic peptide nanotubes with nanothermal AFM to create indent and trench patterns on peptide nanostructures that have potential to be used as nano-barcodes.227
4. Applications
Different types of nano-barcodes have been used for various applications and are preferred over micro-barcodes owing to their nanoscale size advantages.13 They have been widely utilized for bio-detection, imaging, anti-counterfeiting, theranostics, etc. and applications such as super resolution imaging and security monitoring are still emerging.7,11,14–21 Depending on the specific application, the design of nano-barcodes needs to be carefully considered and the selection could be based on some general requirements. First is the type of the encoding technique. Fluorescent nano-barcodes are preferred over other barcoding types for easy visualization during bio-detection and imaging applications. Contrary to this, nano-barcodes for security applications should be unique covert codes that are difficult to decode to provide a high level of security. Second, multiplexed bio-detection, multiplexed imaging and high-level security applications require multiple codes without spectral overlap, which could be challenging to achieve using fluorescent nano-barcodes. Third is the choice of dispersant of the barcodes for their stability during the applications. Imaging and bio-detection require hydrophilic nano-barcodes to be dispersible in physiological buffer. However, for anti-counterfeiting, both hydrophobic and hydrophilic nanoparticles have been used, which were dispersed using cyclohexane and ethanol, respectively, in printing inks.15 Fourth, the platform for application, such as use of solid substrates or suspension arrays, also needs consideration. Fixed substrates such as paper and plastic are required to print the nano-barcodes/particles for anti-counterfeiting applications. Conversely, the nano-barcodes for bio-detection are favoured in suspension arrays due to the flexibility and ease of mixing of nano-barcodes with the analyte in the suspension. Lastly, ease or difficulty of decoding the signal plays a significant role in the selection of type of nano-barcode. For instance, a simple readout technique is necessary to ensure the ease of decoding and cost-effectiveness for multiplexed bio-detection. Meanwhile, the decoding of nano-barcode-based high-level security applications should not be an easy one.4.1 Multiplex bio-detection
Studying multiple analytes in a single run of assay offers numerous advantages over traditional single-plex assays that measure one analyte at a time. Multiplexed bio-detection serves the purpose by studying the collective response of multiple analytes and provides reliable information with reduced processing time. After synthesis of nano-barcodes, additional steps are needed to perform multiplex bioassays. First, the nano-barcode needs to have surface functionalization that can be conjugated with the antibody for protein assay or DNA for nucleic acid hybridization. This functionalization can be mediated via chemical linkers such as in EDC/NHS or biotin–avidin. For successful detection of multiple analytes, distinct probes are conjugated on the surface of each code for distinguishing the different analytes bound to nano-barcodes. The detection system also requires reporter labels that need to be carefully selected to avoid spectral overlap with the signal from nano-barcodes. The multiplex bioassays require nano-barcodes with multiple unique codes with surface functional groups to conjugate probes such as antibodies or oligonucleotides for specific analyte recognition. The nano-barcode based multiplexing can be performed either in suspension or solid substrate barcodes and requires easy readout. In suspension format, the nano-barcodes are conjugated with capture biomolecules and suspended with the target molecules, such as nanobead or nanowire based assays, whereas on substrates, the nano-barcodes are arranged in a random or orderly fashion to carry out the detection.234 Use of nano-barcodes can help miniaturize the bio-detection system with smaller samples and reagent amounts, thereby contributing to developing point-of-care (POC) daignostics.136,205,235 Despite the advances, these multiplexed detections have not yet been translated to bioassays due to issues such as cross-reactivity and lack of labels for reporter molecules.235,236 Cross-reactivity arises from the non-specific bindings between the probe antibody on beads, detection antibody and analytes. This leads to consequences of high background and false positive results, thereby compromising the sensitivity and reliability of detection.236 Furthermore, optical cross-talk between the dye label for detection antibody and encoding elements is another challenge. To address this, the labels selected should have wide emission bands to avoid the cross-talk.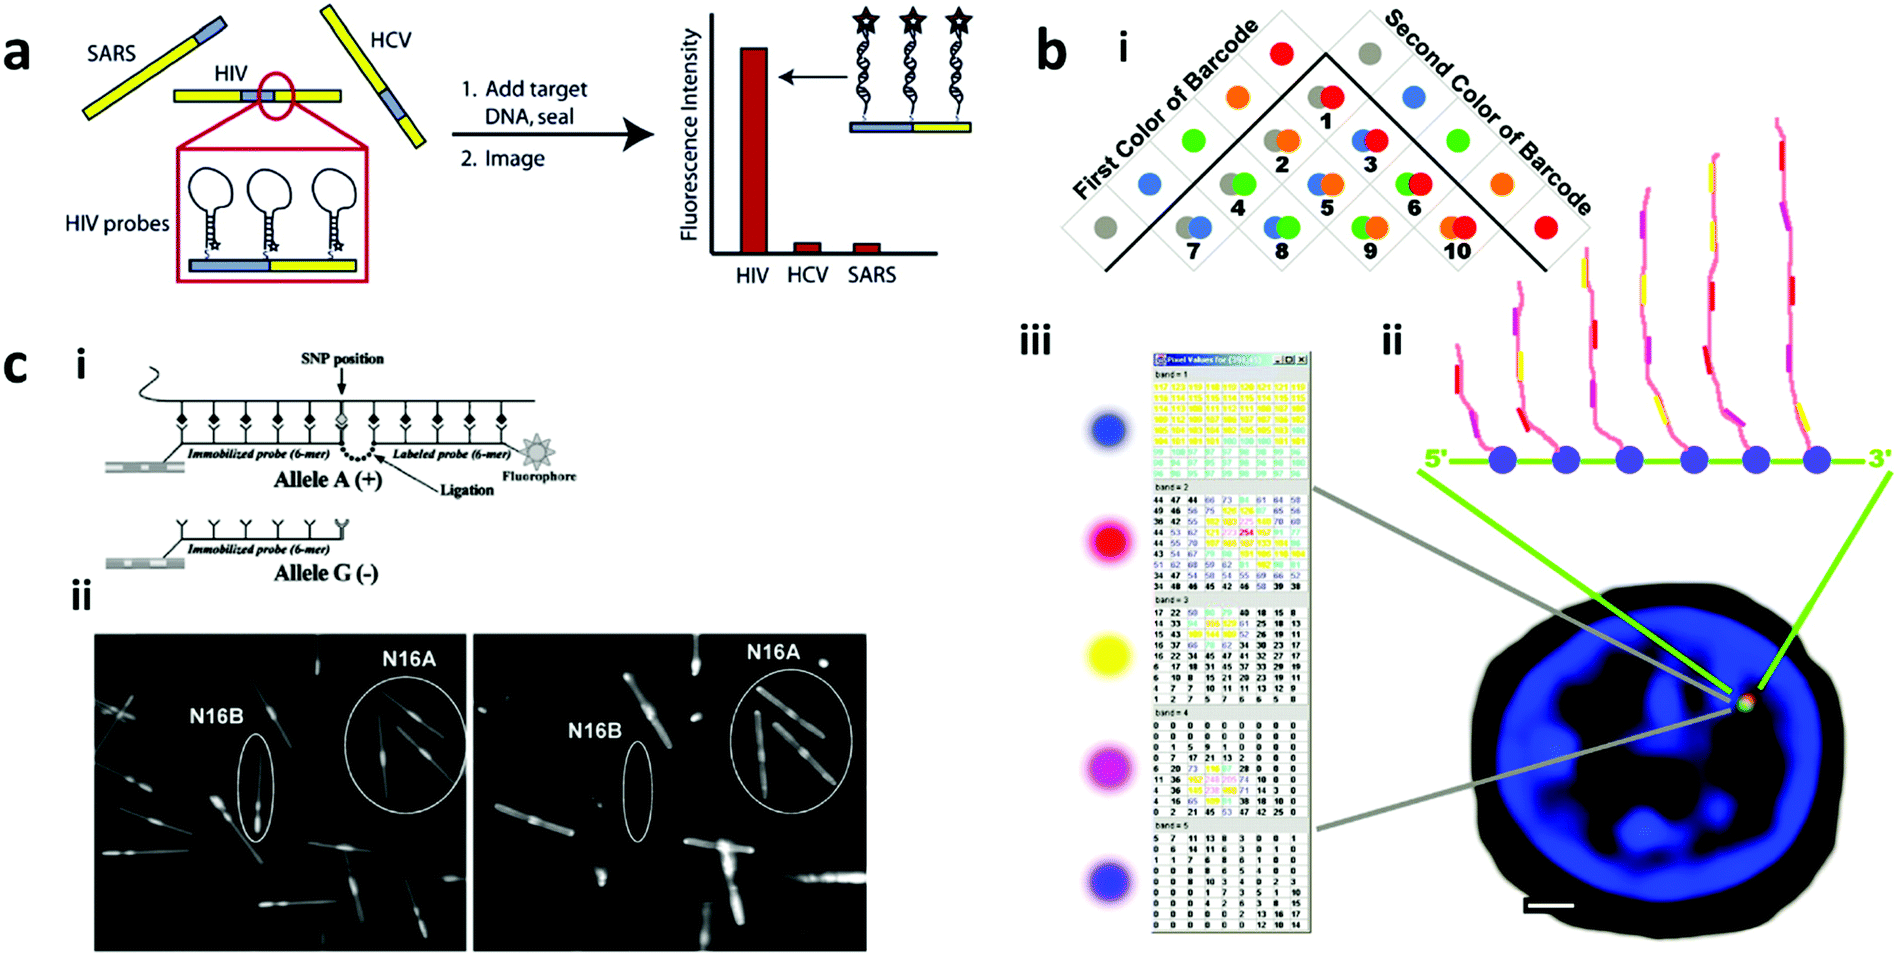 | ||
| Fig. 18 Nano-barcodes for multiplexed nucleic acid detection. (a) Multiplex DNA detection using Au–Ag nanowires based barcodes with a DNA molecular beacon. The hybridization event induces the fluorescence due to rearrangement of the beacon.214 (b) Single cell gene expression profiling using fluorescence-tagged DNA oligonucleotide barcodes that complement with the transcribed RNA. (i) Shows the different combinations of two fluorescence colours, (ii) barcode detection of probe hybridizations at the transcription site, (iii) an example of the signal readout from the barcode detection.237 (c) Single nucleotide polymorphism detection with Au–Ag nanowires.171 Figure panels reproduced from ref. 214 with permission from American Chemical Society, copyright 2006; ref. 237 with permission from AAAS, copyright 2011; ref. 171 with permission from Springer, copyright 2006. | ||
Optical nano-barcodes based on fluorescence are the most popular methods due to their ease of visualization. DNA-based fluorescence nano-barcodes with different ratios of green and red fluorescence probes have been used for multiplexed detection of B. anthracis, Ebola and SARS.225 Additionally, fluorescent DNA barcodes have been utilized to study the single cell expression (Fig. 18b). Furthermore, Au/Ag nanowires have been demonstrated for human immunodeficiency virus (HIV), hepatitis C virus, and SARS DNA detection.214 Hybrid barcodes of quantum dots on magnetic Au nanoparticles for DNA detection of bacteria S. aureus, methicillin-resistant S. aureus and K. pneumoniae have been reported based on oligonucleotide probes that showed detection limit as low as 102 CFU per mL.169 Fluorescence and SERS encoded nanosphere based hybrid barcodes have also been demonstrated for detection of multiple DNA targets.238 The graphical barcodes of bimetal nanowires of Co–Pt barcodes have been used for DNA hybridization and were shown to have the potential for miniaturization of bioassays.172 In another method, nanostructures with different atomic numbers have been used as nano-barcode arrays for multiplexed detection of DNA which showed detection limit up to the picomole level and required only 1 μL of diluted samples for decoding.11 Thermal barcodes with phase change nanoparticles encapsulated in a silica shell have been reported for multiplex detection of cancer DNA biomarkers with a detection limit of 8 nM.239 In addition to DNA strand detection, nano-barcodes can also be used as a tool to detect genetic variability in SNP. Graphical barcodes of Au/Ag nanowires have been used to perform multiplexed detection of 15 SNPs and detected 160 genotypes from 20 human genomic DNA (Fig. 18c).171 In another method, a DNA–Ag nanocluster with graphene oxide (GO) was used for the detection of multiple pathogenic genes including HIV genes, hepatitis B virus (HBV) genes, and syphilis (Treponema pallidum) genes. In this approach, the fluorescence of the DNA–Ag nanocluster was the basis for detection, which quenched when integrated to GO. Upon binding of target DNA to the probe DNA via complementary pairing, the DNA–Ag nanocluster gets desorbed from the GO and the fluorescence is restored, thereby allowing the detection and readout.240
Multiplex detection of short single stranded RNA has been achieved up to the sub-picomolar level on ssDNA functionalised silica nanoparticles. The detection mechanism depends on an enzymatic ligation process in the presence of T4 RNA ligase for efficient capture of the target RNA.241 Circulating small regulatory RNAs called micro-RNAs (miRNA) have also been detected by nano-barcodes by using DNA–Ag on GO, as described earlier for DNA detection. The detection specificity was ensured by isothermal strand-displacement polymerase reaction based amplification of the target.242 Upon coupling of the DNA–Ag nanocluster with target-assisted isothermal exponential amplification (TAIEA) the miRNA detection sensitivity was achieved down to 2 aM.243 The miRNA family members with high similarity were also demonstrated to be distinguishable by this method, thereby promising a simple, inexpensive and reliable detection approach. Furthermore, the fluorescence of the nanocluster was found to be tunable by changing the DNA sequence used and were distinguishable, therefore paving the way for multiplexed detection.243 A Raman barcode based label-free approach has also been utilised to detect miRNA present at low levels, with the potential for multiplexing based on SERS spectral peaks.244 Size-coded DNA barcodes detected multiple miRNAs down to 1 pM, simultaneously.245
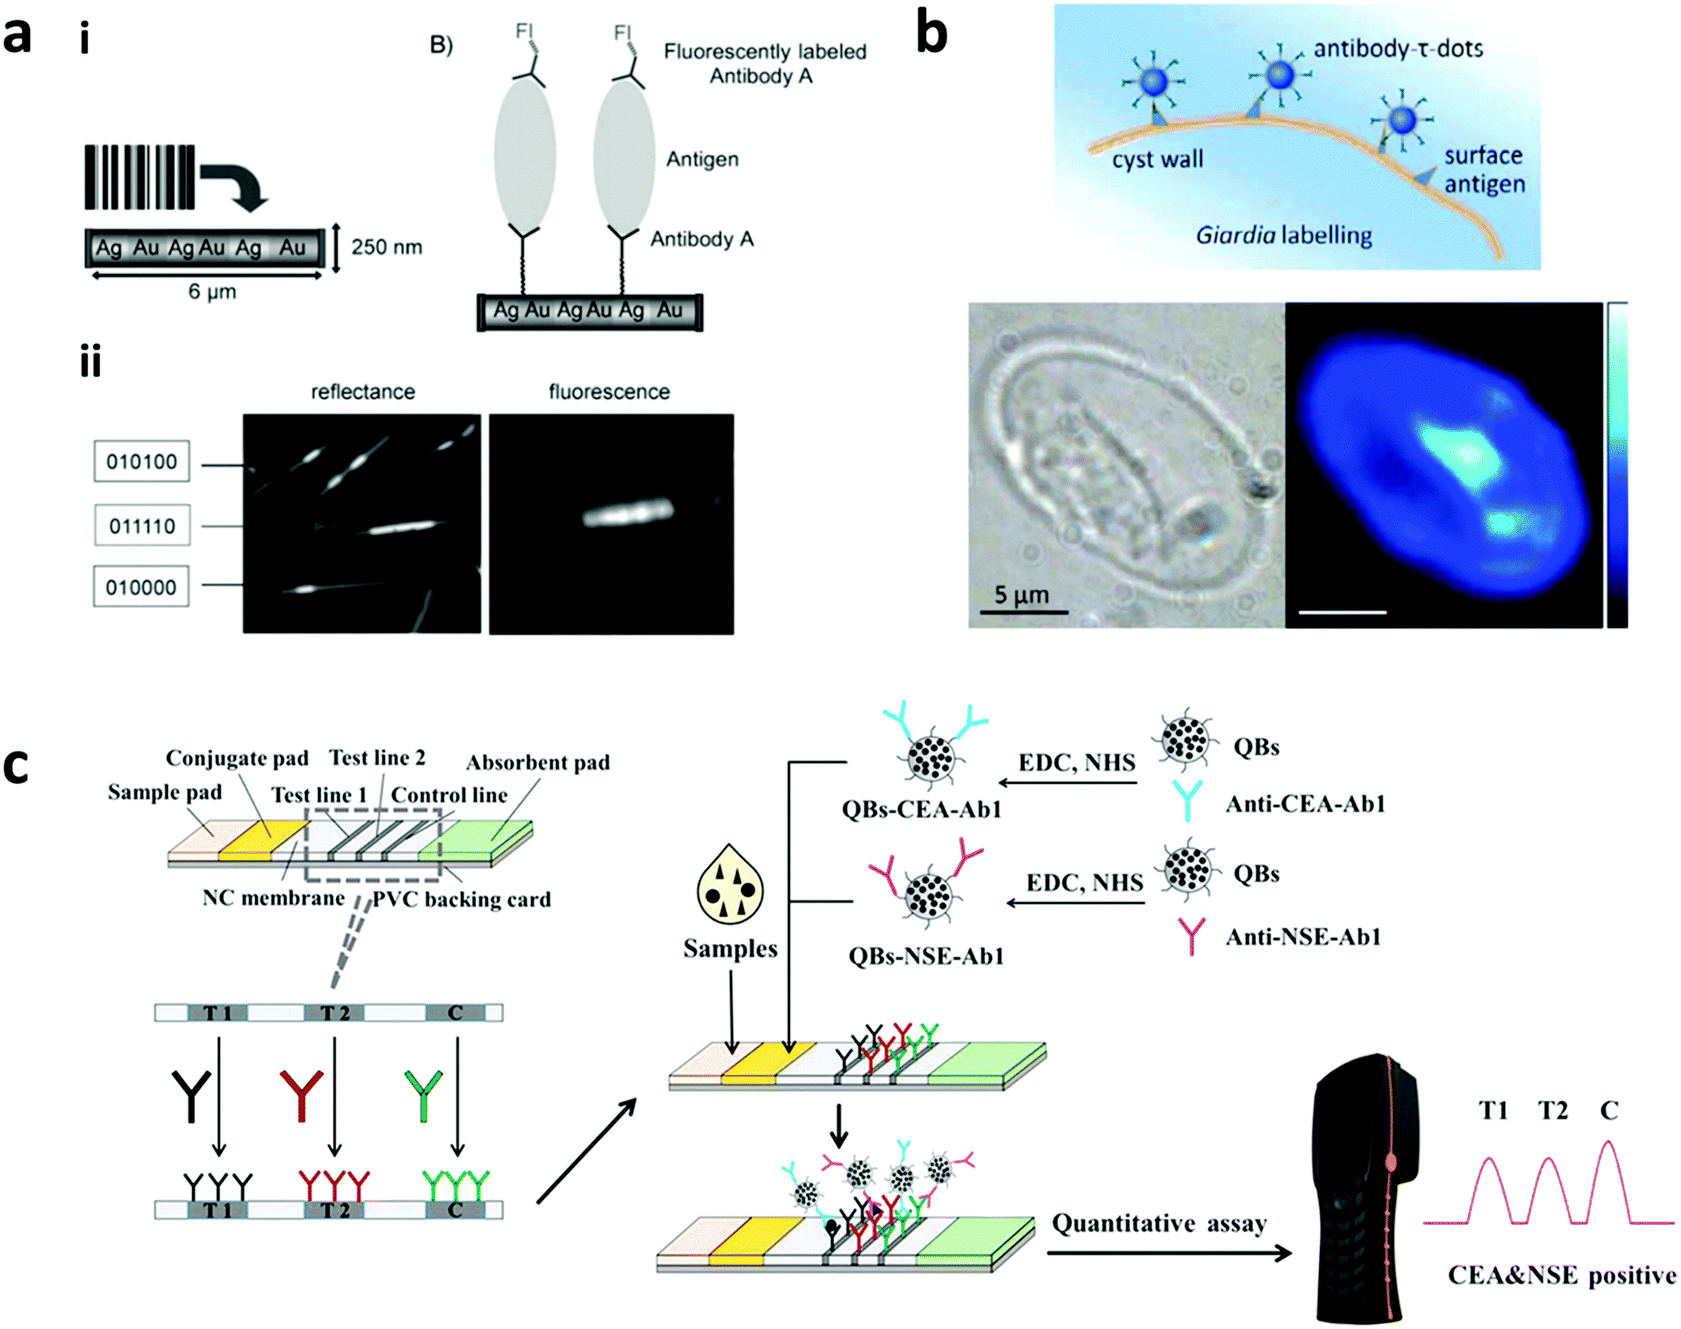 | ||
| Fig. 19 Nano-barcodes for multiplexed protein detection. (a) Nanowires for protein detection. (i) Sandwich assay on Au/Ag nanowire barcodes for detection of pathogens; (ii) shows different reflectance codes and fluorescence of the “011110” nanowire code.174 (b) Detection of giardia cyst using antibody conjugated fluorescence lifetime nano-barcodes.118 (c) Multiplexed detection using QD encoded nanobeads on a immunochromatographic paper test strip.234 Figure panels reproduced from ref. 174 with permission from Wiley, copyright 2006; ref. 118 with permission from Nature Publishing Group, copyright 2014; ref. 234 with permission from Elsevier, copyright 2017. | ||
Antibody-coated QD encoded nanobeads have been used to detect neuron specific enolase and carcinoembryonic antigens, biomarkers of small cell lung cancer.234 The detection was performed on an immunochromatography test strip (ICTS) for a cost-effective, rapid, easy-to-operate multiplex assay platform requiring minimum analyte amount for detection. A series of LED lamps were used as the excitation source and the readout was done by a portable test strip reader, thereby demonstrating the potential for developing point-of-care diagnostics as can be seen in Fig. 19c.234 DNA barcodes with different Alexa fluor dyes detected multiple proteins including green fluorescent protein, renilla luciferase, and heat shock factor.166 DNA barcodes have also been used as reporters for the detection of multiple protein targets including prostate-specific antigen (prostate cancer marker), human chorionic gonadotropin (testicular cancer marker) and [alpha]-fetoprotein (hepatocellular carcinoma marker) in suspension. The detection sensitivity and multiplicity were enhanced based on a scanometric assay via silver amplification done at the end.246 Fluorescence lifetime nano-barcodes based on NaYF4:Yb,Tm upconversion nanoparticles have been used for pathogen detection including Giardia lamblia, Escherichia coli, and Cryptosporidium parvum as can be seen in Fig. 19b.118 Thermal barcodes coated with antibody were demonstrated for multiplexed detection of different proteins (rabbit and human immunoglobulins).247 Multiple protein detection in suspension was also exhibited by shape-coded nanotubes using dye labelled reporters.248 To improve the assay sensitivity, nanotubes were encoded with magnetic nanoparticles along with shape-coding to detect multiple proteins without using dye labels as reporter molecules.205 Their decoding protocol is based on magnetism which shows high target selectivity and possesses the potential for assay miniaturization for POC testing.205
4.2 Imaging
The usage of nano-barcodes for imaging applications is a great advantage over micro-barcodes due to their nanoscale dimension making them suitable for biomolecule labelling and tracking. Nano-barcodes for imaging includes their use for labelling and tracking of biomolecules, as contrast agents and emerging applications such as super-resolution imaging. Choices for nano-barcodes for these imaging applications depend on several factors such as shape, biocompatibility, biodegradability, and stability of encoding elements inside the nanostructures. The shape of nano-barcodes is determined by the extent of damage they caused upon interacting with biomolecules with the one causing no damage being chosen. For example, compared to nanospheres, nanodisks allow lower cell uptake attributing to their disk-shape, thereby causing no impairments to cell and cellular activities.27 These nano-disks are thus favoured for safer imaging specific for cell-membranes and encoded nanospheres are chosen for imaging pertaining to cellular processes.27 Additionally, the material of nanostructure is also critical for employing the nano-barcodes for imaging applications. For instance, NMOF is highly preferred over other existing materials due to its intrinsic advantages of biodegradability and structure tunability.29 An important concern for in vivo imaging is the leakage of encoding elements from the barcodes which can have severe repercussions owing to the toxicity of the elements and serious efforts to improve their stability inside the nanostructure matrix have been made.249 Before using the nano-barcodes for in vivo applications they must be assessed for cytotoxicity based on the impairment of cell cycle, apoptosis and presence of reactive oxygen species, etc. Lastly, for in vivo applications, the routes of administration of these barcodes have an impact on the biodistribution in specific organs.QD encoded nanobeads with cyclic Arg-Gly-Asp (cRGD) targeting peptides were demonstrated for uptake by human breast cancer and cervical cancer cells. The barcodes after uptake showed a long lasting signal, which was attributed to the presence of cRGD peptides as can be seen in Fig. 20a.167 Disk shaped nanostructures encoded with fluorescein dye have been studied for the labelling and study of cell membrane. Contrary to the encoded nanospheres, the shape of nanodisks allows them not to be internalised by cells and are promising candidates for in vivo biomolecules and stem cell tracking.27 However, they might get accumulated in the cell membrane causing perturbations to the phospholipid arrangement in the membrane. Dye encoded silica nanobeads have been used in conjunction with Au nanocrystals decorated on the surface for imaging of highly reactive oxygen species (ROS) in live cells. The imaging was based on a ratiometric approach, where the fluorescence from Au nanocrystals in the barcode gets quenched in the presence of ROS. The work paved the way for the development of imaging platforms for monitoring of ROS signalling activities in real time.251 In a recent study, tetramethylrhodamine (TAMRA) and fluorescein (FAM) dye labelled adenosine-5′-triphosphate (ATP) aptamers were adsorbed on thin nanosheets of lanthanide loaded NMOF to study the ATP events in living cells.29 The fluorescence of these dyes quenches upon binding to the barcodes and gets restored upon hybridization with the target, when present. Recently, nano-barcodes with AIE-active dyes encapsulated inside silica nanoparticles were demonstrated for cellular uptake, displaying their promising bioimaging application.45 In another study, AIE-active dye encoded nano-barcodes were used for imaging of mitochondria after passing the cell membranes of HeLa and KB cells, thereby further displaying their potential to image specific organelles.46
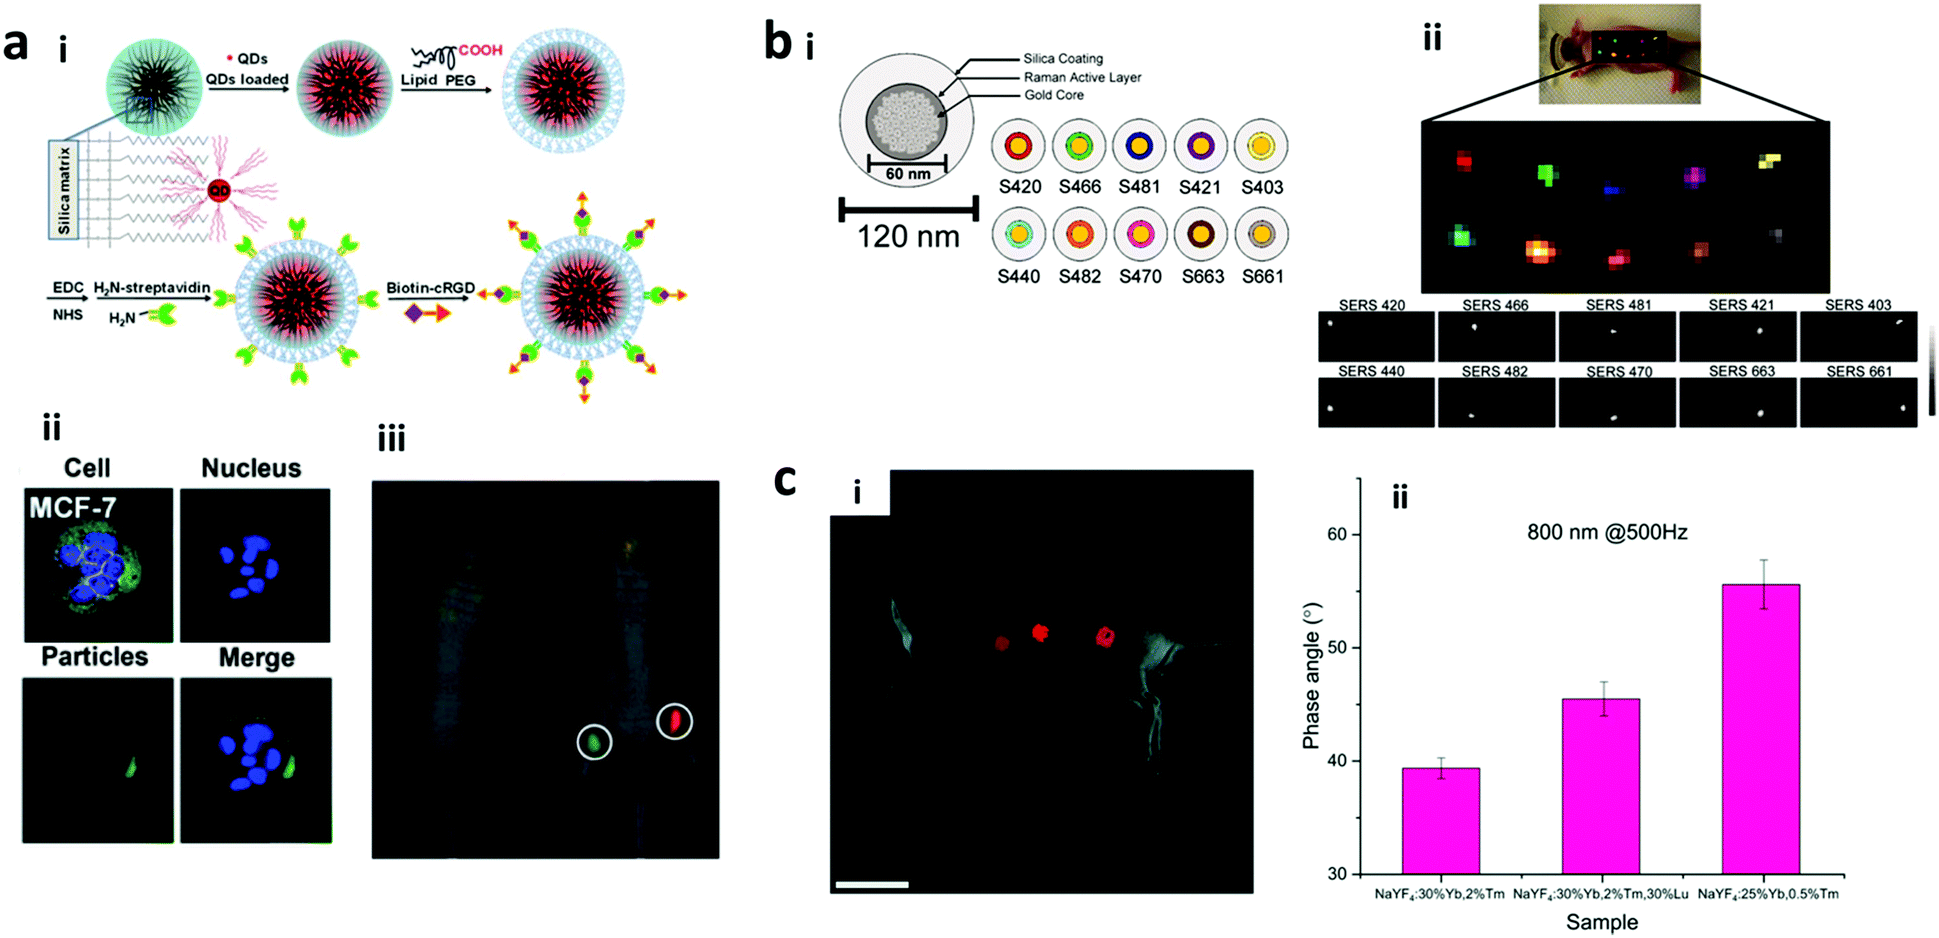 | ||
| Fig. 20 Nano-barcodes for imaging applications. (a) QDs encoded nanobeads based barcodes for imaging; (i) multi-colour QD loading to the mesoporous silica matrix of nanobeads of (ii) in vitro MCF-7 breast cancer cells (blue colour is nucleus stained with DAPI) and (iii) mouse in vivo imaging with red and green QD encoded nanobeads.167 (b) Raman nano-barcodes. (i) Design of the Raman nano-barcodes with 10 different Raman reporters; (ii) in vivo imaging using the Raman nano-barcodes.132 (c) Phase angle encoded upconversion nanoparticles. In vivo deep tissue imaging using three different upconversion nanoparticles that have (i) the same emission wavelength but (ii) different phase angles.17 Figure panels reproduced from ref. 167 with permission from the Royal Society of Chemistry, copyright 2012; ref. 132 with permission from National Academy of Science, copyright 2009; ref. 17 with permission from the Royal Society of Chemistry, copyright 2017. | ||
In comparison to fluorescent barcodes, Raman barcodes have benefits of nil autofluorescence (for down-converting fluorescent particles), little spectral overlap and absence of photobleaching. Encoded nanoclusters with magnetite nanoparticles and a thin shell of gold nanoparticles utilize the benefits of magnetic and plasmonic properties for imaging and sensing. The uptake of barcodes by human umbilical vein endothelial cells showed their imaging ability at the single cell level with the potential to be used for real-time monitoring of cellular events.252 SERS encoded hollow nanospheres conjugated with antibodies on the surface were used for multiplex imaging of the epidermal growth factor (EGF), ErbB2, and insulin-like growth factor-1 (IGF-1) for three human breast cancer cell lines MDA-MB-468, KPL4 and SK-BR-3.253 Multiple codes generated by encoding different SERS reporter molecules to gold nanostars have also demonstrated the multiplex imaging of five different types of breast cancer cells present in a cell coculture.128 Earlier, multiplexed in vivo imaging in the liver of living mice was performed by using SERS nano-barcodes as can be seen in Fig. 20b. However, SERS mapping was inefficient in deeper tissues as observed by the low signal-to-noise ratio.132 For deeper tissue imaging, lanthanide-doped upconversion nanocrystals are better alternatives.254,255 Phase angle encoding with upconversion nanocrystals has been used for multiple sites in in vivo deep tissue labelling as can be seen in Fig. 20c.132
Despite the advances made, the nano-barcodes’ potential for biomolecule tracking needs to be further understood in terms of their interactions with cells at the single-cell level, toxicity, and stability for maximum utilisation of the plethora of nano-barcodes.256
In this regard, encoded nanostructures, such as nanobeads, nanogels, nanorods and NMOFs, have been developed as better alternatives with the potential to tackle these issues. For instance, cleavable Gd(III) chelates were embedded in mesoporous silica nanospheres via labile disulfide bonds. Following the disulfide–thiol exchange, in the presence of endogenous reducing thiols, the contrast agent gets degraded from the nanosphere and cleared away from the renal pathway.257 The encoded nanostructure was imparted biocompatibility by surface coating with polyethylene glycol and exhibited target specificity by conjugating anisamide ligands onto it. In another effort, Gd-chelates embedded in biocompatible nanogels have been developed with improved contrast.249,258 It is noteworthy that the improvement of contrast was due to the crosslinking of gels that increased the relaxivity of contrast agents.249,258,259 Even when the nanogels were taken up by the liver or spleen, Gd3+ ions were retained inside the gel, thereby not causing any toxicity or organ impairments.249 Furthermore, the signal enhancement was reported to last for 7 days, thus allowing imaging to be done for longer time scales.249 Recently, Zhang et al. (2017) fabricated iodine-boron-dipyrromethene (BODIPY)-containing NMOF barcodes as contrast agents for CT scanning.260 The construct was well studied for in vitro and in vivo systems and was shown to impart minimal toxicity even at higher concentrations. Feridex-labeled neurospheres (nanoclusters made of neural cells) have been used as contrast agents to track the fate of stem cells using MRI. Stem cells are used for therapy in the treatment of diseased pathological conditions. Upon their transplantation at the diseased sites, it is critical to evaluate the functions and migration of stem cells to ensure a successful therapy.261
To establish multimodal and multiplex imaging using contrast agents, NMOFs with Gd3+ in the center of nanorods and nanoplates have been fabricated as contrast agents for MRI. The NMOFs contain tens of millions of GD3+ centers and hence are able to have a large relaxivity value and higher contrast.115 They can be made fluorescent by doping with lanthanide ions, Eu3+ and Tb3+ to realize the multimodal imaging. Core/shell nano-barcodes with QDs and magnetite nanoparticles were developed, that served as both probes and contrast agents.68 The antibody conjugation on the surface of these barcodes provided specificity for cancer biomarkers.68 Very recently, magnetic barcode imaging has been developed by identifying the particle relaxivities and molar susceptibility of various concentrations of SPIO (5 nm), Feridex (15 nm clusters of 5 nm particles), and micron-sized superparamagnetic iron oxide particles (MPIO), as shown in Fig. 21.9 The approach was quantitative in nature with specific targeting.9
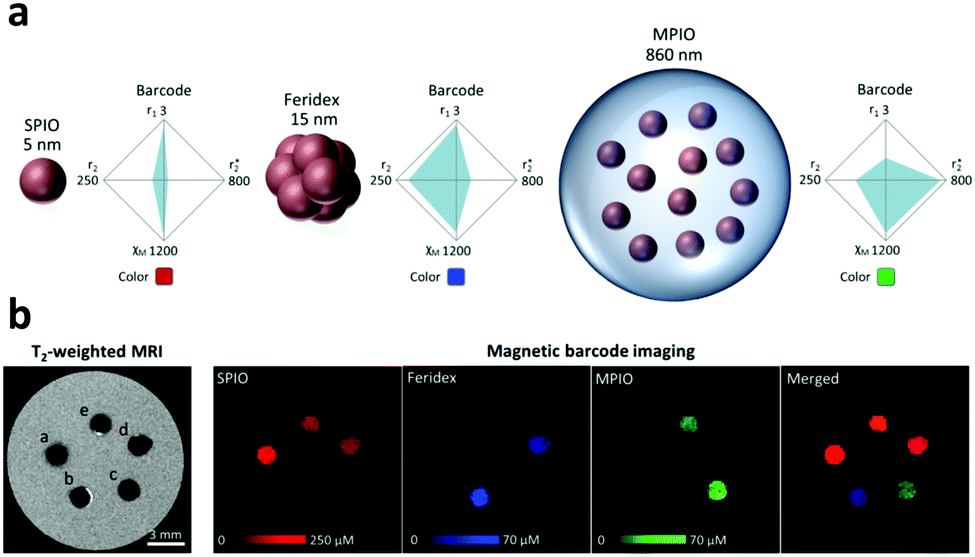 | ||
| Fig. 21 Nano-barcodes as contrast agents. (a) Magnetic barcode imaging using SPIO, Feridex and micron-sized superparamagnetic iron oxide particles (MPIO), which vary in size, relaxivities, and molar susceptibility. (b) The pseudocolour of MRI imaging for different concentrations of particles.9 Reproduced with from ref. 9 with permission from Wiley, copyright 2016. | ||
Importantly, one of the major challenges in super-resolution imaging is to determine the optical magnification and resolution of the image based on the fluorescence probes. To solve this problem, nanoscopic ruler based on self-assembled DNA has been proposed. The self-assembled DNA can be generated to have specific 3D structure, shape, and tagged with different fluorescence dyes allowing it to be utilised as versatile nano-barcodes suitable for the application of super-resolution imaging. More importantly, the length of the structure and the position of the fluorescent tag can be precisely controlled, even lower than the diffraction limit distance (Fig. 22a).224,263 The barcode multiplicity can be regulated by the number of fluorophores permitted per zone.262 Self-assembled DNA nanorods with different fluorophore locations and emissions have been produced, which are able to produce 216 different barcodes that can be used in the super-resolution imaging as can be seen in Fig. 22b.226 In a latest work, localization precision was achieved for super resolution microscopy using DNA nano-barcodes.262
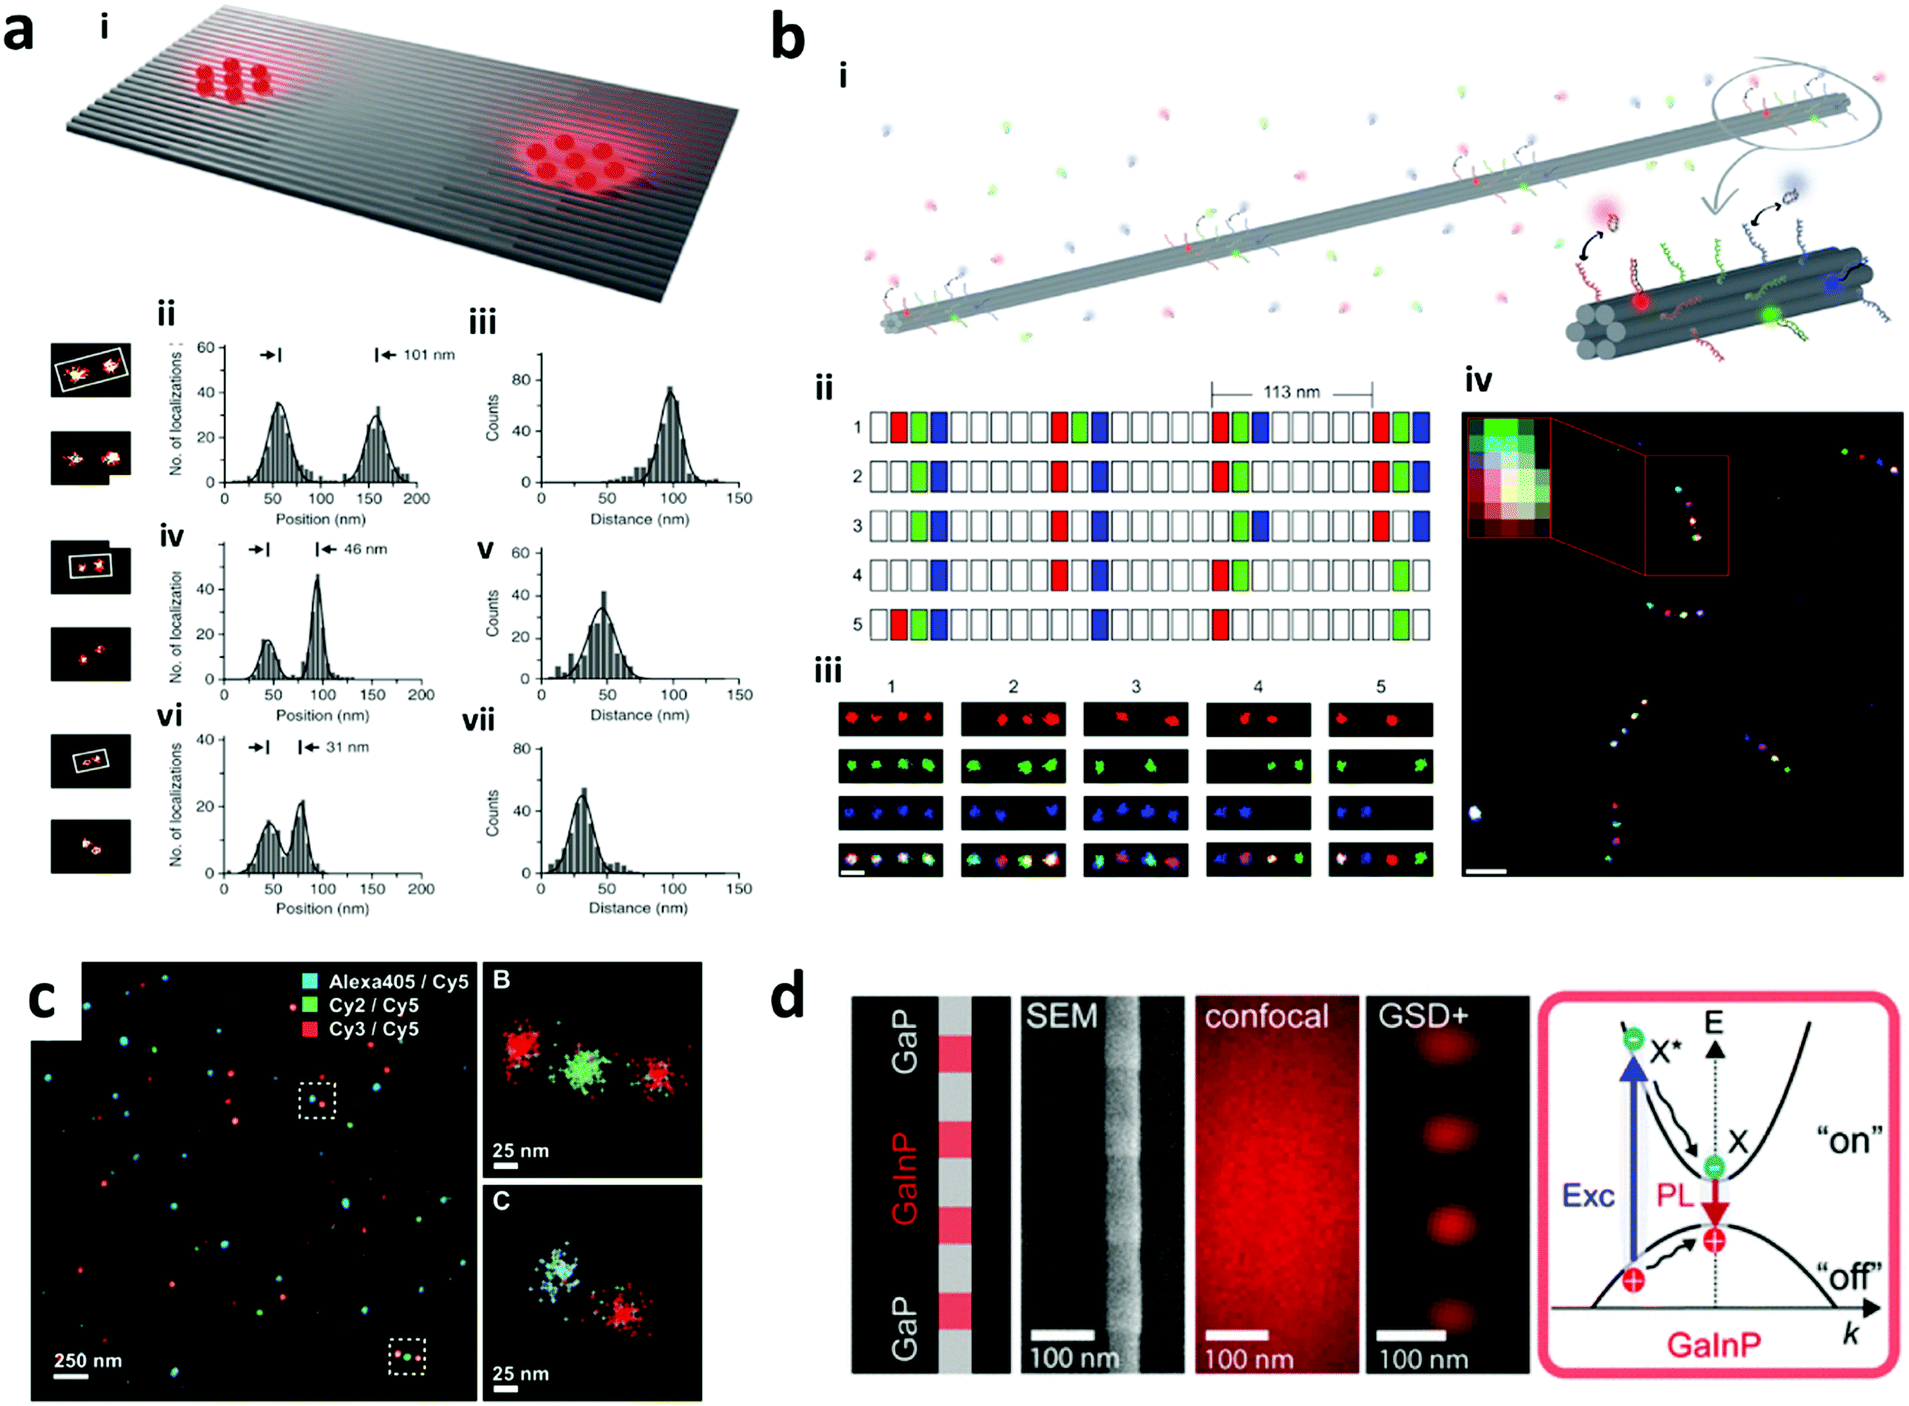 | ||
| Fig. 22 Nano-barcodes for super-resolution microscopy applications. (a) Dye-tagged DNA structures. (i) Self-assembled rectangular DNA with Alexa flour dyes located at a distance for nanoscopic ruler in super-resolution microscopy. The precise distance of dye position is demonstrated at (ii and iii) 98 nm (iv and v) 49 nm, and (vi and vii) 33 nm.224 (b) Submicrometer DNA nanorod barcodes. (i) illustration of the DNA nano-rod barcode; (ii) five multi-colour designs and (iii) their corresponding images in super resolution imaging; and (iv) the image of mixture of all five barcodes.226 (c) Pairs of photoswitchable probes for DNA imaging.265 (d) GaP/GaInP semiconductor nanowires for super resolution imaging.266 Figure panels reproduced from ref. 224, with permission from Nature Publishing Group, copyright 2014; ref. 226 with permission from the Nature Publishing Group, copyright 2012; ref. 265 with permission from AAAS, copyright 2007; ref. 266 with permission from American Chemical Society, copyright 2017. | ||
Multi-color barcodes with 20–30 nm resolution STORM imaging based on photo-switchable multicolour codes have been reported. Each colour code consisted of a pair of organic dyes with one acting as an activator and the other one as a reporter. The activator assists in light-based activation of the reporter, and the latter responds in shuttling between its fluorescent and dark states. Based on the combinatorial pairing, multiple unique codes can be generated. These photo-switchable probes enable control over changing the emission of the fluorophore at a given time, thus resulting in the accurate localization of fluorescence.264 For instance, the dye pairs of Alexa 405 (reporter) and Cy5 (activator) required violet laser for their activation, and were switched to the dark state after exposure to a red laser, whereas different pairs of Cy2–Cy5 and Cy3–Cy5 required blue and green lasers to be activated respectively, resulting in multicolour codes for imaging (Fig. 22c). Based on these findings, secondary antibodies labelled with Cy2-Alexa fluor 647 and Cy3-Alexa fluor 647 were demonstrated for imaging of microtubules and clathrin protein, respectively.265
Encoded nanowires have also been explored for their promising application of super-resolution imaging. These encoded nanowires were composed of alternating non-fluorescent GaP and fluorescent GaInP, as shown in Fig. 22d. To achieve super-resolution imaging, this barcode can be controlled in the “on–off” state by the ground state depletion process. Upon excitation, the electrons get transferred from the valence band to the conduction band, which was designated as the on (signalling) state and the transfer of the electrons out of the valence band was named the off (non-signalling) state.266
Super-resolution imaging was also developed using the pattern-matching technique that was based on the fluorescence decay and spectra and patterns of fluorescent dyes. Here, ATTO 488, Alexa Fluor 488 dyes, and ATTO 490LS with lifetimes of 4.07 ns, 4.16 ns, and 2.63 ns, respectively were chosen for the multiplexed super-resolution imaging. Upon excitation by alternating three different pulsed lasers at 485 nm, 532 nm and 640 nm, the fluorophores exhibited difference in emission spectra and decay patterns. Additionally, to introduce multi-exponential fluorescence decays, these dyes were conjugated to antibodies or tryptophan-containing peptide phalloidin. After labelling the cell components, the spectral and decay patterns obtained were analyzed using a pattern-matching algorithm. The imaging sensitivity via this approach was found to be very high with signals being identified even for small spectroscopic changes. Using this approach, multiplexed imaging of up to nine different targets in mouse myoblastoma cells and three different targets in human osteosarcoma cells was achieved.267
This technology is still in its nascent phase and would require more exploration to use them in in situ systems with the dynamic cell membrane. Furthermore, for analysing the sub-cellular moieties these structures are rather bulky that necessitates the utility of compact and stiff nano-barcodes.226
4.3 Security
Nano-barcodes use for security applications can be segmented into three areas which are anti-counterfeiting, tracking and monitoring. In anti-counterfeiting, the nano-barcodes are placed on the items to ensure the authenticity of the product. The nano-barcodes are also capable of being used for tracking of hazardous products that may be misused such as explosives and narcotics, in which the origin and distribution can be traced by analysing the barcodes. Monitoring application, on the other hand, uses unique nano-barcodes that can be transferred from items of value to the offender upon contact to provide physical evidence of criminal activities involving the items for forensic investigations.The most popular strategy for preparing anti-counterfeiting tags is to combine optical and graphical barcoding methods. Different nanoparticles or encoded nanostructures can be dispersed in the ink to be printed on substrates in desired patterns. The factors such as choice of ink medium, type of nanoparticles, dispersion of nanoparticles in the ink medium, ease and cost of printing should be well-thought-out for developing the taggants. Besides, the surface properties of the substrate for printing such as drug capsules, paper, and plastic foils are critical for efficient printing. Ink medium should be viscous to have sticky behaviour for printing with high boiling point to sustain the boiling step during mixing of barcodes. The nanoparticles chosen can be fluorescent, SERS-based, magnetic, or in combinations to achieve the desired level of security. The printing of patterns can be done by different modes like screen-, aerosol jet-, and inkjet printing as can be seen in Fig. 23a.111 Barcodes based on photonic crystal have also been incorporated into bank notes for anti-counterfeiting.124 Different fluorescent and non-fluorescent nanoparticle based security inks have been developed for preparing the barcodes for anti-counterfeiting purposes. For instance, Gupta and co-workers prepared security inks using Eu3+-doped Y2O3 and Eu3+-doped LaPO4 nanorods, in separate works.269,270 Later, full coloured images using downconversion lanthanide-based security inks emitting green and red colours were printed on paper. Recently, multicolour lanthanide-doped Y2O3 nanorod based inks have been used for generating printed logo and QR codes for anti-counterfeiting applications.137 These images were invisible to the naked eye and can be visualised by excitation under UV.271 Lanthanide ion encoded NMOFs in inks printed on flexible substrates like paper and plastic foils have been developed for preventing the counterfeiting of confidential official documents.272 In another study, branched polyethyleneimine (BPEI)–CdTe QD-based barcodes were prepared to develop multicolour rewritable systems. BPEI acts as the writer and eraser based on the adsorption and degradation of fluorescent patterns to provide multistate and high capacity data storage for highly secured memory chips for anti-counterfeiting.273 For fluorescent barcodes, lanthanide-doped upconversion nanocrystals are favoured over down-converting fluorophores since the latter suffer from shortcomings such as easy imitation, background noise, and photobleaching (for organic dyes).274 Lanthanide-doped upconversion nanocrystal based barcodes that can be excited by using NIR laser and emit different emission wavelengths are usually used for low level security applications. By coupling this with graphical encoding, the security level of fluorescent barcode based taggants can be enhanced.7,15 Bluementhal et al. (2012) dispersed NaYF4:Yb,Er in toluene based ink containing methyl benzoate (boiling point −199 °C) followed by direct-write printing on paper to generate quick response (QR) codes.275 You et al. (2016) fabricated QR codes based on both hydrophobic and hydrophilic lanthanide-doped upconversion nanocrystal printing inks using cyclohexane/glycerol trioleate and ethanol/glycerol dispersants, respectively, for investigating drug counterfeiting.15 Three different colours were created, viz. NaYF4:2% Er,18% Yb (green), NaYF4:10% Er,2% Tm (red) and NaYF4:25% Yb,0.3% Tm (blue), and were surface modified and incorporated into inks separately. Next, using an inkjet printer, these different colours were printed as a series of RGB colours by overlapping the three primary colours to generate a three-dimensional (3D) RGB code. These codes were printed directly on the surface of the drug capsule, thereby assigning a taggant to the drug with information at each layer. To assist the decoding of the drug information, a smartphone app was custom-made that can be directly printed on the drug capsule.15 Recently, Sun et al. (2017) prepared three different types of lanthanide-doped nanocrystals that can be excited at different wavelengths and printed a four-leaf clover pattern on a paper.7 For decoding, the pattern can be read following the sequential exposure at different wavelengths. Further information can be obtained as multi-peak spectra owing to the characteristic emission of each upconversion nanocrystal used.7 NIR-to-NIR upconversion security inks were also prepared to print the QR codes visible only upon excitation under NIR excitation (800 nm).112 Additionally, security inks with dual mode emission (both down- and upconversion) using Y2O3:Yb3+/Er3+ nanorods have been prepared using polyvinyl chloride (PVC) gold medium for currency and confidential documents.143 These security inks were transparent in nature and were printed on black paper using standard screen printing and provided multi-stage excitation features.143 Furthermore, three sets of upconversion nanoparticles with different luminescence lifetimes have been printed to create three different generated patterns when time-resolved scanning is used.118
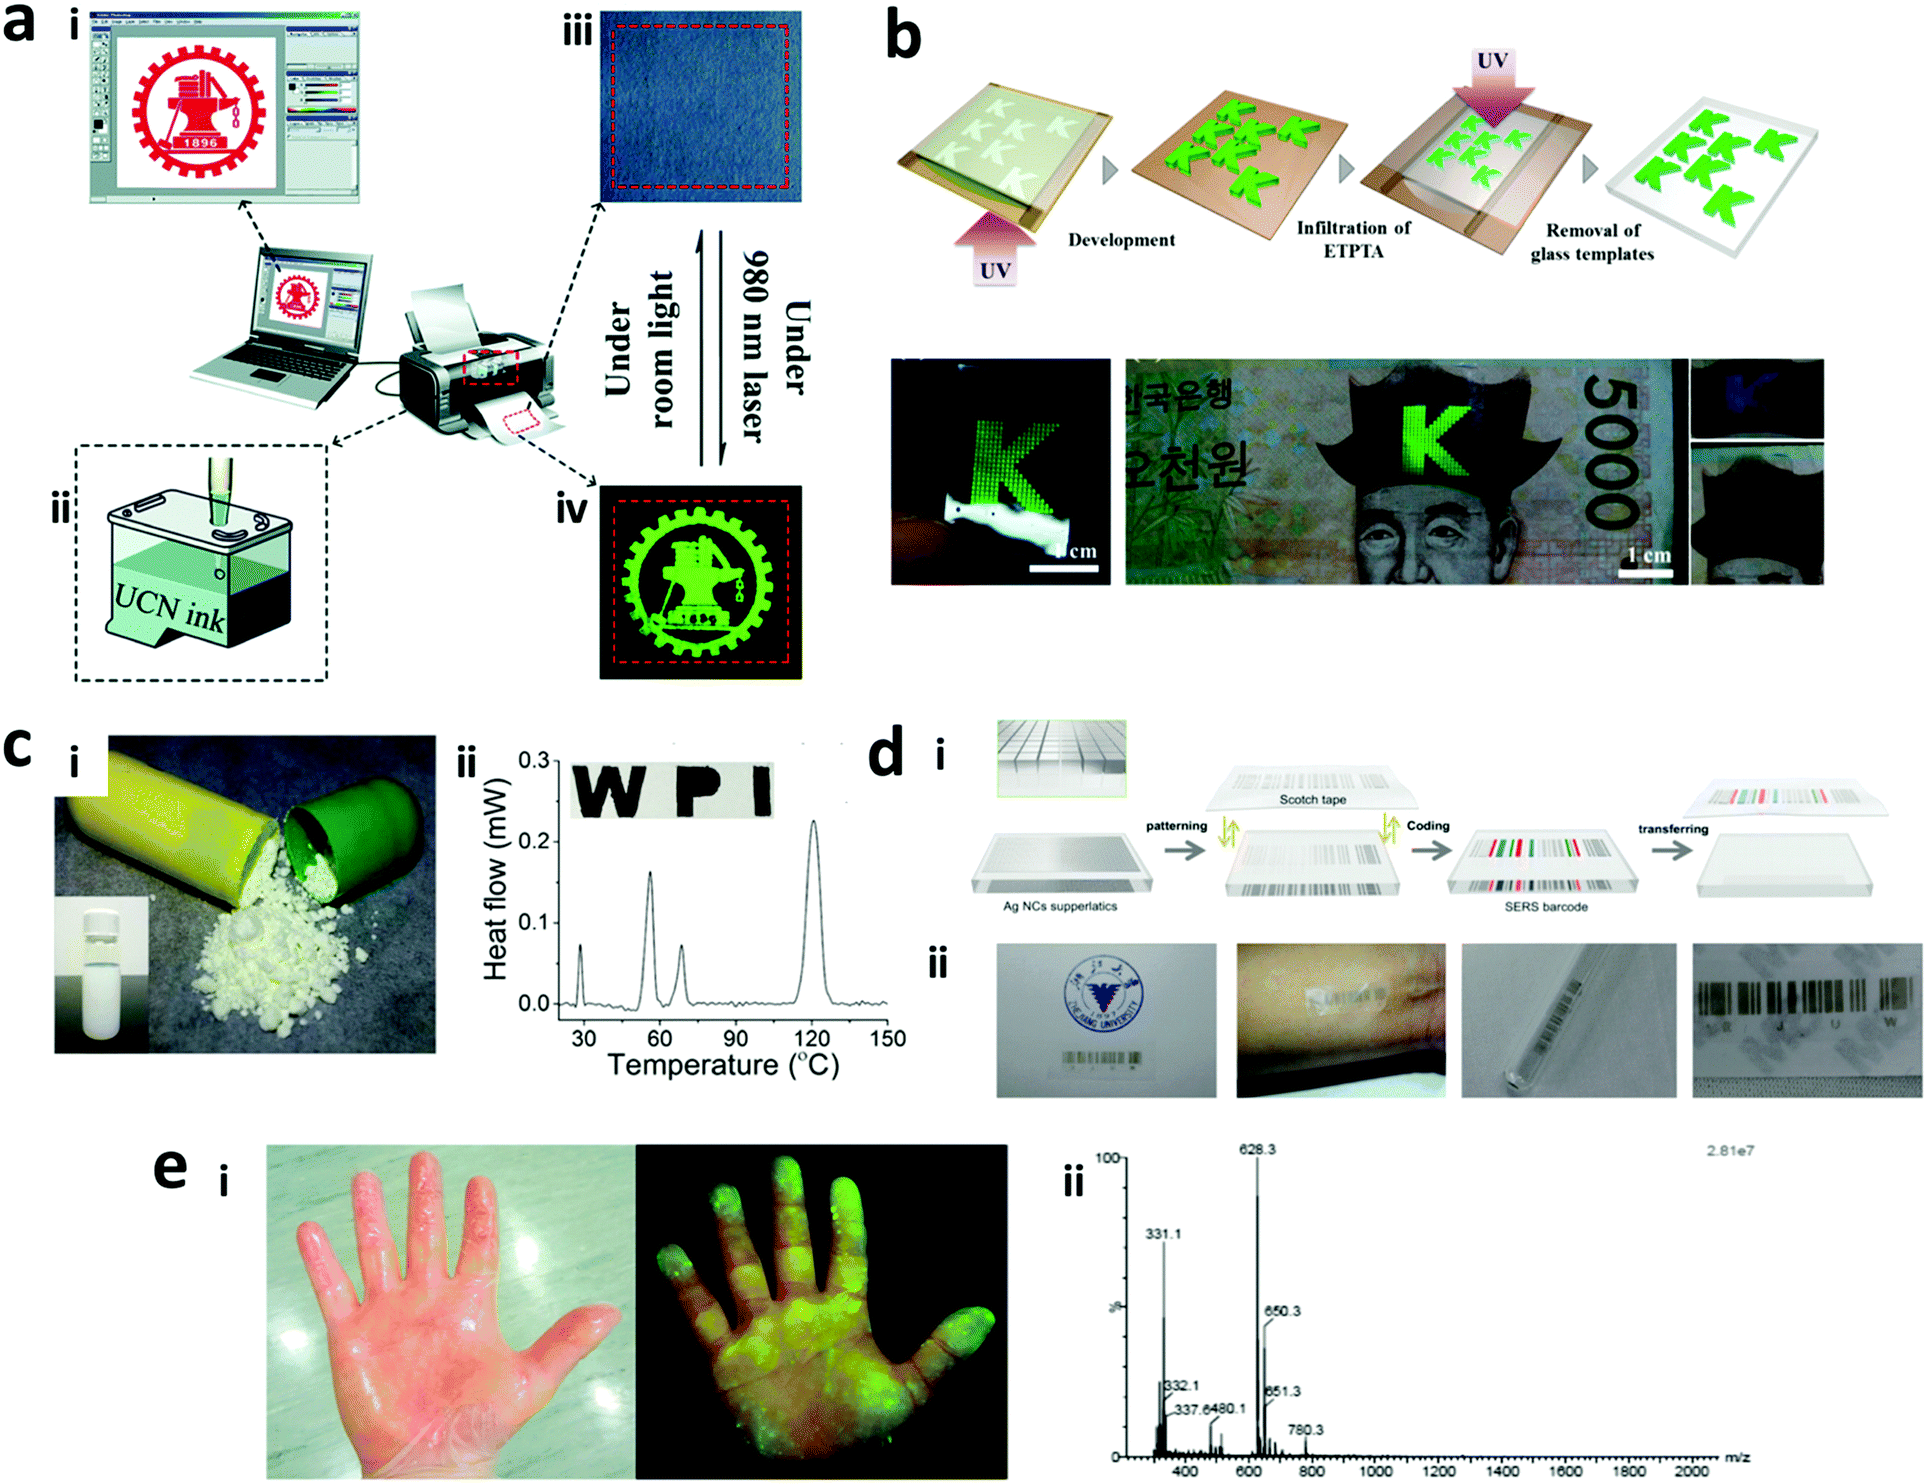 | ||
| Fig. 23 Nano-barcodes for security applications. (a) Submicrometer DNA nanorod barcodes. (i) Illustration of the DNA nano-rod barcode; (ii) five multi-colour designs and (iii) their corresponding images in super resolution imaging; and (iv) the image of mixture of all five barcodes.111 (b) Photonic crystal-based nano-barcodes for bank note anti-counterfeiting.124 (c) Thermal barcode for drug anti-counterfeiting by (i) mixing it with drug powder and (ii) encoding in printed letters.160 (d) (i) 2D SERS barcode in combination with an optical barcode for anti-counterfeiting (i) based on Ag superlattice (ii) that can be pasted to paper, skin, glass and plastic.144 (e) Fluorophore combined with unqiue peptide codes for monitoring criminal activity; (i) the fluorescence trace on the palm contacted with the nano-barcodes; (ii) mass spectrometry analysis of the peptide codes.152 Figure panels reproduced from ref. 111 with permission from the Royal Society of Chemistry, copyright 2015; ref. 124 from Nature Publishing Group (CC BY); ref. 160 from Nature Publishing Group (CC BY); ref. 144 with permission from Wiley, copyright 2016; ref. 152 with permission from American Chemical Society, copyright 2016. | ||
Although advances have been made to provide high level securities using fluorescent barcodes, they are easily visualized based on their fluorescent properties, thereby alerting the offenders. Thus, non-fluorescent optical barcodes such as Raman barcodes with advantages over fluorescent barcodes are chosen as an alternative for preparing barcodes with high security properties. Cui et al. prepared security labels based on Ag nanowire barcodes encrypted with a single probe (4-methylbenzenethiol, 4-MBT) as molecular information was used for anti-counterfeiting applications and can only be read out by x- (θ = 0°, ↔) and y-polarizations (θ = 90°, ↕) of light to get the full image.276 The same group further increased the multiplexing of the security label and added two probes (4-MBT and rhodamine B isothiocyanate).277 Fluorescent gold nanocluster based inks were used as security labels, visible under UV excitation. The fluorescence emission was tunable based on the reaction time in microwave-based synthesis; emitting blue-shifts with increase in reaction time.278 The non-fluorescent nano-barcodes based on the phase change of organic-solid nanoparticles have been used for drug anti-counterfeiting by mixing the nanoparticles with the drug powder as can be seen in Fig. 23c. The anti-counterfeiting for liquid substrates has been reported with sequence encoding. Using DNA on a Fe2O3 nanoparticle encapsulated with a silica shell, the sequence of the DNA is stable and preserved inside the oil even at high temperature for oil tracing. The retrieval of the nanoparticle is performed using a magnetic field and the DNA code is decoded using DNA sequencing.151
To confer multi-layer security, the plasmonic nanoparticles are used in combination with other barcoding methods. Dye encapsulated SERS nanopillars were used to prepare covert nanoscale patterns for anti-counterfeiting and the decoding was based on fluorescence and SERS spectra.19 Furthermore, Campos-Cuerva et al. (2016) prepared security prints based on Au, Ag and magnetic nanoparticles.279 The labels were printed on papers using screen-printing and it was demonstrated that they can be read independently based on their characteristic regardless of their location in the same spot on the paper substrate.279 The multidimensional SERS barcode based on the combination of optical and SERS code with Ag nanocube superlattices has been fabricated to be compatible to be put on many substrates including paper, plastics, skin and glass as can be seen Fig. 23d.144 The combination of fluorescence and phase angle encoding has been reported to generate double layer security for anti-counterfeiting.17
5. Challenges and potential solution
Nano-barcodes have been developed intensively in the last two decades to improve the encoding capacity, create new types of nano-barcodes and improve their synthesis processes. However, very few have been established and used for commercialization and real applications. The existing problems and their potential solutions will be discussed in this section, focusing on increasing the encoding capacity, development of portable decoders, improvement of synthesis methods, safety and regulation for the usage of nano-barcodes.5.1 Encoding capacity
Several encoding techniques often pose limitations in obtaining multiple number of barcodes for a specific application. For instance, the fluorescence based nano-barcodes are the most widely used encoding method with well-established synthesis and decoding techniques. However, fluorescent nano-barcodes suffer from limitations of spectral overlap, which results in limited number of codes and requires complex processing to resolve the overlapped spectra especially for multiplexing applications. For instance, organic dyes have spectral overlap due to their small Stokes shift. With regards to this, lanthanide-doped upconversion nanoparticles are preferred due to their large anti-Stokes shift. However, lanthanide-doped upconversion have multiple emission peaks and their use for multiplexed applications leads to spectral overlap posing difficulty in resolving the signal. To solve this, fluorophores with narrow spectra and single wavelength emissions are needed to be developed. Attempts to develop such lanthanide-doped upconversion nanocrystals have been made,280–283 which, however, needs to be further improved in terms of its intensity to be used in multiplexing application. Having lanthanide-doped upconversion nanoparticles with a single emission band will also allow their use as a label for reporter molecules and contribute in developing simple, cost-effective and efficient assay platforms. Another limitation in using the fluorescent nano-barcodes arises in applications like multiplexed detection that requires additional labelling for the reporter molecules to accomplish the detection, which is also typically fluorescence based. When upconversion nanoparticles are used in combination with organic dyes, multiple excitation lasers are required, thereby increasing the detection cost and complexity. For instance, Zhang et al. (2011) used upconversion nanoparticle encoded nanospheres for bio-detection in conjunction with cascade blue-labelled reporter antibody. In this work, for upconversion nanoparticles, a 980 nm laser was used for excitation, whereas for a cascade blue label, a 400 nm laser was used.13 However, this can be circumvented by utilizing the FRET process between upconversion nanoparticles as donors and organic dyes as acceptors. In order to achieve this, selection of dye should be done based on the overlap between the emission spectra of upconversion nanoparticles and the excitation spectra of the organic dye, which in turn limits the available labels to be used in combination with upconversion nanoparticles. Additionally, the distance between the organic dye and upconversion nanoparticles must be optimum for FRET to occur (∼10 nm). This can be addressed by tuning the size of the particles.284,285The photonic crystal-based structure colour encoding technique gets limited by the availability of distinct reflectance peaks of the particles. The morphological encoding technique also suffers from incapability to generate a large number of codes due to limitations of multiple discrete shapes and sizes. Likewise, lack of unique composition-based magnetic nanoparticles limits the encoding capacity of the magnetic-based encoding technique. To address this challenge, different encoding methods can be combined to prepare hybrid nano-barcodes, as discussed earlier. The challenge here is integrating the encoding elements together in a barcode and employing the decoding instruments for each type of encoding technique as this can increase the overall operation cost and complexity. At this front, miniaturized, cost-effective and customized simple decoders need to be developed.
5.2 Portable decoders
As nano-barcodes are used for various applications ranging from multiplexing and anti-counterfeiting, portable read out systems are required for enabling outside-of-the-laboratory testing which can be used for point-of-care testing to reach the mass market. A portable handheld Raman spectrometer has been developed and used for anti-counterfeiting of bank notes using SERS nanosheets by comparing the signal from the standard code of molecules, as can be seen in Fig. 24a.134 Furthermore, the portable Raman spectrometer has been proposed to decode the SERS code from dual-coded nanosheets for anti-counterfeiting purposes.286 Another emerging portable decoder is smartphones which have high resolution camera and computing power, allowing for detection of optical based barcodes, including colour and graphics. Several smartphone based decoders have been developed, such as for scanning the Raman codes, upconversion nanoparticle ink-based 2D barcodes, photonic crystal barcodes and also detecting the optical density of lateral immuno-assay based SERS barcodes, as shown in Fig. 24b and c.123,144,287 Some of these require the design of smartphone dongle to add more components for enhanced functioning such as sample holders, lenses or filters. Customized smartphone application is also required for processing the captured signal, such as colour deconvolution and examining the similarity of Raman codes. A handheld test strip reader has also been used for simultaneous detection of neuron specific antigens using QD-encoded nanobeads.234 However, the application of the portable decoder of nano-barcode is mostly limited to anti-counterfeiting. The need for a portable device is the most important requirement for point-of-care diagnostics and imaging in resource-poor settings. Furthermore, the processing algorithms need to be developed and incorporated in conjunction with the portable decoders to analyze the signals from multiple nano-barcodes for real-time applications.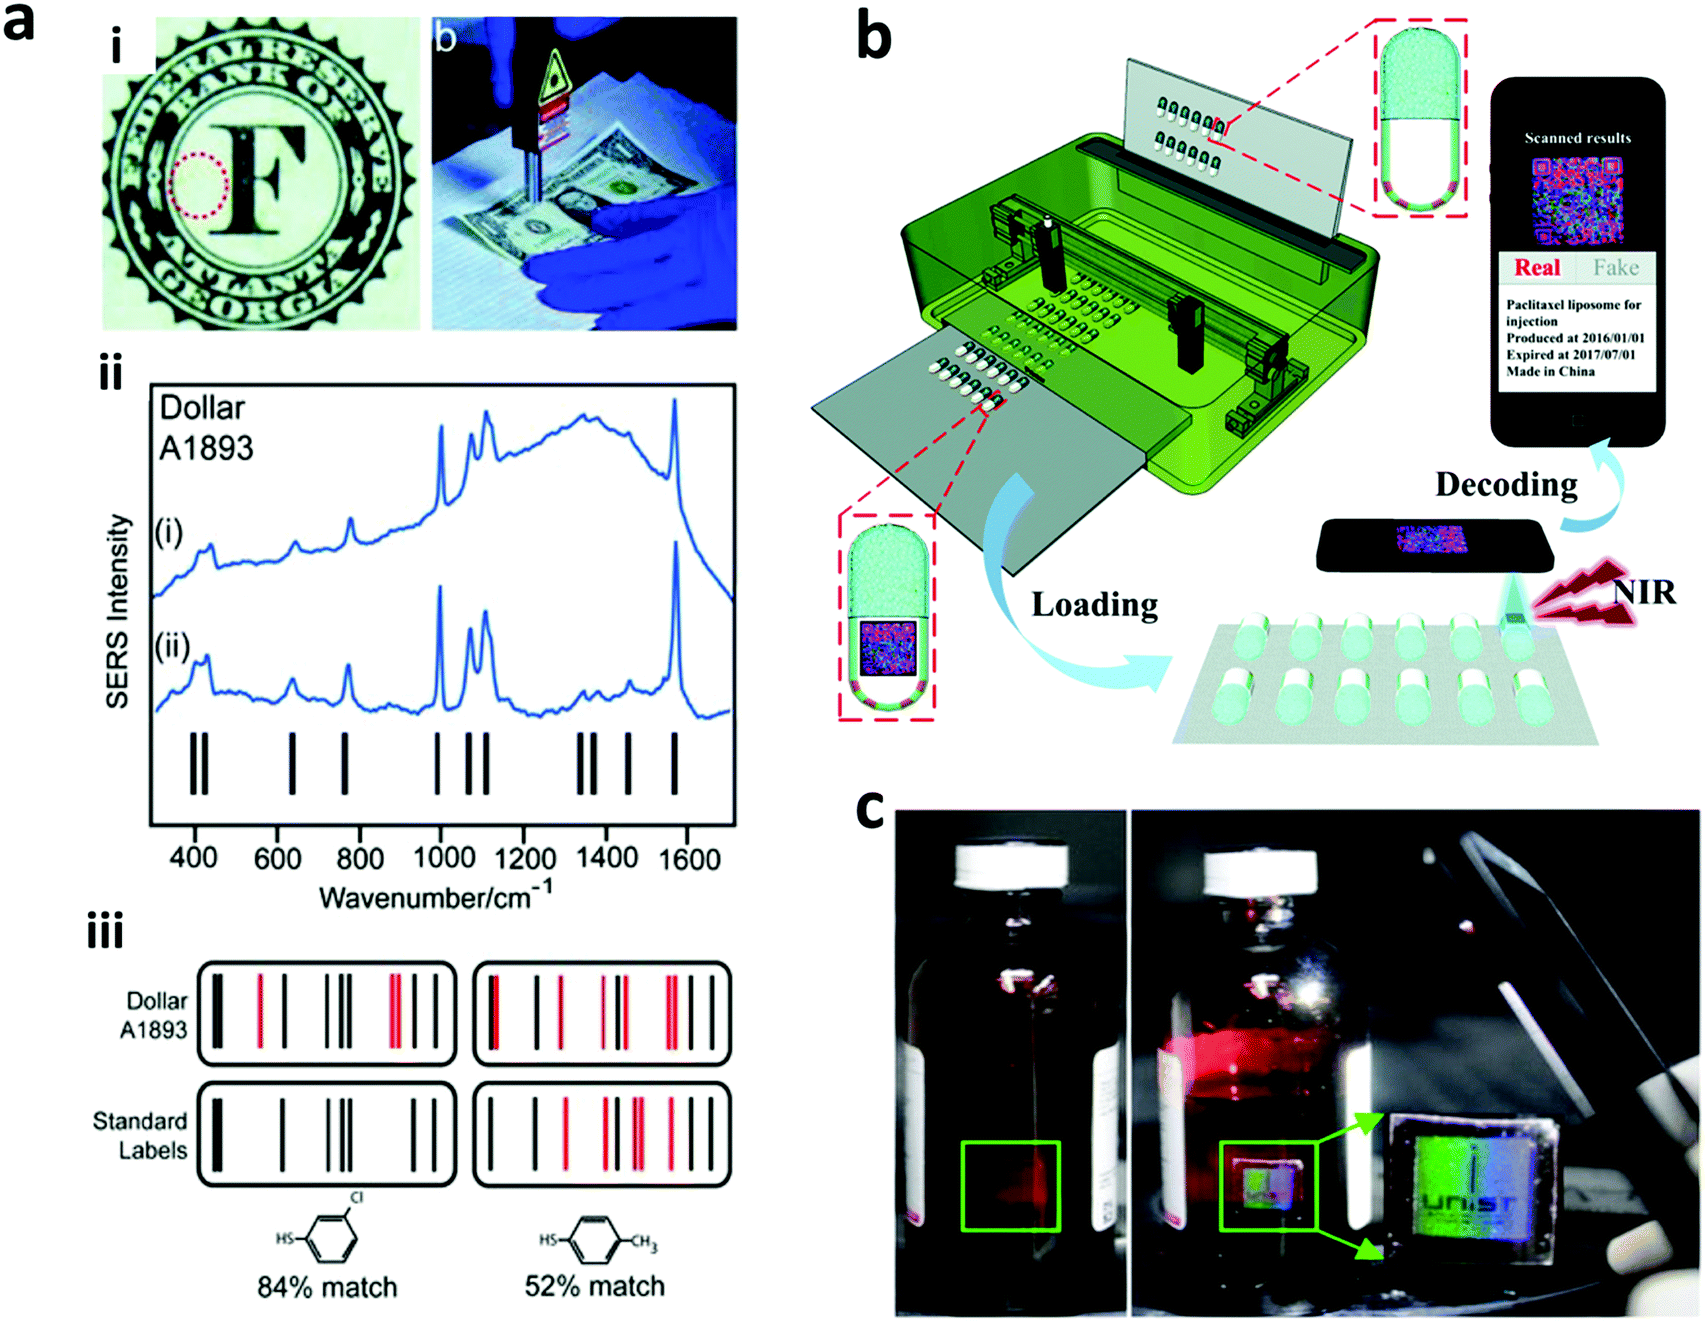 | ||
| Fig. 24 Portable decoders for nano-barcodes. (a) Portable handheld Raman spectrophotometer (i) for authenticating the bank notes with Raman nano-barcodes; (ii) the Raman spectra of the dollar A1893 before and after background subtraction; (iii) the obtained Raman spectra are checked to determine the percentage of the match as compared to the standard.134 (b) Smartphone decoding system for drug anti-counterfeiting based on inkjet printing of upconversion QR code.15 (c) Covert photonic crystal-based barcodes that become overt under smartphone flashlight for image capturing by the smartphone camera.123 Figure panels reproduced from ref. 134 with permission from Wiley, copyright 2012; ref. 15 with permission from the Royal Society of Chemistry, copyright 2016; ref. 123 from Nature Publishing Group (CC BY). | ||
5.3 Synthesis methods for commercialization
Most of the nano-barcode synthesis methods have been well-established. However, improvement in synthesis speed, volume and reproducibility is required to allow for mass production of the nano-barcode. This can be done through an automation process with the aid of computers. For example, the electrodeposition process of multi-metals can be done by changing the input voltage, which can be automated to create precise and controlled length.139 Chemical methods including swelling, ion-exchange method, and co-precipitation have possibilities of leakage of the encoding elements. For this, an additional step to coat the surface of nano-barcodes, such as a silica shell coating, can be done to prevent the leakage. The non-uniformity in size during synthesis occurs in emulsion-based and epitaxial growth methods, and this can be solved by implementing the additional step of nanoparticle purification such as by size based separation of nanoparticles using microfluidics.288 Furthermore, some preparation strategies are prone to aggregation of the nanoparticles, which will reduce the quality of the nano-barcode for specific applications. This can be prevented by using polymeric groups on the nanoparticles, choosing a compatible solvent to be used in the reaction mixture where the nanoparticles are being used to prepare the barcodes, and tailoring the reaction conditions to provide stability.12,189,197,1995.4 Safety and regulation on the usage of nanobarcode
Many types of nano-barcodes have been reported to be a robust platform for security strategies. This application is used for commercial products that reaches the mass market, therefore, the safety of the nano-barcodes used for the purpose requires attention as some of the nanoparticles such as QDs are found to be toxic. The dependence of nano-barcodes for anti-counterfeiting of edible products including food and drugs requires even more careful consideration as they are ingested by the end users. For example, the organic solid phase change nanoparticles such as stearic acid, palmitic acid, paraffin wax and polyethylene have been demonstrated to be mixed with drug powder such as acetaminophen.160 Although the mixture was found to be not cytotoxic on HeLa cells upon exposure for 10 hours based on cell viability assay, clinical study proving the same was lacking. Similarly, nanoparticles being used as contrast agents can be toxic to organs and tissues with serious health side effects. They can be encapsulated in biocompatible materials to minimize their interaction with bodily fluids. For example, in a recent study, Zhang et al. (2017) prepared nano-barcodes of biodegradable NMOF loaded with BODIPY as contrast agents and were reported to exhibit minimal toxicity in vitro and in vivo. But the apprehension of toxicity from the degradation of NMOF is still persistent as there is little evidence on the safety of these materials. You et al. (2016) reported a three dimensional QR code based on lanthanide-doped upconversion nanocrystals printed on capsules for anti-counterfeiting purposes. They suggested that the concentrations of lanthanide-doped upconversion nanocrystals were very low and do not confer toxicity as the concentration is far below that in the previous in vivo mice study.15 On the other hand, applying these nano-barcodes on the packaging materials covering the product e.g. plastic cover is a safer and easier option, instead of directly putting them on/inside the food or drug product.To fully rely on these in vitro and in vivo findings is not advisable and an extra step of extensive clinical trials must be done before these nano-barcodes can be deemed safe for the market and individuals. Therefore, it is necessary that the involvement of these nano-barcodes for contrast agent imaging and anti-counterfeiting of edible products be monitored by the authorities regulating the safety of food and drug products.
6. Conclusion
Encoded nanoparticles have been in great demand for barcoding based applications due to their nanoscale dimension with multiple choices of materials and shapes. The versatility of nano-barcodes has been demonstrated by their robust applications for multiplexed bioassay and excellence for imaging and security applications as compared to micrometre-sized barcodes and beyond. Therefore, it is pertinent to consider the type of encoding technique, synthesis methods and the decoding mechanism for designing the barcode for the desired applications. Various encoding strategies have been employed on nanostructures/particles to achieve unique and high capacity codes and the nano-barcoding field is still growing with the recent development of several new barcoding strategies including luminescence lifetime, phase angle, and thermal code using phase change nanoparticles. Most of the nano-barcode synthesis methods have been well-established; however, several improvements such as shortening the time-consuming synthesis process, increasing the uniformity of synthesized nano-barcodes and automation to streamline the synthesis process are needed for mass production and commercialization of these nano-barcodes. Multiplexed and multimodal imaging can be developed using these nano-barcodes and need more attention to exploit the benefits of these nano-barcodes. Moreover, underexplored applications such as super-resolution imaging based on nano-barcodes should be exhausted as they offer great potential for enhancement in imaging modalities. The miniaturization of the decoding system is yet another requirement to be met using nano-barcodes to achieve the point of care applications for mass market implementation. Finally, the implementation of nano-barcodes for mass market requires to be regulated by the authorities to ensure the safe usage of these barcodes. With improvement of these challenges, immense potential of nano-barcodes can surely be unleased for a large variety of applications.Conflicts of interest
There are no conflicts to declare.Acknowledgements
We would like to acknowledge the funding support from the Singapore Ministry of Education Academic Research Fund (AcRF Tier 3 grant MOE2016-T3-1-004, R-397-000-274-112; AcRF Tier 1 grant R - 397-000-270-114), the National Medical Research Council (NMRC) (CBRG grant CBRG13nov052, R-397-000-199-511), the Agency for Science, Technology and Research (A*STAR) and Joint Council Office (JCO) grants (1431AFG102, 1332a00089).References
- M. Ebling and R. Cáceres, IEEE Pervasive Comput., 2010, 9, 4–5 Search PubMed.
- O. Gallo and R. Manduchi, IEEE Trans. Pattern Anal. Mach. Intell., 2011, 33, 1834–1843 CrossRef PubMed.
- G. Wang, Y. Leng, H. Dou, L. Wang, W. Li, X. Wang, K. Sun, L. Shen, X. Yuan and J. Li, ACS Nano, 2012, 7, 471–481 CrossRef PubMed.
- F. Zhang, Q. Shi, Y. Zhang, Y. Shi, K. Ding, D. Zhao and G. D. Stucky, Adv. Mater., 2011, 23, 3775–3779 CAS.
- K. Braeckmans, S. C. De Smedt, C. Roelant, M. Leblans, R. Pauwels and J. Demeester, Nat. Mater., 2003, 2, 169–193 CrossRef CAS PubMed.
- J. Du, P. Bernasconi, K. R. Clauser, D. Mani, S. P. Finn, R. Beroukhim, M. Burns, B. Julian, X. P. Peng and H. Hieronymus, Nat. Biotechnol., 2009, 27, 77–83 CrossRef CAS PubMed.
- T. Sun, B. Xu, B. Chen, X. Chen, M. Li, P. Shi and F. Wang, Nanoscale, 2017, 9, 2701–2705 RSC.
- H. Liu, M. K. G. Jayakumar, K. Huang, Z. Wang, X. Zheng, H. Agren and Y. Zhang, Nanoscale, 2017, 9, 1676–1686 RSC.
- A. H. Hung, L. M. Lilley, F. Hu, V. S. Harrison and T. J. Meade, Magn. Reson. Med., 2017, 77, 970–978 CrossRef PubMed.
- H. Zhang, X. Deng, J. Zhang, D. Xue, Y. Huang, F. Bai, B. J. Inkson and Y. Peng, J. Mater. Chem. C, 2015, 3, 5389–5397 RSC.
- L. Chen, X. Li, D. Shen, L. Zhou, D. Zhu, C. Fan and F. Zhang, Anal. Chem., 2015, 87, 5745–5752 CrossRef CAS PubMed.
- P. Zhang, H. Lu, J. Chen, H. Han and W. Ma, Theranostics, 2014, 4, 307 CrossRef PubMed.
- F. Zhang, R. C. Haushalter, R. W. Haushalter, Y. Shi, Y. Zhang, K. Ding, D. Zhao and G. D. Stucky, Small, 2011, 7, 1972–1976 CrossRef CAS PubMed.
- Z. Yaari, D. Da Silva, A. Zinger, E. Goldman, A. Kajal, R. Tshuva, E. Barak, N. Dahan, D. Hershkovitz and M. Goldfeder, Nat. Commun., 2016, 7, 13325 CrossRef CAS PubMed.
- M. You, M. Lin, S. Wang, X. Wang, G. Zhang, Y. Hong, Y. Dong, G. Jin and F. Xu, Nanoscale, 2016, 8, 10096–10104 RSC.
- J. Della Rocca, D. Liu and W. Lin, Acc. Chem. Res., 2011, 44, 957–968 CrossRef CAS PubMed.
- H. Liu, M. K. Jayakumar, K. Huang, Z. Wang, X. Zheng, H. Ågren and Y. Zhang, Nanoscale, 2017, 9, 1676–1686 RSC.
- S. Y. Yeom, C. H. Son, B. S. Kim, S. H. Tag, E. Nam, H. Shin, S. H. Kim, H. Gang, H. J. Lee and J. Choi, Anal. Chem., 2016, 88, 4259–4268 CrossRef CAS PubMed.
- Y. Liu, Y. Lee, Q. Zhang, Y. Cui and X. Ling, J. Mater. Chem. C, 2016, 4, 4312–4319 RSC.
- S. Sun, H. Yao, F. Zhang and J. Zhu, Chem. Sci., 2015, 6, 930–934 RSC.
- J. Kim, J. M. Yun, J. Jung, H. Song, J.-B. Kim and H. Ihee, Nanotechnology, 2014, 25, 155303 CrossRef PubMed.
- C. Paquet, L. Pagé, A. Kell and B. Simard, Langmuir, 2010, 26, 5388–5396 CrossRef CAS PubMed.
- Y. Zhang and N. Huang, J. Biomed. Mater. Res., Part B, 2006, 76, 161–168 CrossRef PubMed.
- X. Wang, Q. Zhang, J. Zhao and J. Dai, J. Mater. Chem. B, 2013, 1, 4637–4643 RSC.
- J. Choi, S. Park, Z. Stojanovic, H.-S. Han, J. Lee, H. K. Seok, D. Uskokovic and K. H. Lee, Langmuir, 2013, 29, 15698–15703 CrossRef CAS PubMed.
- J. M. Romo-Herrera, R. A. Alvarez-Puebla and L. M. Liz-Marzán, Nanoscale, 2011, 3, 1304–1315 RSC.
- Y. Zhang, S. Tekobo, Y. Tu, Q. Zhou, X. Jin, S. A. Dergunov, E. Pinkhassik and B. Yan, ACS Appl. Mater. Interfaces, 2012, 4, 4099–4105 CAS.
- S. Adireddy, C. E. Carbo, Y. Yao, J. M. Vargas, L. Spinu and J. B. Wiley, Chem. Mater., 2013, 25, 3902–3909 CrossRef CAS.
- H.-S. Wang, J. Li, J.-Y. Li, K. Wang, Y. Ding and X.-H. Xia, NPG Asia Mater., 2017, 9, e354 CrossRef CAS.
- R. Wilson, A. R. Cossins and D. G. Spiller, Angew. Chem., Int. Ed., 2006, 45, 6104–6117 CrossRef CAS PubMed.
- K. Braeckmans, S. C. De Smedt, M. Leblans, R. Pauwels and J. Demeester, Nat. Rev. Drug Discovery, 2002, 1, 447–456 CrossRef CAS PubMed.
- T. Eustaquio and J. F. Leary, Int. J. Nanomed., 2012, 7, 5625 CAS.
- J. Yang, S. R. Dave and X. Gao, J. Am. Chem. Soc., 2008, 130, 5286–5292 CrossRef CAS PubMed.
- Q. Liu, W. Feng, T. Yang, T. Yi and F. Li, Nat. Protoc., 2013, 8, 2033–2044 CrossRef CAS PubMed.
- L. Wang and W. Tan, Nano Lett., 2006, 6, 84–88 CrossRef CAS PubMed.
- T. Behnke, C. Würth, K. Hoffmann, M. Hübner, U. Panne and U. Resch-Genger, J. Fluoresc., 2011, 21, 937–944 CrossRef CAS PubMed.
- K. A. Clark, E. L. Krueger and D. A. Vanden Bout, J. Phys. Lett., 2014, 5, 2274–2282 CAS.
- D. Chaudhuri, D. Li, Y. Che, E. Shafran, J. M. Gerton, L. Zang and J. M. Lupton, Nano Lett., 2011, 11, 488–492 CrossRef CAS PubMed.
- K. M. Taylor-Pashow, J. D. Rocca, Z. Xie, S. Tran and W. Lin, J. Am. Chem. Soc., 2009, 131, 14261–14263 CrossRef CAS PubMed.
- L. Wang, C. Yang and W. Tan, Nano Lett., 2005, 5, 37–43 CrossRef CAS PubMed.
- M. Montalti, L. Prodi, N. Zaccheroni, A. Zattoni, P. Reschiglian and G. Falini, Langmuir, 2004, 20, 2989–2991 CrossRef CAS PubMed.
- J. M. Kürner, I. Klimant, C. Krause, E. Pringsheim and O. S. Wolfbeis, Anal. Biochem., 2001, 297, 32–41 CrossRef PubMed.
- Y. Li, Y. T. H. Cu and D. Luo, Nat. Biotechnol., 2005, 23, 885–889 CrossRef CAS PubMed.
- J. Mei, N. L. Leung, R. T. Kwok, J. W. Lam and B. Z. Tang, Chem. Rev., 2015, 115, 11718–11940 CrossRef CAS PubMed.
- L. Mao, M. Liu, D. Xu, Q. Wan, Q. Huang, R. Jiang, Y. Shi, F. Deng, X. Zhang and Y. Wei, Appl. Surf. Sci., 2017, 403, 396–402 CrossRef CAS.
- Y. Li, R. Liu, J. Chang, M. Huang, H. Chang and Y. Miao, Dyes Pigm., 2017, 139, 110–117 CrossRef CAS.
- G. I. Maikov, R. Vaxenburg, A. Sashchiuk and E. Lifshitz, ACS Nano, 2010, 4, 6547–6556 CrossRef CAS PubMed.
- Z. A. Peng and X. Peng, J. Am. Chem. Soc., 2001, 123, 183–184 CrossRef CAS PubMed.
- W. C. Chan and S. Nie, Science, 1998, 281, 2016–2018 CrossRef CAS PubMed.
- Q. Ma and X. Su, Analyst, 2010, 135, 1867–1877 RSC.
- A. M. Derfus, W. C. Chan and S. N. Bhatia, Nano Lett., 2004, 4, 11–18 CrossRef CAS PubMed.
- C. E. Bradburne, J. B. Delehanty, K. Boeneman Gemmill, B. C. Mei, H. Mattoussi, K. Susumu, J. B. Blanco-Canosa, P. E. Dawson and I. L. Medintz, Bioconjugate Chem., 2013, 24, 1570–1583 CrossRef CAS PubMed.
- F.-A. Kauffer, C. Merlin, L. Balan and R. Schneider, J. Hazard. Mater., 2014, 268, 246–255 CrossRef CAS PubMed.
- W. J. Parak, T. Pellegrino and C. Plank, Nanotechnology, 2005, 16, R9 CrossRef CAS PubMed.
- S. T. Selvan, T. T. Tan and J. Y. Ying, Adv. Mater., 2005, 17, 1620–1625 CrossRef CAS.
- Z. Zhelev, H. Ohba and R. Bakalova, J. Am. Chem. Soc., 2006, 128, 6324–6325 CrossRef CAS PubMed.
- N. Chen, Y. He, Y. Su, X. Li, Q. Huang, H. Wang, X. Zhang, R. Tai and C. Fan, Biomaterials, 2012, 33, 1238–1244 CrossRef CAS PubMed.
- S. J. Soenen, B. B. Manshian, T. Aubert, U. Himmelreich, J. Demeester, S. C. De Smedt, Z. Hens and K. Braeckmans, Chem. Res. Toxicol., 2014, 27, 1050–1059 CrossRef CAS PubMed.
- Y.-S. Park, W. K. Bae, J. M. Pietryga and V. I. Klimov, ACS Nano, 2014, 8, 7288–7296 CrossRef CAS PubMed.
- Y.-S. Park, W. K. Bae, L. A. Padilha, J. M. Pietryga and V. I. Klimov, Nano Lett., 2014, 14, 396–402 CrossRef CAS PubMed.
- W. K. Bae, L. A. Padilha, Y.-S. Park, H. McDaniel, I. Robel, J. M. Pietryga and V. I. Klimov, ACS Nano, 2013, 7, 3411–3419 CrossRef CAS PubMed.
- B. Mahler, P. Spinicelli, S. Buil, X. Quelin, J.-P. Hermier and B. Dubertret, Nat. Mater., 2008, 7, 659–664 CrossRef CAS PubMed.
- Y. Chen, J. Vela, H. Htoon, J. L. Casson, D. J. Werder, D. A. Bussian, V. I. Klimov and J. A. Hollingsworth, J. Am. Chem. Soc., 2008, 130, 5026–5027 CrossRef CAS PubMed.
- C. Li, Z. Lu, Q. Zhang, J. Ge, S. Aloni, Z. Shi and Y. Yin, Sci. China Mater., 2015, 58, 481–489 CrossRef CAS.
- Y. Zhang and A. R. Clapp, RSC Adv., 2014, 4, 48399–48410 RSC.
- S.-W. Cao, Y.-P. Yuan, J. Fang, M. M. Shahjamali, F. Y. Boey, J. Barber, S. C. J. Loo and C. Xue, Int. J. Hydrogen Energy, 2013, 38, 1258–1266 CrossRef CAS.
- F. Song, P. S. Tang, H. Durst, D. T. Cramb and W. C. W. Chan, Angew. Chem., Int. Ed., 2012, 51, 8773–8777 CrossRef CAS PubMed , S8773/8771–S8773/8714.
- Q. Ma, Y. Nakane, Y. Mori, M. Hasegawa, Y. Yoshioka, T. M. Watanabe, K. Gonda, N. Ohuchi and T. Jin, Biomaterials, 2012, 33, 8486–8494 CrossRef CAS PubMed.
- Y. Wang, H.-B. Yao, X.-H. Wang and S.-H. Yu, J. Mater. Chem., 2011, 21, 562–566 RSC.
- Q. Ma, I. C. Serrano and E. Palomares, Chem. Commun., 2011, 47, 7071–7073 RSC.
- N. A. Harun, B. R. Horrocks and D. A. Fulton, Nanoscale, 2011, 3, 4733–4741 RSC.
- X. Yang and Y. Zhang, Langmuir, 2004, 20, 6071–6073 CrossRef CAS PubMed.
- B. D. Anderson, W.-C. Wu and J. B. Tracy, Chem. Mater., 2016, 28, 4945–4952 CrossRef CAS.
- M. A. Ali, S. Srivastava, V. V. Agrawal, M. Willander, R. John and B. D. Malhotra, J. Mater. Chem. B, 2016, 4, 2706–2714 RSC.
- F.-X. Xiao, J. Miao and B. Liu, J. Am. Chem. Soc., 2014, 136, 1559–1569 CrossRef CAS PubMed.
- X. Zhu, G. Wu, N. Lu, X. Yuan and B. Li, J. Hazard. Mater., 2017, 324, 272–280 CrossRef CAS PubMed.
- L. Li, L. Gu, Z. Lou, Z. Fan and G. Shen, ACS Nano, 2017, 11, 4067–4076 CrossRef CAS PubMed.
- Y. Tamura, T. Kaizu, T. Kiba, M. Igarashi, R. Tsukamoto, A. Higo, W. Hu, C. Thomas, M. E. Fauzi and T. Hoshii, Nanotechnology, 2013, 24, 285301 CrossRef PubMed.
- G. Jie, J. Zhang, G. Jie and L. Wang, Biosens. Bioelectron., 2014, 52, 69–75 CrossRef CAS PubMed.
- Y. Zhang, L. Zhang, R. Deng, J. Tian, Y. Zong, D. Jin and X. Liu, J. Am. Chem. Soc., 2014, 136, 4893–4896 CrossRef CAS PubMed.
- Y. Lu and B. Yan, J. Mater. Chem. C, 2014, 2, 7411–7416 RSC.
- S. Zhu, Y. Song, X. Zhao, J. Shao, J. Zhang and B. Yang, Nano Res., 2015, 8, 355–381 CrossRef CAS.
- H. Li, X. He, Z. Kang, H. Huang, Y. Liu, J. Liu, S. Lian, C. H. A. Tsang, X. Yang and S. T. Lee, Angew. Chem., Int. Ed., 2010, 49, 4430–4434 CrossRef CAS PubMed.
- K. Chang, Z. Liu, H. Chen, L. Sheng, S. X. A. Zhang, D. T. Chiu, S. Yin, C. Wu and W. Qin, Small, 2014, 10, 4270–4275 CAS.
- Y. Song, S. Zhu and B. Yang, RSC Adv., 2014, 4, 27184–27200 RSC.
- C. Wang, J. Qian, K. Wang, M. Hua, Q. Liu, N. Hao, T. You and X. Huang, ACS Appl. Mater. Interfaces, 2015, 7, 26865–26873 CAS.
- T. Wen, B. Yang, Y. Guo, J. Sun, C. Zhao, S. Zhang, M. Zhang and Y. Wang, Phys. Chem. Chem. Phys., 2014, 16, 23188–23195 RSC.
- B. P. Biswal, D. B. Shinde, V. K. Pillai and R. Banerjee, Nanoscale, 2013, 5, 10556–10561 RSC.
- J. Hao, F. Liu, N. Liu, M. Zeng, Y. Song and L. Wang, Sens. Actuators, B, 2017, 245, 641–647 CrossRef CAS.
- Y. Dong, J. Cai, Q. Fang, X. You and Y. Chi, Anal. Chem., 2016, 88, 1748–1752 CrossRef CAS PubMed.
- L. He, T. Wang, J. An, X. Li, L. Zhang, L. Li, G. Li, X. Wu, Z. Su and C. Wang, CrystEngComm, 2014, 16, 3259–3263 RSC.
- X. Lin, G. Gao, L. Zheng, Y. Chi and G. Chen, Anal. Chem., 2013, 86, 1223–1228 CrossRef PubMed.
- X. Zhang and X. Du, ACS Appl. Mater. Interfaces, 2015, 8, 1033–1040 Search PubMed.
- P. B. Joshi and P. Zhang, J. Mater. Sci., 2015, 50, 3597–3603 CrossRef CAS.
- H. Tan, Y. Zhang, M. Wang, Z. Zhang, X. Zhang, A. M. Yong, S. Y. Wong, A. Y.-C. Chang, Z.-K. Chen and X. Li, Biomaterials, 2012, 33, 237–246 CrossRef CAS PubMed.
- G. Chen, C. Yang and P. N. Prasad, Acc. Chem. Res., 2013, 46, 1474–1486 CrossRef CAS PubMed.
- R.-X. Yan and Y. Li, Adv. Funct. Mater., 2005, 15, 763–770 CrossRef CAS.
- B. Zhou, L. Tao, Y. Chai, S. P. Lau, Q. Zhang and Y. H. Tsang, Angew. Chem., 2016, 128, 12544–12548 CrossRef.
- X. Chen, Y. Zhu, D. Zhou, W. Xu, J. Zhu, G. Pan, Z. Yin, H. Wang, S. Cui and H. Song, J. Mater. Chem. C, 2017, 5, 2451–2458 RSC.
- S. Singh, A. Singh and S. Rai, Nanotechnology, 2011, 22, 275703 CrossRef CAS PubMed.
- H.-S. Qian and Y. Zhang, Langmuir, 2008, 24, 12123–12125 CrossRef CAS PubMed.
- G. Chen, T. Y. Ohulchanskyy, S. Liu, W.-C. Law, F. Wu, M. T. Swihart, H. Ågren and P. N. Prasad, ACS Nano, 2012, 6, 2969–2977 CrossRef CAS PubMed.
- K. Huang, N. M. Idris and Y. Zhang, Small, 2016, 12, 836–852 CrossRef CAS PubMed.
- F. Wang, D. Banerjee, Y. Liu, X. Chen and X. Liu, Analyst, 2010, 135, 1839–1854 RSC.
- E. M. Chan, D. J. Gargas, P. J. Schuck and D. J. Milliron, J. Phys. Chem. B, 2012, 116, 10561–10570 CrossRef CAS PubMed.
- F. Wang, J. Wang and X. Liu, Angew. Chem., 2010, 122, 7618–7622 CrossRef.
- H.-T. Wong, F. Vetrone, R. Naccache, H. L. W. Chan, J. Hao and J. A. Capobianco, J. Mater. Chem., 2011, 21, 16589–16596 RSC.
- J. W. Stouwdam and F. C. Van Veggel, Langmuir, 2004, 20, 11763–11771 CrossRef CAS PubMed.
- J. Wang, R. Deng, M. A. MacDonald, B. Chen, J. Yuan, F. Wang, D. Chi, T. S. A. Hor, P. Zhang and G. Liu, Nat. Mater., 2014, 13, 157–162 CrossRef CAS PubMed.
- F. Vetrone, R. Naccache, V. Mahalingam, C. G. Morgan and J. A. Capobianco, Adv. Funct. Mater., 2009, 19, 2924–2929 CrossRef CAS.
- M. You, J. Zhong, Y. Hong, Z. Duan, M. Lin and F. Xu, Nanoscale, 2015, 7, 4423–4431 RSC.
- A. Baride, J. Meruga, C. Douma, D. Langerman, G. Crawford, J. Kellar, W. Cross and P. May, RSC Adv., 2015, 5, 101338–101346 RSC.
- L. Bao, H. You, L. Wang, L. Li, R. Qiao, Y. Zhang, Y. Zhong, Y. Xiong and Z. Li, J. Mater. Chem. C, 2014, 2, 8949–8955 RSC.
- X. Zhang, Y. Ren, M. Chen and L. Wu, J. Colloid Interface Sci., 2011, 358, 347–353 CrossRef CAS PubMed.
- W. J. Rieter, K. M. Taylor, H. An, W. Lin and W. Lin, J. Am. Chem. Soc., 2006, 128, 9024–9025 CrossRef CAS PubMed.
- U. Resch-Genger, M. Grabolle, S. Cavaliere-Jaricot, R. Nitschke and T. Nann, Nat. Methods, 2008, 5, 763–775 CrossRef CAS PubMed.
- Y. Lu, J. Lu, J. Zhao, J. Cusido, F. M. Raymo, J. Yuan, S. Yang, R. C. Leif, Y. Huo and J. A. Piper, Nat. Commun., 2014, 5, 3741 CAS.
- Y. Lu, J. Zhao, R. Zhang, Y. Liu, D. Liu, E. M. Goldys, X. Yang, P. Xi, A. Sunna and J. Lu, Nat. Photonics, 2014, 8, 32–36 CrossRef CAS.
- U. Kaiser, D. Jimenez de Aberasturi, R. Malinowski, F. Amin, W. Parak and W. Heimbrodt, Appl. Phys. Lett., 2014, 104, 041901 CrossRef.
- A. Z. Abbasi, F. Amin, T. Niebling, S. Friede, M. Ochs, S. Carregal-Romero, J.-M. Montenegro, P. Rivera Gil, W. Heimbrodt and W. J. Parak, ACS Nano, 2011, 5, 21–25 CrossRef CAS PubMed.
- U. Kaiser, N. Sabir, C. Carrillo-Carrion, P. del Pino, M. Bossi, W. Heimbrodt and W. J. Parak, Nanotechnology, 2015, 27, 055101 CrossRef PubMed.
- Y. Lu, P. Xi, J. A. Piper, Y. Huo and D. Jin, Sci. Rep., 2012, 2, 837 CrossRef PubMed.
- H. Nam, K. Song, D. Ha and T. Kim, Sci. Rep., 2016, 6, 30885 CrossRef CAS PubMed.
- H. S. Lee, T. S. Shim, H. Hwang, S.-M. Yang and S.-H. Kim, Chem. Mater., 2013, 25, 2684–2690 CrossRef CAS.
- B. Tang, X. Zhao, Y. Zhao, W. Zhang, Q. Wang, L. Kong and Z. Gu, Langmuir, 2011, 27, 11722–11728 CrossRef CAS PubMed.
- M. J. Banholzer, K. D. Osberg, S. Li, B. F. Mangelson, G. C. Schatz and C. A. Mirkin, ACS Nano, 2010, 4, 5446–5452 CrossRef CAS PubMed.
- C. Liusman, H. Li, G. Lu, J. Wu, F. Boey, S. Li and H. Zhang, J. Phys. Chem. C, 2012, 116, 10390–10395 CAS.
- D. Jimenez de Aberasturi, A. B. Serrano-Montes, J. Langer, M. Henriksen-Lacey, W. J. Parak and L. M. Liz-Marzán, Chem. Mater., 2016, 28, 6779–6790 CrossRef CAS.
- C. Jiang, Y. Wang, J. Wang, W. Song and L. Lu, Biomaterials, 2017, 114, 54–61 CrossRef CAS PubMed.
- M. Y. Sha, S. Penn, G. Freeman and W. E. Doering, Nanobiotechnology, 2007, 3, 23–30 CrossRef CAS.
- M. T. Gebrekidan, C. Knipfer, F. Stelzle, J. Popp, S. Will and A. Braeuer, J. Raman Spectrosc., 2016, 47, 198–209 CrossRef CAS.
- C. L. Zavaleta, B. R. Smith, I. Walton, W. Doering, G. Davis, B. Shojaei, M. J. Natan and S. S. Gambhir, Proc. Natl. Acad. Sci. U. S. A., 2009, 106, 13511–13516 CrossRef CAS PubMed.
- J. V. Jokerst, A. J. Cole, D. Van de Sompel and S. S. Gambhir, ACS Nano, 2012, 6, 10366–10377 CrossRef CAS PubMed.
- K. D. Osberg, M. Rycenga, G. R. Bourret, K. A. Brown and C. A. Mirkin, Adv. Mater., 2012, 24, 6065–6070 CrossRef CAS PubMed.
- S. R. Nicewarner-Peña, A. J. Carado, K. E. Shale and C. D. Keating, J. Phys. Chem. B, 2003, 107, 7360–7367 CrossRef.
- W.-M. Zhang, J.-S. Hu, H.-T. Ding, L.-J. Wan and W.-G. Song, Anal. Chem., 2009, 81, 2815–2818 CrossRef CAS PubMed.
- P. Kumar, K. Nagpal and B. K. Gupta, ACS Appl. Mater. Interfaces, 2017, 9, 14301–14308 Search PubMed.
- S. R. Nicewarner-Pena, R. G. Freeman, B. D. Reiss, L. He, D. J. Peña, I. D. Walton, R. Cromer, C. D. Keating and M. J. Natan, Science, 2001, 294, 137–141 CrossRef CAS PubMed.
- C. D. Keating and M. J. Natan, Adv. Mater., 2003, 15, 451–454 CrossRef CAS.
- L. Chen, X. Li, D. Shen, L. Zhou, D. Zhu, C. Fan and F. Zhang, Anal. Chem., 2015, 87, 5745–5752 CrossRef CAS PubMed.
- U. K. Demirok, J. Burdick and J. Wang, J. Am. Chem. Soc., 2008, 131, 22–23 CrossRef PubMed.
- R. Arppe and T. J. Sørensen, Nat. Rev. Chem., 2017, 1, 0031 CrossRef.
- P. Kumar, J. Dwivedi and B. K. Gupta, J. Mater. Chem. C, 2014, 2, 10468–10475 RSC.
- D. Li, L. Tang, J. Wang, X. Liu and Y. Ying, Adv. Opt. Mater., 2016, 4, 1475–1480 CrossRef CAS.
- J.-M. Nam, C. S. Thaxton and C. A. Mirkin, Science, 2003, 301, 1884–1886 CrossRef CAS PubMed.
- J.-M. Nam, S.-J. Park and C. A. Mirkin, J. Am. Chem. Soc., 2002, 124, 3820–3821 CrossRef CAS PubMed.
- J. Gooch, C. Koh, B. Daniel, V. Abbate and N. Frascione, Talanta, 2015, 144, 1065–1069 CrossRef CAS PubMed.
- C. Laure, D. Karamessini, O. Milenkovic, L. Charles and J. F. Lutz, Angew. Chem., 2016, 128, 10880–10883 CrossRef.
- B. K. Mead, J. Hayward, B. Liang, M. Wan, T. Benson and J. Karp, J. Forensic Sci., 2014, 59, 264–267 CrossRef CAS PubMed.
- D. Paunescu, R. Fuhrer and R. N. Grass, Angew. Chem., Int. Ed., 2013, 52, 4269–4272 CrossRef CAS PubMed.
- M. Puddu, D. Paunescu, W. J. Stark and R. N. Grass, ACS Nano, 2014, 8, 2677–2685 CrossRef CAS PubMed.
- J. Gooch, H. Goh, B. Daniel, V. Abbate and N. Frascione, Anal. Chem., 2016, 88, 4456–4460 CrossRef CAS PubMed.
- K. H. Wong, Y. Jin and Z. Moqtaderi, Curr. Protoc. Mol. Biol., 2013, 101, 7.11.1–7.11.11 Search PubMed.
- B. He, S. J. Son and S. B. Lee, Langmuir, 2006, 22, 8263–8265 CrossRef CAS PubMed.
- A. D. Pris and M. D. Porter, Langmuir, 2004, 20, 6969–6973 CrossRef CAS PubMed.
- S. J. Yoon, B. G. Kim, I. T. Jeon, J. H. Wu and Y. K. Kim, Appl. Phys. Express, 2012, 5, 103003 CrossRef.
- I. T. Jeon, S. J. Yoon, B. G. Kim, J. S. Lee, B. H. An, J.-S. Ju, J. H. Wu and Y. K. Kim, J. Appl. Phys., 2012, 111, 07B513 CrossRef.
- Z. Ma, Y. Hong, M. Zhang and M. Su, Appl. Phys. Lett., 2009, 95, 233101 CrossRef.
- M. Wang, B. Duong and M. Su, Nanomaterials, 2015, 5, 1810–1819 CrossRef CAS PubMed.
- B. Duong, H. Liu, L. Ma and M. Su, Sci. Rep., 2014, 4, 5170 CrossRef CAS PubMed.
- S. Hou, W. Zheng, B. Duong and M. Su, J. Phys. Chem. C, 2016, 120, 22110–22114 CAS.
- L. Tian, K.-K. Liu, M. Fei, S. Tadepalli, S. Cao, J. A. Geldmeier, V. V. Tsukruk and S. Singamaneni, ACS Appl. Mater. Interfaces, 2016, 8, 4031–4041 CAS.
- C. Chen, P. Zhang, G. Gao, D. Gao, Y. Yang, H. Liu, Y. Wang, P. Gong and L. Cai, Adv. Mater., 2014, 26, 6313–6317 CrossRef CAS PubMed.
- X. Su, J. Zhang, L. Sun, T.-W. Koo, S. Chan, N. Sundararajan, M. Yamakawa and A. A. Berlin, Nano Lett., 2005, 5, 49–54 CrossRef CAS PubMed.
- X. Li, T. Wang, J. Zhang, D. Zhu, X. Zhang, Y. Ning, H. Zhang and B. Yang, ACS Nano, 2010, 4, 4350–4360 CrossRef CAS PubMed.
- T. N. Tran, J. Cui, M. R. Hartman, S. Peng, H. Funabashi, F. Duan, D. Yang, J. C. March, J. T. Lis and H. Cui, J. Am. Chem. Soc., 2013, 135, 14008–14011 CrossRef CAS PubMed.
- P.-J. Chen, S.-H. Hu, W.-T. Hung, S.-Y. Chen and D.-M. Liu, J. Mater. Chem., 2012, 22, 9568–9575 RSC.
- F. Song, P. S. Tang, H. Durst, D. T. Cramb and W. C. Chan, Angew. Chem., Int. Ed., 2012, 51, 8773–8777 CrossRef CAS PubMed.
- K. Cihalova, D. Hegerova, A. M. Jimenez, V. Milosavljevic, J. Kudr, S. Skalickova, D. Hynek, P. Kopel, M. Vaculovicova and V. Adam, J. Pharm. Biomed. Anal., 2017, 134, 325–332 CrossRef CAS PubMed.
- Q. Zhang, X. Wang and Y. Zhu, J. Mater. Chem., 2011, 21, 12132–12138 RSC.
- Y. S. Michael, I. D. Walton, S. M. Norton, M. Taylor, M. Yamanaka, M. J. Natan, C. Xu, S. Drmanac, S. Huang and A. Borcherding, Anal. Bioanal. Chem., 2006, 384, 658–666 CrossRef PubMed.
- W.-M. Zhang, J.-S. Hu, H.-T. Ding, L.-J. Wan and W.-G. Song, Anal. Chem., 2009, 81, 2815–2818 CrossRef CAS PubMed.
- J. A. Sioss, R. L. Stoermer, M. Y. Sha and C. D. Keating, Langmuir, 2007, 23, 11334–11341 CrossRef CAS PubMed.
- J. B. H. Tok, F. Chuang, M. C. Kao, K. A. Rose, S. S. Pannu, M. Y. Sha, G. Chakarova, S. G. Penn and G. M. Dougherty, Angew. Chem., Int. Ed., 2006, 45, 6900–6904 CrossRef CAS PubMed.
- T. Behnke, C. Würth, E.-M. Laux, K. Hoffmann and U. Resch-Genger, Dyes Pigm., 2012, 94, 247–257 CrossRef CAS.
- M. Pellach and S. Margel, Photochem. Photobiol., 2014, 90, 952–956 CAS.
- X. Shen and B. Yan, RSC Adv., 2016, 6, 28165–28170 RSC.
- X. Shen and B. Yan, J. Colloid Interface Sci., 2016, 468, 220–226 CrossRef CAS PubMed.
- S. Wang, D. G. Choi and S. M. Yang, Adv. Mater., 2002, 14, 1311–1314 CrossRef CAS.
- Z. Zhang, S. Dai, X. Fan, D. A. Blom, S. J. Pennycook and Y. Wei, J. Phys. Chem. B, 2001, 105, 6755–6758 CrossRef CAS.
- X. Guo, L. Fu, H. Zhang, L. Carlos, C. Peng, J. Guo, J. Yu, R. Deng and L. Sun, New J. Chem., 2005, 29, 1351–1358 RSC.
- X. Sun, K. Ding, Y. Hou, Z. Gao, W. Yang, L. Jing and M. Gao, J. Phys. Chem. C, 2013, 117, 21014–21020 CAS.
- J. Xu, R. Lv, S. Du, S. Gai, F. He, D. Yang and P. Yang, J. Mater. Chem. B, 2016, 4, 4138–4146 RSC.
- N. Joumaa, M. Lansalot, A. Théretz, A. Elaissari, A. Sukhanova, M. Artemyev, I. Nabiev and J. H. Cohen, Langmuir, 2006, 22, 1810–1816 CrossRef CAS PubMed.
- X. Yang and Y. Zhang, Langmuir, 2004, 20, 6071–6073 CrossRef CAS PubMed.
- N. A. Harun, M. J. Benning, B. R. Horrocks and D. A. Fulton, Nanoscale, 2013, 5, 3817–3827 RSC.
- J. Fickert, M. Makowski, M. Kappl, K. Landfester and D. Crespy, Macromolecules, 2012, 45, 6324–6332 CrossRef CAS.
- J. Desbiens, B. Bergeron, M. Patry and A. M. Ritcey, J. Colloid Interface Sci., 2012, 376, 12–19 CrossRef CAS PubMed.
- Y. Li, M. Dong, J. Kong, Z. Chai and G. Fu, J. Colloid Interface Sci., 2013, 394, 199–207 CrossRef CAS PubMed.
- U. Haldar, S. G. Roy and P. De, Polymer, 2016, 97, 113–121 CrossRef CAS.
- A. C. C. Esteves, P. Hodge, T. Trindade and A. M. Barros-Timmons, J. Polym. Sci., Part A: Polym. Chem., 2009, 47, 5367–5377 CrossRef CAS.
- S. Chakraborty, K. Jähnichen, H. Komber, A. A. Basfar and B. Voit, Macromolecules, 2014, 47, 4186–4198 CrossRef CAS.
- A. V. Fuchs and G. D. Will, Polymer, 2010, 51, 2119–2124 CrossRef CAS.
- H. Zhang, Eur. Polym. J., 2013, 49, 579–600 CrossRef CAS.
- J. Ramos and J. Forcada, Langmuir, 2011, 27, 7222–7230 CrossRef CAS PubMed.
- A. Edwards, M. Yamazaki, S. Krishnadasan, T. Phillips, L. Rowlands, R. Jourdain, A. Nightingale and J. de Mello, J. Mater. Chem. C, 2015, 3, 6565–6572 RSC.
- X. Song, L. Huang and B. Wu, Anal. Chem., 2008, 80, 5501–5507 CrossRef CAS PubMed.
- J. M. Kürner, I. Klimant, C. Krause, H. Preu, W. Kunz and O. S. Wolfbeis, Bioconjugate Chem., 2001, 12, 883–889 CrossRef.
- Y. Yang, S. Matsubara, L. Xiong, T. Hayakawa and M. Nogami, J. Phys. Chem. C, 2007, 111, 9095–9104 CAS.
- P. Yang, M. Ando and N. Murase, J. Colloid Interface Sci., 2011, 354, 455–460 CrossRef CAS PubMed.
- P. Yi, H. Huang, Y. Peng, D. Liu and C. Zhong, RSC Adv., 2016, 6, 111934–111941 RSC.
- T.-W. Duan and B. Yan, J. Mater. Chem. C, 2015, 3, 2823–2830 RSC.
- F. Enrichi, R. Riccò, A. Meneghello, R. Pierobon, E. Cretaio, F. Marinello, P. Schiavuta, A. Parma, P. Riello and A. Benedetti, Opt. Mater., 2010, 32, 1652–1658 CrossRef CAS.
- H. Li and F. Qu, Chem. Mater., 2007, 19, 4148–4154 CrossRef CAS.
- B. He, S. K. Kim, S. J. Son and S. B. Lee, Nanomedicine, 2010, 5, 77–88 CrossRef CAS PubMed.
- C. C. Chen, Y. C. Liu, C. H. Wu, C. C. Yeh, M. T. Su and Y. C. Wu, Adv. Mater., 2005, 17, 404–407 CrossRef CAS.
- Q. Wang, Y. Liu, C. Lin and H. Yan, Nanotechnology, 2007, 18, 405604 CrossRef.
- S. Banerjee and A. Datta, Langmuir, 2009, 26, 1172–1176 CrossRef PubMed.
- C. Chiappini, X. Liu, J. R. Fakhoury and M. Ferrari, Adv. Funct. Mater., 2010, 20, 2231–2239 CrossRef CAS PubMed.
- N. Brahiti, S.-A. Bouanik and T. Hadjersi, Appl. Surf. Sci., 2012, 258, 5628–5637 CrossRef CAS.
- H. Chen, T. Wang, H. Shen, W. Liu, S. Wang, K. Liu, J. Zhang and B. Yang, Nano Res., 2015, 8, 2871–2880 CrossRef CAS.
- L. Qin, S. Park, L. Huang and C. A. Mirkin, Science, 2005, 309, 113–115 CrossRef CAS PubMed.
- J. Wang and G. Liu, Anal. Chem., 2006, 78, 2461–2464 CrossRef CAS PubMed.
- R. L. Stoermer, K. B. Cederquist, S. K. McFarland, M. Y. Sha, S. G. Penn and C. D. Keating, J. Am. Chem. Soc., 2006, 128, 16892–16903 CrossRef CAS PubMed.
- N.-M. Li, K.-M. Li, S. Wang, K.-Q. Yang, L.-J. Zhang, Q. Chen and W.-M. Zhang, ACS Appl. Mater. Interfaces, 2015, 7, 10534–10540 CAS.
- M. J. Banholzer, L. Qin, J. E. Millstone, K. D. Osberg and C. A. Mirkin, Nat. Protoc., 2009, 4, 838–848 CrossRef CAS PubMed.
- A. L. Schmucker, M. B. Dickerson, M. Rycenga, B. F. Mangelson, K. A. Brown, R. R. Naik and C. A. Mirkin, Small, 2014, 10, 1485–1489 CrossRef CAS PubMed.
- K. D. Osberg, M. Rycenga, N. Harris, A. L. Schmucker, M. R. Langille, G. C. Schatz and C. A. Mirkin, Nano Lett., 2012, 12, 3828–3832 CrossRef CAS PubMed.
- D.-P. Oana-Georgiana, D.-D. Herea and H. Chiriac, in Noble Metals, ed. D. Y.-H. Su, InTech, Croatia, 2012, p. 426 Search PubMed.
- J. Wang, J. Mater. Chem., 2008, 18, 4017–4020 RSC.
- M. Farsari and B. N. Chichkov, Nat. Photonics, 2009, 3, 450 CrossRef CAS.
- X. Li, D. Shen, J. Yang, C. Yao, R. Che, F. Zhang and D. Zhao, Chem. Mater., 2012, 25, 106–112 CrossRef.
- K.-W. Chang and J.-J. Wu, Adv. Mater., 2005, 17, 241–245 CrossRef CAS.
- J. J. Schmied, M. Raab, C. Forthmann, E. Pibiri, B. Wünsch, T. Dammeyer and P. Tinnefeld, Nat. Protoc., 2014, 9, 1367–1391 CrossRef CAS PubMed.
- Y. Li, Y. T. H. Cu and D. Luo, Nat. Biotechnol., 2005, 23, 885–889 CrossRef CAS PubMed.
- C. Lin, R. Jungmann, A. M. Leifer, C. Li, D. Levner, G. M. Church, W. M. Shih and P. Yin, Nat. Chem., 2012, 4, 832–839 CrossRef CAS PubMed.
- V. L. Sedman, S. Allen, X. Chen, C. J. Roberts and S. J. Tendler, Langmuir, 2009, 25, 7256–7259 CrossRef CAS PubMed.
- A. Mishra, R. K. Behera, P. K. Behera, B. K. Mishra and G. B. Behera, Chem. Rev., 2000, 100, 1973–2012 CrossRef CAS PubMed.
- F. Würthner, T. E. Kaiser and C. R. Saha-Möller, Angew. Chem., Int. Ed., 2011, 50, 3376–3410 CrossRef PubMed.
- D. Chaudhuri, D. Li, Y. Che, E. Shafran, J. M. Gerton, L. Zang and J. M. Lupton, Nano Lett., 2010, 11, 488–492 CrossRef PubMed.
- M. Mille, J.-F. Lamère, F. Rodrigues and S. Fery-Forgues, Langmuir, 2008, 24, 2671–2679 CrossRef CAS PubMed.
- H. Turki, S. Abid, N. Saffon and S. Fery-Forgues, Dyes Pigm., 2012, 94, 81–87 CrossRef CAS.
- A. Yoshida and N. Kometani, J. Phys. Chem. C, 2010, 114, 2867–2872 CAS.
- K. Xiao, K. Wang, W. Qin, Y. Hou, W. Lu, H. Xu, Y. Wo and D. Cui, Talanta, 2017, 164, 463–469 CrossRef CAS PubMed.
- A. Gómez-Hens, J. Fernández-Romero and M. Aguilar-Caballos, TrAC, Trends Anal. Chem., 2008, 27, 394–406 CrossRef.
- A. A. Ellington, I. J. Kullo, K. R. Bailey and G. G. Klee, Clin. Chem., 2010, 56, 186–193 CAS.
- J. M. Levsky, S. M. Shenoy, R. C. Pezo and R. H. Singer, Science, 2002, 297, 836–840 CrossRef CAS PubMed.
- Y. Liu and P. Wu, ACS Appl. Mater. Interfaces, 2013, 5, 5832–5844 CAS.
- L. Ma, Y. Hong, Z. Ma, C. Kaittanis, J. M. Perez and M. Su, Appl. Phys. Lett., 2009, 95, 043701 CrossRef.
- X. Liu, F. Wang, R. Aizen, O. Yehezkeli and I. Willner, J. Am. Chem. Soc., 2013, 135, 11832–11839 CrossRef CAS PubMed.
- W.-J. Zhou, Y. Chen and R. M. Corn, Anal. Chem., 2011, 83, 3897–3902 CrossRef CAS PubMed.
- H. Dong, J. Zhang, H. Ju, H. Lu, S. Wang, S. Jin, K. Hao, H. Du and X. Zhang, Anal. Chem., 2012, 84, 4587–4593 CrossRef CAS PubMed.
- Y.-Q. Liu, M. Zhang, B.-C. Yin and B.-C. Ye, Anal. Chem., 2012, 84, 5165–5169 CrossRef CAS PubMed.
- H. N. Wang and T. Vo-Dinh, Small, 2011, 7, 3067–3074 CrossRef CAS PubMed.
- E. Arefian, J. Kiani, M. Soleimani, S. A. M. Shariati, S. H. Aghaee-Bakhtiari, A. Atashi, Y. Gheisari, N. Ahmadbeigi, A. M. Banaei-Moghaddam and M. Naderi, Nucleic Acids Res., 2011, 39, e80–e80 CrossRef CAS PubMed.
- S. J. Son and S. B. Lee, Nanomedicine, 2007, 2, 79–82 CrossRef CAS PubMed.
- L. Ma, C. Wang, Y. Hong, M. Zhang and M. Su, Anal. Chem., 2010, 82, 1186–1190 CrossRef CAS PubMed.
- B. He, S. J. Son and S. B. Lee, Anal. Chem., 2007, 79, 5257–5263 CrossRef CAS PubMed.
- M. Chan, J. Lux, T. Nishimura, K. Akiyoshi and A. Almutairi, Biomacromolecules, 2015, 16, 2964–2971 CrossRef CAS PubMed.
- A. Malugin and H. Ghandehari, J. Appl. Toxicol., 2010, 30, 212–217 Search PubMed.
- T. Chen, Y. Hu, Y. Cen, X. Chu and Y. Lu, J. Am. Chem. Soc., 2013, 135, 11595–11602 CrossRef CAS PubMed.
- X. Jin, H. Li, S. Wang, N. Kong, H. Xu, Q. Fu, H. Gu and J. Ye, Nanoscale, 2014, 6, 14360–14370 RSC.
- S. Lee, H. Chon, J. Lee, J. Ko, B. H. Chung, D. W. Lim and J. Choo, Biosens. Bioelectron., 2014, 51, 238–243 CrossRef CAS PubMed.
- H. Liu, C. T. Xu, G. Dumlupinar, O. B. Jensen, P. E. Andersen and S. Andersson-Engels, Nanoscale, 2013, 5, 10034–10040 RSC.
- H. H. Gorris and O. S. Wolfbeis, Angew. Chem., Int. Ed., 2013, 52, 3584–3600 CrossRef CAS PubMed.
- T. Eustaquio and J. F. Leary, Cytometry, Part A, 2016, 89, 207–216 CrossRef CAS PubMed.
- J. L. Vivero-Escoto, K. M. Taylor-Pashow, R. C. Huxford, J. Della Rocca, C. Okoruwa, H. An, W. Lin and W. Lin, Small, 2011, 7, 3519 CrossRef CAS PubMed.
- T. Courant, V. G. Roullin, C. Cadiou, M. Callewaert, M. C. Andry, C. Portefaix, C. Hoeffel, M. C. de Goltstein, M. Port and S. Laurent, Angew. Chem., Int. Ed., 2012, 51, 9119–9122 CrossRef CAS PubMed.
- A. Soleimani, F. Martínez, V. Economopoulos, P. J. Foster, T. J. Scholl and E. R. Gillies, J. Mater. Chem. B, 2013, 1, 1027–1034 RSC.
- T. Zhang, L. Wang, C. Ma, W. Wang, J. Ding, S. Liu, X. Zhang and Z. Xie, J. Mater. Chem. B, 2017, 5, 2330–2336 RSC.
- S. M. Cromer Berman, P. Walczak and J. W. Bulte, Wiley Interdiscip. Rev.: Nanomed. Nanobiotechnol., 2011, 3, 343–355 CrossRef PubMed.
- M. Reuss, F. Fördős, H. Blom, O. Öktem, B. Högberg and H. Brismar, New J. Phys., 2017, 19, 025013 CrossRef.
- C. Steinhauer, R. Jungmann, T. L. Sobey, F. C. Simmel and P. Tinnefeld, Angew. Chem., Int. Ed., 2009, 48, 8870–8873 CrossRef CAS PubMed.
- M. Bates, G. T. Dempsey, K. H. Chen and X. Zhuang, ChemPhysChem, 2012, 13, 99–107 CrossRef CAS PubMed.
- M. Bates, B. Huang, G. T. Dempsey and X. Zhuang, Science, 2007, 317, 1749–1753 CrossRef CAS PubMed.
- J. Oracz, K. Adolfsson, V. Westphal, C. Radzewicz, M. T. Borgström, S. J. Sahl, C. N. Prinz and S. W. Hell, Nano Lett., 2017, 17, 2652–2659 CrossRef CAS PubMed.
- T. Niehörster, A. Löschberger, I. Gregor, B. Krämer, H.-J. Rahn, M. Patting, F. Koberling, J. Enderlein and M. Sauer, Nat. Methods, 2016, 13, 257 CrossRef PubMed.
- J. Gooch, B. Daniel, V. Abbate and N. Frascione, TrAC, Trends Anal. Chem., 2016, 83, 49–54 CrossRef CAS.
- B. K. Gupta, D. Haranath, S. Saini, V. Singh and V. Shanker, Nanotechnology, 2010, 21, 055607 CrossRef PubMed.
- M. Saraf, P. Kumar, G. Kedawat, J. Dwivedi, S. A. Vithayathil, N. Jaiswal, B. A. Kaipparettu and B. K. Gupta, Inorg. Chem., 2015, 54, 2616–2625 CrossRef CAS PubMed.
- J. Andres, R. D. Hersch, J. E. Moser and A. S. Chauvin, Adv. Funct. Mater., 2014, 24, 5029–5036 CrossRef CAS.
- L. L. da Luz, R. Milani, J. F. Felix, I. R. Ribeiro, M. R. Talhavini, B. A. Neto, J. Chojnacki, M. O. Rodrigues and S. A. Júnior, ACS Appl. Mater. Interfaces, 2015, 7, 27115–27123 CAS.
- Z. Lu, Y. Liu, W. Hu, X. W. D. Lou and C. M. Li, Chem. Commun., 2011, 47, 9609–9611 RSC.
- D.-H. Park, C. J. Han, Y.-G. Shul and J.-H. Choy, Sci. Rep., 2014, 4, 4879 CrossRef CAS PubMed.
- T. Blumenthal, J. Meruga, P. S. May, J. Kellar, W. Cross, K. Ankireddy, S. Vunnam and Q. N. Luu, Nanotechnology, 2012, 23, 185305 CrossRef PubMed.
- Y. Cui, R. S. Hegde, I. Y. Phang, H. K. Lee and X. Y. Ling, Nanoscale, 2014, 6, 282–288 RSC.
- Y. Cui, I. Y. Phang, Y. H. Lee, M. R. Lee, Q. Zhang and X. Y. Ling, Chem. Commun., 2015, 51, 5363–5366 RSC.
- J. Zhang, Y. Yuan, G. Liang, M. N. Arshad, H. A. Albar, T. R. Sobahi and S.-H. Yu, Chem. Commun., 2015, 51, 10539–10542 RSC.
- C. Campos-Cuerva, M. Zieba, V. Sebastian, G. Martínez, J. Sese, S. Irusta, V. Contamina, M. Arruebo and J. Santamaria, Nanotechnology, 2016, 27, 095702 CrossRef PubMed.
- G. Tian, Z. Gu, L. Zhou, W. Yin, X. Liu, L. Yan, S. Jin, W. Ren, G. Xing and S. Li, Adv. Mater., 2012, 24, 1226–1231 CrossRef CAS PubMed.
- D. Chen, L. Lei, R. Zhang, A. Yang, J. Xu and Y. Wang, Chem. Commun., 2012, 48, 10630–10632 RSC.
- E. M. Chan, G. Han, J. D. Goldberg, D. J. Gargas, A. D. Ostrowski, P. J. Schuck, B. E. Cohen and D. J. Milliron, Nano Lett., 2012, 12, 3839–3845 CrossRef CAS PubMed.
- J. Wang, F. Wang, C. Wang, Z. Liu and X. Liu, Angew. Chem., Int. Ed., 2011, 50, 10369–10372 CrossRef CAS PubMed.
- V. Muhr, C. Würth, M. Kraft, M. Buchner, A. J. Baeumner, U. Resch-Genger and T. Hirsch, Anal. Chem., 2017, 89, 4868–4874 CrossRef CAS PubMed.
- C. Wang, X. Li and F. Zhang, Analyst, 2016, 141, 3601–3620 RSC.
- K. J. Si, D. Sikdar, L. W. Yap, J. K. K. Foo, P. Guo, Q. Shi, M. Premaratne and W. Cheng, Adv. Opt. Mater., 2015, 3, 1710–1717 CrossRef CAS.
- L. Blanco-Covián, V. Montes-García, A. Girard, M. T. Fernández-Abedul, J. Pérez-Juste, I. Pastoriza-Santos, K. Faulds, D. Graham and M. C. Blanco-López, Nanoscale, 2017, 9, 2051–2058 RSC.
- T. Salafi, K. K. Zeming and Y. Zhang, Lab Chip, 2017, 17, 11–33 RSC.
| This journal is © The Royal Society of Chemistry 2017 |