
 Open Access Article
 This Open Access Article is licensed under a
 Creative Commons Attribution 3.0 Unported Licence
Highly effective ammonia removal in a series of Brønsted acidic porous polymers: investigation of chemical and structural variations†
Gokhan
Barin
a,
Gregory W.
Peterson
b,
Valentina
Crocellà
c,
Jun
Xu
 d,
Kristen A.
Colwell
d,
Aditya
Nandy
d,
Jeffrey A.
Reimer
de,
Silvia
Bordiga
c and
Jeffrey R.
Long
*ade
d,
Kristen A.
Colwell
d,
Aditya
Nandy
d,
Jeffrey A.
Reimer
de,
Silvia
Bordiga
c and
Jeffrey R.
Long
*ade
aDepartment of Chemistry, University of California, Berkeley, California 94720, USA. E-mail: jrlong@berkeley.edu
bEdgewood Chemical Biological Center, U.S. Army Research, Development, and Engineering Command, 5183 Blackhawk Road, Aberdeen Proving Ground, Maryland 21010, USA
cDepartment of Chemistry, NIS and INSTM Centre of Reference, University of Turin, Via Quarello 15, I-10135 Torino, Italy
dDepartment of Chemical and Biomolecular Engineering, University of California, Berkeley, California 94720, USA
eMaterials Sciences Division, Lawrence Berkeley National Laboratory, Berkeley, California 94720, USA
First published on 27th April 2017
Abstract
Although a widely used and important industrial gas, ammonia (NH3) is also highly toxic and presents a substantial health and environmental hazard. The development of new materials for the effective capture and removal of ammonia is thus of significant interest. The capture of ammonia at ppm-level concentrations relies on strong interactions between the adsorbent and the gas, as demonstrated in a number of zeolites and metal–organic frameworks with Lewis acidic open metal sites. However, these adsorbents typically exhibit diminished capacity for ammonia in the presence of moisture due to competitive adsorption of water and/or reduced structural stability. In an effort to overcome these challenges, we are investigating the performance of porous polymers functionalized with Brønsted acidic groups, which should possess inherent structural stability and enhanced reactivity towards ammonia in the presence of moisture. Herein, we report the syntheses of six different Brønsted acidic porous polymers exhibiting –NH3Cl, –CO2H, –SO3H, and –PO3H2 groups and featuring two different network structures with respect to interpenetration. We further report the low- and high-pressure NH3 uptake in these materials, as determined under dry and humid conditions using gas adsorption and breakthrough measurements. Under dry conditions, it is possible to achieve NH3 capacities as high as 2 mmol g−1 at 0.05 mbar (50 ppm) equilibrium pressure, while breakthrough saturation capacities of greater than 7 mmol g−1 are attainable under humid conditions. Chemical and structural variations deduced from these measurements also revealed an important interplay between acidic group spatial arrangement and NH3 uptake, in particular that interpenetration can promote strong adsorption even for weaker Brønsted acidic functionalities. In situ infrared spectroscopy provided further insights into the mechanism of NH3 adsorption, revealing a proton transfer between ammonia and acidic sites as well as strong hydrogen bonding interactions in the case of the weaker carboxylic acid-functionalized polymer. These findings highlight that an increase of acidity or porosity does not necessarily correspond directly to increased NH3 capacity and advocate for the development of more fine-tuned design principles for efficient NH3 capture under a range of concentrations and conditions.
Introduction
Solid-state adsorbents such as metal–organic frameworks1 and porous polymers2 are intriguing classes of materials that have shown significant advancement over the past two decades. Given the flexibility in their design and synthesis, the physical and chemical properties of these materials can be fine-tuned3 for a specific application and in particular they have been extensively investigated for applications in gas storage and chemical separations.4 In the context of gas capture or separations, it is important to have preferential binding sites with a large enthalpy of adsorption to achieve selective and efficient separation of ppm-level contaminants from the rest of the mixture.5One example where this is of particular importance is in the removal of ammonia (NH3) from air.6 Ammonia is one of the most highly produced chemicals, and is widely utilized in many essential segments of industry.7 On the other hand, ammonia is also highly toxic and poses significant health and environmental concerns.8,9 For example, CAL-OSHA has limited short-term ammonia exposure to levels as low as 35 ppm while an eight-hour time-weighted average exposure has been limited to 25 ppm.10 Effective protection mechanisms against excess ammonia exposure are therefore highly desired in many industrial settings, as well as for military applications. Another potentially interesting application is the removal of residual ammonia in NH3-based fuel cells after the gas decomposes to hydrogen.11 Indeed, even a small amount of ammonia slip could poison the catalyst and acidic membrane in a fuel cell, and adsorbents that can capture ammonia efficiently at low concentrations could play an important role in the advancement of this technology. In addition to the selective removal of ammonia, porous materials have the potential to exhibit high-capacity storage of ammonia under ambient or high pressures, which would provide a safer alternative to compressed liquid ammonia (10 bar, 25 °C) for transportation and recycling applications.
Ammonia can behave as both a Lewis base and a Brønsted base, and therefore porous materials decorated with Lewis or Brønsted acidic sites are promising targets for capture at particularly low concentrations.12 Certain metal–organic frameworks exhibit exposed metal cations, which serve as Lewis acid sites that strongly adsorb ammonia, and these frameworks have been shown to take up high quantities of ammonia at low concentrations under dry conditions.6c,13 However, the capacities of these materials are generally significantly diminished in the presence of moisture, a scenario that reflects actual practical operating conditions for ammonia scrubbers.6c,13 Such behavior can be attributed to the competition between water and ammonia molecules for Lewis acid sites, as well as to the instability of some of the investigated frameworks under humid conditions. To overcome these problems, a water-stable framework, UiO-66, functionalized with a series of Brønsted acidic groups (–OH, –NH2, –CO2H, –SO3H) was recently investigated for NH3 capture.6g Although considerable improvement in NH3 capacity was achieved using these materials, there was also a significant reduction in porosity upon functionalization with bulkier groups –CO2H and –SO3H, which hindered the accessibility and complete utilization of the acid sites. More recently, incorporation into a polymer membrane has been demonstrated to impart enhanced stability to the framework HKUST-1 under humid conditions, without diminishing NH3 capacity.14
Porous polymers have been investigated to a lesser degree in the context of low-pressure NH3 capture.15 In contrast to metal–organic frameworks, porous polymers inherently exhibit16 a high chemical and thermal stability, due to their covalent backbone and accordingly should not suffer from degradation in the presence of ammonia and/or moisture. Furthermore, a diverse toolbox of synthetic organic chemistry allows not only the preparation of polymers with desired porosity (surface area and pore size) but also the incorporation of Brønsted acidic groups in a facile manner. Recently, we demonstrated that a three-dimensional porous polymer functionalized with carboxylic acid groups exhibits a high ammonia uptake of 3.15 mmol g−1 at an equilibrium concentration of ∼500 ppm.17 The spatial arrangement of multiple carboxylic acids in this material—most likely a result of its multiply-interpenetrated structure—leads to the cooperative reactivity, which in turn creates strong adsorption sites for ammonia at low pressures. Additionally, a sulfonic acid-functionalized porous polymer, prepared from a non-interpenetrated, high-surface area porous aromatic framework (PAF-1), exhibited a lower ammonia capacity of 1.54 mmol g−1 at ∼900 ppm, in spite of its stronger Brønsted acidity. This behavior was attributed to the presence of isolated and non-interacting acidic groups due to the non-interpenetrated structure of the material. Such a striking difference between these two polymers prompted us to further investigate the interplay between Brønsted acidity and polymer structure in a systematic manner.
Herein, we report the synthesis and characterization of six distinct Brønsted acidic porous polymers incorporating –NH3Cl, –CO2H, –SO3H, and –PO3H2 groups (Fig. 1a) and describe their low- and high-pressure NH3 uptake behavior under dry and humid conditions using static gas adsorption and dynamic breakthrough measurements. Through successful incorporation of various acidic groups into non-interpenetrated18 (P1) and interpenetrated19 (P2) frameworks (Fig. 1b), we were able to investigate the impact of acidic group strength and their spatial arrangement on the overall NH3 uptake in a three-dimensionally confined environment. For the best performing materials, we also present the results of in situ infrared spectroscopic characterization of the interactions between ammonia and Brønsted acid sites.
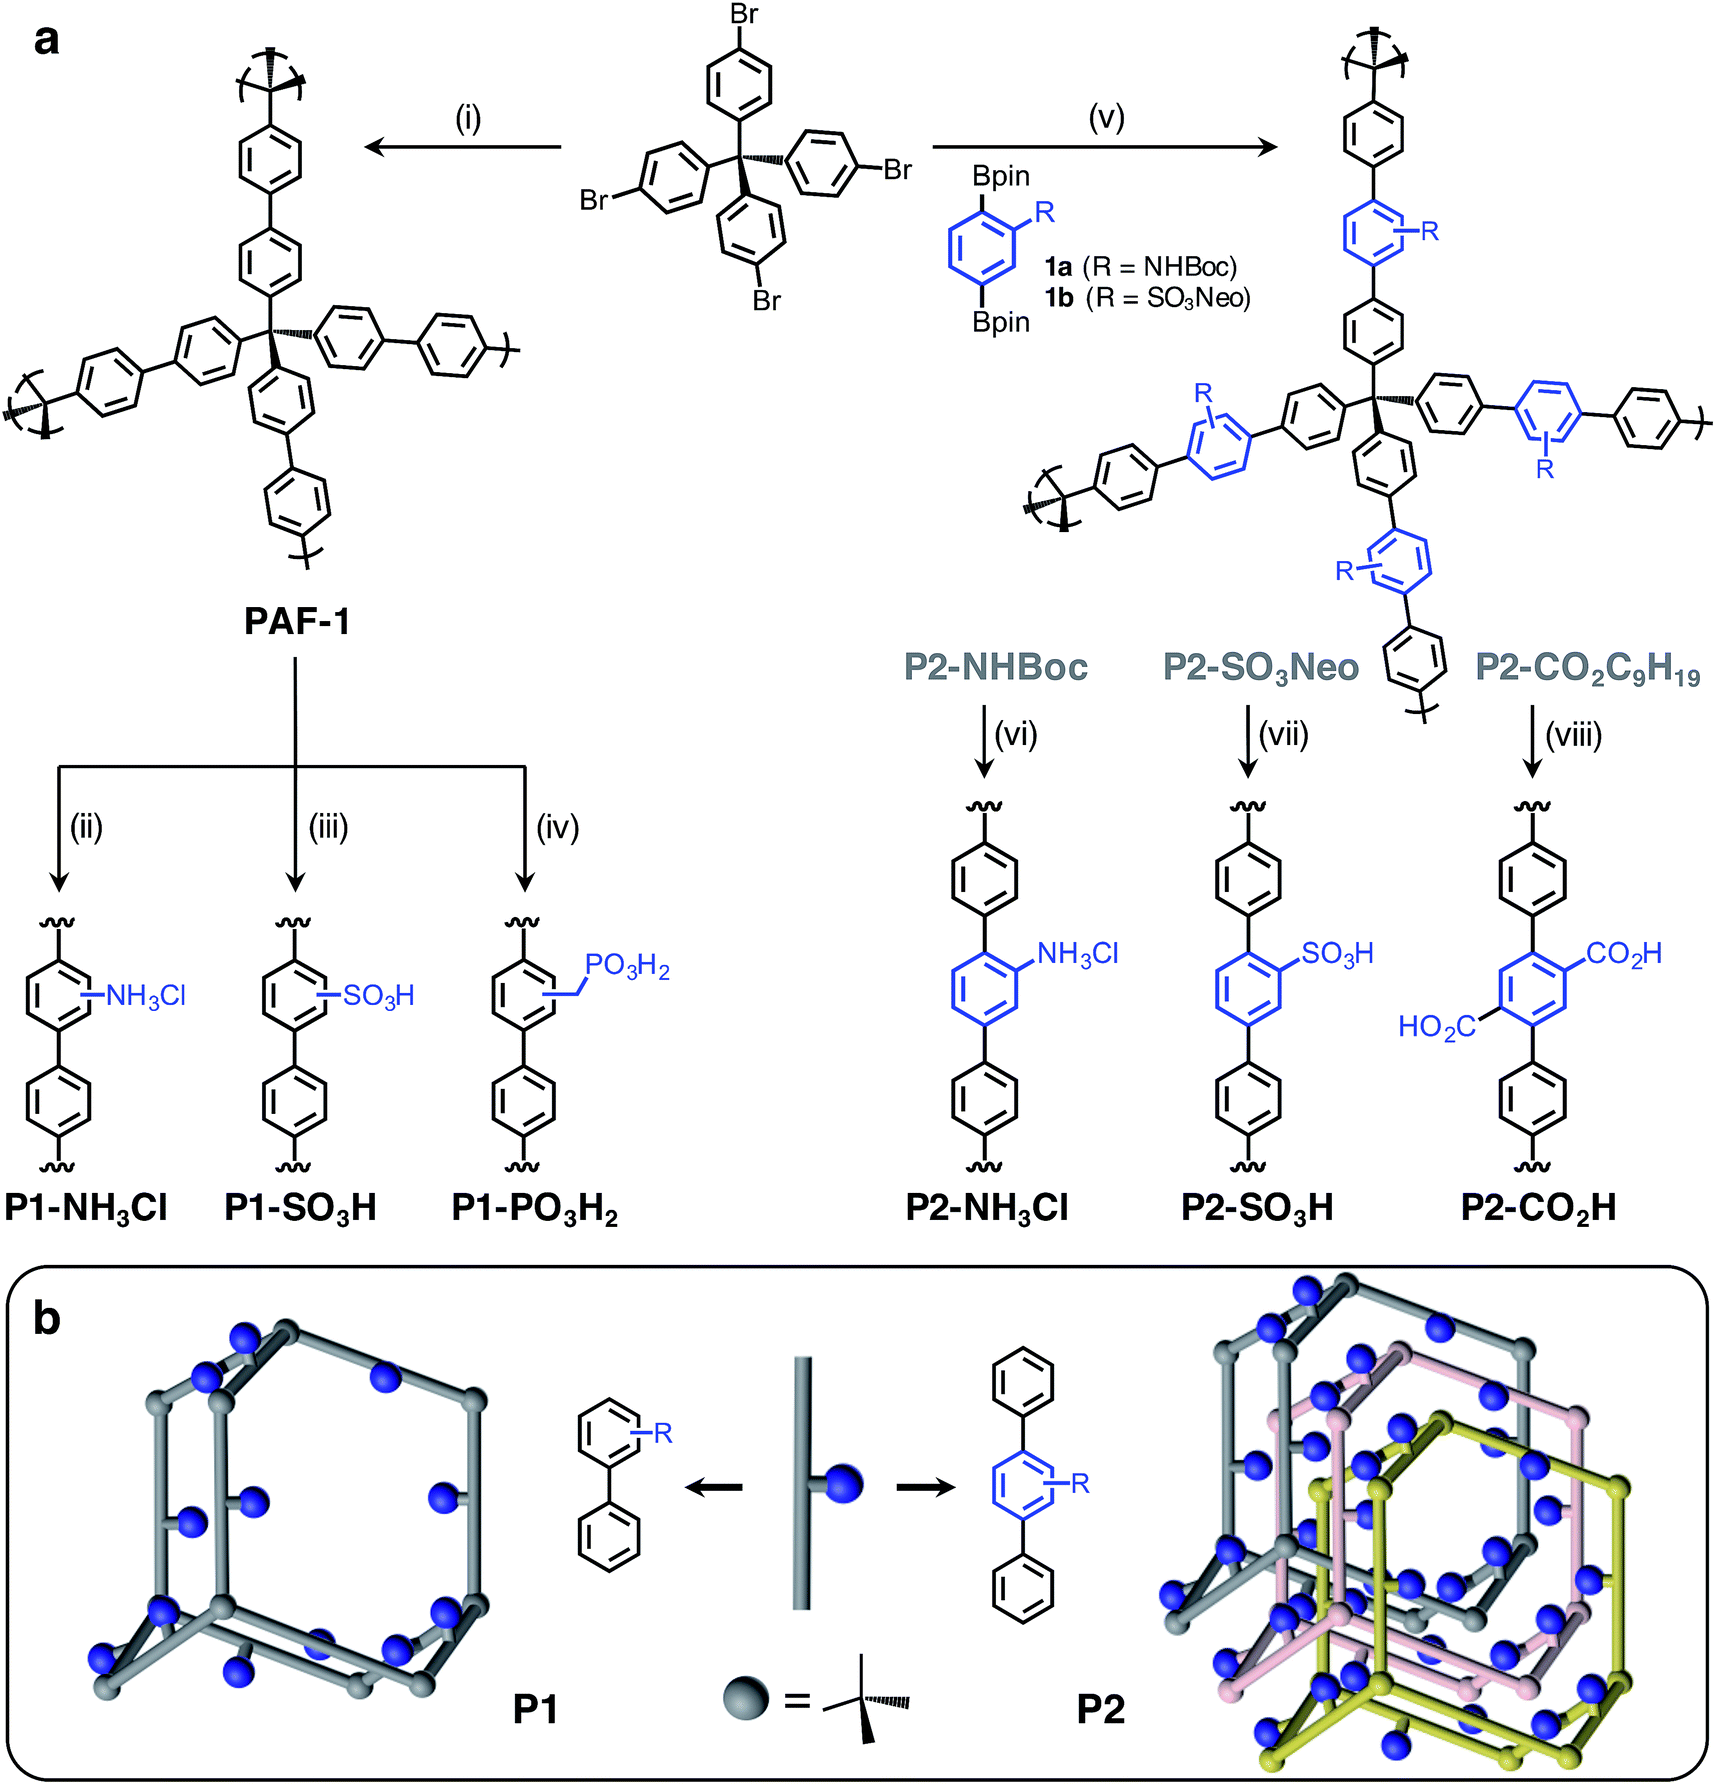 | ||
| Fig. 1 (a) General scheme for the syntheses of P1 and P2 polymers incorporating various Brønsted acid groups. P1 polymers were synthesized using a postsynthetic modification strategy starting from PAF-1, while the P2 polymers were prepared through Suzuki coupling polymerization. Conditions: (i) Ni(cod)2, 2,2′-bipyridine, DMF. (ii) Cu(NO3)2, Ac2O, then NaS2O4; HCl, 1,4-dioxane. (iii) ClSO3H, CH2Cl2. (iv) HCHO, HCl, H3PO4, AcOH; P(OEt)3; Me3SiBr, CH2Cl2, then MeOH. (v) SPhos Pd G2, K2CO3, H2O, THF. (vi) HCl, 1,4-dioxane. (vii) NaN3, DMSO, then HCl. (viii) KOH, DMSO. (b) Illustration of non-interpenetrated (P1) and interpenetrated (P2) polymer structures to demonstrate the proximity of Brønsted acidic sites in each structure type. | ||
Results and discussion
Synthesis
The Brønsted acidic porous polymers reported in this work were synthesized following either a postsynthetic functionalization strategy starting from PAF-1 or a de novo approach—i.e., first installing Brønsted acidic moieties on one of the monomers and then carrying out a Suzuki coupling polymerization. Preparations for the polymers P1-NH3Cl (also known as BPP-2) and P2-CO2H (also known as BPP-7) were recently reported,17 while the synthesis of P1-SO3H (also known as PPN-6-SO3H) was achieved following a literature procedure.20Porous polymers P2-NH3Cl and P2-SO3H were synthesized (Fig. 1a) through the Suzuki coupling route. Precursors 1a and 1b were produced starting from 2-amino-1,4-dibromobenzene and 1,4-dibromobenzene, respectively (see ESI†). The tert-butyloxycarbonyl (Boc) protection21 of the amino group in 2-amino-1,4-dibromobenzene using di-tert-butyl dicarbonate was followed by Miyaura borylation to afford 1a. The sulfonation of 1,4-dibromobenzene using chlorosulfonic acid (ClSO3H) provided 2,5-dibromobenzenesulfonyl chloride.22 A neopentyl group was chosen as the protecting group in this instance, due to the stability of the resulting sulfonic ester under basic Suzuki–Miyaura coupling conditions, as well as to its ease of removal after polymerization.23 Esterification of 2,5-dibromobenzenesulfonyl chloride with neopentyl alcohol and subsequent Miyaura borylation delivered 1b. Suzuki polymerization of 1a and 1b with the tetrahedral precursor tetrakis(4-bromophenyl)methane using Buchwald's precatalyst (SPhos Pd G2) yielded polymers P2-NHBoc and P2-SO3Neo, respectively. The utilization of a 4 M HCl solution in 1,4-dioxane enabled the removal of the Boc group and protonation of the amino group simultaneously to yield the final polymer, P2-NH3Cl. In the case of P2-SO3Neo, hydrolysis of the neopentyl group was carried out using NaN3 in DMSO and subsequent acidification with 6 M HCl resulted in the polymer P2-SO3H.
Similar to previously reported syntheses of P1-NH3Cl and P1-SO3H, the polymer P1-PO3H2 was prepared through postsynthetic modification (Fig. 1a). The parent PAF-1 was synthesized following the original procedure,24 while the chloromethylation of PAF-1 to afford the intermediate PAF-1-CH2Cl was achieved as reported previously.5b The conversion of PAF-1-CH2Cl into the ethyl phosphonate polymer P1-PO3Et2 was accomplished through a Michaelis–Arbuzov reaction in the presence of neat triethyl phosphite, P(OEt)3, at elevated temperatures. The mild hydrolysis of the phosphonate ester groups into phosphonic acid moieties was readily accomplished using Me3SiBr, affording the polymer P1-PO3H2 in a quantitative manner.
Polymer characterization
The formation of porous polymers incorporating protected Brønsted acidic groups and their subsequent hydrolysis was confirmed by Fourier transform infrared (FTIR) spectroscopy (Fig. S7–S9†) and solid-state 1H and 13C NMR spectroscopy (Fig. S10–S19†). The FTIR spectra of P1-NH3Cl, P1-SO3H, and P2-CO2H were found to be in accordance with previously reported data.17,20 The formation of P1-PO3Et2 was confirmed by the appearance of characteristic P![[double bond, length as m-dash]](https://www.rsc.org/images/entities/char_e001.gif) O and P–O–C stretching bands at 1240 and 960–1050 cm−1, respectively. The efficiency of this conversion was also reflected in the elemental analysis data (Table S1†). The initial chlorine content of 16.2% in PAF-1-CH2Cl was reduced to 0.6% in the subsequent phosphonate ester polymer. Moreover, hydrolysis of P1-PO3Et2 to P1-PO3H2 resulted in a shift in the PO stretching band to 1140 cm−1 and the appearance of P–O–H bands in the range of 930–1000 cm−1. Complete hydrolysis of ester groups was also evidenced by the absence of P–O–C stretching bands. Similarly, complete removal of the Boc groups in P2-NH3Cl was unambiguously demonstrated by the disappearance of a CO stretching band at 1713 cm−1 as well as the emergence of a broad N–H band centered around 3345 cm−1. In the case of P2-SO3H, absorption bands at 960 cm−1 (S–O–C stretching) and at 1178 and 1350 cm−1 (SO stretching) were replaced by bands at 996 and 1020 cm−1 (S–OH) and 1150 cm−1 (SO), respectively. Finally, the disappearance of C–H stretching bands in the 2900–3000 cm−1 region also indicated the removal of neopentyl groups.
O and P–O–C stretching bands at 1240 and 960–1050 cm−1, respectively. The efficiency of this conversion was also reflected in the elemental analysis data (Table S1†). The initial chlorine content of 16.2% in PAF-1-CH2Cl was reduced to 0.6% in the subsequent phosphonate ester polymer. Moreover, hydrolysis of P1-PO3Et2 to P1-PO3H2 resulted in a shift in the PO stretching band to 1140 cm−1 and the appearance of P–O–H bands in the range of 930–1000 cm−1. Complete hydrolysis of ester groups was also evidenced by the absence of P–O–C stretching bands. Similarly, complete removal of the Boc groups in P2-NH3Cl was unambiguously demonstrated by the disappearance of a CO stretching band at 1713 cm−1 as well as the emergence of a broad N–H band centered around 3345 cm−1. In the case of P2-SO3H, absorption bands at 960 cm−1 (S–O–C stretching) and at 1178 and 1350 cm−1 (SO stretching) were replaced by bands at 996 and 1020 cm−1 (S–OH) and 1150 cm−1 (SO), respectively. Finally, the disappearance of C–H stretching bands in the 2900–3000 cm−1 region also indicated the removal of neopentyl groups.
The extent of removal for each protecting group and the structural integrity of P1-PO3H2, P2-NH3Cl, P2-SO3H, and P2-CO2H were further examined by magic angle spinning (MAS) 1H NMR spectroscopy and cross-polarization magic angle spinning (CP/MAS) 13C NMR spectroscopy. Acidic protons appear as sharp, narrow peaks, especially in the cases of P1-PO3H2, P2-SO3H, and P2-CO2H in the solid-state MAS 1H NMR spectra, reflecting the high mobility of acidic protons in these materials (Fig. S12, S16 and S18†). The disappearance of the protons associated with protecting groups further suggested high conversion efficiencies and purities of the final Brønsted acidic porous polymers. The CP/MAS 13C NMR spectra also confirmed the hydrolysis of protecting groups by revealing an absence of chemical shifts in the range of 10–40 ppm, for aliphatic carbon atoms on alkyl groups as well as in the 60–80 ppm, region for aliphatic carbon atoms attached to oxygen. Broad chemical shifts in the 110–170 ppm region are ascribed to the presence of aromatic subunits in both protected and final acidic polymers, which also confirm the structural integrity and stability of these polymers under harsh hydrolysis conditions. Scanning electron microscopy images further revealed that the P1 polymers consistently display a sphere-like morphology, while all P2 polymer particles exhibit sheet-like features (Fig. S20 and S21†).
Elemental analyses verified polymer conversion efficiency, with good agreement between experimental and calculated compositions (Tables S1 and S2†), and also enabled quantification of the Brønsted acidic site density within each polymer (Table 1). Accordingly, data for P1-NH3Cl and P2-NH3Cl revealed a nitrogen content that corresponds to –NH3Cl group concentrations of 6.0 and 3.4 mmol g−1, respectively. The analysis of sulfur content demonstrated a sulfonic acid loading of 3.7 mmol g−1 for P1-SO3H and 2.8 mmol g−1 for P2-SO3H. Phosphorus analysis of P1-PO3H2 indicated a phosphonic acid concentration of 3.2 mmol g−1, which in fact corresponds to 6.4 mmol g−1 of available Brønsted acidic sites. Oxygen analysis of P2-CO2C9H19 enabled determination of a carboxylic acid loading of 6.5 mmol g−1 in P2-CO2H. In the case of the P1 polymers, the number of –NH3Cl groups per biphenyl linker (repeating unit) was found to be 1.4 in P1-NH3Cl, while the number of –SO3H and –PO3H2 groups was lower in P1-SO3H (0.8) and P1-PO3H2 (0.7), respectively.
| S BET (m2 g−1) | S micro (m2 g−1) | S ext (m2 g−1) | V micro (cm3 g−1) | V total (cm3 g−1) | Acid group densityd (mmolacid g−1) | |
|---|---|---|---|---|---|---|
| a Brunauer–Emmett–Teller (BET) areas were calculated over the pressure range (P/P0) 0.01–0.06. b Micropore/external surface areas and micropore volumes were calculated using the t-plot method. c Total pore volumes were obtained at P/P0 = 0.95. d Density of acidic sites were determined from elemental analysis using the N, S, P, or O content of the corresponding polymer. e The value corresponds to twice the number of phosphonic acids to account for its diacidic nature. | ||||||
| P1-NH3Cl | 975 | 833 | 142 | 0.33 | 0.53 | 6.0 |
| P1-SO3H | 1220 | 1035 | 185 | 0.41 | 0.64 | 3.7 |
| P1-PO3H2 | 835 | 674 | 161 | 0.27 | 0.49 | 6.4e |
| P2-NH3Cl | 980 | 835 | 145 | 0.33 | 0.45 | 3.4 |
| P2-SO3H | 400 | 303 | 97 | 0.12 | 0.20 | 2.8 |
| P2-CO2H | 715 | 637 | 78 | 0.25 | 0.30 | 6.5 |
Surface area and pore size distribution
Surface area and porosity analyses were carried out using nitrogen gas adsorption isotherms collected at 77 K. Pore size distributions were calculated from the adsorption branch of isotherms employing a quenched solid-state DFT (QSDFT) model, which takes surface heterogeneity into account and assumes the presence of a mixture of slit, cylindrical, and spherical pores. All polymers display type I reversible isotherms, as typically observed for microporous materials (Fig. S24–S29†) and the overall results from these measurements are summarized in Table 1. The BET surface areas of P1-NH3Cl, P1-SO3H, and P1-PO3H2 were found to be 975, 1220, and 835 m2 g−1, respectively. Since the parent material PAF-1 is considered to be a non-interpenetrated framework owing to its high surface area and expected pore size of ∼11 Å,18b postsynthetic functionalization to afford the P1 polymers is expected to preserve this architecture, thus rendering Brønsted acidic sites relatively well-isolated. In spite of the expanded repeating unit length for the P2 polymers (terphenyl instead of biphenyl), the BET surface areas are lower overall than those of the P1 polymers (Table 1). The narrower pore sizes for the P2 polymers, in the range 6–10 Å, also suggests a significant degree of interpenetration and that the Brønsted acidic groups are most likely in close proximity to one another. The relatively high BET surface area for P2-NH3Cl (980 m2 g−1) in this series might be attributed to the presence of the sterically encumbering Boc groups used in the synthesis of the P2-NHBoc precursor, which could reduce the degree of interpenetration.25It should be noted that the total pore volumes for P1 polymers (>0.5 cm3 g−1) are consistently higher than those for P2 polymers (<0.5 cm3 g−1), reflecting the influence of interpenetration in the latter frameworks. The microporosity of each sample was also further confirmed by t-plot curves (Table 1). All polymers exhibit pore size distributions mainly in the micropore range, while a closer inspection and comparison of pore size distributions for P1 and P2 polymers carrying similar Brønsted acidic groups further reveals some structural differences (Fig. S30–S32†). For instance, although the pore size distributions for P1-NH3Cl and P2-NH3Cl appear similar, the total volume contribution from pores smaller than 15 Å is slightly larger in P2-NH3Cl. This difference becomes more obvious for the polymers comprising –SO3H moieties; indeed, while the pore width maxima centered around 6 and 9 Å for P1-SO3H are associated with nearly equal pore volume contributions, the major pore volume contribution in P2-SO3H arises from the pores centered around ∼6.5 Å. In the case of P1-PO3H2 and P2-CO2H, both materials exhibit a pore-width maximum at ∼6 Å as well as a pore size distribution in the range 7–10 Å, although the overall contribution of 6 Å pores is larger for the interpenetrated polymer P2-CO2H, while the 7–10 Å pores contribute more to the pore volume for P1-PO3H2. Even though these two polymers possess different Brønsted acidic groups, their pore size distributions are in excellent agreement with the anticipated structural features based upon interpenetration.
NH3 adsorption
After thermally degassing the polymers under vacuum, NH3 uptake was investigated at pressures of up to 1 bar at 298 K under dry conditions (Fig. 2). As mentioned earlier, the NH3 isotherms for P1-NH3Cl, P1-SO3H, and P2-CO2H were recently reported.17 For the sake of a clear discussion and comparison in this section, these isotherms have also been included with those newly collected for P1-PO3H2, P2-NH3Cl, and P2-SO3H.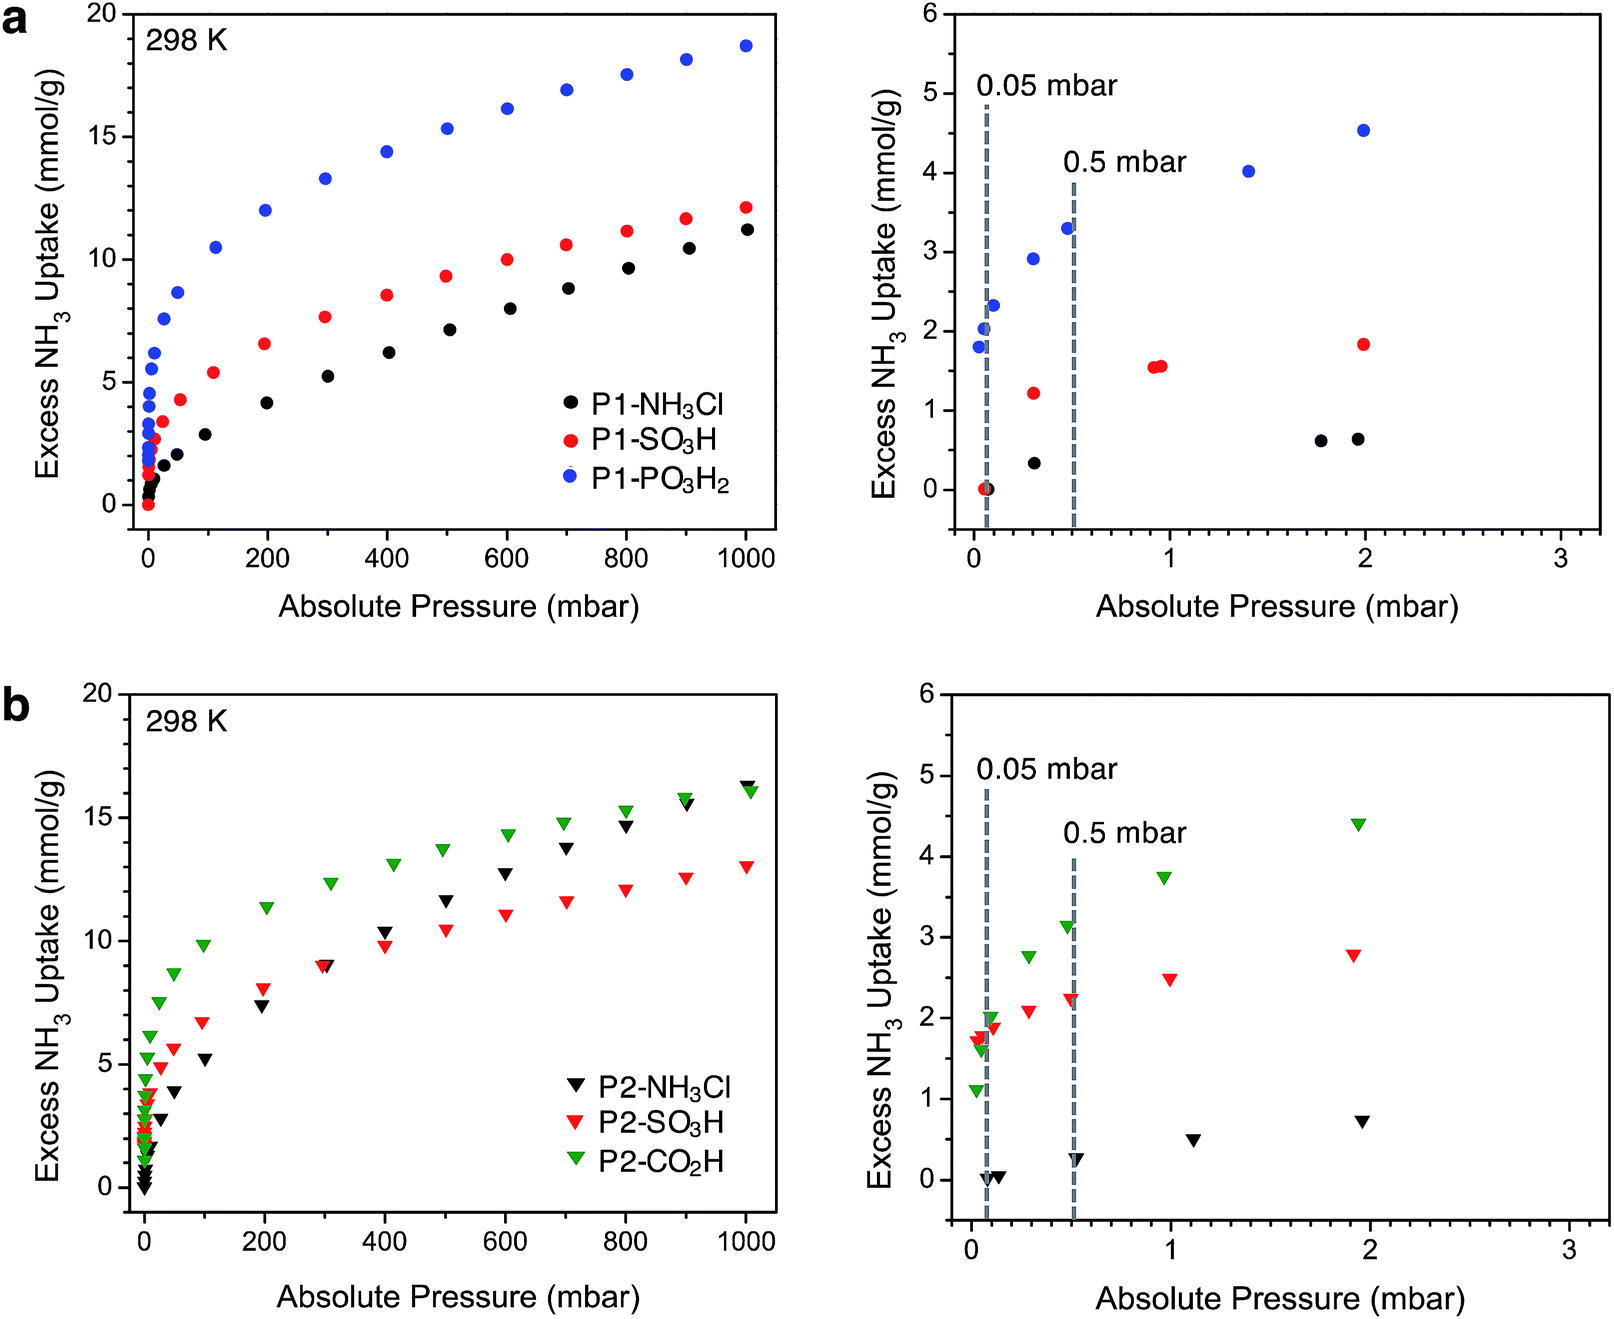 | ||
| Fig. 2 Left panels: NH3 adsorption isotherms for (a) P1 (circles) and (b) P2 (triangles) polymers measured at 298 K. Right panels: Low-pressure region for these plots, up to 3 mbar. Dotted gray lines are guides to compare the uptake values at 0.05 mbar (50 ppm) and 0.5 mbar (500 ppm). | ||
Among the P1 polymers, P1-SO3H and P1-PO3H2 exhibit a significant improvement over P1-NH3Cl at low pressures, consistent with the stronger Brønsted acidity of the sulfonic and phosphonic acid groups. For example, at 0.5 mbar (500 ppm), P1-NH3Cl displays an excess uptake of 0.37 mmol g−1 compared to 1.35 and 3.3 mmol g−1, for P1-SO3H and P1-PO3H2, respectively (Fig. 2a). Notably, P1-PO3H2 shows an uptake of 18.7 mmol g−1 at 1 bar, which represents a substantial improvement over the uptakes of 11.2 mmol g−1 for P1-NH3Cl and 12.1 mmol g−1 for P1-SO3H at the same pressure. It should be noted that even though phosphonic acid is less acidic than sulfonic acid, P1-PO3H2 exhibits a steeper uptake in the low-pressure region of the isotherm and higher uptake at low and high pressures under dry conditions. The diacidic nature of this functional group, which increases the total number of acidic sites, and the smaller surface area and pore volume of the associated polymer most likely contribute to the enhanced adsorption under dry conditions. As expected within the series of interpenetrated P2 polymers, P2-SO3H and P2-CO2H outperform P2-NH3Cl in terms of low-pressure NH3 uptake (Fig. 2b). The NH3 capacity at 0.5 mbar is 2.25 mmol g−1 for P2-SO3H and 3.15 mmol g−1 for P2-CO2H, compared to 0.27 mmol g−1 for P2-NH3Cl. Moreover, despite the weaker acidity of the carboxylic acid groups compared to sulfonic acids, the higher carboxylic acid density (6.5 compared with 2.8 mmol g−1 sulfonic acid groups) enables greater NH3 uptake at low pressures in P2-CO2H—a comparison that also suggests the formation of strong binding sites with multiple weak acidic groups. At 1 bar, P2-NH3Cl and P2-CO2H display similar NH3 uptakes of 16.3 and 16.1 mmol g−1, respectively, whereas P2-SO3H has a lower uptake of 13.1 mmol g−1.
Perhaps more interestingly and relevant to permissible exposure limits, we now compare the uptake properties of these materials at a significantly lower NH3 concentration of 50 ppm (0.05 mbar, see right panels in Fig. 2a and b). At this pressure, P1-SO3H and P2-SO3H exhibit a capacity of 0.01 and 1.79 mmol g−1, respectively. Given the lower –SO3H loading in P2-SO3H (Table 1), it is clear that the spatial distribution and proximity of neighboring acidic groups within the pores is also an important factor that can substantially influence the ammonia affinity of the material. On the other hand, at 50 ppm P1-PO3H2 and P2-CO2H display similarly high NH3 uptakes of 2.03 and 1.62 mmol g−1, respectively. The improvement in the case of P2-CO2H clearly demonstrates that the cooperative action of multiple weaker acidic sites can outperform strong acidic sites that are more isolated. As for P1-PO3H2, the enhanced NH3 uptake relative to P1-SO3H is likely a result of: (i) a higher density of acidic sites, (ii) the bulkiness and flexibility of the –CH2PO3H2 groups compared to –SO3H groups, and/or (iii) a smaller surface area and pore volume. All of these factors render the acidic sites more proximal in P1-PO3H2 than in P1-SO3H.
Another plausible explanation for the increased NH3 uptake in the cases of P1-PO3H2, P2-SO3H, and P2-CO2H can be drawn from some recent computational work.12d In this study of the interaction of ammonia with isolated Brønsted acidic groups, it was established that protonation of ammonia depends on the dielectric constant of the medium. Given the presence of more isolated sulfonic acid groups in P1-SO3H, it is possible that a low local polarity contributes to decreased ammonia affinity at these sites for concentrations as low as 50 ppm. Network interpenetration in the case of P2-SO3H and P2-CO2H and the reduced pore volume in P1-PO3H2 could, however, create a local dielectric polarization around each acidic site in the pores and therefore lead to stronger interactions with ammonia and enhanced capacities. Most notably, the performance of these latter materials at 50 ppm of dry ammonia is comparable to that of 5A zeolite (1.86 mmol g−1 at 58 ppm) and 13X zeolite (1.74 mmol g−1 at 41 ppm) and is significantly higher than sulfonated polymeric resin Amberlyst 15 (0.38 mmol g−1 at 71 ppm).26
The polymer acidity within the P1 and P2 series, as well as between those with the same functional group (e.g., P1-SO3H and P2-SO3H), was compared after plotting gravimetric NH3 isotherms with respect to the number of acidic functionalities (mmolNH3 mmolacid−1) determined by elemental analysis. The absolute pressure corresponding to the capture of one equivalent of ammonia per acid site was found to correlate well with the acid strength of functional groups within P1 and P2 (Fig. S33 and S34†). It should be noted that this pressure does not necessarily correspond to complete saturation of acidic sites, since NH3 adsorption is typically complex6d and capture mechanisms through strong hydrogen bonding and/or van der Waals interactions in small pores cannot be ruled out. Nevertheless, such a comparison is still useful for comparison of the overall binding affinity of the polymers towards ammonia. The abovementioned 1![[thin space (1/6-em)]](https://www.rsc.org/images/entities/char_2009.gif) :1 interaction is apparent at 12 mbar for P1-PO3H2, 35 mbar for P1-SO3H, and 380 mbar for P1-NH3Cl (Fig. S33†), and the lower pressure observed for P1-PO3H2 compared to P1-SO3H can be attributed to reasons discussed above. The 1:1 interaction occurs at 2 mbar for P2-SO3H, 12 mbar for P2-CO2H, and 40 mbar for P2-NH3Cl (Fig. S34†), correlating well with the Brønsted acidity of individual sites in these materials. Remarkably, comparison of these pressures between polymers with the same Brønsted acidic functionality reveals the importance of structural features on the overall acidity. For instance, P2-NH3Cl exhibits a saturation pressure of 40 mbar compared to a much larger 380 mbar for P1-NH3Cl, thus demonstrating that acidic site proximity due to interpenetration can enhance site acidity. Likewise, a similar effect is apparent for P2-SO3H and P1-SO3H, in which the corresponding pressures are 2 and 35 mbar, respectively.
:1 interaction is apparent at 12 mbar for P1-PO3H2, 35 mbar for P1-SO3H, and 380 mbar for P1-NH3Cl (Fig. S33†), and the lower pressure observed for P1-PO3H2 compared to P1-SO3H can be attributed to reasons discussed above. The 1:1 interaction occurs at 2 mbar for P2-SO3H, 12 mbar for P2-CO2H, and 40 mbar for P2-NH3Cl (Fig. S34†), correlating well with the Brønsted acidity of individual sites in these materials. Remarkably, comparison of these pressures between polymers with the same Brønsted acidic functionality reveals the importance of structural features on the overall acidity. For instance, P2-NH3Cl exhibits a saturation pressure of 40 mbar compared to a much larger 380 mbar for P1-NH3Cl, thus demonstrating that acidic site proximity due to interpenetration can enhance site acidity. Likewise, a similar effect is apparent for P2-SO3H and P1-SO3H, in which the corresponding pressures are 2 and 35 mbar, respectively.
Breakthrough measurements
In order to gain further understanding of the NH3 adsorption in these Brønsted acidic porous polymers and to investigate their removal efficiency under practical conditions, we carried out dynamic microbreakthrough measurements6c,13,27 under dry and humid conditions at 293 K. The breakthrough curves for the P1 and P2 materials are shown in Fig. 3 and the corresponding capacities upon saturation are summarized in Table 2. The breakthrough curves are plotted on a weighted mass basis to correct for the density of the materials and the partial pressure of ammonia in the feed stream (C0, 2000 mg m−3) was approximately 2.8 mbar.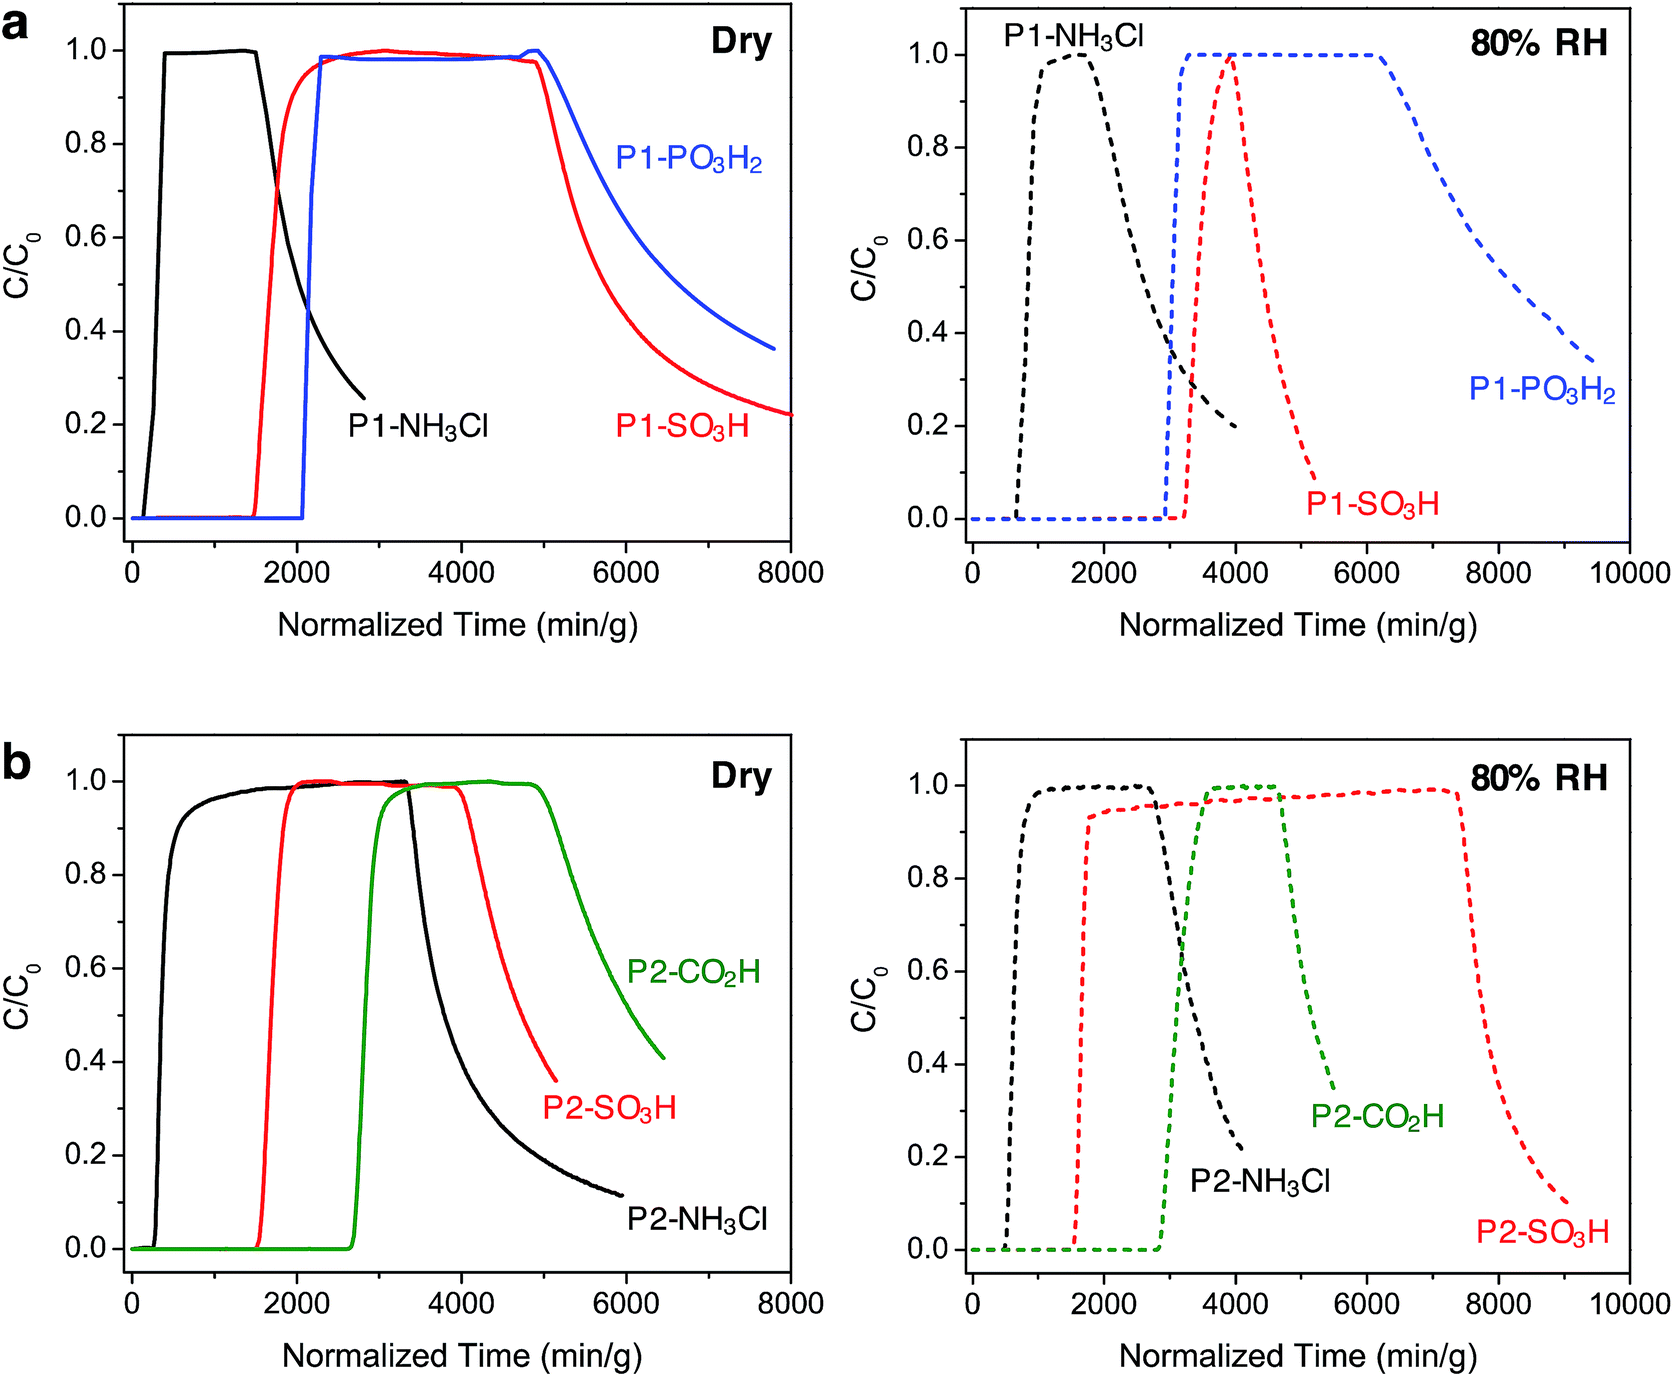 | ||
| Fig. 3 Ammonia breakthrough curves for (a) P1 and (b) P2 polymers under dry (left, solid lines) and humid (right, dashed lines) conditions at 293 K. The challenge concentration (C0) of ammonia in air was 2000 mg m−3 with a flow rate of 20 mL min−1. Once saturation was achieved, desorption curves were obtained upon purging the column with air under the corresponding initial dry or humid condition. | ||
| Saturation NH3 loadings (mmol g−1) | ||
|---|---|---|
| Dry (0% RH) | Humid (80% RH) | |
| P1-NH3Cl | 0.7 | 2.0 |
| P1-SO3H | 3.9 | 8.1 |
| P1-PO3H2 | 5.2 | 7.2 |
| P2-NH3Cl | 1.0 | 1.5 |
| P2-SO3H | 4.0 | 4.3 |
| P2-CO2H | 6.7 | 7.4 |
Under dry conditions, the trends in breakthrough saturation capacity and uptake are in excellent agreement with those obtained from gas adsorption measurements (Fig. 3a and b, solid lines). For all polymers, the breakthrough curves exhibit a steep slope that suggests that the ammonia capture process is not diffusion controlled. As expected, the breakthrough of ammonia in P1-NH3Cl and P2-NH3Cl, with the weakest Brønsted acidic functionality, occurs much earlier than for the other polymers carrying sulfonic, phosphonic, or carboxylic acid groups within the same series. Also in agreement with the NH3 adsorption isotherms, P1-PO3H2 and P2-CO2H display highest uptake capacities of 5.2 and 6.7 mmol g−1, respectively, under dry breakthrough conditions.
We also sought to establish whether the NH3 uptake in these materials is reversible, and accordingly monitored the shape of desorption curves obtained upon purging with dry air after ammonia saturation. In the case of the P1 polymers, broad desorption curves suggest a gradual elution of ammonia, while a significant amount of adsorbed ammonia is released from P1-SO3H and P1-PO3H2. In contrast, P2-SO3H and P2-CO2H retain higher amounts of the gas, as evidenced by their steeper desorption curves. This greater ammonia retention of the interpenetrated P2 polymers can be explained by the presence of a more confined environment around the acidic groups and enhanced interactions with ammonia as a result of the framework interpenetration.
Notably, in the presence of 80% relative humidity (RH), the NH3 saturation capacities improve for all polymers when compared with capacities under dry conditions (Fig. 3a and b, dashed lines). The overall capacity increase in the P1 polymers is greater than for the P2 polymers in the presence of water. For example, P1-NH3Cl and P1-SO3H display saturation capacities of 2.0 and 8.1 mmol g−1, respectively, corresponding to more than twice their dry capacities, and P1-PO3H2 exhibits a humid capacity of 7.2 mmol g−1, nearly 1.5 times the uptake under dry conditions. The saturation capacities increase only marginally for P2-NH3Cl, P2-SO3H, and P2-CO2H. Such differences in uptake improvement between the two polymer families can be ascribed to the larger pore volumes of the P1 polymers, which in turn can potentially accommodate more water molecules. Indeed, P1-SO3H has the largest total pore volume and exhibits the most significant improvement in NH3 uptake. Water adsorption experiments further confirmed a high water uptake of ∼40 mmol g−1 for P1-SO3H at 80% RH (Fig. S41†). Provided a material is stable under humid conditions, it has previously been found that the presence of water can enhance NH3 capacity.13,15b,c,28 In these cases, dissolution of ammonia in water has been identified as an ammonia retention mechanism.29 Furthermore, since the polymers presented here are decorated with polar Brønsted acidic groups, it is possible that: (i) the presence of water facilitates proton transfer between acid sites and ammonia molecules and (ii) dissolution of ammonia is enhanced due to the formation of hydrogen bonding interactions between the polar adsorbent surface and ammonia.30 These possible mechanisms highlight the advantage of Brønsted acidic sites over Lewis acidic sites in the context of NH3 capture.
We note that while P1-PO3H2 displays a broad desorption curve under humid conditions, the curve for P1-SO3H is rather steep (Fig. 3a, dashed lines). Although ammonia dissolution is a weak retention mechanism and captured ammonia can be released easily upon purging with air,29 it appears that the acidity enhancement afforded by water is more pronounced for P1-SO3H. On the other hand, ammonia is more strongly held in the P2 polymers, for instance both P2-SO3H and P2-CO2H exhibit steep desorption curves (Fig. 3b, dashed lines) with a significant ammonia retention. Therefore, depending on whether a high saturation or retention capacity is desired, the polymer structure and chemical features can be adjusted to tune the performance. Based upon humid breakthrough experiments, P1-SO3H, P1-PO3H2, and P2-CO2H are identified as the best performing materials with saturation capacities of greater than 7 mmol g−1. Importantly, this value surpasses the capacities of a number of other porous polymers (Table S3†). Moreover, the NH3 capacities of the Brønsted acidic polymers reported herein are also commensurate with one of the best performing metal–organic frameworks, HKUST-1, which exhibits NH3 loadings of 6.6 and 8.9 mmol g−1 under dry and humid conditions, respectively.13 However, this framework degrades in the presence of moisture and displays diminished NH3 uptake after the initial cycle of exposure unless it is embedded14 within a polymer membrane. In addition to enhanced uptakes, high structural stabilities of P1-SO3H, P1-PO3H2, and P2-CO2H under humid conditions are highly advantageous in terms of recyclability and reusability of these materials in an NH3 capture process.31
In situ FTIR spectroscopy
We sought to further probe the interaction of ammonia with Brønsted acidic groups utilizing in situ infrared spectroscopy. Experiments were carried out on P1-SO3H, P1-PO3H2, and P2-CO2H at ambient temperature and at an equilibrium NH3 pressure of 3 mbar, corresponding to the partial pressure of ammonia in our breakthrough experiments. Notably, spectral changes were observed at around 1450 cm−1 for all three polymers, associated with the formation of the ammonium cation (NH4+),32 as well as changes corresponding to deprotonated species of the Brønsted acidic sites. Thus, at this coverage, a proton transfer mechanism appears to be involved in NH3 uptake for these different acidic moieties. Spectral changes were also monitored upon desorption to assess the reversibility of ammonia binding.We note that the parent material, PAF-1, does not exhibit any substantial spectral changes upon exposure to ammonia (Fig. S37†). The initial spectrum is dominated by the typical features of this aromatic framework, and upon NH3 adsorption the spectral changes all corresponded to those associated with the roto-vibrational profile of gaseous ammonia.
The spectrum of activated P1-SO3H exhibits a series of very intense and sharp absorption bands in the 800–1800 cm−1 spectral range, which are ascribed to the vibrational modes of the aromatic structure and sulfonic acid group (Fig. 4a, red curve). In particular, the signals at 1370, 1095, and 895 cm−1 are generated by out-of-phase (νas) and in-phase (νs) stretching vibrations of the SO2 group, and the OH bending mode of the S–OH moiety, respectively.32 After equilibrating the sample with 3 mbar of ammonia, important spectral modifications become apparent (Fig. 4a, blue curve). A new broad signal emerges in the 1440–1490 cm−1 region as a consequence of the formation of ammonium ions and overlaps with one of the peaks resulting from aromatic ring vibrations at 1465 cm−1. The absorption bands assigned to SO2 and S–OH moieties in the activated material also disappear and two strong signals appear at 1035 and 1225 cm−1 due to νs and νas modes of the newly formed sulfonate (–SO3−) group.32 All of these spectral changes indicate that proton transfer to ammonia indeed occurs at 3 mbar. After NH3 adsorption, the sample was evacuated for 2 h at beam temperature (residual pressure < 10−4 mbar) to evaluate the reversibility of the proton transfer (Fig. 4a, green curve). The aforementioned absorption bands at 1035, 1225, and 1485 cm−1 remain almost unchanged upon desorption, demonstrating the high stability of the generated ammonium ion. Additionally, the νas(SO2) and νs(SO2) modes of the sulfonic acid moieties could not be restored, even after prolonged outgassing.
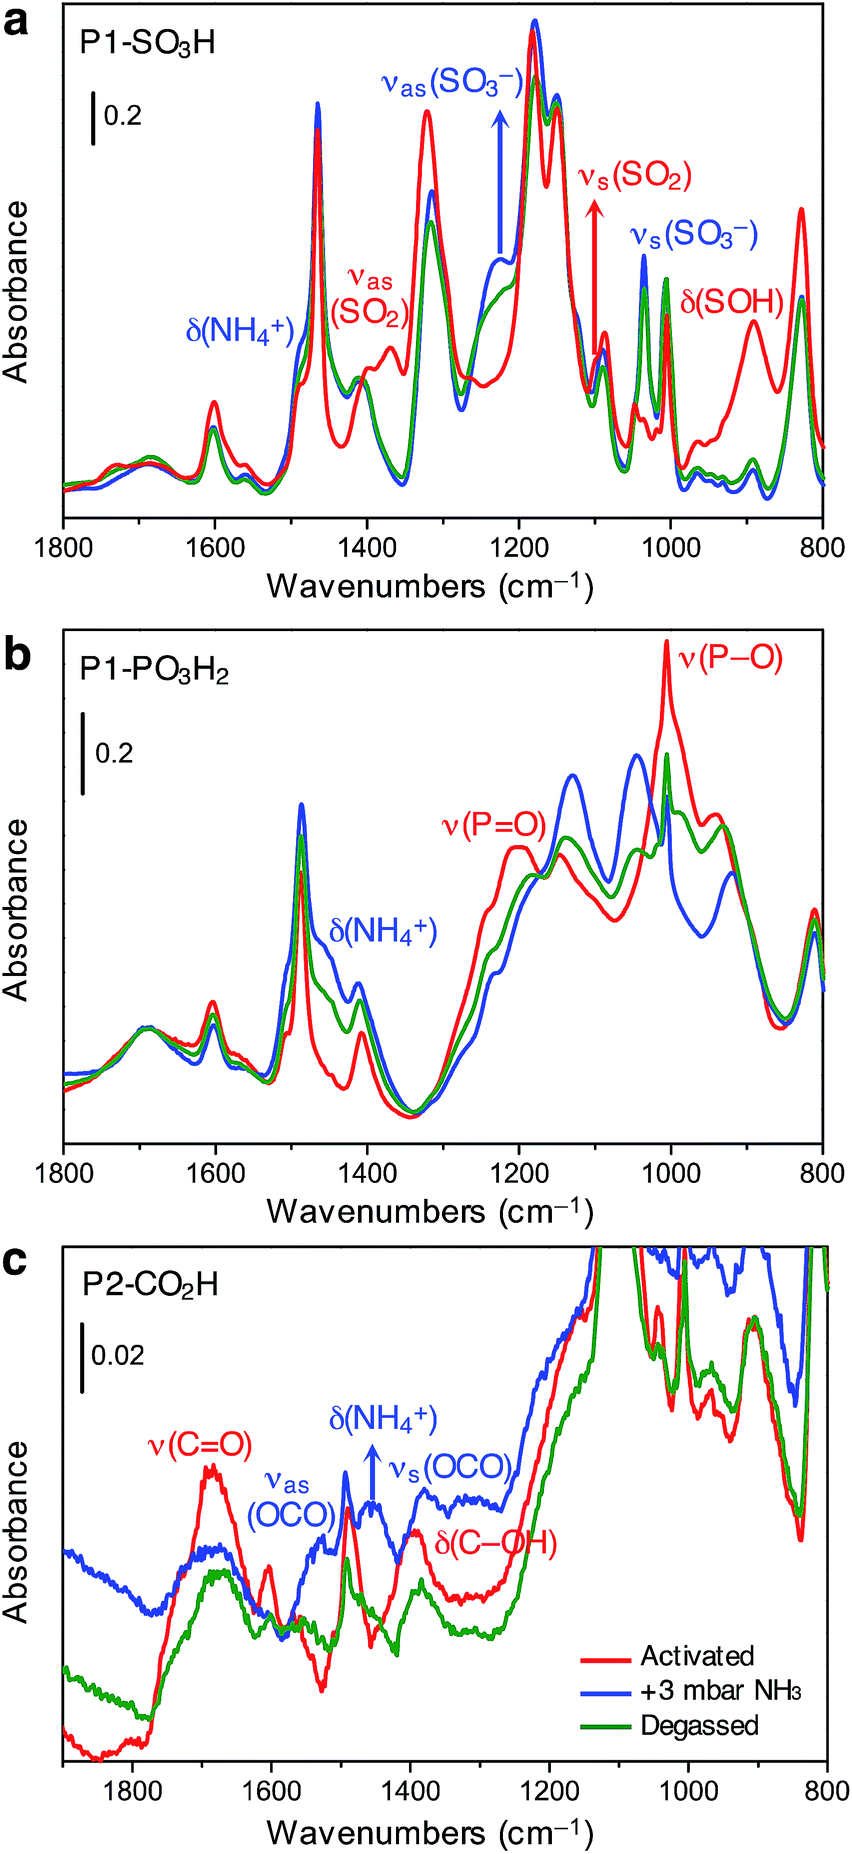 | ||
| Fig. 4 Infrared spectra of (a) P1-SO3H, (b) P1-PO3H2, and (c) P2-CO2H in the 1800–800 cm−1 spectral range collected at 298 K after its thermal activation under vacuum (red lines), equilibration with ammonia at an equilibrium pressure of 3 mbar (blue lines), and subsequent evacuation under vacuum (green lines). | ||
Spectra collected for in situ ammonia-dosed on P1-PO3H2 suggested a similar proton transfer between ammonia and phosphonic acid groups within the polymer. The activated spectrum of P1-PO3H2 exhibits typical features, in particular, strong and broad signals located at around 1000 and 1200 cm−1 and corresponding to P–O(H) and PO stretching vibrations, respectively (Fig. 4b, red curve).32 Upon dosing with ammonia, the δ(NH4+) mode of the ammonium ion clearly appears as a broad component at ∼1450 cm−1, while the P–O and PO stretching modes are deeply perturbed, indicating deprotonation of one or both acidic protons (Fig. 4b, blue curve). Interestingly, outgassing following NH3 adsorption results in a partial restoration of the spectral features of the activated sample (Fig. 4b, green curve).
The spectrum of activated P2-CO2H exhibits two broad signals at 1688 and 1393 cm−1, which we assign to ν(CO) stretching and δ(C–OH) bending vibrations of the carboxylic acid group, respectively (Fig. 4c, red curve).32 Exposure of the sample to 3 mbar of ammonia leads to immediate appearance of the δ(NH4+) mode at ∼1458 cm−1 (Fig. 4c, blue curve). Moreover, the ν(CO) and δ(C–OH) band intensities decrease, and this change is accompanied by the appearance of two new bands at 1525 and 1378 cm−1 that can be ascribed to νas(OCO) and νs(OCO) modes of the carboxylate (–CO2−) group, respectively.32 Notably, in contrast to what was observed for P1-SO3H and P1-PO3H2, for P2-CO2H, the proton transfer to ammonia seems to be quite reversible (Fig. 4c, green curve). Indeed, after outgassing the ammonia-exposed sample, the δ(NH4+) and ν(OCO) bands decrease dramatically and the characteristic signals of the carboxylic acid groups are partially restored.
Another unique feature exhibited by P2-CO2H upon ammonia exposure is the noticeable change in the scattering profile of the whole spectrum (Fig. S40†). The spectrum displays an evident increase in the absorption profile below 3000 cm−1, indicative of very strong hydrogen bonding. In conjunction with the partially reversible appearance of the ammonium and carboxylate signals, this feature is indicative of the presence of a hesitating proton with high mobility—i.e., the proton fluctuates between carboxylic acid and ammonia.33 Importantly, this observation sheds further light on the enhanced NH3 adsorption capacity of P2-CO2H over P1-SO3H at low pressures, as discussed earlier. In spite of a weaker acidity, the high density of carboxylic acid groups in an interpenetrated structure creates strong binding sites for ammonia as well as a stabilizing polar environment for ammonium ions.
Conclusions
The foregoing results demonstrate the efficient removal of ammonia from air in two series of Brønsted acidic porous polymers, one without (P1) and one with (P2) framework interpenetration, wherein the strength of the acidic functional groups was systematically varied. Adsorption isotherms revealed that NH3 capacities of the P1-PO3H2, P2-SO3H, and P2-CO2H polymers are competitive with those of traditional adsorbents, such as zeolites, and are significantly better than acidic polymer resins, particularly in the low pressure region. Furthermore, dynamic breakthrough experiments performed under humid conditions, which are more relevant to air filtration applications, also revealed that P1-SO3H, P1-PO3H2, and P2-CO2H outperform most other metal–organic frameworks and porous polymers reported to date for NH3 capture (Tables S3 and S4†). These findings emphasize the advantage of Brønsted acidic over Lewis acidic sites, specifically due to the competition between ammonia and water adsorption that has been observed in zeolites and metal–organic frameworks with open metal coordination sites. Furthermore, study of the mechanism of NH3 adsorption in P1-SO3H, P1-PO3H2, and P2-CO2H via in situ infrared spectroscopy revealed a proton transfer reaction as well as strong hydrogen bonding interactions in the case of P2-CO2H. Most strikingly, the proximity of multiple weaker acidic groups in the interpenetrated polymer P2-CO2H and their cooperative reactivity amplifies the strength of interaction with ammonia molecules. The NH3 uptake in P2-CO2H is thus larger than for P1-SO3H, which exhibits stronger-binding but more isolated acid groups. Taking both the low- and high-pressure uptake behavior of these polymers into account, it can be concluded that both the Brønsted acidity strength and pore environments govern the amount of ammonia adsorbed, while humidity and corresponding water co-adsorption also plays an important role in the NH3 uptake mechanism. More broadly, the high stability of porous polymers and the level of synthetic control demonstrated here suggests that these materials may present excellent platforms for a range of desired capture and storage applications, for ammonia as well as other toxic gases.Acknowledgements
This research was supported through the Center for Gas Separations Relevant to Clean Energy Technologies, an Energy Frontier Research Center funded by the U.S. Department of Energy, Office of Science, Office of Basic Energy Sciences under award DE-SC0001015. We thank the Miller Institute for Basic Research in Science for support of G. B. with a postdoctoral fellowship. G. W. P. thanks the Joint Science and Technology Office for support under project no. CB3934/BA13PHM210. We thank Matt Browe and Amedeo Napolitano for their help with breakthrough experiments and Dr Jiwoong Lee for helpful discussions. Dr Katie R. Meihaus is acknowledged for editorial assistance.Notes and references
- (a) G. Férey, Chem. Soc. Rev., 2008, 37, 191 RSC; (b) S. Horike, S. Shimomura and S. Kitagawa, Nat. Chem., 2009, 1, 695 CrossRef CAS PubMed; (c) M. O'Keeffe and O. M. Yaghi, Chem. Rev., 2012, 112, 675 CrossRef PubMed; (d) H. C. Zhou, J. R. Long and O. M. Yaghi, Chem. Rev., 2012, 112, 673 CrossRef CAS PubMed; (e) H. Furukawa, K. E. Cordova, M. O'Keeffe and O. M. Yaghi, Science, 2013, 341, 974 CrossRef CAS PubMed; (f) H. C. Zhou and S. Kitagawa, Chem. Soc. Rev., 2014, 43, 5415 RSC.
- (a) N. B. McKeown and P. M. Budd, Chem. Soc. Rev., 2006, 35, 675 RSC; (b) A. Thomas, Angew. Chem., Int. Ed., 2010, 49, 8328 CrossRef CAS PubMed; (c) P. Kaur, J. T. Hupp and S. T. Nguyen, ACS Catal., 2011, 1, 819 CrossRef CAS; (d) R. Dawson, A. I. Cooper and D. J. Adams, Prog. Polym. Sci., 2012, 37, 530 CrossRef CAS; (e) D. C. Wu, F. Xu, B. Sun, R. W. Fu, H. K. He and K. Matyjaszewski, Chem. Rev., 2012, 112, 3959 CrossRef CAS PubMed; (f) Y. G. Zhang and S. N. Riduan, Chem. Soc. Rev., 2012, 41, 2083 RSC; (g) T. Muller and S. Brase, RSC Adv., 2014, 4, 6886 RSC.
- (a) Z. Q. Wang and S. M. Cohen, Chem. Soc. Rev., 2009, 38, 1315 RSC; (b) O. K. Farha and J. T. Hupp, Acc. Chem. Res., 2010, 43, 1166 CrossRef CAS PubMed; (c) J. X. Jiang and A. I. Cooper, Top. Curr. Chem., 2010, 293, 1 CrossRef CAS PubMed; (d) B. L. Chen, S. C. Xiang and G. D. Qian, Acc. Chem. Res., 2010, 43, 1115 CrossRef CAS PubMed; (e) A. Schneemann, S. Henke, I. Schwedler and R. A. Fischer, ChemPhysChem, 2014, 15, 823 CrossRef CAS PubMed; (f) J. D. Evans, C. J. Sumby and C. J. Doonan, Chem. Soc. Rev., 2014, 43, 5933 RSC; (g) A. G. Slater and A. I. Cooper, Science, 2015, 348, 988 CrossRef CAS PubMed.
- (a) J. R. Li, J. Sculley and H. C. Zhou, Chem. Rev., 2012, 112, 869 CrossRef CAS PubMed; (b) R. E. Morris and P. S. Wheatley, Angew. Chem., Int. Ed., 2008, 47, 4966 CrossRef CAS PubMed; (c) C. D. Wood, B. Tan, A. Trewin, F. Su, M. J. Rosseinsky, D. Bradshaw, Y. Sun, L. Zhou and A. I. Cooper, Adv. Mater., 2008, 20, 1916 CrossRef CAS; (d) L. J. Murray, M. Dinca and J. R. Long, Chem. Soc. Rev., 2009, 38, 1294 RSC; (e) H. Furukawa and O. M. Yaghi, J. Am. Chem. Soc., 2009, 131, 8875 CrossRef CAS PubMed; (f) T. A. Makal, J. R. Li, W. G. Lu and H. C. Zhou, Chem. Soc. Rev., 2012, 41, 7761 RSC; (g) K. Sumida, D. L. Rogow, J. A. Mason, T. M. McDonald, E. D. Bloch, Z. R. Herm, T. H. Bae and J. R. Long, Chem. Rev., 2012, 112, 724 CrossRef CAS PubMed; (h) F. Vilela, K. Zhang and M. Antonietti, Energy Environ. Sci., 2012, 5, 7819 RSC; (i) Y. Peng, V. Krungleviciute, I. Eryazici, J. T. Hupp, O. K. Farha and T. Yildirim, J. Am. Chem. Soc., 2013, 135, 11887 CrossRef CAS PubMed; (j) Z. R. Herm, E. D. Bloch and J. R. Long, Chem. Mater., 2014, 26, 323 CrossRef CAS.
- (a) E. D. Bloch, W. L. Queen, R. Krishna, J. M. Zadrozny, C. M. Brown and J. R. Long, Science, 2012, 335, 1606 CrossRef CAS PubMed; (b) W. G. Lu, J. P. Sculley, D. Q. Yuan, R. Krishna, Z. W. Wei and H. C. Zhou, Angew. Chem., Int. Ed., 2012, 51, 7480 CrossRef CAS PubMed; (c) S. A. Didas, A. R. Kulkarni, D. S. Sholl and C. W. Jones, ChemSusChem, 2012, 5, 2058 CrossRef CAS PubMed; (d) E. D. Bloch, M. R. Hudson, J. A. Mason, S. Chavan, V. Crocella, J. D. Howe, K. Lee, A. L. Dzubak, W. L. Queen, J. M. Zadrozny, S. J. Geier, L. C. Lin, L. Gagliardi, B. Smit, J. B. Neaton, S. Bordiga, C. M. Brown and J. R. Long, J. Am. Chem. Soc., 2014, 136, 10752 CrossRef CAS PubMed; (e) T. M. McDonald, J. A. Mason, X. Q. Kong, E. D. Bloch, D. Gygi, A. Dani, V. Crocella, F. Giordanino, S. O. Odoh, W. S. Drisdell, B. Vlaisavljevich, A. L. Dzubak, R. Poloni, S. K. Schnell, N. Planas, K. Lee, T. Pascal, L. W. F. Wan, D. Prendergast, J. B. Neaton, B. Smit, J. B. Kortright, L. Gagliardi, S. Bordiga, J. A. Reimer and J. R. Long, Nature, 2015, 519, 303 CrossRef CAS PubMed; (f) D. A. Reed, D. J. Xiao, M. I. Gonzalez, L. E. Darago, Z. R. Herm, F. Grandjean and J. R. Long, J. Am. Chem. Soc., 2016, 138, 5594 CrossRef CAS PubMed.
- (a) D. Britt, D. Tranchemontagne and O. M. Yaghi, Proc. Natl. Acad. Sci. U. S. A., 2008, 105, 11623 CrossRef CAS PubMed; (b) C. Petit and T. J. Bandosz, Adv. Mater., 2009, 21, 4753 CrossRef CAS; (c) T. G. Glover, G. W. Peterson, B. J. Schindler, D. Britt and O. Yaghi, Chem. Eng. Sci., 2011, 66, 163 CrossRef; (d) C. Petit, Factors Affecting the Removal of Ammonia from Air on Carbonaceous Materials, Springer-Verlag, New York, 2012 Search PubMed; (e) E. Barea, C. Montoro and J. A. R. Navarro, Chem. Soc. Rev., 2014, 43, 5419 RSC; (f) J. B. DeCoste and G. W. Peterson, Chem. Rev., 2014, 114, 5695 CrossRef CAS PubMed; (g) H. Jasuja, G. W. Peterson, J. B. Decoste, M. A. Browe and K. S. Walton, Chem. Eng. Sci., 2015, 124, 118 CrossRef CAS; (h) D. Wisser, F. M. Wisser, S. Raschke, N. Klein, M. Leistner, J. Grothe, E. Brunner and S. Kaskel, Angew. Chem., Int. Ed., 2015, 54, 12588 CrossRef CAS PubMed.
- United States Geological Survey: Nitrogen Statistics and Information, http://minerals.usgs.gov/minerals/pubs/commodity/nitrogen, accessed May 2016.
- E. Stokstad, Science, 2014, 343, 238 CrossRef CAS PubMed.
- Centers for Disease Control and Prevention: Anhydrous Ammonia, http://www.cdc.gov/healthcommunication/toolstemplates/entertainmented/tips/anhydrousammonia.html, accessed May 2016.
- Occupational Safety & Health Administration: Ammonia, http://www.osha.gov/dts/chemicalsampling/data/CH_218300.html, accessed May 2016.
- F. Schuth, R. Palkovits, R. Schlogl and D. S. Su, Energy Environ. Sci., 2012, 5, 6278 Search PubMed.
- (a) C. Petit and T. J. Bandosz, Adv. Funct. Mater., 2010, 20, 111 CrossRef CAS; (b) C. Petit and T. J. Bandosz, Adv. Funct. Mater., 2011, 21, 2108 CrossRef CAS; (c) D. C. Yu, P. Ghosh and R. Q. Snurr, Dalton Trans., 2012, 41, 3962 RSC; (d) K. C. Kim, D. C. Yu and R. Q. Snurr, Langmuir, 2013, 29, 1446 CrossRef CAS PubMed; (e) K. C. Kim, P. Z. Moghadam, D. Fairen-Jimenez and R. Q. Snurr, Ind. Eng. Chem. Res., 2015, 54, 3257 CrossRef CAS.
- G. W. Peterson, G. W. Wagner, A. Balboa, J. Mahle, T. Sewell and C. J. Karwacki, J. Phys. Chem. C, 2009, 113, 13906 CAS.
- J. B. DeCoste, M. S. Denny, G. W. Peterson, J. J. Mahle and S. M. Cohen, Chem. Sci., 2016, 7, 2711 RSC.
- (a) C. J. Doonan, D. J. Tranchemontagne, T. G. Glover, J. R. Hunt and O. M. Yaghi, Nat. Chem., 2010, 2, 235 CrossRef CAS PubMed; (b) G. W. Peterson, O. K. Farha, B. Schindler, P. Jones, J. Mahle and J. T. Hupp, J. Porous Mater., 2012, 19, 261 CrossRef CAS; (c) M. H. Weston, G. W. Peterson, M. A. Browe, P. Jones, O. K. Farha, J. T. Hupp and S. T. Nguyen, Chem. Commun., 2013, 49, 2995 RSC.
- (a) P. Pandey, O. K. Farha, A. M. Spokoyny, C. A. Mirkin, M. G. Kanatzidis, J. T. Hupp and S. T. Nguyen, J. Mater. Chem., 2011, 21, 1700 RSC; (b) D. Q. Yuan, W. G. Lu, D. Zhao and H. C. Zhou, Adv. Mater., 2011, 23, 3723 CrossRef CAS PubMed; (c) Y. M. Zhang, B. Y. Li and S. Q. Ma, Chem. Commun., 2014, 50, 8507 RSC.
- J. F. Van Humbeck, T. M. McDonald, X. F. Jing, B. M. Wiers, G. S. Zhu and J. R. Long, J. Am. Chem. Soc., 2014, 136, 2432 CrossRef CAS PubMed.
- Network topologies in Fig. 1b were illustrated based on a diamondoid structure for the sake of clarity. An amorphous structure mapped from amorphous silica were shown to better represent the properties of PAF-1. See: (a) A. Trewin and A. I. Cooper, Angew. Chem., Int. Ed., 2010, 49, 1533 CrossRef CAS PubMed; (b) J. M. H. Thomas and A. Trewin, J. Phys. Chem. C, 2014, 118, 19712 CrossRef CAS.
- Most likely, interpenetration occurs in a multifold (>2x) fashion and the choice of 3-fold interpenetration for P2 frameworks in Fig. 1b is solely for illustration purposes. See: R. L. Martin, M. N. Shahrak, J. A. Swisher, C. M. Simon, J. P. Sculley, H. C. Zhou, B. Smit and M. Haranczyk, J. Phys. Chem. C, 2013, 117, 20037 CAS.
- W. G. Lu, D. Q. Yuan, J. L. Sculley, D. Zhao, R. Krishna and H. C. Zhou, J. Am. Chem. Soc., 2011, 133, 18126 CrossRef CAS PubMed.
- A. M. Fracaroli, H. Furukawa, M. Suzuki, M. Dodd, S. Okajima, F. Gandara, J. A. Reimer and O. M. Yaghi, J. Am. Chem. Soc., 2014, 136, 8863 CrossRef CAS PubMed.
- T. Nakamura, K. Yonesu, Y. Mizuno, C. Suzuki, Y. Sakata, Y. Takuwa, F. Nara and S. Satoh, Bioorg. Med. Chem., 2007, 15, 3548 CrossRef CAS PubMed.
- (a) J. C. Roberts, H. Gao, A. Gopalsamy, A. Kongsjahju and R. J. Patch, Tetrahedron Lett., 1997, 38, 355 CrossRef CAS; (b) S. C. Miller, J. Org. Chem., 2010, 75, 4632 CrossRef CAS PubMed.
- T. Ben, H. Ren, S. Q. Ma, D. P. Cao, J. H. Lan, X. F. Jing, W. C. Wang, J. Xu, F. Deng, J. M. Simmons, S. L. Qiu and G. S. Zhu, Angew. Chem., Int. Ed., 2009, 48, 9457 CrossRef CAS PubMed.
- R. K. Totten, L. L. Olenick, Y. S. Kim, S. Chakraborty, M. H. Weston, O. K. Farha, J. T. Hupp and S. T. Nguyen, Chem. Sci., 2014, 5, 782 RSC.
- J. Helminen, J. Helenius, E. Paatero and I. Turunen, J. Chem. Eng. Data, 2001, 46, 391 CrossRef CAS.
- J. B. DeCoste and G. W. Peterson, J. Visualized Exp., 2013, e51175 Search PubMed.
- (a) M. J. Katz, A. J. Howarth, P. Z. Moghadam, J. B. DeCoste, R. Q. Snurr, J. T. Hupp and O. K. Farha, Dalton Trans., 2016, 45, 4150 RSC; (b) S. Bashkova and T. J. Bandosz, J. Colloid Interface Sci., 2014, 417, 109 CrossRef CAS PubMed.
- C. Petit, B. Mendoza and T. J. Bandosz, Langmuir, 2010, 26, 15302 CrossRef CAS PubMed.
- (a) L. M. Le Leuch and T. J. Bandosz, Carbon, 2007, 45, 568 CrossRef CAS; (b) M. Seredych and T. J. Bandosz, Langmuir, 2010, 26, 5491 CrossRef CAS PubMed.
- See Fig. S35† in the ESI for cycling experiments on P2-CO2H. This material is shown to be stable over at least four adsorption/desorption cycles without significant change in the NH3 uptake capacity.
- (a) N. B. Colthup, L. H. Daly and S. E. Weberley, Introduction to Infrared and Raman Spectroscopy, Academic Press, 1990 Search PubMed; (b) P. Larkin, Infrared and Raman Spectroscopy – Principles and Spectral Interpretation, Elsevier, 2011 Search PubMed.
- A. Zecchina, G. Spoto and S. Bordiga, in Handbook of Vibrational Spectroscopy, Wiley, 2006, pp. 10–12 Search PubMed.
Footnote |
| † Electronic supplementary information (ESI) available: Experimental details including synthesis and characterization of polymers, NH3 adsorption, breakthrough experiments, and in situ infrared spectroscopy. See DOI: 10.1039/c6sc05079d |
| This journal is © The Royal Society of Chemistry 2017 |