
 Open Access Article
 This Open Access Article is licensed under a Creative Commons Attribution-Non Commercial 3.0 Unported Licence
Charge transfer dynamics in DNA revealed by time-resolved spectroscopy
Mamoru
Fujitsuka
 * and
Tetsuro
Majima
*
* and
Tetsuro
Majima
*
The Institute of Scientific and Industrial Research (SANKEN), Osaka University, Mihogaoka 8-1, Ibaraki, Osaka 567-0047, Japan. E-mail: fuji@sanken.osaka-u.ac.jp; majima@sanken.osaka-u.ac.jp
First published on 13th December 2016
Abstract
In the past few decades, charge transfer in DNA has attracted considerable attention from researchers in a wide variety of fields, including bioscience, physical chemistry, and nanotechnology. Charge transfer in DNA has been investigated using various techniques. Among them, time-resolved spectroscopic methods have yielded valuable information on charge transfer dynamics in DNA, providing an important basis for numerical practical applications such as development of new therapy applications and nanomaterials. In DNA, holes and excess electrons act as positive and negative charge carriers, respectively. Although hole transfer dynamics have been investigated in detail, the dynamics of excess electron transfer have only become clearer relatively recently. In the present paper, we summarize studies on the dynamics of hole and excess electron transfer conducted by several groups including our own.
 Mamoru Fujitsuka | Mamoru Fujitsuka received B.S., M.S., and Doctor degrees from Kyoto University. After two years work as a postdoc, he became a research associate of Institute for Chemical Reaction Science, Tohoku University. In 2003, he moved to the Institute of Scientific and Industrial Research (SANKEN), Osaka University, as an associate professor. His research interest is photochemistry of various supramolecules. |
 Tetsuro Majima | Tetsuro Majima received B.S., M.S., and Doctor degrees from Osaka University. After working at the University of Texas at Dallas (1980–1982) and at the Institute of Physical and Chemical Research (RIKEN, Japan) (1982–1994), he became an associate professor of the Institute of Scientific and Industrial Research (SANKEN), Osaka University, and a professor in 1997. His research interests are radiation and photo chemistries. |
1. Introduction
In the past few decades, charge transfer in DNA has attracted considerable attention from researchers in diverse fields. Under biological conditions, DNA is continuously attacked by environmentally generated oxidants or reductants. Oxidation of DNA promotes DNA damage,1,2 and reduction of DNA is part of the repair mechanism of DNA lesions by photolyase.3–5 Charge transfer in DNA is responsible for the remote oxidation or reduction process, i.e., the oxidation or reduction of nucleobases apart from the initially oxidized or reduced nucleobase. In addition, the electrical conductivity of DNA has long been a research focus, since DNA exhibits a highly stacked structure of nucleobases in duplex, which is advantageous for electrical conduction.6 Thus, applications of DNA to nanowires have also started to be explored. Charge transfer in DNA is an interesting subject for physical chemists with respect to understanding electron transfer processes in polymeric systems and other related topics.Charge transfer in DNA has been investigated using various techniques. For example, the electrical conductivity measurements have shown conductivities ranging from those of an insulator to those of a superconductor.7–10 Furthermore, product analysis of the oxidative or reductive reactions of DNA has provided valuable information on charge transfer mechanisms. Such analyses have revealed that holes and excess electrons, which are positive and negative charge carriers in DNA, respectively, can migrate rather long distances by means of a multistep hopping process.11,12 Furthermore, investigations using time-resolved spectroscopic methods have provided information on the charge transfer dynamics in DNA, including the rate constants for single-step tunnelling and hopping processes (Fig. 1a and b). Using these experimental techniques, hole transfer (HT) dynamics have been investigated in detail for decades, whereas the dynamics of excess electron transfer (EET) have only started to become clear more recently. Our research group has also carried out time-resolved spectroscopic studies on charge transfer in DNA,13 because the dynamics parameters can provide quantitative and useful information for practical applications. In the present paper, we summarize the time-resolved spectroscopic studies on HT and EET in DNA conducted by several research groups including our own.
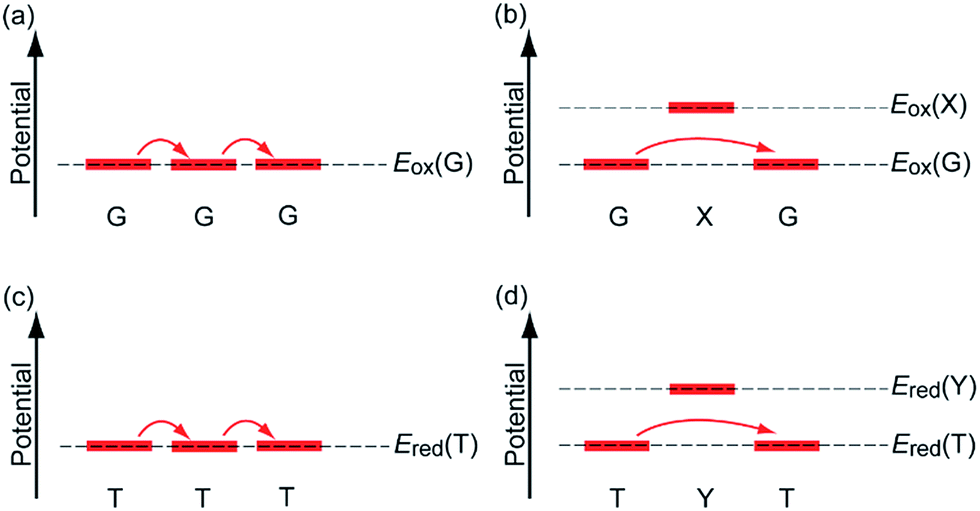 | ||
| Fig. 1 Mechanisms of HT and EET in DNA. (a) G-to-G consecutive hole hopping, (b) G–X–G (X = A, C, or T) hole tunnelling, (c) T-to-T consecutive excess electron hopping, and (d) T–Y–T excess electron tunnelling. Eox and Ered are oxidation and reduction potentials, respectively. Note: Eox(G) < Eox(X), while Ered(T) > Ered(Y). | ||
2. Hole transfer in DNA
Using transient absorption spectroscopy during laser flash photolysis of DNA conjugated with a photosensitizing electron acceptor, Lewis et al. reported the distance and driving force dependencies of the hole injection processes in DNA.14–16 Based on the charge separation rate between the singlet-excited stilbene dicarboxaminde and G through A![[thin space (1/6-em)]](https://www.rsc.org/images/entities/char_2009.gif) :T base pairs, they estimated the damping factor (β) in kET ∝ exp(−βr) to be ∼0.7 Å−1, where kET and r are the electron transfer rate and distance required for single-step electron transfer, respectively. This value is similar to those obtained by product analysis and other time-resolved spectroscopic methods, including time-resolved fluorescence measurement and pulse radiolysis.12,17 It was shown that polyA or polyT between the photosensitizing electron acceptor and G did not have a significant effect on the β value. However, the β value of the charge recombination process was found to be larger, ∼0.9 Å−1, which was attributed to its larger driving force. In addition, from the driving force dependence of the charge separation and recombination processes, Lewis et al. estimated a reorganization energy of 1.22 eV and electronic coupling of 347 cm−1 when the electron acceptor and donor nucleobase were placed in close vicinity.16 When the acceptor and donor were separated by two A:T base pairs, these values changed to 1.30 eV and 25 cm−1, respectively. These values are similar to those reported for various electron transfer systems in non-adiabatic conditions.
:T base pairs, they estimated the damping factor (β) in kET ∝ exp(−βr) to be ∼0.7 Å−1, where kET and r are the electron transfer rate and distance required for single-step electron transfer, respectively. This value is similar to those obtained by product analysis and other time-resolved spectroscopic methods, including time-resolved fluorescence measurement and pulse radiolysis.12,17 It was shown that polyA or polyT between the photosensitizing electron acceptor and G did not have a significant effect on the β value. However, the β value of the charge recombination process was found to be larger, ∼0.9 Å−1, which was attributed to its larger driving force. In addition, from the driving force dependence of the charge separation and recombination processes, Lewis et al. estimated a reorganization energy of 1.22 eV and electronic coupling of 347 cm−1 when the electron acceptor and donor nucleobase were placed in close vicinity.16 When the acceptor and donor were separated by two A:T base pairs, these values changed to 1.30 eV and 25 cm−1, respectively. These values are similar to those reported for various electron transfer systems in non-adiabatic conditions.
Our research group measured the transient absorption spectra during the laser flash photolysis of hairpin DNA consisting of A:T base pairs, which were conjugated with naphthaldiimide (NDI) and phenothiazine (PTZ) as a photosensitizing electron acceptor and donor, respectively.18 Upon selective excitation of NDI using a nanosecond laser pulse, generation of PTZ radical cation was confirmed within the laser pulse duration. Although the formation dynamics of PTZ radical cation were not observed because of the fast hole-hopping among A's, the distance dependence of the generation yield (Fig. 2) indicated that PTZ radical cation was generated by multistep hopping of the hole injected from the singlet excited NDI to DNA. This is in accordance with the conclusions derived from product analysis.12 In addition, the A-to-A hopping rate was estimated to be 2 × 10¹⁰ s−1. Recently, Lewis and co-workers estimated the A-to-A and G-to-G hopping rates to be 1.2 × 10⁹ and 4.3 × 10⁹ s−1, respectively, based on the direct observation of HT dynamics in a photosensitizing acceptor–DNA–donor system by transient absorption spectroscopy.19 Thus, it can be concluded that the single step hole hopping time in A's or G's is on the order of several tens to hundreds of picoseconds.
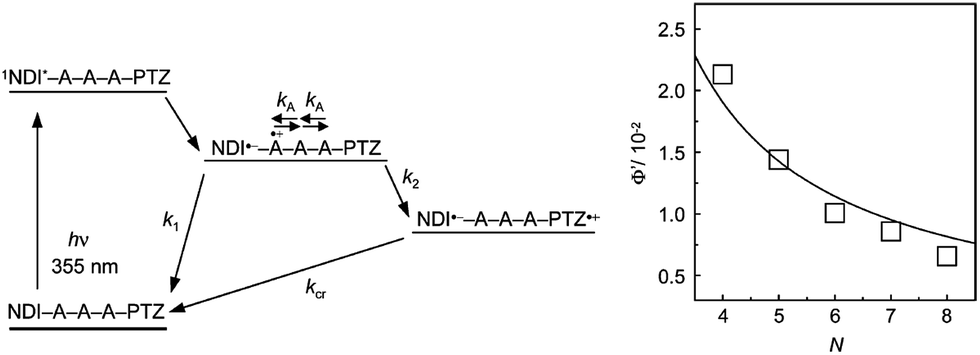 | ||
| Fig. 2 (Left) Schematic diagram for the HT in NDI- and PTZ-conjugated DNA and (Right) distance (N: step number) dependence of generation yield of PTZ radical cation. Reprinted with permission from literature.18 Copyright (2004) American Chemical Society. | ||
Insertion of other nucleobase(s) between A's or G's slows down the hopping rate among them, because the inserted nucleobase(s) act as a barrier for the hopping (Fig. 1). We estimated the hopping rates between G's or G and C, separated by various nucleobase(s), as summarized in Table 1.20,21 The hopping rate was found to depend on the type and number of nucleobase(s) present. These findings agree with the electron transfer theory;22,23 that is, the electron transfer rate depends to a large extent on the barrier height and length between the donor and acceptor. These studies revealed the detailed mechanisms and rate constants of HT in DNA. It should be emphasized that the rate constant of the charge transfer process is also essential in certain applications such as the detection of DNA sequences. For example, we showed that a single molecular fluorescence detection method can detect DNA sequences on the basis of the HT rate in DNA.24,25 Furthermore, we found that titanium dioxide can be used as the photosensitizing electron acceptor for the detection of a mismatch sequence.26
3. Excess electron transfer in DNA
Studies on EET in DNA have been carried out by means of several experimental methods such as product analysis and laser flash photolysis. Compared to studies on the HT in DNA, information on the kinetics such as EET rate is limited. The small number of studies on EET in DNA is probably due to the rather low reduction potentials of nucleobases,27 which limit the availability of the photosensitizing electron donor for such analysis. In following section, the knowledge on EET obtained to date is summarized.3.1 Excess electron tunnelling in DNA in low temperature glass
Sevilla and co-workers reported the results of an electron spin resonance (ESR) study on the EET in DNA.28 In their system, DNA and a non-specifically intercalated electron acceptor were irradiated by γ-rays in a glassy matrix at 77 K. The excess electron statistically generated on DNA nucleobases transfers to an electron acceptor such as mitoxantrone (MX), ethidium bromide, 1,10-phenanthroline, and 5-nitro-1,10-phenanthroline within a the time-scale of minutes to weeks. This EET process can be tracked by monitoring the signal produced from the radical anions of nucleobases using ESR. The distance for the electron tunnelling (Fig. 1d) was estimated to be 4–10 base pairs after 1 min at 77 K. The estimated rate was on the order of 100 to 101 s−1, from which they estimated the β values of each intercalator to be 0.85–1.2 Å−1 which is a similar range to the β values estimated for the HT process.Sevilla and colleagues further examined the effect of temperature on EET using DNA with MX as the intercalator and D2O as the solvent, which was employed to distinguish T radical anion and protonated reduced C.29 They found that the excess electron tunnelling from the nucleobase to MX was the dominant process at a temperature of <77 K. The estimated β values of DNA at 4 and 77 K were confirmed to be the same. This lack of temperature dependence can be attributed to the absence of the contribution of higher vibronic states in this temperature range. Furthermore, the deuteration of T radical anion at the C6 position was found to take place irreversibly above 130 K, which competes with the excess electron tunnelling and acts as an irreversible sink for the excess electrons. Furthermore, hybridization of G and C causes the protonation of C radical anion at the N3 position in a reversible manner to form a stable structure.
Furthermore, in 2002, Sevilla et al. estimated the β value and ET distance for some base sequences according to ESR measurements on duplexes of polydAdT and polydIdC, which included MX as an intercalator.30 The β value and ET distance were estimated to be 0.75 Å−1 and 9.4 base pairs, respectively, for the polydAdT duplex, and were calculated to be 0.92 Å−1 and 9.5 base pairs for the polydIdC duplex. They attributed these results to the slow deuteron transfer from I to C radical anion forming CD radical.
Therefore, from a series of ESR studies on γ-ray irradiated DNA with an intercalator, Sevilla et al. successfully obtained some parameters of the excess electron tunnelling in DNA, which were comparable to those of HT in DNA. In particular, the contribution of the protonated radical anion in EET is an important finding, which can be clearly observed with ESR measurements but is difficult to assess using other methods. In addition, it should be noted that the radiation chemical method is advantageous in the study of EET in DNA, because this method can easily generate the reduced forms of various organic molecules.31 Several groups have investigated charge transport in DNA using another important radiation chemical technique, pulse radiolysis. For example, Kobayashi et al. reported the transient absorption spectra of reduced nucleobases, which revealed the delocalization of the excess electron over several nucleobases.32 However, oxidation or reduction via radiation chemical method occurs in a random manner. In addition, oxidation or reduction of the target molecules occurs from the reaction with an initially generated oxidized or reduced solvent species, respectively. These characteristics of radiation chemistry limit the time resolution for kinetic research. Our research group attempted to apply pulse radiolysis to the study of EET in DNA to determine the rate constant of excess electron hopping (Fig. 1c), but the rate could not be determined because of these limitations.33
3.2 Excess electron hopping in DNA
Studies on excess electron hopping in DNA have been carried out by means of product analysis of DNA with a tethered photosensitizing electron donor, which injects excess electron to a certain position of DNA. In 2002, Carell and co-workers investigated the distance dependence of EET in a DNA conjugated with reduced flavin and a T–T cyclobutane dimer as the electron donor to DNA and acceptor, respectively.34 UV irradiation to a sequence of consecutive T's is known to generate a cyclobutane pyrimidine dimer lesion in DNA, which can be repaired by DNA photolyase enzymes through the electron transfer from reduced and deprotonated FADH− cofactor to a cyclobutane dimer.3 In this sense, this system mimics the DNA repair process by DNA photolyase. In their system, the T dimer and flavin were separated by A:T base pairs. Photoirradiation to reduced and deprotonated flavin causes the excess electron injection to T's, which is trapped by the T dimer after the hopping process in DNA. The reduction of the T dimer causes cycloreversion, which can be detected by HPLC. From the yield of the cycloreversion of the T dimer, they estimated the distance dependence of the electron transfer yield, from which the β value was estimated to be 0.11 Å−1. They attributed this small β value to hopping of excess electron in DNA. The plot of lnE against lnN, where E and N are the efficiency of the charge transfer and the number of steps, respectively, showed a linear relationship with a slope of approximately −2, which is in accordance with the one-dimensional random walk model (E ∝ N−2). Furthermore, it was confirmed that the excess electron induced to DNA could migrate over 24 Å. They also fabricated DNA hairpins with flavin and T dimer as the donor and acceptor, respectively, and showed a similar distance dependence of EET.35–37
Using this system of a flavin donor and T dimer acceptor, Carell and co-workers further investigated EET in a PNA:DNA hybrid.38 In this hybrid system, the flavin donor and T dimer acceptor were introduced to PNA and DNA chains, respectively. They found that the distance dependence of EET efficiency was similar to that of the DNA duplex system, indicating efficient interstrand EET. Furthermore, their PNA:DNA hybrids did not show a directional preference of EET (i.e., 5′ to 3′ or 3′ to 5′).39 Since the split rate of the T dimer is ∼106 s−1, they suggested that the rate-determining step of cycloreversion may be the splitting rather than EET in DNA, indicating the fast EET in DNA. They confirmed this speculation with experiments using BrU, BrA, and BrG as the acceptor of the excess electron that was injected from the flavin donor to DNA.40 They also investigated the effect of G:C pair insertion in an A:T tract on EET yield. They found that the DNA with the electron acceptor with higher electron accepting ability (BrU) was more sensitive to the insertion of a G:C pair, because the higher electron accepting ability results in faster electron trapping than EET in DNA. From these results, they suggested that the acceptor used in studies of the EET process should possess high electron acceptor ability in order to make the excess electron hopping a rate-determining step. More recently, they suggested that the hopping rate through the (A:T)4 pair is faster than 1.8 × 10⁷ s−1 and slower than 1.4 × 10⁸ s−1 based on the comparison of the EET rate through DNA with the debromination rate of BrU or cleavage rate of the T dimer.41
In their series of studies on EET using a flavin donor, Carrell et al. also revealed that the formation of the duplex structure is essential for EET. In addition, they confirmed that N2O, a solvated electron scavenger, has no effect on the EET. From this finding, they excluded a contribution of the solvated electron, which can be generated by electron ejection from the photoexcited donor to the solvent mediating the negative charge to the acceptor.42 Thus, the EET should be mediated by nucleobases in DNA. These are also important conclusions of their studies.
Rokita and Ito studied the EET using product analysis of the photolysis of DNA conjugated with N,N,N′,N′-tetramethyl-1,5-diaminonaphthalene (TMDN) and BrU, as the photosensitizing electron donor and electron acceptor, respectively (Fig. 3).43,44 Photoirradiation to TMDN causes the injection of the excess electron to DNA. The arrival of the excess electron to BrU after hopping through DNA generates a radical anion of BrU, which results in decomposition of the 5′ neighbour by generation of the U radical, H abstraction, and hydrolysis. The yield of the electron transfer to BrU was evaluated by electrophoresis. In 2003, they reported the small distance dependence of the generation yield of reduced BrU, which is in accordance with the results obtained by Carell et al., indicating that the excess electron transfer occurred via a hopping mechanism. Furthermore, in 2004, Rokita and Ito further clarified that T transfers the excess electron more efficiently than C for the same distance. Analysis of the isotope effect of the solvent showed that the contribution of the C radical anion to the excess charge transfer is limited due to the protonation of the C radical anion. Thus, T is a primary carrier of the excess electron. Furthermore, it was indicated that the interstrand EET is slower than the intrastrand EET, and the electron transfer in the 3′ to 5′ direction is faster than that of the reverse direction. This trend is opposite to that observed for the HT in DNA. They pointed out the importance of the contribution of MO to the charge carrier; i.e. HOMO for the HT and LUMO for the EET. These findings were not observed by Carell et al. because the slower splitting step of the reduced T dimer acted as the rate-determining step.
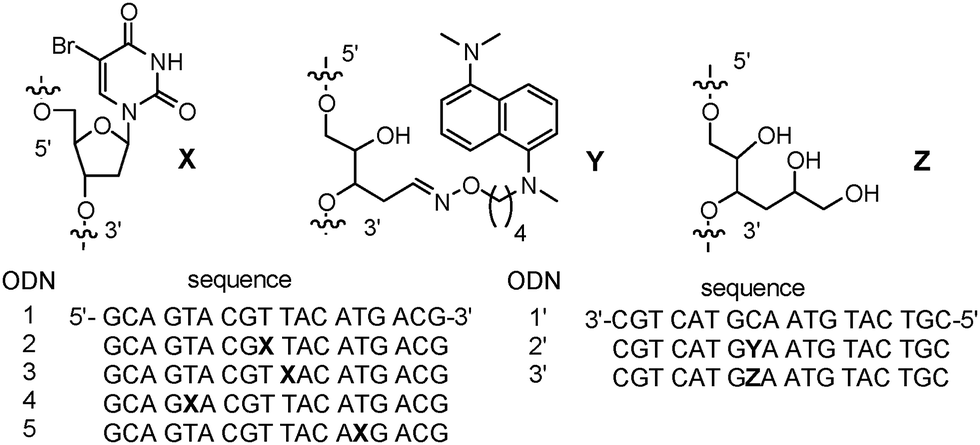 | ||
| Fig. 3 DNA conjugated with TMDN and BrU as the electron donor to DNA and acceptor, respectively. Reprinted with permission from literature.43 Copyright (2003) American Chemical Society. | ||
In summary, important information on the EET in DNA has also been obtained through studies based on product analysis. According to these results, DNA, especially T acts as the major carrier of the excess electron, whereas C has a minor contribution because of the protonation by G, which forms a pair with C, and surrounding water. The distance dependence of the EET yield associated with a β value of 0.1–0.3 Å−1, indicating that the multistep hopping of the excess electron is important in the long-range EET as in the case of the HT. This issue was confirmed by Carell et al. who showed that the EET yield obeys a one-dimensional random walk model. The tendencies observed by Rokita are quite interesting issues to be clarified through more detailed investigations. However, in contrast to the HT the rate constant of the EET has not been determined. For determination of the rate constant, kinetic information based on the time-resolved measurements is essential. In the next section, an overview of time-resolved spectroscopic studies for the EET is provided.
3.3 Excess electron injection to DNA
The kinetic properties of excess electron injection have been studied by means of ultrafast spectroscopic methods. In 1999, the research groups of Lewis and Wasielewski reported the results of a femtosecond transient absorption study on the electron injection from photoexcited stilbenediether (Sd) at the loop position of DNA hairpin.45,46 They found that the excess electron injection to T occurs within ∼0.2 ps when T is located next to Sd. They also confirmed that the electron injection to C occurred with a rate constant of 3.3 × 10¹¹ s−1, which is slower than that to T (>2 × 10¹² s−1) due to the smaller driving force of the excess electron injection. In addition, they determined that the electron transfer rate from excited Sd to the I:C pair was 1.4 × 10¹² s−1, which is much faster than that of the G:C pair, because of the enhanced electron accepting ability of C due to base pairing. They also studied the distance dependence of the excess electron injection using DNA hairpins with noncanonical G:G base pairs between Sd and A:T pairs (Fig. 4) to ensure that G acts as a barrier for the excess electron injection process without a contribution of C, which is a possible electron acceptor for photoexcited Sd. The electron injection rate decreased to 5.7 × 10⁹ and 4.4 × 10⁸ s−1 when one and two G:G pairs, respectively, were inserted between Sd and T. They indicated that these rates are slower than the hole injection from the singlet excited stilbenedicarboxamide (Sa) by a factor of approximately 25, in spite of a similar driving force for the charge separation. They attributed the observed difference in the charge injection rates to the longer donor–acceptor distance or weak donor–bridge–acceptor electronic coupling.
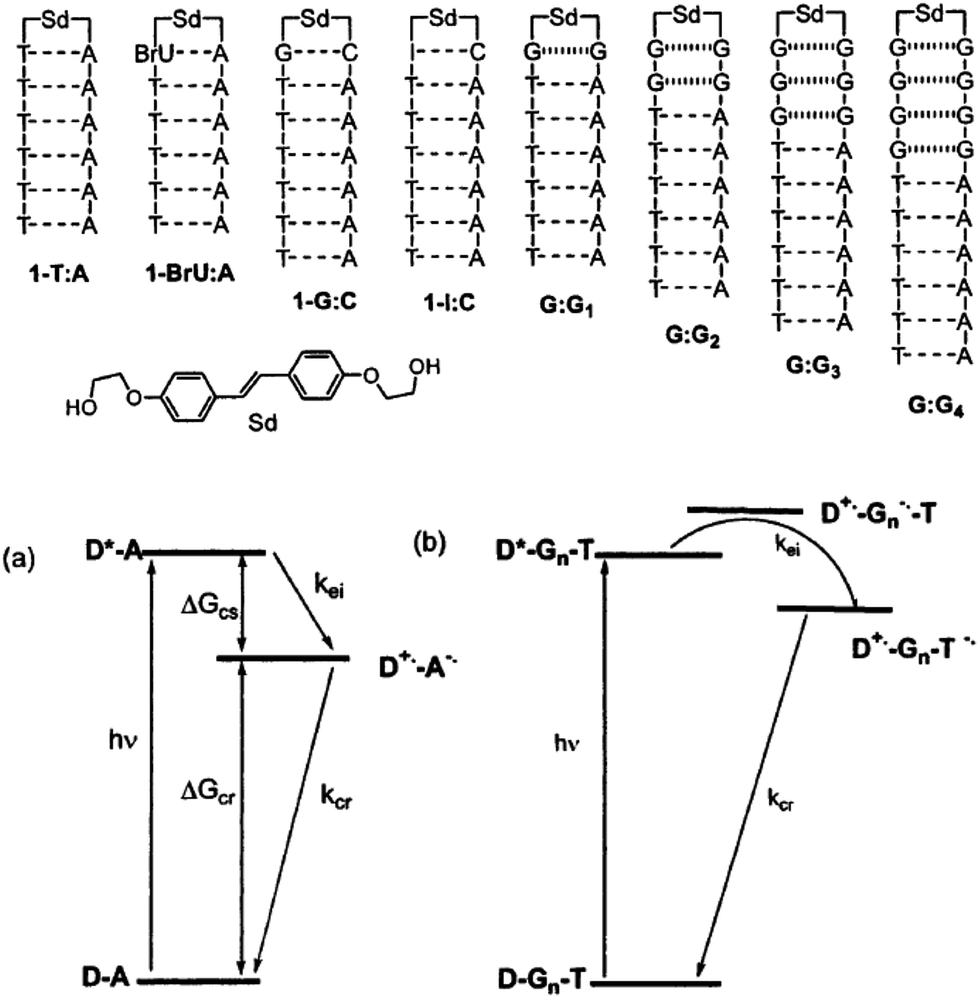 | ||
| Fig. 4 DNA hairpins conjugated with Sd at the loop position and schematic energy diagram for the excess electron injection from the photoexcited Sd. Reprinted with permission from literature.46 Copyright (2002) American Chemical Society. | ||
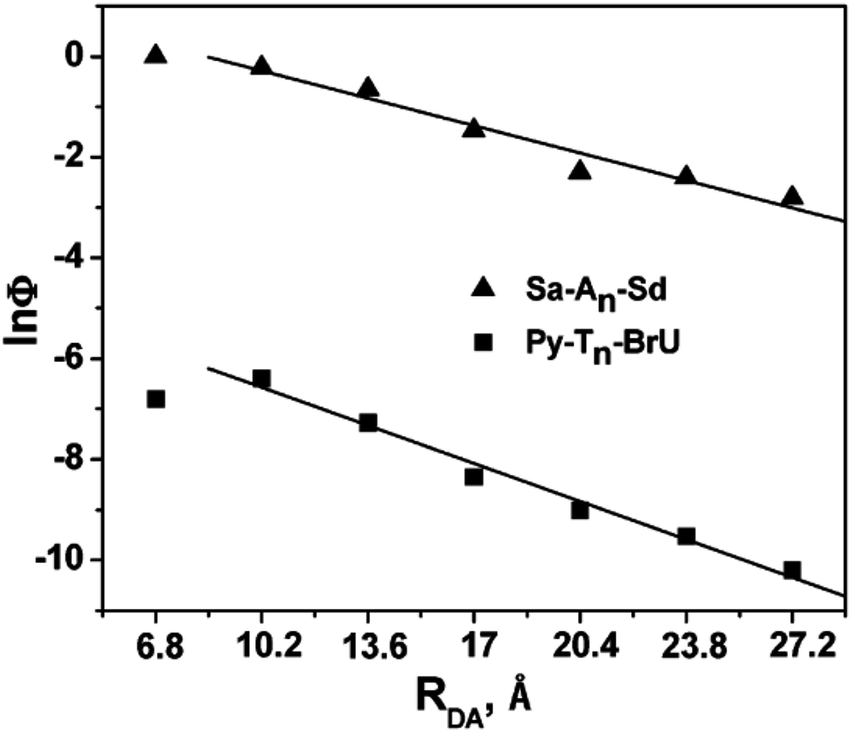
In 2009, the research groups of Lewis and Fiebig reported the charge injection process in DNA conjugated with aminopyrene (APy) as an end-capping group and BrU.47 The charge separation time from photoexcited APy to T was 0.55 ps, which decreased to 0.27 ps when BrU was located at the first or second neighbour of APy. The efficiency of the formation of reduced BrU, which is formed by accepting the excess electron after EET in DNA, was evaluated by HPLC or MALDI TOF mass spectroscopy. The distance dependence of the generation yield of the reduced product was obtained as shown in Fig. 5, in which the HT yield in Sa–An–Sd is also plotted. The plots were almost parallel to each other, supporting the hopping mechanism of the excess electron along DNA. These results are in accordance with those by Carell et al. and Rokita and Ito described in the former section.
 | ||
| Fig. 5 The distance dependence of the generation yield of the reduced product. The hole transport yield in Sa–An–Sd was also plotted. Reprinted with permission from literature.47 Copyright (2009) American Chemical Society. | ||
Wagenknecht and co-workers also investigated the excess electron injection process in DNA.48 In 2004, they reported the photoinduced process of pyrene-conjugated U and C (PydU and PydC, respectively).49,50 They showed that the excess electron injection in PydC was weak pH dependent (pH = 5 or 11), while the injection process in PydU was completely inhibited at higher pH. The weak pH dependence of PydC can be explained on the basis of the protonation of the C radical anion in the picosecond time-scale, even under a basic aqueous condition. The degree of the proton association to the C radical anion affected the charge recombination rate. By contrast, in the case of PydU, the relatively higher energy of Py˙+dU˙− than the pyrene excited state inhibited the formation of Py˙+dU˙−, and excited PydU then undergoes proton coupled electron transfer to form Py˙+dU(H)˙. The authors pointed out that the observed pH dependence is important to the EET in DNA, because the protonated C radical anion, which should be generated by its complement base G or surrounding water, will limit or terminate the EET in DNA. That is, the C radical anion cannot act as a charge carrier.
In a subsequent study in 2005, Wagenknecht and co-workers reported the EET in DNA using PTZ as the electron donor and BrU as the acceptor.51 The efficiency of the EET was evaluated according to the strand cleavage yield. They confirmed that the A:T base pairs transport the excess electron more efficiently than do G:C pairs due to protonation of the C radical anion. This result is consistent with that reported by Rokita and Ito described above.
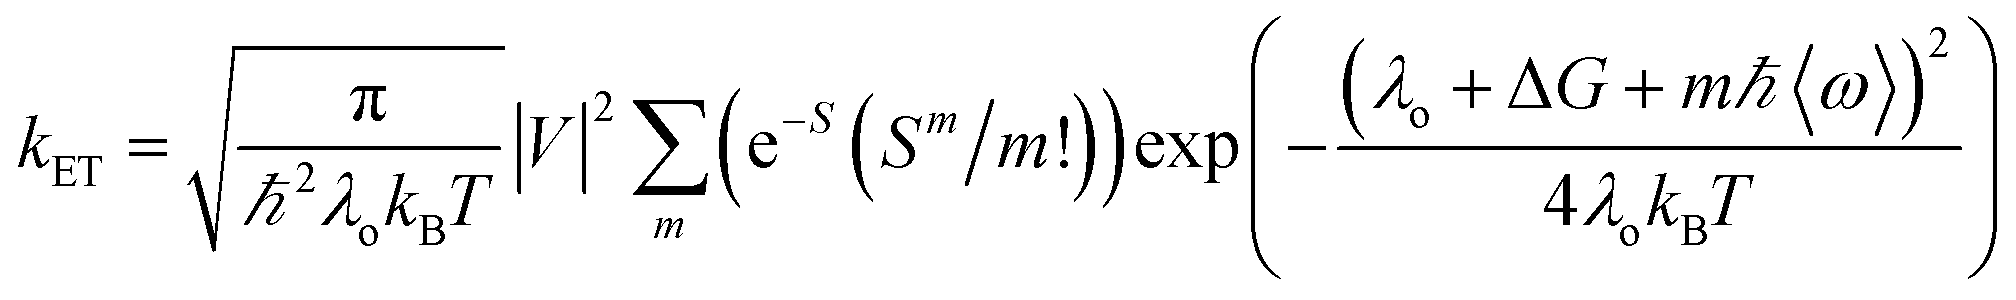
Our group has employed oligothiophenes as the photosensitizing electron donor for nucleobases, because the electron donor ability can be controlled by changing the substituents and number of repeating units. In addition, strong absorption bands in the radical cation state in the visible regions are good spectral markers for a transient absorption study. We investigated the charge-injection ability of oligothiophenes toward nucleobases using dyad systems, as indicated in Fig. 6.52,53 An ethylenedioxy-substituent was introduced to some oligothiophenes, because it has been reported that the oligomers of ethylenedioxythiophene (EDOT) showed higher electron donor-ability than those of non-substituted oligothiophenes.54 Charge injection from the singlet excited oligothiophenes to the nucleobases was indicated by the fluorescence quenching, and confirmed by the transient absorption measurements during femtosecond laser flash photolysis. The observed charge separation (CS) and recombination (CR) rates and corresponding driving forces (ΔGCS and ΔGCR) are summarized in Table 2. The results indicated that the CS rate becomes faster with an increase in the driving force, while the CR rate becomes slower, indicating that the CS and CR processes are in the normal and inverted regions of Marcus theory, respectively, as shown in eqn (1).22,23
 | (1) |
 | (2) |
 | (3) |
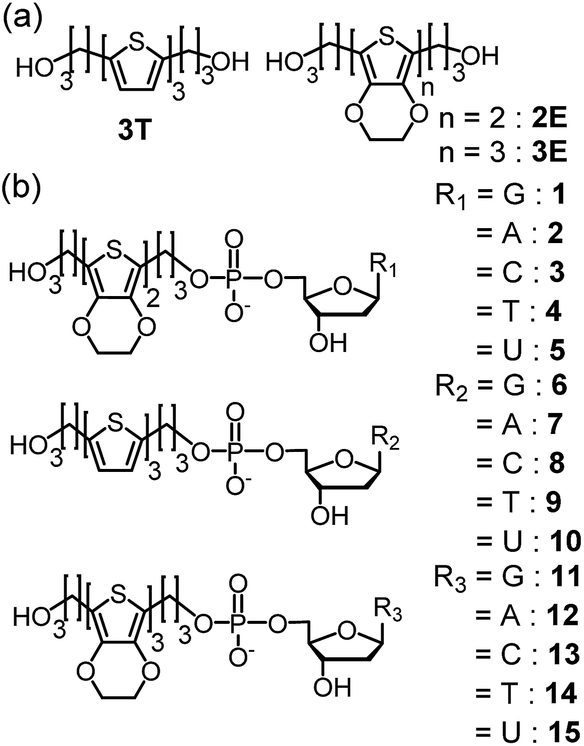 | ||
| Fig. 6 Structures of (a) 2E, 3T, and 3E, and (b) dyads 1–15. Reprinted with permission from literature.52 Copyright (2014) American Chemical Society. | ||
| −ΔGCSa (eV) | k CS (s−1) | −ΔGCRa (eV) | k CR (s−1) | |
|---|---|---|---|---|
| a ΔGCS and ΔGCR were calculated as indicated in literature.52 b Estimated error is less than 20%. c Estimated error is less than 10%. d Not observed. e Rate constant of the fast component. | ||||
| 1 | 0.01 | 6.4 × 10¹¹ | 3.63 | 1.1 × 10¹¹ |
| 2 | 0.32 | 1.0 × 10¹² | 3.32 | 6.7 × 10¹⁰ |
| 3 | 0.54 | 7.7 × 10¹¹ | 3.10 | 2.9 × 10¹¹ |
| 4 | 0.63 | 1.0 × 10¹² | 3.01 | 3.8 × 10¹¹ |
| 5 | 0.73 | 2.5 × 10¹² | 2.91 | 3.4 × 10¹¹ |
| 6 | −0.75 | —d | 3.93 | —d |
| 7 | −0.44 | —d | 3.62 | —d |
| 8 | −0.22 | 3.5 × 10¹⁰ | 3.40 | 6.5 × 10⁹ |
| 9 | −0.13 | 5.8 × 10¹⁰ | 3.31 | 6.5 × 10⁹ |
| 10 | −0.03 | 8.7 × 10¹⁰ | 3.21 | 7.3 × 10⁹ |
| 11 | −0.27 | —d | 3.39 | —d |
| 12 | 0.04 | 1.1 × 10¹¹ | 3.08 | 8.3 × 10¹⁰e |
| 13 | 0.26 | 1.1 × 10¹² | 2.86 | 2.8 × 10¹¹e |
| 14 | 0.35 | 1.8 × 10¹² | 2.77 | 3.7 × 10¹¹e |
| 15 | 0.45 | 2.0 × 10¹² | 2.67 | 3.7 × 10¹¹e |
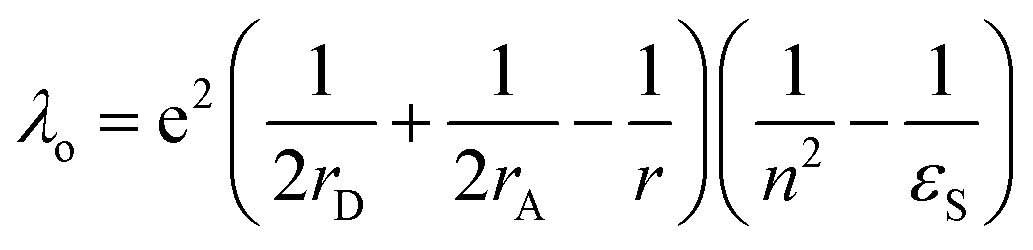
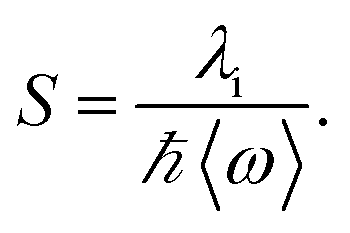
In eqn (1), λo is the outer sphere reorganization energy given by eqn (2), V is the electronic coupling, S is the electron-vibration coupling constant given by eqn (3), and 〈ω〉 is the averaged angular frequency. In eqn (2), n is the refractive index. In eqn (3), λi is the inner sphere reorganization energy. By applying the Marcus theory to the observed driving force dependence of rate constants, parameters such as V, λo, and λi were estimated to be 0.050, 0.20, and 1.10 eV, respectively (Fig. 7). Notably, for the hole injection process, these values have been reported to be 0.043, 0.23, and 0.99 eV, respectively.16 Thus, a similar total reorganization energy was confirmed for hole and excess electron injection. The slightly faster excess electron injection rate can be mainly attributed to the larger V value. These results confirm that the nucleobases act as electron acceptor when the appropriate photosensitizing electron donor is employed, although lots of chemists have paid attention to the oxidation process of nucleobases in relation to DNA damage, as discussed in the Introduction part.
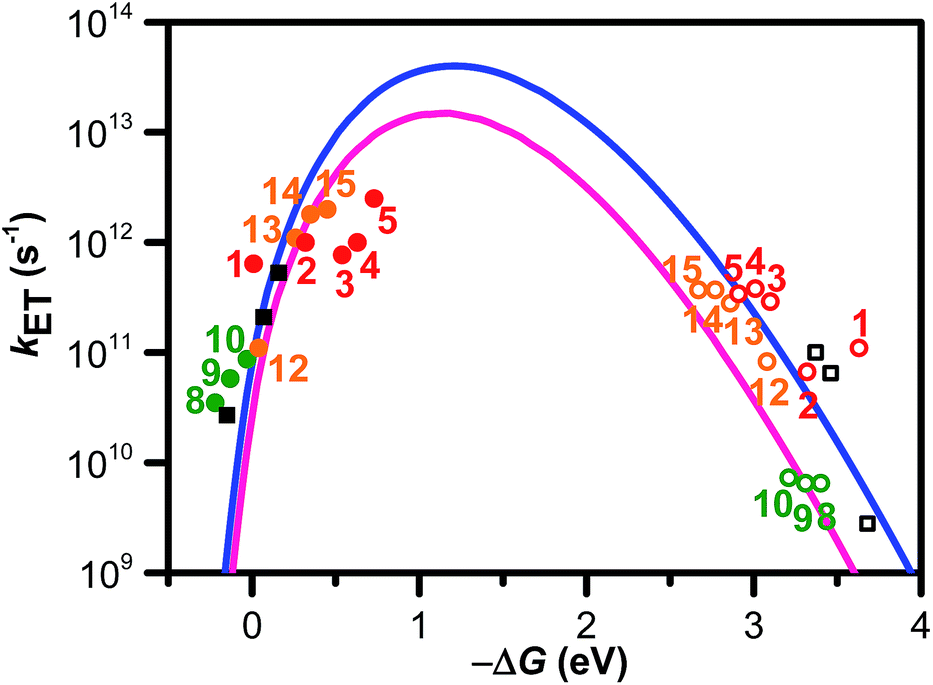 | ||
| Fig. 7 ΔG (ΔGCS and ΔGCR) dependence of kET (kCS ● and kCR ○). Numbers close to the marks indicate compounds. The solid and hollow black squares are the 2T dyads. The solid and hollow red circles are the dyads 1–5. The solid and hollow green circles are corresponded to the dyads 8–10. The solid and hollow orange circles are corresponded to the dyads 12–15. The solid blue line was calculated by eqn (1), (2), and (3) using λS, λV, V, and ħ〈ω〉 of 0.20, 1.10, 0.050, and 0.19 eV, respectively. The solid pink line was calculated using λS, λV, V, and ħ〈ω〉 of 0.23, 0.99, 0.043, and 0.19 eV, respectively. Reprinted with permission from literature.52 Copyright (2014) American Chemical Society. | ||
3.4 Direct evaluation of excess electron transfer dynamics in DNA
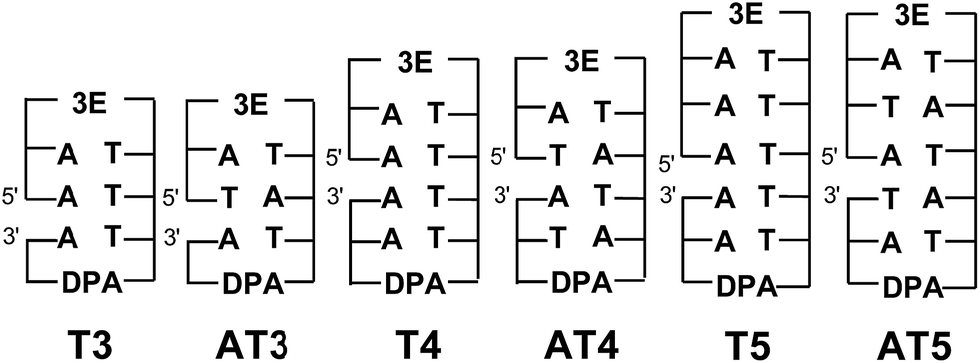
As summarized in the former sections, the excess electron injection process has been investigated by both product analysis and transient absorption spectroscopy. However, the EET process in DNA has mainly been studied using product analysis. As observed in studies of the HT process in DNA, a donor–DNA–acceptor system, of which the acceptor radical anion is detectable with transient absorption spectroscopy, will be useful for the detailed analysis of the EET process in DNA. From this perspective, our research group investigated the EET in DNA hairpin conjugated with N-methyl-N-aminoglycine (APy) and diphenylacetylene (DPA), as the photosensitizing electron donor and electron acceptor at the loop position, respectively.55 To enhance the generation yield of the DPA radical anion, dihydrothymine (DT), which acts as a barrier for rapid charge recombination,56 was inserted between APy and T. The generation of DPA radical anion was confirmed with nanosecond laser flash photolysis, indicating that the EET time should be shorter than 10 ns. It was confirmed that insertion of C in T's decreased the generation of DPA radical anion. Thus, discussion based on product analysis can also be assessed on the basis of the yield of DPA radical anion. Furthermore, it was confirmed that the excess electron could migrate even when APy and DPA were separated by 10 base pairs, i.e. 34 Å.In 2011, we investigated a series of donor–DNA–acceptor conjugates, in which thiophene tetramer (4T) was employed as a photosensitizing electron donor, for evaluation of the rate of single-step excess electron hopping among nucleobases.57 4T has certain advantages such as sufficient excited state oxidation potentials to reduce nucleobases and strong absorption bands upon oxidation, which can be distinguished from the excited state and radical anion of the electron acceptor, i.e., DPA.53 Furthermore, for the observation of the excess electron hopping process within the time window possible with our current instrument, rather short DNA dumbbells including a few nucleobases were examined (Fig. 8a). The formation of duplex structure was confirmed by means of the CD spectra and melting temperature measurements, and supported by molecular modelling.
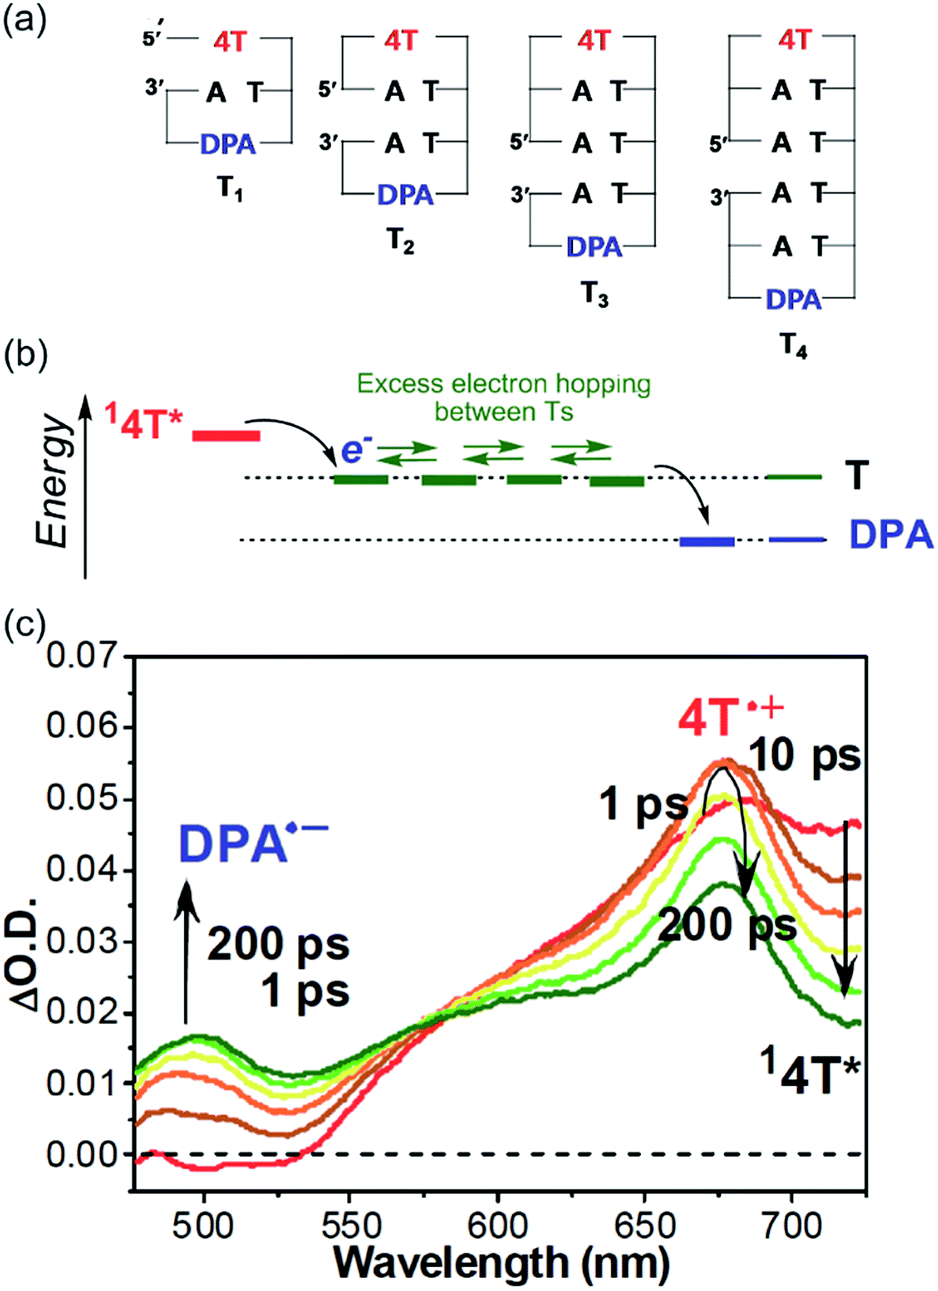 | ||
| Fig. 8 (a) Structures of dumbbell DNAs conjugated with 4T and DPA. (b) Expected energy diagram. (c) Transient absorption spectra of T3 during the laser flash photolysis using 400 nm femtosecond laser pulse. Reprinted with permission from literature.57 Copyright (2011) American Chemical Society. | ||
The transient absorption spectra of the dumbbell DNA T3, obtained by selective excitation of 4T with a 400 nm femtosecond laser pulse, are indicated in Fig. 8. Immediately after the laser pulse, the singlet excited 4T was observed. With the decay of the singlet excited 4T, the generation of the radical cation of 4T was confirmed, indicating the excess electron injection from the singlet excited 4T within 10 ps. However, the generation of the DPA radical anion exhibited a two-step rising profile. The rising rate of the faster component was the same as decay rate of the singlet excited 4T, while the slow component reached maximal absorbance about 200 ps after the laser pulse excitation. The fast component can be attributed to the single-step charge separation between singlet excited 4T and DPA, whereas the slow component can be attributed to the formation of DPA radical anion by the excess electron after hopping through the T tract (Fig. 8b). Moreover, the generation rate of DPA radical anion by the EET process became slower with increasing number of T's between 4T and DPA, supporting the generation of DPA radical anion by excess electron hopping in DNA. By applying a one-dimensional random walk model, the T-to-T hopping rate in consecutive T's was determined to be 4.4 × 10¹⁰ s−1. As described above, Lewis et al. reported that the single-step hopping rate of HT was 4.3 × 10⁹ and 1.2 × 10⁹ s−1 for G-to-G and A-to-A, respectively.19 Our research group found that the A-to-A hopping rate was 2 × 10¹⁰ s−1.58 Therefore, it became clear that the hopping rate of the excess electron among consecutive T's is faster than the hole hopping rate among A's and G's.
In addition to the nicked-dumbbell DNA, we confirmed the EET in DNA hairpin, in which DPA was placed at the loop position and N,N′-dimethylaminopyrene (APy′), a photosensitizing electron donor, was attached at the 5′ end.59 In this case, the EET dynamics indicated that APy′ did not behave as an end-capping group but rather seems to be intercalated between two terminal base pairs; Lewis et al. confirmed a similar structure with 5′-pyrenecarboxamide tethered DNA.60 The T-to-T hopping rate was estimated to be 6.1 × 10¹⁰ s−1, which is slightly larger than the value estimated with the above mentioned nicked-dumbbell DNA, but the hopping rate on the order of 1010 s−1 was confirmed.
3.5 T-to-T hopping rate depends on the driving force for charge injection
As introduced in the former section, we have clarified the T-to-T hopping rate by studying donor–DNA–acceptor systems. As a photosensitizing electron donor, we employed 4T and APy′ as discussed in the previous section, which provided T-to-T hopping rates of 4.4 × 10¹⁰ and 6.1 × 10¹⁰ s−1, respectively. Our further studies using a trimer and dimer of EDOT (3E and 2E, respectively) as the photosensitizing electron donor yielded T-to-T hopping rates of 2.2 × 10¹¹ and 2.6 × 10¹¹ s−1, respectively.61 Thus, the reported EET rate constants for consecutive T's are in the range of 1010 to 1011 s−1 depending on the photosensitizing electron donors (Table 3), which provided various driving forces for excess-electron injection to DNA. It was confirmed that a larger driving force for excess electron injection results in a faster T-to-T hopping rate. In fact, a nearly linear relationship was confirmed between the T-to-T hopping rate and driving force for excess electron injection (Fig. 9). The intercept of the linear fit ((3.8 ± 1.5) × 1010 s−1) should correspond to the hopping rate for a non-energy assisted (ΔGCS = 0) EET in DNA, i.e., the intrinsic hopping rate. Interestingly, the intrinsic hopping rate agrees with the reported value for the DNA sugar backbone and base motions, which occur with periods as short as 30 ps at 303 K,62,63 suggesting that the excess-electron hopping is likely dominated by the structural dynamics of DNA.| Sequence | Donor | k hop/s−1 | Note |
|---|---|---|---|
| T–T | 4T | 4.4 × 10¹⁰ | Intrastrand T-to-T |
| APy′ | 6.1 × 10¹⁰ | Intrastrand T-to-T | |
| 3E | 2.2 × 10¹¹ | Intrastrand T-to-T | |
| 2E | 2.6 × 10¹¹ | Intrastrand T-to-T | |
| T–A–T | 3E | 1.1 × 10¹¹ | Interstrand T-to-T |
| T–C–T | 3E | 1 × 10¹¹ | Assuming C as an excess electron carrier |
| 3E | 4.9 × 10¹⁰ | Assuming intrastrand T-to-T tunneling |
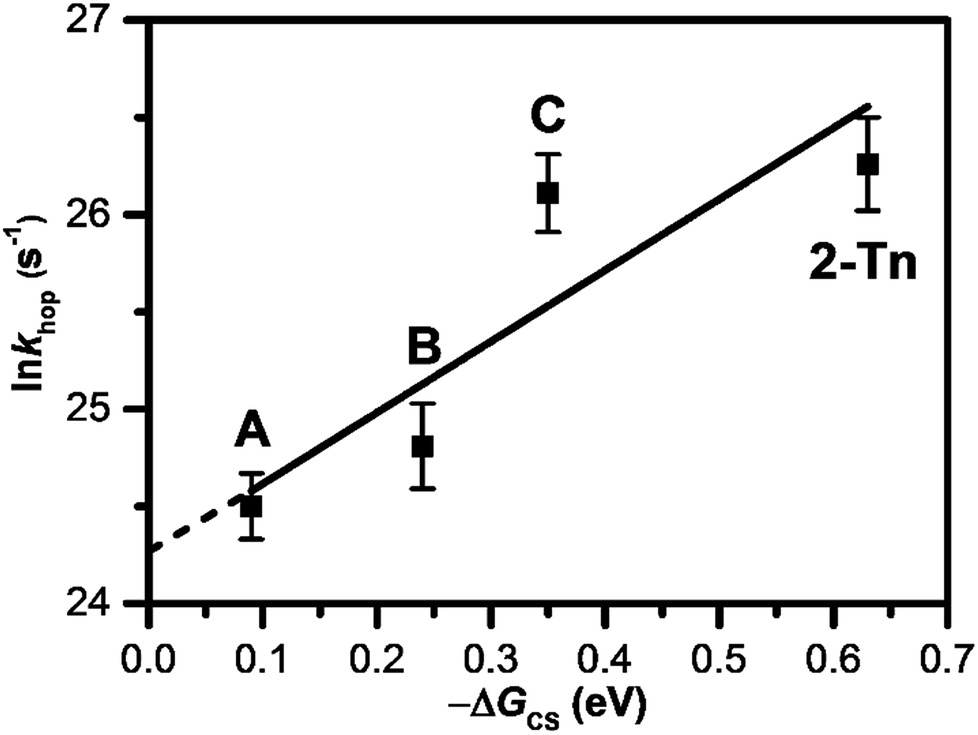 | ||
| Fig. 9 Dependence of lnkhop on −ΔGCS. A, B, C, and 2-Tn were estimated from DNA conjugated with 4T, APy′, 3E, and 2E, respectively, as a photosensitizing electron donor. Reprinted with permission from literature.61 Copyright (2016) American Chemical Society. | ||
3.6 T-to-T hopping rate in an alternating A–T sequence
Excess electrons should migrate through the LUMOs of C or T in DNA due to their relatively high reduction potentials in DNA. According to the results of product analysis, EET has been confirmed to be a sequence-dependent process. Furthermore, it was confirmed that the protonated C radical anion will limit or terminate EET, as discussed in the next section in more detail. Thus, T should contribute to EET significantly. Several groups, including our own, have reported the dynamics of intrastrand EET in DNA through A:T sequences; however, investigations on interstrand EET in alternating A:T sequences in DNA, in which the interaction between the LUMOs of T's does not exist, are still limited. For example, Carell and co-workers reported an interstrand EET in PNA:DNA double strands based on product analysis.38 Their qualitative results showed that an interstrand EET can efficiently proceed in PNA:DNA double strands, indicating that the EET in PNA:DNA is somewhat influenced by the specific stacking situation. By contrast, for interstrand HT in DNA, Lewis's group reported that the efficiency of interstrand HT in DNA is lower than that of intrastrand HT by a factor of 4, due to the lack of interaction between the HOMOs of A's, based on femtosecond laser flash photolysis studies.66 We obtained similar results using nanosecond laser flash photolysis in our previous report.18 Thus, direct measurement of the dynamics of EET in DNA by laser flash photolysis is essential to achieve a quantitative understanding of interstrand EET. Here, two series of functionalized DNA oligomers, Tn and ATn, were synthesized with a strong electron-donating photosensitizer (3E) and an electron acceptor (DPA) (Fig. 10).64 Transient absorption measurements during femtosecond laser flash photolysis of ATn showed the generation of DPA˙− for AT3, whereas AT4 and AT5 did not result in the generation of DPA˙−. The absence of DPA˙− can be attributed to the fast CR between 3E˙+ and DNA˙−. For AT3 and T3, the generation of 3E˙+–DNA–DPA˙− was confirmed, indicating that the inter- and intrastrand EET is strongly limited by the CR rate. By applying the random walk model, the inter- and intrastrand excess electron hopping rates were determined. It was confirmed that the EET rate constant of AT3 (1.1 × 10¹¹ s−1) is 2-times lower than that of T3 (2.2 × 10¹¹ s−1). The slower EET rate for intrastrand EET can be attributed to the lack of π-stacking of T's in AT3. Thus, these results indicated that excess electron hopping is affected by the interaction between the LUMOs of nucleotides.
 | ||
| Fig. 10 Structures of DNA oligomers. The gap between the 5′ and 3′ indicates a missing phosphate linker between two nucleotides in nicked dumbbell structure. Reprinted with permission from literature.64 Copyright (2015) John Wiley and Sons. | ||
3.7 Effect of G and C
It has also been noted that pH affects the dynamics of EET in DNA. This is because the protonated C radical anion, which can be generated by proton transfer from the complementary base, G, or from surrounding water molecules, will limit or terminate EET.30,44,50,51,67 Steenken and co-workers proposed a proton-transfer reaction pathway for the G:C base pair radical anion (G:C˙− base pair) as shown in Fig. 11,68,69 which is a thermodynamically favourable process and has been supported by various experimental70,71 and theoretical studies.72–74 Although the rate constant of proton transfer in G:C˙− base pairs (kPT) was theoretically calculated to be 1011 s−1,75 it has not been determined directly. Furthermore, limited information is available for the effect of G:C base pairs on EET dynamics. To clarify the dynamics of EET in DNA, a femtosecond laser flash photolysis study of a donor–DNA–acceptor system was carried out (Fig. 12).65 In the transient absorption spectra of C4, the transient absorption band at 580 nm, which can be attributed to G(−H)−:C(H)˙, the product of the proton-transfer reaction of G:C˙− base pairs, was observed as well as 3E˙+. From the global analysis, the proton transfer rate was estimated to be 2.6 × 10¹⁰ s−1, which agreed with the theoretical estimation.76 In addition, generation of DPA was not confirmed with C3 and C4, indicating that multiple C's completely terminated the EET in DNA.
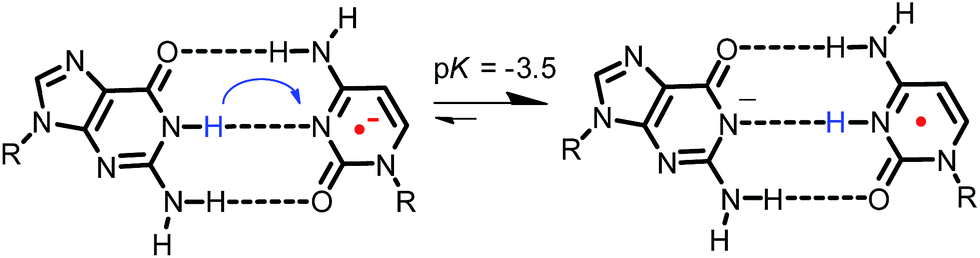 | ||
| Fig. 11 Proposed proton-transfer reaction pathway for G:C˙− base pair. Reprinted with permission from literature.65 Copyright (2015) American Chemical Society. | ||
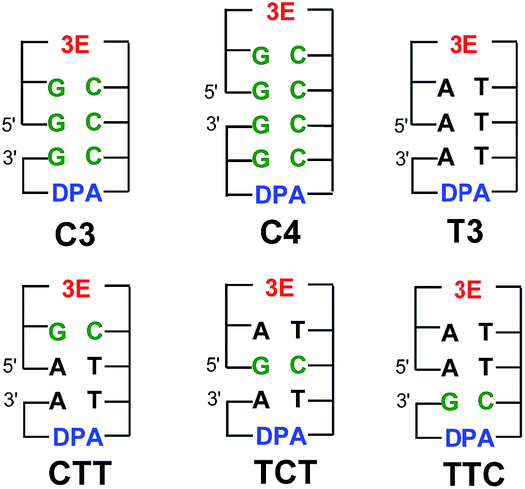 | ||
| Fig. 12 Structures of 3E, DPA, and DNA oligomers (C3, C4, T3, CTT, TCT, and TTC). The gap between the 5′ and 3′ indicates a missing phosphate linker between two nucleobases in nicked dumbbell structure. Reprinted with permission from literature.65 Copyright (2015) American Chemical Society. | ||
Notably, the generation of DPA˙− was confirmed from analysis of the transient absorption spectra of CTT, TCT, and TTC, indicating that the single G:C pair in T's cannot completely terminate the EET. The intervening G:C base pair in the consecutive T's reduced the kET value to ∼50%, regardless of the position of the G:C base pair in the DNA oligomers. In addition, the yield of the formation of DPA˙− with respect to the initial 3E˙+ generation showed a decrease of ∼30% in CTT, TCT, and TTC. As a role of C in EET, two possibilities are pointed out: (1) C acts as excess electron carrier and (2) C acts as a barrier for excess electron (Table 3).
3.8 Detection of long range EET by electrochemical method
Because of the rapid CR, long-range EET through DNA has been difficult to confirm with laser flash photolysis study of donor–DNA–acceptor systems. Therefore, to observe long-range EET through DNA we employed electrophotochemical systems using donor–DNA–Au gold systems.77 In this system, photoexcitation of 3E yielded a charge separated state, i.e., excess-electron injection from the singlet excited 3E, 13E*, to T. The injected excess-electron migrated through T and was then trapped by the Au electrode to yield a photocurrent. 3E˙+ was reduced by ascorbic acid, AA, as an electron-donating sacrifice, to regenerate 3E. The redox levels of the components are presented in Fig. 13. The significant sequence dependence of photocurrent generation suggests that T-to-T hopping is a dominant mechanism for EET in DNA. Using this system, we confirmed EET through DNA up to 40.8 Å. We further confirmed the sequence dependence of the process, as shown in Fig. 14. From the experiments on DNAs with an alternating A:T sequence and consecutive G:C sequence, the hopping models described in the sections above were supported.
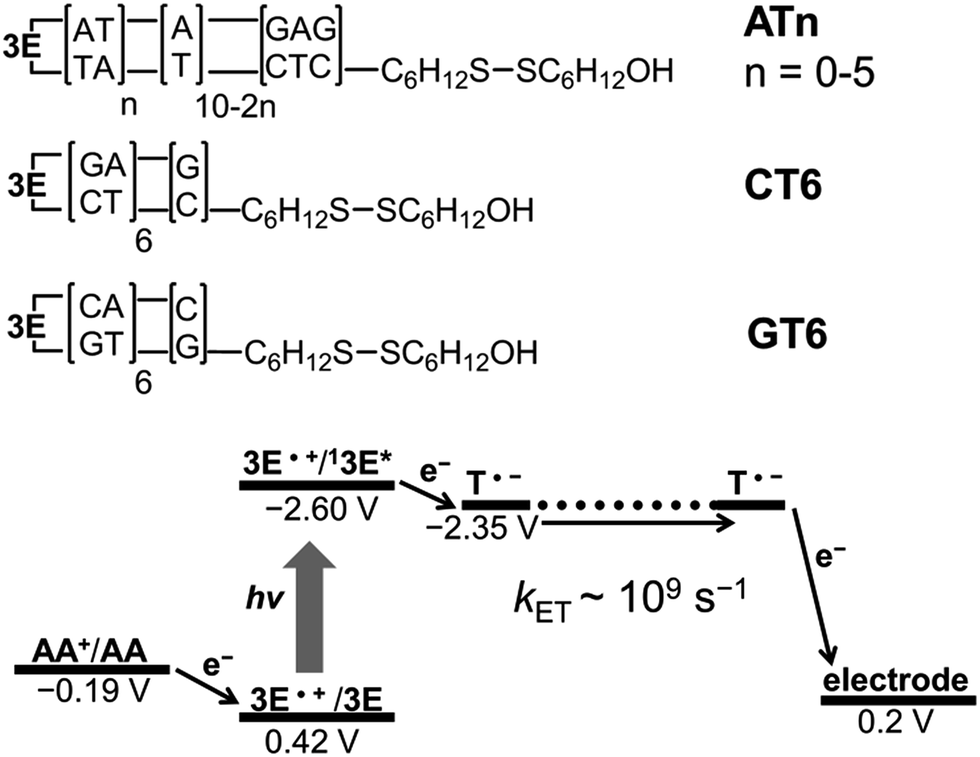 | ||
| Fig. 13 DNA sequences and energetic diagram of photocurrent generation of DNA-modified Au electrode in the presence of ascorbic acid (AA). Potential versus Ag/AgCl. Reprinted with permission from literature.77 Copyright (2016) John Wiley and Sons. | ||
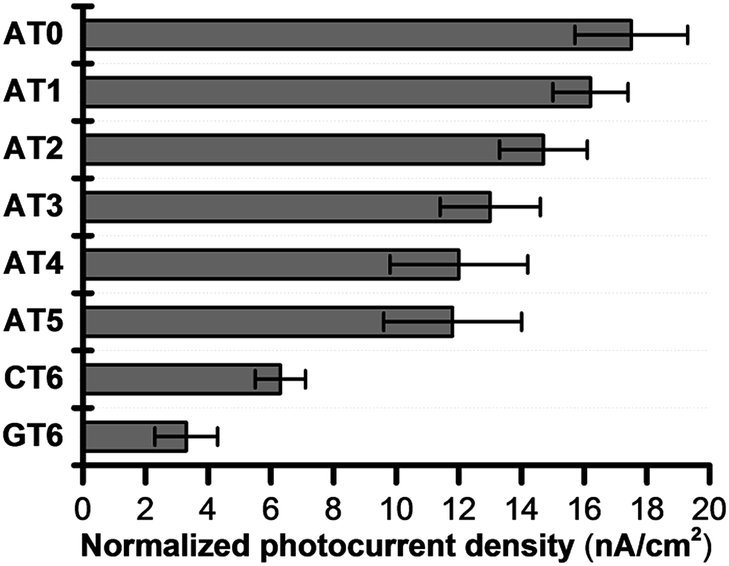 | ||
| Fig. 14 Normalized photocurrent density of DNA-modified electrode. Error bars represent the standard deviation from five experiments. Reprinted with permission from literature.77 Copyright (2016) John Wiley and Sons. | ||
4. Conclusions and remarks
In this perspective article, the EET in DNA were summarized and a brief summary of the HT process was provided. Compared to HT in DNA, our understanding of the EET process is still limited, although the results of recent detailed investigations have clarified various aspects of EET. The following questions point out examples of unknown issues about EET in DNA: (1) how do multiple nucleobase insertions (i.e., G's between T's) alter the EET hopping rate? We have already pointed out that single C between T's does not terminate EET, but multiple C's can terminate. How about G? (2) How far can the excess electron migrate? In laser flash photolysis experiment, fast CR limits the EET distance. But as indicated by the photoelectrochemical method, excess electron potentially migrates over several tens angstrom. Is EET over hundred angstrom possible? (3) To what extent do mismatches change the EET hopping rate? Is the mismatch effect similar to that for HT? (4) What effect does DNA conformation, such as, A, B, C, and Z, have on the EET rate? (5) What effect does protein association have on EET in DNA? For example, would the EET rate in the chromosomes in cellular nucleus be faster or not? This point should be essential in DNA damage and repair in cell as indicated by the electrochemical studies.78,79 These questions are fundamental for EET in DNA. We hope that the detailed processes of EET in DNA will be clarified in the near future.Note added after first publication
This article replaces the version published on 23rd December 2016, in which incorrect contact details for the first author were presented through editorial error.Acknowledgements
We are grateful to a number of collaborators, especially Prof. Kiyohiko Kawai, Prof. Takashi Tachikawa, Dr Man Jae Park and Dr Shih-Hsun Lin, SANKEN, Osaka University. This work has been partly supported by a Grant-in-Aid for Scientific Research (Projects 25220806, 25288035, and others) from the Ministry of Education, Culture, Sports, Science and Technology (MEXT) of Japanese Government.References
- C. J. Burrows and J. G. Muller, Chem. Rev., 1998, 98, 1109 CrossRef CAS PubMed.
- B. Armitage, Chem. Rev., 1998, 98, 1171 CrossRef CAS PubMed.
- T. Carell, Angew. Chem., Int. Ed. Engl., 1995, 34, 2491 CrossRef CAS.
- A. Sancar, Biochemistry, 1994, 33, 2 CrossRef CAS PubMed.
- J. S. Taylor, Acc. Chem. Res., 1994, 27, 76 CrossRef CAS.
- D. D. Eley and D. I. Spivey, Trans. Faraday Soc., 1962, 58, 411 RSC.
- H.-W. Fink and C. Schonenberger, Nature, 1999, 398, 407 CrossRef CAS PubMed.
- D. Porath, A. Bezryadin, S. de Vries and C. Dekker, Nature, 2000, 403, 635 CrossRef CAS PubMed.
- S. Priyadarshy, S. M. Risser and D. N. Beratan, J. Phys. Chem., 1996, 100, 17678 CrossRef CAS.
- M. Taniguchi and T. Kawai, Phys. E., 2006, 33, 1 CrossRef CAS.
- B. Giese, Acc. Chem. Res., 2000, 33, 631 CrossRef CAS PubMed.
- B. Giese, J. Amaudrut, A.-K. Kohler, M. Spormann and S. Wessely, Nature, 2001, 412, 318 CrossRef CAS PubMed.
- M. Fujitsuka and T. Majima, Phys. Chem. Chem. Phys., 2012, 14, 11234 RSC.
- F. D. Lewis, T. Wu, Y. Zhang, R. L. Letsinger, S. R. Greenfield and M. R. Wasielewski, Science, 1997, 277, 673 CrossRef CAS PubMed.
- F. D. Lewis, T. Wu, X. Liu, R. L. Letsinger, S. R. Greenfield, S. E. Miller and M. R. Wasielewski, J. Am. Chem. Soc., 2000, 122, 2889 CrossRef CAS.
- F. D. Lewis, R. S. Kalgutkar, Y. Wu, X. Liu, J. Liu, R. T. Hayes, S. E. Miller and M. R. Wasielewski, J. Am. Chem. Soc., 2000, 122, 12346 CrossRef CAS.
- K. Kawai, T. Takada, S. Tojo, N. Ichinose and T. Majima, J. Am. Chem. Soc., 2001, 123, 12688 CrossRef CAS PubMed.
- T. Takada, K. Kawai, X. Cai, A. Sugimoto, M. Fujitsuka and T. Majima, J. Am. Chem. Soc., 2004, 126, 1125 CrossRef CAS PubMed.
- S. M. M. Conron, A. K. Thazhathveetil, M. R. Wasielewski, A. L. Burin and F. D. Lewis, J. Am. Chem. Soc., 2010, 132, 14388 CrossRef CAS PubMed.
- T. Takada, K. Kawai, M. Fujitsuka and T. Majima, Chem.–Eur. J., 2005, 11, 3835 CrossRef CAS PubMed.
- Y. Osakada, K. Kawai, M. Fujitsuka and T. Majima, Proc. Natl. Acad. Sci. U. S. A., 2006, 103, 18072 CrossRef CAS PubMed.
- R. A. Marcus, Annu. Rev. Phys. Chem., 1964, 15, 144 CrossRef.
- R. A. Marcus and N. Sutin, Biochim. Biophys. Acta, Rev. Bioenerg., 1985, 811, 265 CrossRef CAS.
- T. Takada, M. Fujitsuka and T. Majima, Proc. Natl. Acad. Sci. U. S. A., 2007, 104, 11179 CrossRef CAS PubMed.
- T. Takada, Y. Takeda, M. Fujitsuka and T. Majima, J. Am. Chem. Soc., 2009, 131, 6656 CrossRef CAS PubMed.
- T. Tachikawa, Y. Asanoi, K. Kawai, S. Tojo, A. Sugimoto, M. Fujitsuka and T. Majima, Chem.–Eur. J., 2008, 14, 1492 CrossRef CAS PubMed.
- C. A. M. Seidel, A. Schulz and M. H. M. Sauer, J. Phys. Chem., 1996, 100, 5541 CrossRef CAS.
- A. Messer, K. Carpenter, K. Forzley, J. Buchanan, S. Yang, Y. Razskazovskii, Z. Cai and M. D. Sevilla, J. Phys. Chem. B, 2000, 104, 1128 CrossRef CAS.
- Z. Cai, Z. Gu and M. D. Sevilla, J. Phys. Chem. B, 2000, 104, 10406 CrossRef CAS.
- Z. Cai, X. Li and M. D. Sevilla, J. Phys. Chem. B, 2002, 106, 2755 CrossRef CAS.
- M. Fujitsuka and T. Majima, J. Phys. Chem. Lett., 2011, 2, 2965 CrossRef CAS.
- R. Yamagami, K. Kobayashi and S. Tagawa, Chem.–Eur. J., 2009, 15, 12201 CrossRef CAS PubMed.
- K. Kawai, T. Kimura, K. Kawabata, S. Tojo and T. Majima, J. Phys. Chem. B, 2003, 107, 12838 CrossRef CAS.
- C. Behrens, L. T. Burgdorf, A. Schwogler and T. Carell, Angew. Chem., Int. Ed., 2002, 41, 1763 CrossRef CAS PubMed.
- C. Behrens, M. Ober and T. Carell, Eur. J. Org. Chem., 2002, 3281 CrossRef CAS.
- C. Behrens and T. Carell, Chem. Commun., 2003, 1632 RSC.
- S. Breeger, U. Hennecke and T. Carell, J. Am. Chem. Soc., 2004, 126, 1302 CrossRef CAS PubMed.
- M. K. Cichon, C. H. Haas, F. Grolle, A. Mees and T. Carell, J. Am. Chem. Soc., 2002, 124, 13984 CrossRef CAS PubMed.
- C. Haas, K. Kraeling, M. Cichon, N. Rahe and T. Carell, Angew. Chem., Int. Ed., 2004, 43, 1842 CrossRef CAS PubMed.
- A. Manetto, S. Breeger, C. Chatgilialoglu and T. Carell, Angew. Chem., Int. Ed., 2006, 45, 318 CrossRef CAS PubMed.
- D. Fazio, C. Trindler, K. Heil, C. Chatgilialoglu and T. Carell, Chem.–Eur. J., 2011, 17, 206 CrossRef CAS PubMed.
- S. Breeger, M. von Meltzer, U. Hennecke and T. Carell, Chem.–Eur. J., 2006, 12, 6469 CrossRef CAS PubMed.
- T. Ito and S. E. Rokita, J. Am. Chem. Soc., 2003, 125, 11480 CrossRef CAS PubMed.
- T. Ito and S. E. Rokita, Angew. Chem., Int. Ed., 2004, 43, 1839 CrossRef CAS PubMed.
- F. D. Lewis, X. Liu, Y. Wu, S. E. Miller, M. R. Wasielewski, R. L. Letsinger, R. Sanishvili, A. Joachimiak, V. Tereshko and M. Egli, J. Am. Chem. Soc., 1999, 121, 9905 CrossRef CAS.
- F. D. Lewis, X. Liu, S. E. Miller, R. T. Hayes and M. R. Wasielewski, J. Am. Chem. Soc., 2002, 124, 11280 CrossRef CAS PubMed.
- P. Daublain, A. K. Thazhathveetil, Q. Wang, A. Trifonov, T. Fiebig and F. D. Lewis, J. Am. Chem. Soc., 2009, 131, 16790 CrossRef CAS.
- H.-A. Wagenknecht, Angew. Chem., Int. Ed., 2003, 42, 2454 CrossRef CAS PubMed.
- N. Amann, E. Pandurski, T. Fiebig and H.-A. Wagenknecht, Chem.–Eur. J., 2002, 8, 4877 CrossRef CAS.
- M. Raytchev, E. Mayer, N. Amann, H.-A. Wagenknecht and T. Fiebig, ChemPhysChem, 2004, 5, 706 CrossRef CAS PubMed.
- C. Wagner and H.-A. Wagenknecht, Chem.–Eur. J., 2005, 11, 1871 CrossRef CAS PubMed.
- S.-H. Lin, M. Fujitsuka, M. Ishikawa and T. Majima, J. Phys. Chem. B, 2014, 118, 12186 CrossRef CAS PubMed.
- M. J. Park, M. Fujitsuka, K. Kawai and T. Majima, Chem.–Eur. J., 2012, 18, 2056 CrossRef CAS PubMed.
- M. Turbiez, P. Frère and J. Roncali, J. Org. Chem., 2003, 68, 5357 CrossRef CAS PubMed.
- K. Tainaka, M. Fujitsuka, T. Takada, K. Kawai and T. Majima, J. Phys. Chem. B, 2010, 114, 14657 CrossRef CAS PubMed.
- J. N. Wilson, Y. Cho, S. Tan, A. Cuppoletti and E. T. Kool, ChemBioChem, 2008, 9, 279 CrossRef CAS PubMed.
- M. J. Park, M. Fujitsuka, K. Kawai and T. Majima, J. Am. Chem. Soc., 2011, 133, 15320 CrossRef CAS PubMed.
- T. Takada, K. Kawai, M. Fujitsuka and T. Majima, J. Am. Chem. Soc., 2006, 128, 11012 CrossRef CAS PubMed.
- M. J. Park, M. Fujitsuka, H. Nishitera, K. Kawai and T. Majima, Chem. Commun., 2012, 48, 11008 RSC.
- K. Siegmund, P. Daublain, Q. Wang, A. Trifonov, T. Fiebig and F. D. Lewis, J. Phys. Chem. B, 2009, 113, 16276 CrossRef CAS PubMed.
- S.-H. Lin, M. Fujitsuka and T. Majima, J. Phys. Chem. B, 2016, 120, 660 CrossRef CAS PubMed.
- G. B. Schuster, Acc. Chem. Res., 2000, 33, 253 CrossRef CAS PubMed.
- P. N. Borer, S. R. LaPlante, A. Kumar, N. Zanatta, A. Martin, A. Hakkinen and G. C. Levy, Biochemistry, 1994, 33, 2441 CrossRef CAS PubMed.
- S.-H. Lin, M. Fujitsuka and T. Majima, Chem.–Eur. J., 2015, 21, 16190 CrossRef CAS PubMed.
- S.-H. Lin, M. Fujitsuka and T. Majima, J. Phys. Chem. B, 2015, 119, 7994 CrossRef CAS PubMed.
- F. D. Lewis, P. Daublain, B. Cohen, J. Vura-Weis, V. Shafirovich and M. R. Wasielewski, J. Am. Chem. Soc., 2007, 129, 15130 CrossRef CAS PubMed.
- R. Huber, T. Fiebig and H.-A. Wagenknecht, Chem. Commun., 2003, 1878 RSC.
- S. Steenken, J. P. Telo, H. M. Novais and L. P. Candeias, J. Am. Chem. Soc., 1992, 114, 4701 CrossRef CAS.
- S. Steenken, Chem. Rev., 1989, 89, 503 CrossRef CAS.
- R. Yamagami, K. Kobayashi and S. Tagawa, J. Am. Chem. Soc., 2008, 130, 14772 CrossRef CAS PubMed.
- A. Szyperska, J. Rak, J. Leszczynski, X. Li, Y. J. Ko, H. Wang and K. H. Bowen, ChemPhysChem, 2010, 11, 880 CrossRef CAS PubMed.
- X. Li, Z. Cai and M. D. Sevilla, J. Phys. Chem. B, 2001, 105, 10115 CrossRef CAS.
- N. A. Richardson, S. S. Wesolowski and H. F. Schaefer, J. Am. Chem. Soc., 2002, 124, 10163 CrossRef CAS PubMed.
- A. Gupta, H. M. Jaeger, K. R. Compaan and H. F. Schaefer, J. Phys. Chem. B, 2012, 116, 5579 CrossRef CAS PubMed.
- H.-Y. Chen, C.-L. Kao and S. C. N. Hsu, J. Am. Chem. Soc., 2009, 131, 15930 CrossRef CAS PubMed.
- S. C. N. Hsu, T.-P. Wang, C.-L. Kao, H.-F. Chen, P.-Y. Yang and H.-Y. Chen, J. Phys. Chem. B, 2013, 117, 2096 CrossRef CAS PubMed.
- S.-H. Lin, M. Fujitsuka and T. Majima, Angew. Chem., Int. Ed., 2016, 55, 8715 CrossRef CAS PubMed.
- M. A. Grodick, N. B. Muren and J. K. Barton, Biochemistry, 2015, 54, 962 CrossRef CAS PubMed.
- A. R. Arnold, M. A. Grodick and J. K. Barton, Cell Chem. Biol., 2016, 23, 183 CrossRef CAS PubMed.
| This journal is © The Royal Society of Chemistry 2017 |