
 Open Access Article
 This Open Access Article is licensed under a
 Creative Commons Attribution 3.0 Unported Licence
Luminescent ion pairs with tunable emission colors for light-emitting devices and electrochromic switches†
Song
Guo‡
a,
Tianci
Huang‡
a,
Shujuan
Liu
a,
Kenneth Yin
Zhang
a,
Huiran
Yang
a,
Jianmei
Han
a,
Qiang
Zhao
*a and
Wei
Huang
*ab
aKey Laboratory for Organic Electronics and Information Displays and Institute of Advanced Materials (IAM), Jiangsu National Synergetic Innovation Center for Advanced Materials (SICAM), Nanjing University of Posts and Telecommunications (NUPT), Nanjing 210023, P. R. China. E-mail: iamqzhao@njupt.edu.cn
bKey Laboratory of Flexible Electronics (KLOFE) and Institute of Advanced Materials (IAM), Jiangsu National Synergetic Innovation Center for Advanced Materials (SICAM), Nanjing Tech University (NanjingTech), Nanjing 211816, P. R. China. E-mail: wei-huang@njtech.edu.cn
First published on 15th August 2016
Abstract
Most recently, stimuli-responsive luminescent materials have attracted increasing interest because they can exhibit tunable emissive properties which are sensitive to external physical stimuli, such as light, temperature, force, and electric field. Among these stimuli, electric field is an important external stimulus. However, examples of electrochromic luminescent materials that exhibit emission color change induced by an electric field are limited. Herein, we have proposed a new strategy to develop electrochromic luminescent materials based on luminescent ion pairs. Six tunable emissive ion pairs (IP1–IP6) based on iridium(III) complexes have been designed and synthesized. The emission spectra of ion pairs (IPs) show concentration dependence and the energy transfer process is very efficient between positive and negative ions. Interestingly, IP6 displayed white emission at a certain concentration in solution or solid state. Thus, in this contribution, UV-chip (365 nm) excited light-emitting diodes showing orange, light yellow and white emission colors were successfully fabricated. Furthermore, IPs displayed tunable and reversible electrochromic luminescence. For example, upon applying a voltage of 3 V onto the electrodes, the emission color of the solution of IP1 near the anode or cathode changed from yellow to red or green, respectively. Color tunable electrochromic luminescence has also been realized by using other IPs. Finally, a solid-film electrochromic switch device with a sandwiched structure using IP1 has been fabricated successfully, which exhibited fast and reversible emission color change.
Introduction
Luminescent materials have attracted considerable attention because of their wide applications in displays, data recording and storage, chemical sensing, bioimaging, etc.1–9 Emissive materials with tunable luminescence colors are of great significance for their optical applications. Up to now, conventional methods for tuning the photophysical properties of luminescent materials are mainly limited to the modification of the chemical structures, such as the change of π-conjugation skeletons or the introduction of functional groups.10–21 However, this method often requires complicated synthetic processes and tedious purification procedures. Stimuli-responsive luminescent materials have attracted increasing interest, because they can exhibit tunable emissive properties which are sensitive to external physical stimuli, such as light, temperature, force, electric field, etc.22–28 Among these stimuli, electric field is an important external stimulus, which can be conveniently combined with the current semiconductor technology in electronic devices.29–33 Recently, electrochromic luminescent materials that exhibited emission color changing induced by an electric field have been reported (Fig. 1a). For example, Chidichimo and co-workers have presented π-conjugated ionic liquid crystals in which the direct electrochemical reduction leads to a reversible electrochromic luminescence (ECL) response.34 Beneduci and co-workers have shown an ECL-active polymer gel based on the conversion of the redox states, in which the emission properties of the polymer depend on the fluorophore contents and the voltages applied.35 We have also reported a series of phosphorescent iridium(III) complexes containing a protonating functional group, which exhibited evident emission color change induced by an electric field.36–38 However, special functional groups, such as redox active or protonating groups, in these electrochromic luminescent materials may reduce their stability, especially toward redox reagents and pH values. Therefore, it is urgent to explore a new generation of electrochromic luminescent materials with controllable emission colour change. | ||
| Fig. 1 (a) The design principles of electrochromic luminescent materials. (b) The structures of six ion pairs. (c) Luminescence spectra of IP1 at different concentrations in acetonitrile. (d) Absorption and luminescence spectra of C1Cl and n-Bu4NA1 (10−5 M). (e) Stern–Volmer plot of the quenching study between C1Cl and n-Bu4NA1 and the numerical fitting of Kq. | ||
Ion pairs (IPs) consist of an anionic and a cationic component which are bonded together with electrostatic and van der Waals interactions. Employment of emissive anionic and cationic components yields luminescent IPs showing a mixed luminescence color.39–43 Compared to single luminophores, IPs containing two luminescent chromophores exhibit richer excited states, which results from potential energy transfer between the two luminophores. In addition, IPs exhibit a “single-component” characteristic and can avoid phase separation in the solid state, which usually occurs in a physical mixture of two luminophores.
In this work, we aim to develop luminescent IPs with tunable emissive colors. Owing to the advantageous photophysical properties of phosphorescent iridium(III) complexes, such as high luminescence quantum yields, long emission lifetimes, large Stokes shifts, high photostability, and photophysical properties sensitive to the microenvironment, a series of positively- and negatively-charged iridium(III) complexes have been chosen as the cationic and anionic components of luminescent IPs (IP1–IP6, Fig. 1b), respectively.44–53 Upon photoexcitation, these IPs exhibited a mixed luminescence from both the cation and the anion. The emission spectra of IP1–IP6 show concentration dependence. In particular, IP6 displayed white emission at a suitable concentration in solution or solid state. Thus, in this contribution, UV-chip (365 nm) excited light-emitting diodes (LEDs) showing orange, light yellow and white emission colors were successfully fabricated using IP6 as the emitter. In addition, interesting and tunable electrochromic luminescence has been observed in solution and quasi-solid devices, and the electrochromic mechanism of these IPs has been investigated.
Results and discussion
Synthesis and characterizations
The photophysical properties of iridium(III) complexes are closely related to their ligands. Hence, to obtain IPs showing different luminescent colors, various cationic and anionic complexes ((C^N)2Ir(N^N)+Cl− and (C^N)2Ir(CN)2-n-Bu4N+) with different HC^N ligands (HC^N = 2-phenylpyridine, 2-phenylquinoline, 2-(2,4-disfluorophenyl)pyridine, 2-thiophenylquinoline, N-hexyl-2-(2-pyridyl)benzimidazole, 2-(4-((tert-butyldiphenylsilyl)oxy)phenyl)-phenylbenzothiazole; N^N = 2,2′-biquinoline, 2,2′-dipyridine, cyanide) were selected to prepare the luminescent IPs and the emission colors of these complexes cover the entire visible region. The luminescent IPs were synthesized in two steps. Firstly, three cationic (C1Cl–C3Cl) and four anionic complexes (n-Bu4NA1–n-Bu4NA4) were synthesized by refluxing biscyclometalated iridium(III) dichloro-bridged dimers in the presence of an excess of auxiliary N^N or CN− ligands. In the second step, six IPs without small counterions, IP1–IP6 (C1A1, C2A2, C3A2, C1A2, C2A3 and C2A4), were obtained by the metathesis reactions (Schemes 1 and S1†).43,54–58 | ||
| Scheme 1 The synthetic routes of positive and negative Ir(III) complexes and ion pairs. | ||
All the complexes and IPs have been fully characterized by 1H nuclear magnetic resonance (NMR), 13C{1H} NMR, 19F{1H} NMR, matrix-assisted laser desorption ionization time-of-flight mass spectrometry (MALDI-TOF MS), electrospray ionization mass spectrometry (ESI-MS) (see ESI†), UV-Vis absorption spectrometry and steady-state photoluminescence (PL) spectrometry. In 1H NMR spectra, the anionic complexes exhibited four peaks at 3.06, 1.58, 1.34 and 0.96 ppm in CD3CN, which can be assigned to the tetrabutylammonium cation. These signals were absent in the 1H NMR spectra of IPs, indicating the successful metathesis reaction and the quantitative synthesis of the IPs starting from equal molar quantity of the two luminescent components in dichloromethane.
Photophysical properties
The photoluminescence properties of the complexes were investigated. The PL spectra of the cationic (C1Cl–C3Cl) and anionic (n-Bu4NA1–n-Bu4NA4) complexes in acetonitrile solution are presented in Fig. 1d and Fig. S3,† peaking at 524, 591, 638, 550, 595, 475 and 523 nm, respectively. For the IPs, their emissions are contributed to by both cations and anions. Interestingly, the PL spectra of the IPs exhibit concentration dependence (Fig. S1†). Taking IP1 as an example (Fig. 1c), at a relatively low concentration of 10−6 M, the emission peak of IP1 is around 524 nm, which originated from C1, because the quantum yield of C1 (21%) is much higher than that of A1 (17%). As the concentration of solution increases, the green emission from C1 was quenched by the anionic complex A1, due to energy transfer from C1 to A1. When the concentration of IP1 was increased to 10−3 M, the PL spectrum is dominated by the emission from the anionic component. The emission spectra of IP1–IP6 were also measured in various solvents (THF, ethyl acetate, CHCl3, CH2Cl2, CH3OH), and there was no evident change in different solvents at the same concentration of IPs as shown in Fig. S2.†The energy transfer process between the two components of IP1 was investigated by Stern–Volmer quenching analysis (Fig. 1d and e). The quenching study was based on a bimolecular quenching model, τ0/τ = 1 + Kqτ0[Q], where τ and τ0 are the emission lifetimes of n-Bu4NA1 with and without the quencher C1Cl, Kq is the experimental quenching rate constant and [Q] is the molar concentration of the quencher. The lifetimes of n-Bu4NA1 in acetonitrile solution with various amounts of the quencher, C1Cl, were measured. The concentration of n-Bu4NA1 was kept at 1.0 × 10⁻⁵ M, while that of C1Cl varied from 0 to 4.0 × 10⁻⁴ M. The Stern–Volmer plot of the mixture of the two complexes in solution revealed a good linear relationship between τ0/τ and [Q]. The calculation yields a Kq value of 1.63 × 10⁻⁴ M−1 s−1. This quenching effect can be attributed to the intermolecular triplet–triplet energy transfer.43,46 The results indicate that the energy transfer quenching process is very efficient between the two ionic complexes.
White LED devices
For IP6, the two luminescent components peak at 475 nm and 580 nm. At a concentration of 1.0 × 10⁻³ M, the ion pair shows orange emission. With the decrease of concentration in CH3CN, the greenish-blue emission increases gradually (Fig. 2a and c). When the concentration decreases to 6.5 × 10⁻⁶ M, the solution exhibits white emission with the Commission Internationale de L'Eclairage (CIE) of (0.28, 0.30) and a quantum efficiency of 0.22. As the concentration continues to decrease, the solution shows weak blue emission.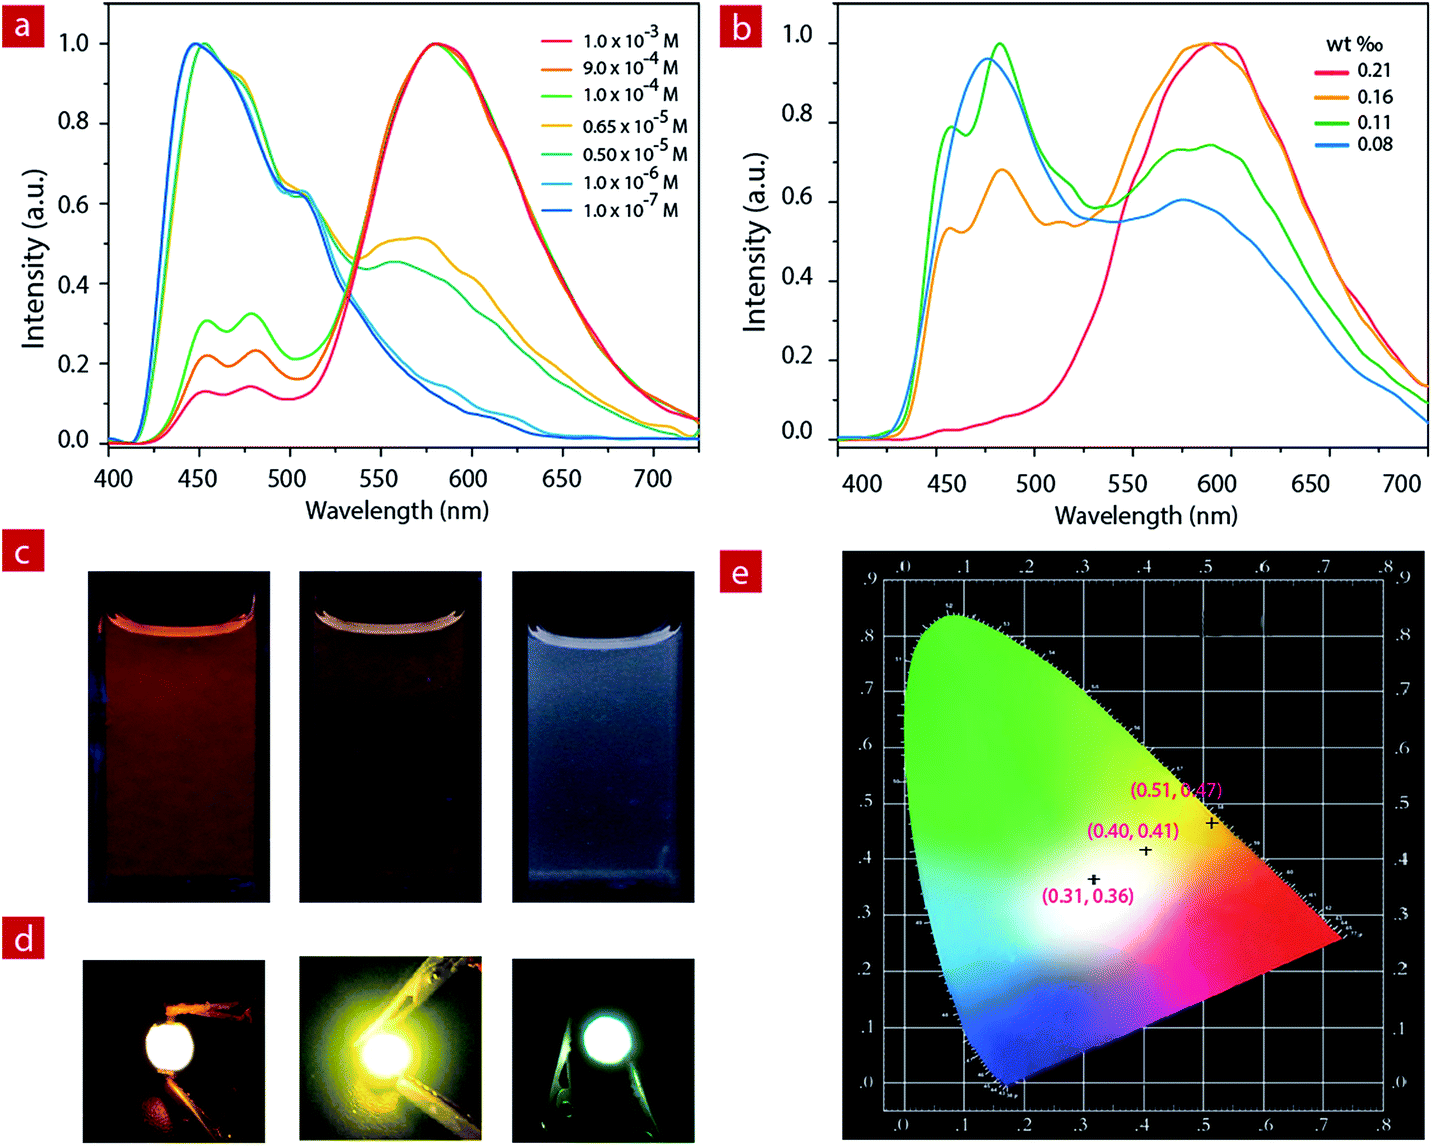 | ||
| Fig. 2 (a) The luminescence spectra of IP6 at different concentrations in acetonitrile. (b) The solid state luminescence spectra of IP6 doped into a polyethylene–polypropylene glycol polymer with different weight ratios. (c) Photographs of IP6 at different concentrations (left, 1.0 × 10⁻³ M; middle, 1.0 × 10⁻⁴ M; right, 6.5 × 10⁻⁶ M) in acetonitrile under excitation at 365 nm. (d) The pictures of the orange (left, 1.7 mg in 800 mg), light-yellow (middle, 0.9 mg in 800 mg) and white (right, 0.7 mg in 800 mg) LEDs operated at 3.5 V. (e) CIE 1931 chromaticity diagram of the obtained orange, light-yellow and white light from the fabricated LED devices. | ||
IP6 was doped into a polyethylene–polypropylene glycol polymer to investigate the photophysical properties of the solid film. At different doping concentrations, the film showed different emission colors (Fig. 2b, and S4†). At a concentration of about 1.9 mg IP6 in 800 mg polymer, the solid film exhibited orange emission. With the decrease of the doping concentration, the solid film showed light yellow emission gradually. Finally, when the concentration decreased to about 0.7 mg IP6 in 800 mg polymer, the solid film showed white emission with a quantum efficiency of 0.16. IP6, therefore, is a potential candidate material for white LED (WLED).
Compared to the widely used inorganic phosphors, organic emitters have a greater advantage due to their large absorption cross section, which can reduce the phosphor consumption and cut down the costs.59 Here, to fabricate the near-UV excited LED, powdered organic emitter IP6 was dispersed in a polyethylene–polypropylene glycol polymer and then coated onto the surface of commercially available 365 nm UV LED chips. Bright orange, light yellow and white emission were obtained when polyethylene–polypropylene glycol polymers doped with different concentrations (1.9 mg/800 mg, 0.9 mg/800 mg and 0.7 mg/800 mg) of IP6 were coated onto the UV chip as emitters. We can clearly see the bright orange, light yellow and white emissions from the prepared devices with CIE coordinate values of (0.51, 0.47), (0.40, 0.41) and (0.31, 0.36), respectively (Fig. 2d).
Electrochromic switches
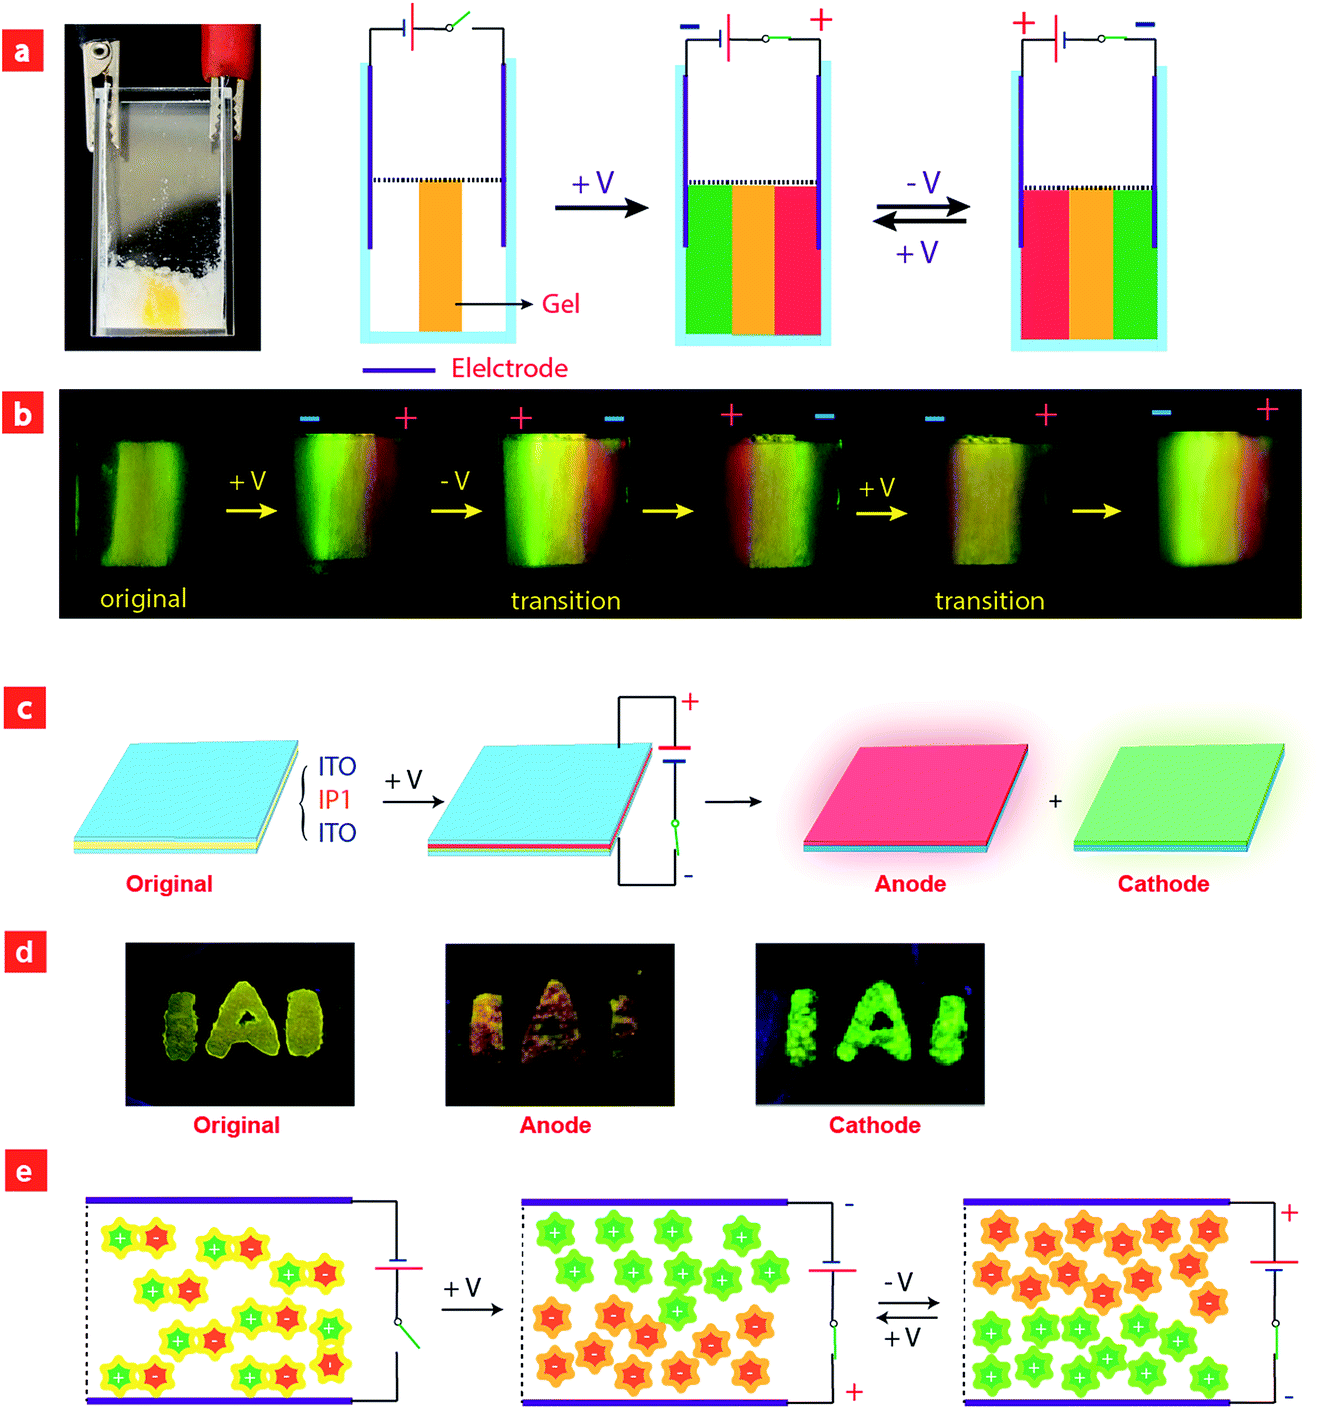
Considering that IPs consist of luminescent ions with opposite charges, the electric field is anticipated to regulate the luminescent behavior. In order to demonstrate this behavior, IP1 was used to perform the electrochromic luminescence experiment as illustrated in Fig. 3a. A concentration of 10−5 M of the ion pair was chosen, because the emission intensity of the two peaks of IP1 was almost equal at this concentration. Two platinum electrodes were immersed in a CH3CN solution of IP1 with a distance of 20 mm between each other. Before applying a voltage, the solution of IP1 exhibited yellow emission. Subsequently, upon applying a voltage of 3 V onto the electrodes, the emission color of the solution near the anode changed from yellow to red within 30 s, which is in accordance with its cationic component (C1). Meanwhile, the yellow emission near the cathode changed to green, which is same as that of the anionic component (A1). Such a change of emission color gradually extends to the middle of the two electrodes, appearing as a clear boundary. | ||
| Fig. 3 (a) Photographs of ion pairs (10−5 M) in acetonitrile before (left) and after (right) applying a voltage of 3 V, followed by stirring and reversing the voltage under excitation at 365 nm. (b) Luminescence spectra of ion pairs (10−5 M) in acetonitrile before and after applying a voltage at the cathode and anode, respectively. | ||
Then once the voltage was removed, the original yellow emission was recovered after stirring the solution and the electrochromic luminescence reappeared when the stirring was stopped. This observation indicates that IP1 shows an excellent reversibility for electrochromic luminescence. To explore the mechanism of this phenomenon, the emission spectra of IP1 near the anode and cathode after electrical stimuli are measured and shown in Fig. 3b. It was found that the emission spectra of the solution near the anode and cathode are almost the same as those of the anionic (n-Bu4NA1) and cationic iridium(III) complex (C1Cl), respectively. Therefore, we believe that the anionic component directionally moves to the anode and the cationic one shifts to the cathode because the electrostatic interaction was broken under an electric field, resulting in the emission color changes near the two electrodes.
To have a better understanding of these observations, a schematic model was proposed in Fig. 4e. Before applying a voltage, the IPs were disordered and uniformly distributed in the solution, and the interaction between cationic and anionic components is mainly through electrostatic force, which can be broken upon applying a voltage, leading to migration of cationic and anionic components to the cathode and anode, respectively. After removing the voltage and stirring the solution, the two components held together again. This mechanism was confirmed by the NMR experiments. Because of the asymmetry of the ancillary ligand in C1Cl, the two C^N ligands are non-chemically equivalent. There are two peaks attributed to the proton in the b-position with each integral of 1 (Fig. S5†). For n-Bu4NA1, the two C^N ligands are chemically equivalent owing to the symmetry of the ancillary ligands CN− in the structure. Eight peaks from the C^N ligand could be observed in the NMR spectrum. The integral of the proton in the a-position is 2. In the original NMR spectrum of IP1, the integral ratio of protons at the a-position to the b-position is 2![[thin space (1/6-em)]](https://www.rsc.org/images/entities/char_2009.gif) :1, indicating that the anion and cation are equal. After applying a voltage, the integral ratio in the NMR spectrum of the solution near the cathode changed to 0.56:1.00, while that near the anode changed to 2.00:0.82. These results demonstrated the migration of anions and cations to anode and cathode, respectively, under the electric field.
:1, indicating that the anion and cation are equal. After applying a voltage, the integral ratio in the NMR spectrum of the solution near the cathode changed to 0.56:1.00, while that near the anode changed to 2.00:0.82. These results demonstrated the migration of anions and cations to anode and cathode, respectively, under the electric field.
 | ||
| Fig. 4 (a and c) The schematic diagram of the setup for electrochromic luminescence experiments. (b and d) Photographs of electrochromic luminescence experiments using quasi-solid film doped with IP1. (e) Schematic illustration of ion migration under electric stimuli. | ||
To prove that the formation of IPs is necessary for realizing this electrochromism phenomenon, a control experiment using a mixed solution of n-Bu4NA1 and C1Cl (molar ratio 1:1) was carried out. Upon applying a voltage of 3 V to the electrodes for about 2 minutes, no emission color change was observed (Fig. S6†), which may be because the small counterions Cl− and n-Bu4N+ moved to the anode and cathode preferentially compared to the bulky ionic iridium(III) complexes. Hence, our design strategy based on luminescent IPs is effective to realize the electrochromic luminescence.
Furthermore, color-tunable electrochromic luminescence has been realized by using other IPs (IP2–IP6, Fig. 3). For example, the emission color of IP2 can be changed from yellow to blue at the anode and orange at the cathode. For IP3, the emission color at the anode changed from red to blue, while that near the cathode remained red because of efficient energy transfer. For IP4, the emission color changed from green to blue at the anode, and remained green near the cathode. For IP5, the emission color at the cathode changed from yellow to orange, and that near the anode remained yellow. For IP6, the emission color at the cathode changed from orange to blue-green, and that near the anode remained orange.
Based on the above results, we further realized the electrochromic luminescence in a quasi-solid state. A device with a simple sandwiched structure, in which a quasi-solid film was coated between two Pt electrodes, has been fabricated. The yellow-emitting quasi-solid film was prepared by mixing ion pair IP1 with DMSO and SiO2 particles (300–400 mesh). The IPs are able to freely migrate within the inorganic network channels of the SiO2 skeleton and the phosphorescence properties of IPs would not be affected by the presence of SiO2 particles. Under a voltage of 3 V, the luminescent color near the anode changed from yellow to red and that near the cathode was altered to green, which is consistent with the electrochromic luminescence observed in solution. When reversing the direction of the electric field, the emission colors near the two electrodes exchanged within 20 minutes (Fig. S7†).
Next, we carried out another experiment to further confirm that the mechanism of electrochromic luminescence is due to the migrations of the ions under an electric field, as shown in Fig. 4a and b. At first, a quasi-solid gel was prepared by adding several drops of DMSO into SiO2 particles and then coated between two Pt electrodes. IP1 was doped into the middle of the gel, which showed a yellow emission. Upon applying a voltage of 3 V for 10 minutes, green emission color appeared and gradually spread to the cathode. Meanwhile, the red emission color spread to the anode gradually. Next, the direction of the electric field was exchanged, and the emission colors near the two edges were switched. This phenomenon can be repeated. The above results demonstrated that the electrochromic luminescence is induced by the migration of the ions.
Finally, a simple sandwiched structure device, in which a quasi-solid film (about 2 mm in thickness) doped with IP1 was coated between two ITO electrodes, has been fabricated as shown in Fig. 4c and d. At first, a letter pattern of “IAI” was coated onto the ITO electrodes. The color of the pattern was orange. Then a voltage of 3 V was applied to the ITO electrodes for about 3–4 seconds. The emission color of the film near the anode changed to red immediately. Meanwhile, a green color appeared near the cathode. This phenomenon can be repeated very well.
Conclusions
In summary, we have developed a class of tunable emissive materials based on luminescent ion-paired iridium(III) complexes. The photophysical properties of the IPs have been studied in detail. Orange, light yellow and white light-emitting devices were successfully fabricated by coating the polymer films doped with IP6 on commercially available ultraviolet LEDs. Furthermore, a new strategy for the design of electric-responsive materials which display tunable and reversible electrochromic luminescence was presented. Changing the moiety of cationic or anionic iridium(III) complexes moiety can be used to tune the electrochromic luminescence colors of these ion pairs. To demonstrate the potential practical applications, a solid-film electrochromic switch device using IPs, which showed a fast and reversible emission color change, has been fabricated successfully. These results showed that electrochromic luminescent materials based on ion pairs will be promising candidates for applications in optoelectronic fields.Experimental
General
Unless otherwise stated, all starting materials and reagents were purchased from commercial suppliers and were used without further purification. Silica particles (Aerosil 200, 12 nm) were purchased from Degussa Company (Evonik Industries AG, Rellinghauser Strabe 1-11, 45128 Essen, Germany). CH2Cl2, CH3CN and CH3OH were dried under reflux over CaH2 or sodium for several hours at 70–75 °C, distilled at these conditions and used fresh. NMR spectra were recorded on a Bruker Ultra Shield Plus 400 MHz NMR instrument (1H: 400 MHz, 13C{1H}: 100 MHz, 19F{1H}: 377 MHz). Chemical shifts (ppm) were reported relative to tetramethylsilane (TMS). Mass spectra were obtained on a Bruker autoflex MALDI-TOF/TOF mass spectrometer and a ESI-MS (LCQ Fleet, Thermo Fisher Scientific). UV-Vis absorption spectra were recorded on a UV-1700 Shimadzu UV-Vis spectrophotometer. The photoluminescence spectra and emission lifetimes were recorded on an Edinburgh FL920 spectrofluorometer system.Synthesis of 1
A mixture of 2-bromopyridine (1.03 g, 6.52 mmol), 2,4-difluorophenylboronic acid (0.94 g, 5.95 mmol), Pd(PPh3)4 (0.21 g, 0.18 mmol) and potassium carbonate (1.0 g) in toluene (30.0 mL), H2O (10.0 mL) and EtOH (10.0 mL) was stirred for 24 h at 85 °C under nitrogen. The reaction mixture was cooled down to room temperature, then 50.0 mL H2O was added, and the solution was extracted with dichloromethane. The organic layer was dried over Na2SO4, and the solvents were removed in vacuo. The crude material was purified by column chromatography over silica gel (PE → PE/EA, 75:1), yielding the yellow oil. Yield: 1.08 g (95.0%).
1H NMR (400 MHz, DMSO-d6): δ = 8.70 (ddd, J1 = 0.8 Hz, J2 = 1.6 Hz, J3 = 4.8 Hz, 1H); 7.98 (dt, J1 = 6.8 Hz, J2 = 9.2 Hz, 1H); 7.88 (dt, J1 = 1.6 Hz, J2 = 7.6 Hz, 1H); 7.74 (m, 1H); 7.38 (ddd, J1 = 1.2 Hz, J2 = 4.8 Hz, J3 = 7.6 Hz, 1H); 7.35 (ddd, J1 = 2.4 Hz, J2 = 9.2 Hz, J3 = 11.6 Hz, 1H); 7.20 (ddt, J1 = 0.8 Hz, J2 = 2.4 Hz, J3 = 8.8 Hz, 1H). 13C{1H} NMR (100 MHz, DMSO): δ = 162.57 (dd, 3JC–F = 12.3 Hz, 1JC–F = 247.1 Hz); 159.90 (dd, 3JC–F = 12.3 Hz, 1JC–F = 249.6 Hz); 151.64 (d, 3JC–F = 2.5 Hz), 149.81; 136.94; 132.23 (dd, 3JC–F = 4.5 Hz, 3JC–F = 9.8 Hz); 123.93 (d, 3JC–F = 8.6 Hz); 123.70 (d, 2JC–F = 11.8 Hz); 122.90; 112.05 (d, 2JC–F = 21.1 Hz); 104.56 (t, 2JC–F = 27.0 Hz). 19F{1H} NMR (376.5 MHz, DMSO) δ = −109.35 (d, J = 8.28 Hz); −112.826 (d, J = 8.28 Hz). ESI-MS (m/z): calcd for C11H7F2N, 191.05; found, 191.12.
Synthesis of 2
A mixture of 2-(2-pyridyl)benzimidazole (200.0 mg, 2.5 mmol), n-hexane (175.0 mg, 2.6 mmol) and potassium hydroxide (60.0 mg, 2.5 mmol) in DMF (5.0 mL) was heated at room temperature under nitrogen atmosphere for 4 h, and then extracted with CH2Cl2 and water. The crude product was purified through column chromatography on silica gel (PE → PE/EA, 30:1) to yield pure product as a colorless oil. Yield: 0.46 mg (61.0%).
1H NMR (400 MHz, CDCl3): δ = 8.67 (d, J = 4.0 Hz, 1H); 8.38 (d, J = 8.0 Hz, 1H); 7.85–7.81 (m, 2H); 7.44 (dd, J1 = 6.7 Hz, J2 = 2.0 Hz, 1H); 7.35–7.27 (m, 3H); 4.81 (t, J = 8.0 Hz, 3H); 1.86 (dt, J = 15.0 Hz, 7.6 Hz, 2H); 1.36–1.24 (m, 6H); 0.85 (t, J = 7.1 Hz, 3H). 13C{1H} NMR (100 MHz, CDCl3, 298 K): δ = 150.92; 150.08; 148.76; 142.81; 136.89; 136.77; 124.82; 123.80; 123.31; 122.60; 120.21; 110.37; 45.58; 31.47; 30.13; 26.62; 22.64; 14.12. ESI-MS (m/z): calcd for C18H21N3, 279.17; found, 279.28.
Synthesis of 3
A mixture of 2-aminothiophenol (4.0 g) and 4-hydroxybenzaldehyde (4.12 mL) in DMF (10 mL) was heated to reflux under nitrogen atmosphere at 110 °C for 72 h. Next, the reaction mixture was cooled down to room temperature, and then the mixture was extracted with H2O and ethyl acetate. The solvent was removed under reduced pressure and the product was recrystallized with ethanol.Synthesis of 4
A mixture of 3, imidazole (200 mg), tert-butylchlorodiphenylsilane (2 mL) and DMF (4.6 mL) in a two-necked flask was heated to reflux under nitrogen atmosphere at 40 °C for 24 h. Next, the reaction mixture was cooled down to room temperature, and then the mixture was extracted with H2O and ethyl acetate. The solvent was removed under reduced pressure and the product was recrystallized with ethanol.1H NMR (400 MHz, CDCl3): δ = 7.99 (d, J = 8.0 Hz, 1H); 7.86–7.82 (m, 3H); 7.74–7.72 (m, 4H); 7.47–7.31 (m, 8H); 6.85 (d, J = 8.4 Hz, 2H); 1.12 (s, 9H). ESI-MS (m/z): calcd for C29H27NOSSi, 465.17; found, 464.97.
Synthesis of 5
Water (56.0 mL), anhydrous ethanol (112.0 mL) and acetic acid (112.0 mL) were added into a bottle. Then, iron powder (13.15 g, 0.235 mol) was added and the temperature was adjusted to 75 °C. Lastly, benzaldehyde (5.0 g, 0.033 mol) was poured into the bottle slowly and stirred for 15 min. Then the reaction mixture was cooled down to room temperature, the crude product was filtered and the filtrate was collected, which was then extracted with CH2Cl2 and water. Next, the organic phase was washed with saturated sodium bicarbonate solution (300 mL × 3 times) and deionized water (300 mL × 3 times), and then dried over anhydrous magnesium sulfate. The solvent was removed under reduced pressure to afford a yellow oily liquid. Yield: 3.25 g (81.0%).1H NMR (400 MHz, CDCl3): δ = 9.81 (d, J = 0.8 Hz, 1H); 7.53 (dd, J1 = 1.6 Hz, J2 = 7.6 Hz, 1H); 7.29 (ddd, J1 = 1.6 Hz, J2 = 7.2 Hz, J3 = 8.4 Hz; 1H); 7.10 (brs, 2H); 6.70–6.85 (m, 1H); 6.63 (ddd, J1 = 1.2 Hz, J2 = 7.2 Hz, J3 = 8.0 Hz, 1H). ESI-MS (m/z): calcd for C7H7NO, 121.06; found, 120.98.
Synthesis of 6
Sodium hydroxide (1.0 g) was dissolved in anhydrous ethanol (15.0 mL). To this solution was added o-amino-benzaldehyde (600.0 mg, 4.96 mmol) and 2-acetylthiophene (688.0 mg, 5.46 mmol). The reaction mixture was refluxed at 80 °C with stirring for 12 h. The reaction mixture was cooled down to room temperature and the mixture was extracted with CH2Cl2, and then the solvent was removed under reduced pressure. Purifying the residue using silica gel column chromatography (CH2Cl2/PE, 1:10) gave a white solid. Yield: 835.4 mg (80.0%).
1H NMR (CDCl3): δ = 8.14 (d, J = 8.8 Hz, 1H); 8.09 (d, J = 8.8 Hz, 1H); 7.79 (d, J = 8.8 Hz, 1H); 7.76 (dd, J1 = 1.6 Hz, J2 = 8.4 Hz, 1H); 7.74 (dd, J1 = 0.8 Hz, J2 = 4.0 Hz, 1H); 7.69 (ddd, J1 = 1.6 Hz, J2 = 7.2 Hz, J3 = 8.4 Hz; 1H); 7.49 (ddd, J1 = 1.2 Hz, J2 = 6.8 Hz, J3 = 8.0 Hz; 1H); 7.47 (dd, J1 = 1.2 Hz, J2 = 5.2 Hz, 1H). ESI-MS (m/z): calcd for C13H9NS, 211.05; found, 211.16.
Synthesis of 7
Sodium hydroxide (1.0 g) was dissolved in anhydrous ethanol (15.0 mL). To this solution was added o-amino benzaldehyde (600.0 mg, 4.96 mmol) and acetophenone (0.6 mL, 4.28 mmol). The reaction mixture was refluxed at 80 °C with stirring for 12 h. The reaction mixture was cooled down to room temperature and extracted with CH2Cl2, and the solvent was removed under reduced pressure. The crude product was purified using column chromatography on silica gel (CH2Cl2/PE, 1:10) to yield the pure product as a white solid. Yield: 686.5 mg (81.0%).
1H NMR (CDCl3): δ = 8.23 (d, J = 8.4 Hz, 1H); 8.19–8.16 (m, 3H); 7.89 (d, J = 8.4 Hz, 1H); 7.84 (dd, J1 = 1.2 Hz, J2 = 8.0 Hz, 1H); 7.74 (ddd, J1 = 1.2 Hz, J2 = 6.8 Hz, J3 = 8.4 Hz, 1H); 7.56–7.52 (m, 3H); 7.47 (tt, J1 = 2.4 Hz, J2 = 7.2 Hz, 1H). ESI-MS (m/z): calcd for C15H11N, 205.09; found, 205.18.
Synthesis of [(2fppy)2Ir(μ-Cl)2Ir(2fppy)2]
A mixture of IrCl3·3H2O (200.0 mg, 0.56 mmol) and 2-(2,4-difluorophenyl)pyridine (2fppy) (235.8 mg, 0.91 mmol) in 2-ethoxyethanol/water (8.0 mL, 3:1 v/v) was heated to reflux under nitrogen atmosphere for 24 h. Next, the reaction mixture was cooled down to room temperature, a large amount of water was added into the mixture, which was filtered. Then the residue was dried to give the desired yellow-green powder.
Synthesis of C1Cl
A mixture of yellow powder of [(2fppy)2Ir(μ-Cl)2Ir(2fppy)2] (100.0 mg, 0.093 mmol) and auxiliary ligand N-hexyl-2-(2-pyridyl)benzimidazole (2) (52.0 mg, 0.186 mmol) in MeOH (3.0 mL) and CH2Cl2 (9.0 mL) was stirred for 4 h at 40 °C. The reaction mixture was cooled down to room temperature and evaporated to dryness. The crude material was purified by column chromatography over silica gel (CH2Cl2 → CH2Cl2/MeOH, 45:1), yielding the orange-red solid. Yield: 99.6 mg (60.4%).
1H NMR (400 MHz, DMSO-d6): δ = 8.68 (d, J = 8.4 Hz, 2H); 8.38 (dt, J1 = 1.2 Hz, J2 = 8.0 Hz, 1H); 8.31 (d, J = 8.4 Hz, 1H); 8.21 (d, J = 8.8 Hz, 1H); 8.05–7.94 (m, 4H); 7.83 (dd, J1 = 0.8 Hz, J2 = 5.6 Hz, 1H); 7.76–7.73 (m, 2H); 7.47 (ddd, J1 = 0.6 Hz, J2 = 6.4 Hz, J3 = 7.6 Hz, 1H); 7.22–7.16 (m, 3H); 7.04 (ddd, J1 = 2.4 Hz, J2 = 9.6 Hz, J3 = 12.4 Hz, 1H); 6.99 (ddd, J1 = 2.4 Hz, J2 = 9.6 Hz, J3 = 12.4 Hz, 1H); 6.25 (d, J = 8.0 Hz, 1H); 5.72 (dd, J1 = 2.4 Hz, J2 = 8.8 Hz, 1H); 5.62 (dd, J1 = 2.4 Hz, J2 = 8.8 Hz, 1H); 5.02–4.86 (m, 2H); 1.96–1.86 (m, 2H); 1.28–1.16 (m, 6H); 0.77 (t, J = 7.2 Hz, 3H). 13C{1H} NMR (100 MHz, DMSO): δ = 162.97 (dd, 3JC–F = 12.5 Hz, 1JC–F = 254.0 Hz); 162.39 (dd, 3JC–F = 12.5 Hz, 1JC–F = 253.6 Hz); 162.81 (d, 3JC–F = 6.6 Hz); 160.85 (dd, 3JC–F = 13.7 Hz, 1JC–F = 259.0 Hz); 160.51 (dd, 3JC–F = 12.4 Hz, 1JC–F = 257.0 Hz); 155.56 (d, 3JC–F = 6.2 Hz); 152.01; 151.93; 151.92; 151.68; 150.23; 149.81; 146.16; 140.63; 139.92; 139.73; 138.39; 136.37; 129.10; 128.27 (dd, J1 = 2.4 Hz, J2 = 4.1 Hz); 127.86; 126.18; 126.13; 125.92; 125.35; 124.42 (d, J = 11.1 Hz); 123.35 (d, J = 18.3 Hz); 122.96 (d, J = 19.6 Hz); 116.17; 113.73 (d, J = 16.7 Hz); 113.10; 113.16 (d, J = 15.8 Hz); 99.06 (t, 2JC–F = 27.1 Hz); 98.84 (t, 2JC–F = 27.1 Hz); 45.49; 30.78; 29.14; 25.49; 21.94; 13.79. 19F{1H} NMR (376.5 MHz, DMSO): δ = −106.49 (d, J = 10.17 Hz); −106.91 (d, J = 10.54 Hz); −108.61 (d, J = 10.54 Hz); −109.12 (d, J = 10.17 Hz). MALDI-TOF-MS (m/z): calcd for C40H33IrF4N5Cl, 887.20; found, 852.06 (M − PF6)+. Anal. calcd, C 54.14, H 3.75, N 7.89; found, C 54.19, H 3.81, N 7.92.
Synthesis of [(ppy)2Ir(μ-Cl)2Ir(ppy)2]
A mixture of IrCl3·3H2O (200.0 mg, 0.56 mmol) and 2-phenylpyridine (ppy) (173.8 mg, 0.16 mmol) in 2-ethoxyethanol/water (8.0 mL, 3:1 v/v) was heated to reflux under nitrogen atmosphere for 24 h. Next, the reaction mixture was cooled down to room temperature, a large amount of water was added into the mixture, which was filtered. Then the residue was dried to give the desired yellow powder. Yield: 353.8 mg (59.0%).
Synthesis of C2Cl
A mixture of yellow powder of [(ppy)2Ir(μ-Cl)2Ir(ppy)2] (100.0 mg, 0.093 mmol) and auxiliary ligand 2,2-dipyridyl (dpy) (29.0 mg, 0.186 mmol) in MeOH (3.0 mL) and CH2Cl2 (9.0 mL) was stirred for 4 h at 40 °C. The reaction mixture was then cooled to room temperature and evaporated to dryness. The crude material was purified by column chromatography over silica gel (CH2Cl2 → CH2Cl2/MeOH, 45:1), yielding the orange-red solid. Yield: 41.9 mg (65.4%).
1H NMR (400 MHz, DMSO-d6): δ = 8.90 (d, J = 8.4 Hz, 2H); 8.29–8.25 (m, 4H); 7.96–7.91 (m, 4H); 7.87 (dd, J1 = 0.8 Hz, J2 = 5.2 Hz, 2H); 7.69 (ddd, J1 = 0.8 Hz, J2 = 5.2 Hz, J3 = 6.4 Hz, 2H); 7.61 (d, J = 5.2 Hz, 2H); 7.16 (ddd, J1 = 1.2 Hz, J2 = 5.6 Hz, J3 = 7.2 Hz, 2H); 7.02 (dt, J1 = 1.2 Hz, J2 = 8.0 Hz, 2H); 6.90 (dt, J1 = 1.2 Hz, J2 = 7.6 Hz, 2H); 6.19 (dd, J1 = 0.8 Hz, J2 = 7.6 Hz, 2H). 13C{1H} NMR (100 MHz, DMSO-d6): δ = 166.86; 155.392; 150.49; 149.87; 148.91; 143.84; 139.75; 138.85; 131.12; 130.31; 128.73; 125.14; 125.07; 123.99; 122.36; 120.11. MALDI-TOF-MS (m/z): calcd for C32H24IrN4Cl, 692.13; found, 656.99 (M − PF6)+. Anal. calcd, C 55.52, H 3.49, N 8.09; found, C 55.07, H 3.90, N 7.98.
Synthesis of n-Bu4NA2
The complex [Ir(ppy)2(CN)2]TBA, where TBA is the tetrabutylammonium ion, was prepared according to the literature procedure, with some modifications.39 The dimeric iridium(III) complex [(ppy)2Ir(μ-Cl)2Ir(ppy)2] (200.0 mg) was dissolved in 30.0 mL of dichloromethane solvent under nitrogen. To this solution was added tetrabutylammonium cyanide (100.0 mg) ligand. The reaction mixture was refluxed with stirring for 8 h. The reaction mixture was cooled down to room temperature, and then the solution was washed three times with distilled H2O, and extracted with dichloromethane. The organic layer was dried over Na2SO4, and the solvents were removed in vacuo. The crude material was purified by column chromatography over silica gel (CH2Cl2 → CH2Cl2/MeOH, 50:1), yielding the green solid. Yield: 114.9 mg (77.5%).
1H NMR (400 MHz, DMSO-d6): δ = 9.52 (dd, J1 = 0.8 Hz, J2 = 6.0 Hz, 2H); 8.07 (d, J = 8.4 Hz, 2H); 7.89 (dt, J1 = 1.6 Hz, J2 = 7.6 Hz, 2H); 7.66 (d, J = 7.6 Hz, 2H); 7.31 (dt, J1 = 5.6 Hz, J2 = 7.2 Hz, 2H); 6.73 (dt, J1 = 1.2 Hz, J2 = 6.8 Hz, 2H); 6.61 (dt, J1 = 1.2 Hz, J2 = 7.2 Hz, 2H); 6.08 (dd, J1 = 1.2 Hz, J2 = 7.6 Hz, 2H); 3.17–3.13 (m, 8H); 1.60–1.52 (m, 8H); 1.34–1.25 (m, 8H); 0.93 (t, J = 7.6 Hz, 12H). 13C{1H} NMR (100 MHz, DMSO-d6): δ = 168.02; 163.78; 153.48; 144.55; 136.42; 131.48; 130.88; 128.50; 123.81; 122.74; 120.24; 119.14; 57.71; 23.21; 19.36; 13.64. MALDI-TOF-MS, ESI-MS (m/z): calcd for C40H52IrN5, 795.38; found, 553.17 (M − n-Bu4N)−, 242.42 (n-Bu4N)+. Anal. calcd, C 60.57, H 6.49, N 8.56; found, C 60.42, H 6.59, N 8.81.
Synthesis of [(thq)2Ir(μ-Cl)2Ir(thq)2]
A mixture of IrCl3·3H2O (385.0 mg, 1.10 mmol) and 2-(thiophenyl)quinoline (500.2 mg, 2.37 mmol) in 2-ethoxyethanol/water (8.0 mL, 3:1 v/v) was heated to reflux under nitrogen atmosphere for 24 h. Next, the reaction mixture was cooled down to room temperature and a large amount of water was added into the mixture. The mixture was filtered. Then the residue was dried to give the desired red powder. Yield: 650.8 mg (85.0%).
Synthesis of n-Bu4NA1
The dimeric iridium(III) complex [(thq)2Ir(μ-Cl)2Ir(thq)2] (200.0 mg, 0.15 mmol) and tetrabutylammonium cyanide (495.7 mg, 1.85 mmol) ligand were dissolved in 30.0 mL of dichloromethane solvent under nitrogen. The reaction mixture was refluxed with stirring for 8 h. Then the mixture was cooled to room temperature and extracted with CH2Cl2 and water. The crude product was purified through column chromatography on silica gel (CH2Cl2 → CH2Cl2/MeOH, 50:1) to give the pure product as a red solid. Yield: 85.6 mg (61.0%).
1H NMR (400 MHz, CDCl3): δ = 9.99 (d, J = 9.2 Hz, 2H); 7.97 (d, J = 8.4 Hz, 2H); 7.68–7.65 (m, 4H); 7.60 (d, J = 8.4 Hz, 2H); 7.42 (t, J = 7.2 Hz, 2H); 7.03 (d, J = 4.4 Hz, 2H); 6.09 (d, J = 4.4 Hz, 2H); 3.11–3.07 (m, 8H); 1.47–1.39 (m, 8H); 1.11–1.06 (m, 8H); 0.77 (t, J = 7.6 Hz, 12H). 13C{1H} NMR (100 MHz, CDCl3): δ = 170.56; 167.67; 150.11; 141.51; 137.76; 133.34; 131.12; 130.42; 128.95; 127.68; 125.76; 124.71; 117.47; 58.48; 23.80; 19.47; 13.59. MALDI-TOF-MS, ESI-MS (m/z): calcd for C44H52IrN5S2, 907.33; found, 665.17 (M − n-Bu4N)−, 242.42 (n-Bu4N)+. Anal. calcd, C 58.25, H 5.78, N 7.72; found, C 58.36, H 5.89, N 7.61.
Synthesis of [(phq)2Ir(μ-Cl)2Ir(phq)2]
A mixture of IrCl3·3H2O (385.0 mg, 1.10 mmol) and 2-phenylquinoline (phq) (500.5 mg, 2.37 mmol) in 2-ethoxyethanol/water (8.0 mL, 3:1 v/v) was heated to reflux under nitrogen atmosphere for 24 h. Next, the reaction mixture was cooled down to room temperature and a large amount of water was added into the mixture. The mixture was filtered. Then the residue was dried to give the desired red powder. Yield: 600.5 mg (77.1%).
Synthesis of C3Cl
A mixture of yellow powder of [(phq)2Ir(μ-Cl)2Ir(phq)2] (100.0 mg, 0.093 mmol) and auxiliary ligand 2,2′-biquinoline (bql) (52.0 mg, 0.20 mmol) in MeOH (3 mL) and CH2Cl2 (9 mL) was stirred for 4 h at 40 °C. The reaction mixture was cooled down to room temperature and then evaporated to dryness. The crude material was purified by column chromatography over silica gel (CH2Cl2 → CH2Cl2/MeOH, 45:1), yielding the orange-red solid. Yield: 41.0 mg (44.8%).
1H NMR (400 MHz, DMSO-d6): δ = 8.71 (d, J = 8.8 Hz, 2H); 8.49 (d, J = 8.8 Hz, 2H); 8.31 (d, J = 8.8 Hz, 2H); 8.20 (d, J = 8.8 Hz, 2H); 8.06 (d, J = 8.8 Hz, 2H); 7.96 (d, J = 8.0 Hz, 2H); 7.91 (d, J = 8.0 Hz, 2H); 7.56 (t, J = 7.6 Hz, 2H); 7.51 (d, J = 8.8 Hz, 2H); 7.43–7.37 (m, 4H); 7.09 (t, J = 8.0 Hz, 2H); 7.01 (t, J = 7.2 Hz, 2H); 6.86–6.81 (m, 4H); 6.31 (d, J = 7.2 Hz, 2H). 13C{1H} NMR (100 MHz, DMSO): δ = 169.88; 159.57; 149.09; 146.72; 145.44; 140.99; 140.59; 137.55; 131.01; 130.96; 130.43; 129.55; 129.43; 129.02; 128.99; 128.34; 128.24; 127.60; 127.05; 126.46; 124.47; 123.00; 121.37; 117.65. MALDI-TOF-MS (m/z): calcd for C48H32IrN4Cl, 892.20; found, 857.03 (M − PF6)+. Anal. calcd, C 64.60, H 3.61, N 6.28; found, C 64.50, H 3.52, N 6.54.
Synthesis of [(Si)2Ir(μ-Cl)2Ir(Si)2]
A mixture of IrCl3·3H2O (200.0 mg, 0.56 mmol) and 7 (173.8 mg, 0.16 mL, 1.12 mmol) in 2-ethoxyethanol/water (8.0 mL, 3:1 v/v) was heated to reflux under nitrogen atmosphere for 24 h. Next, the reaction mixture was cooled down to room temperature, and a large amount of water was added into the mixture, which was then filtered. Then the residue was dried to give the desired yellow powder. Yield: 147.1 mg (68.0%).
Synthesis of n–Bu4NA3
The dimeric iridium(III) complex [(Si)2Ir(μ-Cl)2Ir(Si)2] (200.0 mg) was dissolved in 30.0 mL of dichloromethane solvent under nitrogen. To this solution was added tetrabutylammonium cyanide (100.0 mg) ligand. The reaction mixture was refluxed with stirring for 8 h. The mixture was cooled down to room temperature, and then the solution was washed three times with distilled H2O, and extracted with dichloromethane. The organic layer was dried over Na2SO4, and the solvents were removed in vacuo. The crude material was purified by column chromatography over silica gel (CH2Cl2 → CH2Cl2/MeOH, 50:1) to give a green solid. Yield: 115.4 mg (77.5%).
1H NMR (400 MHz, DMSO-d6): δ = 9.26 (dd, J1 = 2.4 Hz, J2 = 7.2 Hz, 2H); 8.00 (dd, J1 = 2.4 Hz, J2 = 7.2 Hz, 2H); 7.50–7.30 (m, 18H); 7.23–7.19 (m, 8H); 6.32 (dd, J1 = 2.4 Hz, J2 = 8.4 Hz, 2H); 5.79 (d, J = 2.4 Hz, 2H); 3.18–3.14 (m, 8H); 1.61–1.52 (m, 8H); 1.35–1.26 (m, 8H); 0.93 (t, J = 7.2 Hz, 12H); 0.75 (s, 18H). 13C{1H} NMR (100 MHz, CDCl3): δ = 179.17; 166.57; 156.95; 151.727; 135.12; 135.08; 134.67; 133.29; 133.13; 130.65; 129.41; 129.38; 127.44; 126.67; 126.58; 124.11; 121.43; 113.44; 58.59; 26.53; 23.77; 19.51; 13.59. MALDI-TOF-MS, ESI-MS (m/z): calcd for C76H88IrN5S2O2Si2, 1415.55; found, 1173.67 (M − n-Bu4N)−, 242.42 (n-Bu4N)+. Anal. calcd, C 64.46, H 6.26, N 4.95; found, C 64.21, H 6.39, N 5.11.
Synthesis of IP1
C1Cl (38.1 mg, 0.043 mmol) and n-Bu4NA1 (39.0 mg, 0.043 mmol) were added to water (15.0 mL) and CH2Cl2 (15.0 mL). The reaction mixture was stirred for 1 h at room temperature and then extracted with deionized water. The combined organic extracts were concentrated by rotary evaporation. The resulting solid was washed with n-hexane to afford IP1 as a red solid. Yield: 39.6 mg (60.7%).1H NMR (400 MHz, DMSO-d6): δ = 9.90 (d, J = 8.8 Hz, 2H); 8.64 (d, J = 8.4 Hz, 2H); 8.34–8.29 (m, 3H); 8.21 (d, J = 8.8 Hz, 1H); 8.03–7.91 (m, 6H); 7.81 (d, J = 5.2 Hz, 1H); 7.72–7.67 (m, 6H); 7.56 (t, J = 6.8 Hz, 1H); 7.46 (t, J = 8.0 Hz, 1H); 7.39–7.35 (m, 1H); 7.23–7.15 (m, 5H); 7.02 (ddd, J1 = 2.0 Hz, J2 = 9.2 Hz, J3 = 12.0 Hz, 1H); 6.96 (ddd, J1 = 2.4 Hz, J2 = 9.6 Hz, J3 = 12.4 Hz, 1H); 6.24 (d, J = 8.4 Hz, 1H); 5.71 (d, J = 4.8 Hz, 2H); 5.61 (dd, J1 = 2.4 Hz, J2 = 8.4 Hz, 1H); 4.97–4.84 (m, 2H); 1.94–1.86 (m, 2H); 1.25–1.21 (m, 6H); 0.75 (t, J = 6.8 Hz, 3H). 19F{1H} NMR (376.5 MHz, DMSO): δ = −106.49 (d, J = 10.17 Hz); −106.91 (d, J = 10.54 Hz); −108.61 (d, J = 10.54 Hz); −109 (d, J = 10.17 Hz). Because of the asymmetry of the ancillary ligand in C1, the two C^N ligands are non-chemically equivalent. In addition, a coupling process exists between the fluorine nucleus and carbon nucleus, and we did not obtain the 13C{1H} NMR of IP1. MALDI-TOF-MS, ESI-MS (m/z): calcd for C68H49Ir2F4N9S2, 1517.27; found, 665.08 (A1−), 852.11 (C1+). Anal. calcd, C 53.85, H 3.26, N 8.31; found, C 53.63, H 3.09, N 8.07.
Synthesis of IP2
C2Cl (29.7 mg, 0.043 mmol) and n-Bu4NA2 (34.1 mg, 0.043 mmol) were added to water (15.0 mL) and CH2Cl2 (15.0 mL). The reaction mixture was stirred for 1 h at room temperature and then extracted with deionized water. The combined organic extracts were concentrated by rotary evaporation. The resulting solid was washed with n-hexane to afford IP2 as a yellow solid. Yield: 32.3 mg (62.3%).1H NMR (400 MHz, DMSO-d6): δ = 9.53 (d, J = 5.6 Hz, 2H); 8.86 (d, J = 8.4 Hz, 2H); 8.27–8.24 (m, 4H); 8.06 (d, J = 8.0 Hz, 2H); 7.95–7.86 (m, 8H); 7.70–7.61 (m, 6H); 7.30 (t, J = 6.0 Hz, 2H); 7.15 (t, J = 6.8 Hz, 2H); 7.02 (t, J = 7.6 Hz, 2H); 6.90 (t, J = 7.2 Hz, 2H); 6.72 (t, J = 7.2 Hz, 2H); 6.61 (t, J = 7.2 Hz, 2H); 6.19 (d, J = 7.6 Hz, 2H); 6.08 (d, J = 7.2 Hz, 2H). 13C{1H} NMR (100 MHz, DMSO): δ = 167.93; 166.83; 163.83; 155.36; 153.32; 150.48; 149.83; 148.88; 144.42; 143.82; 139.69; 138.82; 136.13; 131.08; 130.76; 130.28; 128.69; 128.29; 125.12; 125.06; 123.97; 123.63; 122.53; 122.32; 120.08; 119.95; 118.93. MALDI-TOF-MS, ESI-MS (m/z): calcd for C56H40Ir2F4N8, 1210.26; found, 657.25 (A2−), 553.25 (C2+). Anal. calcd, C 55.61, H 3.33, N 9.27; found, C 55.20, H 3.39, N 8.91.
Synthesis of IP3
C3Cl (40.1 mg, 0.045 mmol) and n-Bu4NA2 (35.7 mg, 0.045 mmol) were added to water (15.0 mL) and CH2Cl2 (15.0 mL). The reaction mixture was stirred for 1 h at room temperature and then extracted with deionized water. The combined organic extracts were concentrated by rotary evaporation. The resulting solid was washed with n-hexane to afford IP3 as a red solid. Yield: 35.6 mg (56.2%).1H NMR (400 MHz, DMSO-d6): δ = 9.51 (d, J = 5.2 Hz, 2H); 8.70 (d, J = 8.8 Hz, 2H); 8.47 (d, J = 8.8 Hz, 2H); 8.30 (d, J = 8.8 Hz, 2H); 8.19 (d, J = 8.8 Hz, 2H); 8.08–8.04 (m, 4H); 7.95 (dd, J1 = 0.8 Hz, J2 = 8.0 Hz, 2H); 7.91 (d, J = 7.2 Hz, 2H); 7.85 (ddd, J1 = 1.6 Hz, J2 = 6.8 Hz, J3 = 8.4 Hz, 2H); 7.66 (d, J = 7.6 Hz, 2H); 7.56 (ddd, J1 = 0.8 Hz, J2 = 6.8 Hz, J3 = 8.0 Hz; 2H); 7.51 (d, J1 = 8.8 Hz, 2H); 7.43–7.36 (m, 4H); 7.30 (t, J = 7.2 Hz, 2H); 7.09 (ddd, J1 = 1.6 Hz, J2 = 6.8 Hz, J3 = 8.8 Hz; 2H); 7.01 (dt, J1 = 1.2 Hz, J2 = 7.2 Hz, 2H); 6.86–6.81 (m, 4H); 6.73 (dt, J1 = 1.2 Hz, J2 = 7.6 Hz, 2H); 6.61 (dt, J1 = 0.8 Hz, J2J2 = 7.2 Hz, 2H); 6.30 (dd, J1 = 0.8 Hz, J2 = 8.0 Hz, 2H); 6.07 (dd, J1 = 0.8 Hz, J2 = 7.6 Hz, 2H). 13C{1H} NMR (100 MHz, DMSO): δ = 169.88; 168.05; 159.57; 153.46; 149.09; 146.72; 145.44; 144.59; 140.99; 140.59; 137.55; 136.51; 131.82; 131.01; 130.96; 130.91; 130.43; 129.55; 129.43; 129.02; 128.99; 128.58; 128.34; 128.24; 127.60; 127.05; 126.46; 124.47; 123.89; 123.00; 122.83; 121.37; 120.34; 119.22; 119.08; 117.65. MALDI-TOF-MS, ESI-MS (m/z): calcd for C72H48Ir2N8, 1410.33; found, 553.17 (A2−), 857.11 (C3+). Anal. calcd, C 61.35, H 3.43, N 7.95; found, C 60.97, H 3.79, N 7.86.
Synthesis of IP4
C1Cl (39.9 mg, 0.045 mmol) and n-Bu4NA2 (35.7 mg, 0.045 mmol) were added to water (15.0 mL) and CH2Cl2 (15.0 mL). The reaction mixture was stirred for 1 h at room temperature and then extracted with deionized water. The combined organic extracts were concentrated by rotary evaporation. The resulting solid was washed with n-hexane to afford IP4 as a yellow solid. Yield: 29.2 mg (46.2%).1H NMR (400 MHz, DMSO-d6): δ = 9.52 (d, J = 6.0 Hz, 2H); 8.66 (d, J = 8.4 Hz, 2H); 8.37–8.34 (m, 1H); 8.30 (d, J = 7.6 Hz, 1H); 8.21 (d, J = 8.4 Hz, 1H); 8.07–7.86 (m, 8H); 7.83 (d, J = 5.6 Hz, 1H); 7.73–7.71 (m, 2H); 7.65 (d, J = 7.6 Hz, 2H); 7.47 (t, J = 7.2 Hz, 1H); 7.31–7.15 (m, 5H); 7.06–6.96 (m, 2H); 6.71 (dt, J1 = 1.2 Hz, J2 = 6.8 Hz, 2H); 6.60 (dt, J1 = 0.8 Hz, J2 = 7.2 Hz, 2H); 6.25 (d, J = 8.0 Hz, 1H); 6.08 (dd, J1 = 1.2 Hz, J2 = 7.6 Hz, 2H); 5.75 (m, 1H); 5.62 (dd, J1 = 1.6 Hz, J2 = 8.4 Hz, 1H); 5.02–4.84 (m, 2H); 1.98–1.84 (m, 2H); 1.28–1.19 (m, 6H); 0.77 (t, J = 7.2 Hz, 3H). 19F{1H} NMR (376.5 MHz, DMSO): δ = −106.49 (d, J = 10.17 Hz); −106.91 (d, J = 10.54 Hz); −108.61 (d, J = 10.54 Hz); −109.12 (d, J = 10.17 Hz). Because of the asymmetry of the ancillary ligand in C1, the two C^N ligands are non-chemically equivalent. In addition, a coupling process exists between the fluorine nucleus and carbon nucleus, and there is a low signal to noise ratio in the spectrum of 13C{1H} NMR. MALDI-TOF-MS, ESI-MS (m/z): calcd for C64H49Ir2F4N9, 1405.32; found, 553.08 (A2−), 852.11 (C1+). Anal. calcd, C 54.73, H 3.52, N 8.98; found, C 54.27, H 3.64, N 8.56.
Synthesis of IP5
C2Cl (29.7 mg, 0.043 mmol) and n-Bu4NA3 (60.8 mg, 0.043 mmol) were added to water (15.0 mL) and CH2Cl2 (15.0 mL). The reaction mixture was stirred for 1 h at room temperature and then extracted with deionized water. The combined organic extracts were concentrated by rotary evaporation. The resulting solid was washed with n-hexane to afford IP5 as a yellow solid. Yield: 46.5 mg (59.2%).1H NMR (400 MHz, DMSO-d6): δ = 9.25 (dd, J1 = 1.2 Hz, J2 = 8.0 Hz; 2H); 8.87 (d, J = 8.4 Hz; 2H); 8.28–8.24 (m; 4H); 8.01–7.99 (m; 2H); 7.95–7.91 (m; 4H); 7.86 (dd, J1 = 1.2 Hz, J2 = 5.6 Hz; 2H); 7.68 (ddd, J1 = 0.8 Hz, J2 = 5.6 Hz, J3 = 6.8 Hz; 2H); 7.61 (dd, J1 = 0.8 Hz, J2 = 5.6 Hz; 2H); 7.50–7.42 (m; 6H); 7.39–7.30 (m; 12H); 7.25–7.19 (m; 8H); 7.15 (ddd, J1 = 1.6 Hz, J2 = 6.0 Hz, J3 = 7.6 Hz; 2H); 7.02 (dt, J1 = 1.2 Hz, J2 = 7.6 Hz; 2H); 6.90 (dt, J1 = 1.2 Hz, J2 = 7.6 Hz; 2H); 6.32 (dd, J1 = 2.4 Hz, J2 = 8.0 Hz; 2H); 6.19 (dd, J1 = 1.2 Hz, J2 = 7.6 Hz; 2H); 5.78 (d, J = 2.4 Hz; 2H); 0.75 (s; 18H). 13C{1H} NMR (100 MHz, DMSO): δ = 178.51; 166.94; 156.32; 155.46; 151.23; 150.57; 149.93; 148.96; 143.92; 139.82; 138.95; 134.72; 134.68; 132.54; 132.51; 131.20; 130.41; 130.32; 129.96; 129.36; 128.78; 127.81; 126.80; 126.72; 125.21; 125.11; 124.93; 124.06; 123.15; 122.85; 122.68; 122.48; 120.19; 113.15; 26.67; 19.14. MALDI-TOF-MS, ESI-MS (m/z): calcd for C92H76Ir2O2N8S2Si2, 1830.43; found, 1173.67 (A3−), 657.01 (C2+). Anal. calcd, C 60.37, H 4.19, N 6.12; found, C 60.11, H 4.36, N 6.30.
IP6 and n-Bu4NA4 were synthesized according to the literature.39
Synthesis of n-Bu4NA4
1H NMR (400 MHz, DMSO-d6): δ = 9.54 (dd, J1 = 1.2 Hz, J2 = 6.0 Hz; 2H); 8.22 (d, J = 8.4 Hz; 2H); 8.04 (dt, J1 = 1.2 Hz, J2 = 7.6 Hz; 2H); 7.45 (ddd, J1 = 1.2 Hz, J2 = 6.0 Hz, J3 = 7.0 Hz; 2H); 6.61 (ddd, J1 = 2.4 Hz, J2 = 9.2 Hz, J3 = 12.0 Hz; 2H); 5.54 (dd, J1 = 2.4 Hz, J2 = 8.0 Hz; 2H); 3.17–3.13 (m; 8H); 1.59–1.51 (m; 8H); 1.32–1.24 (m; 8H); 0.92 (t; 12H). 13C{1H} NMR (100 MHz, DMSO): δ = 169.79–169.66 (m); 164.36 (d, 3JC–F = 7.3 Hz); 162.82 (dd, 3JC–F = 11.1 Hz, 1JC–F = 252.6 Hz); 161.12 (dd, 3JC–F = 11.9 Hz, 1JC–F = 258.2 Hz); 154.19; 138.044; 128.51; 128.29 (t, 4JC–F = 2.2 Hz); 123.86; 122.92 (d, 2JC–F = 20.3 Hz); 112.36 (dd, 4JC–F = 2.5 Hz, 2JC–F = 15.2 Hz); 97.02 (t, 2JC–F = 26.2 Hz); 57.98; 23.51; 19.65; 13.95. 19F{1H} NMR (376.5 MHz, DMSO): δ = −109.91 (d, J = 9.05 Hz); −110.96 (d, J = 9.42 Hz). MALDI-TOF-MS, ESI-MS (m/z): calcd for C40H48IrN5F4, 795.38; found, 624.41 (M − n-Bu4N)−, 242.42 (n-Bu4N)+. Anal. calcd, C 55.41, H 5.58, N 8.08; found, C 55.72, H 5.70, N 8.21.Synthesis of IP6
1H NMR (400 MHz, CDCl3): δ = 9.74 (d, J = 5.6 Hz; 2H); 8.95 (d, J = 8.4 Hz; 2H); 8.06–8.17 (m; 4H); 7.86–7.91 (m; 4H); 7.73 (t, J = 8.0 Hz; 2H); 7.67 (d, J = 8.4 Hz; 2H); 7.62 (t, J = 8.0 Hz; 2H); 7.47 (d, J = 5.6 Hz; 2H); 7.34 (t, J = 6.4 Hz; 2H); 7.03 (t, J = 7.6 Hz; 2H); 6.99–6.90 (m; 6H); 6.28 (d, J = 7.6 Hz; 2H); 6.18 (ddd, J1 = 2.0 Hz, J2 = 9.2 Hz, J3 = 12.4 Hz; 2H); 5.72 (dd, J1 = 2.4 Hz, J2 = 8.4 Hz; 2H). 19F{1H} NMR (376.5 MHz, CDCl3): δ = −106.57 (d, J = 10.56 Hz); −108.8 (d, J = 10.56 Hz). MALDI-TOF-MS (m/z): calcd for C56H36Ir2F4N8, 1282.23; found, 624.44 (A4−), 656.99 (C2+). Anal. calcd, C 52.49, H 2.83, N 8.74; found, C 52.09, H 2.66, N 6.49.Acknowledgements
We acknowledge financial support from the National Natural Science Foundation of China (61274018), National Program for Support of Top-Notch Young Professionals, Scientific and Technological Innovation Teams of Colleges and Universities in Jiangsu Province (TJ215006), Natural Science Foundation of Jiangsu Province of China (BK20130038), and Priority Academic Program Development of Jiangsu Higher Education Institutions (YX03001).Notes and references
- M. A. Baldo, D. F. O'Brien, Y. You, A. Shoustikov, S. Sibley, M. E. Thompson and S. R. Forrest, Nature, 1998, 395, 151 CrossRef CAS.
- S. Lamansky, P. Djurovich, D. Murphy, F. A. Razzaq, H. E. Lee, C. Adachi, P. E. Burrows, S. R. Forrest and M. E. Thompson, J. Am. Chem. Soc., 2001, 123, 4304 CrossRef CAS PubMed.
- M. Mydlak, C. Bizzarri, D. Hartmann, W. Sarfert, G. Schmid and L. De Cola, Adv. Funct. Mater., 2010, 20, 1812 CrossRef CAS.
- H. Sasabe, J. Takamatsu, T. Motoyama, S. Watanabe, G. Wagenblast, N. Langer, O. Molt, E. Fuchs, C. Lennartz and J. Kido, Adv. Mater., 2010, 22, 5003 CrossRef CAS PubMed.
- C. A. Strassert, C. H. Chien, M. D. G. Lopez, D. Kourkoulos, D. Hertel, K. Meerholz and L. De Cola, Angew. Chem., Int. Ed., 2011, 50, 946 CrossRef CAS PubMed.
- S. W. Botchway, M. Charnley, J. W. Haycock, A. W. Parker, D. L. Rochester, J. A. Weinstein and J. A. G. Williams, Proc. Natl. Acad. Sci. U. S. A., 2008, 105, 16071 CrossRef CAS PubMed.
- Z. J. Chen, K. Y. Zhang, X. Tong, Y. H. Liu, C. Y. Hu, S. J. Liu, Q. Yu, Q. Zhao and W. Huang, Adv. Funct. Mater., 2016, 26, 4386 CrossRef CAS.
- X. B. Zhou, H. Liang, P. F. Jiang, K. Y. Zhang, S. J. Liu, T. S. Yang, Q. Zhao, L. J. Yang, W. Lv, Q. Yu and W. Huang, Adv. Sci., 2016, 3, 1500155 CrossRef PubMed.
- Q. Zhao, C. Q. Zhang, S. J. Liu, Y. H. Liu, K. Y. Zhang, X. B. Zhou, J. Y. Jiang, W. J. Xu, T. S. Yang and W. Huang, Sci. Rep., 2015, 5, 16420 CrossRef CAS PubMed.
- Y. Ma, H. Xu, Y. Zeng, C. L. Ho, C. H. Chui, Q. Zhao, W. Huang and W. Y. Wong, J. Mater. Chem. C, 2015, 3, 66 RSC.
- S. Kesarkar, W. Mroz, M. Penconi, M. Pasini, S. Destri, M. Cazzaniga, D. Ceresoli, P. R. Mussini, C. Baldoli, U. Giovanella and A. Bossi, Angew. Chem., Int. Ed., 2016, 55, 2714 CrossRef CAS PubMed.
- P. R. Beauiuge and J. R. Reynolds, Chem. Rev., 2010, 110, 268 CrossRef PubMed.
- H. J. Yen, C. J. Chen and G. S. Liou, Adv. Funct. Mater., 2013, 23, 5307 CrossRef CAS.
- L. Ying, C. L. Ho, H. Wu, Y. Cao and W. Y. Wong, Adv. Mater., 2014, 26, 2459 CrossRef CAS PubMed.
- W. Y. Wong and C. L. Ho, Coord. Chem. Rev., 2009, 253, 1709 CrossRef CAS.
- X. B. Xu, X. L. Yang, J. Zhao, G. J. Zhou and W. Y. Wong, Asian J. Org. Chem., 2015, 4, 394 CrossRef CAS.
- G. J. Zhou, W. Y. Wong and X. L. Yang, Chem.–Asian J., 2011, 6, 1706 CrossRef CAS PubMed.
- G. J. Zhou, C. L. Ho, W. Y. Wong, Q. Wang, D. G. Ma, L. X. Wang, Z. Y. Lin, T. B. Marder and A. Beeby, Adv. Funct. Mater., 2008, 18, 499 CrossRef CAS.
- X. L. Yang, X. B. Xu, J. S. Dang, G. J. Zhou, C. L. Ho and W. Y. Wong, Inorg. Chem., 2016, 55, 1720 CrossRef CAS PubMed.
- G. J. Zhou, Q. Wang, X. Z. Wang, C. L. Ho, W. Y. Wong, D. G. Ma, L. X. Wang and Z. Y. Lin, J. Mater. Chem., 2010, 20, 7472 RSC.
- W. Y. Wong and C. L. Ho, J. Mater. Chem., 2009, 19, 4457 RSC.
- H. Ito, M. Muromoto, S. Kurenuma, S. Ishizaka, N. Kitamura, H. Sato and T. Seki, Nat. Commun., 2013, 4, 2009 Search PubMed.
- T. Mutai, H. Satou and K. Araki, Nat. Mater., 2005, 4, 685 CrossRef CAS PubMed.
- S. Kobatake, S. Takami, H. Muto, T. Ishikawa and M. Irie, Nature, 2007, 446, 778 CrossRef CAS PubMed.
- M. A. Malwitz, S. H. Lim, R. L. W. Morris, D. M. Pham, M. M. Olmstead and A. L. Balch, J. Am. Chem. Soc., 2012, 134, 10885 CrossRef CAS PubMed.
- J. Bu, K. Watanabe, H. Hayasaka and K. Akagi, Nat. Commun., 2014, 5, 3799 CAS.
- M. Han, Y. Tian, Z. Yuan, L. Zhu and B. Ma, Angew. Chem., Int. Ed., 2014, 53, 10908 CrossRef CAS PubMed.
- S. K. Park, I. Cho, J. Gierschner, J. H. Kim, J. H. Kim, J. E. Kwon, O. K. Kwon, D. R. Whang, J. H. Park, B. K. An and S. Y. Park, Angew. Chem., Int. Ed., 2016, 55, 203 CrossRef CAS PubMed.
- Z. Chen, P. C. Hsu, J. Lopez, Y. Z. Li, J. W. F. To, N. Liu, C. Wang, S. C. Andrews, J. Liu, Y. Cui and Z. N. Bao, Nat. Energy., 2016, 1, 15006 CrossRef.
- L. Shaw, P. Hayoz, Y. Diao, J. A. Reinspach, J. W. F. To, M. F. Toney, R. T. Weitz and Z. N. Bao, ACS Appl. Mater. Interfaces, 2016, 8, 9285 CAS.
- H. H. Chou, A. Nguyen, A. Chortos, J. W. F. To, C. Lu, J. Mei, T. Kurosawa, W. G. Bae, J. B. H. Tok and Z. N. Bao, Nat. Commun., 2015, 6, 8011 CrossRef CAS PubMed.
- A. L. Ayzner, D. Nordlund, D. H. Kim, Z. N. Bao and M. F. Toney, J. Phys. Chem. Lett., 2015, 6, 6 CrossRef CAS PubMed.
- C. Wang, W. Y. Lee, D. Kong, R. Pfattner, G. Schweicher, R. Nakajima, C. Lu, J. Mei, T. H. Lee, H. C. Wu, J. Lopez, Y. Diao, X. Gu, S. Himmelberger, W. Niu, J. R. Matthews, M. He, A. Salleo, Y. Nishi and Z. N. Bao, Sci. Rep., 2015, 5, 17849 CrossRef CAS PubMed.
- A. Beneduci, S. Cospito, M. La Deda, L. Veltri and G. Chidichimo, Nat. Commun., 2014, 5, 3105 Search PubMed.
- A. Beneduci, S. Cospito, M. La Deda and G. Chidichimo, Adv. Funct. Mater., 2015, 25, 1240 CrossRef CAS.
- H. B. Sun, S. J. Liu, W. P. Lin, K. Y. Zhang, W. Lv, X. Huang, F. W. Huo, H. R. Yang, G. Jenkins, Q. Zhao and W. Huang, Nat. Commun., 2014, 5, 3601 Search PubMed.
- W. P. Lin, Q. Zhao, H. B. Sun, K. Y. Zhang, H. R. Yang, Q. Yu, X. H. Zhou, S. Guo, S. J. Liu and W. Huang, Adv. Opt. Mater., 2015, 3, 368 CrossRef CAS.
- W. P. Lin, Q. Tan, H. Liang, K. Y. Zhang, S. J. Liu, R. Jiang, R. R. Hu, W. J. Xu, Q. Zhao and W. Huang, J. Mater. Chem. C, 2015, 3, 1883 RSC.
- M. Mauro, K. C. Schuermann, R. Pretot, A. Hafner, P. Mercandelli, A. Sironi and L. De Cola, Angew. Chem., Int. Ed., 2010, 49, 1222 CrossRef CAS PubMed.
- M. Sandroni and E. Z. Colman, Dalton Trans., 2014, 43, 3676 RSC.
- G. Nasr, A. Guerlin, F. Dumur, L. Beouch, E. Dumas, G. Clavier, F. Miomandre, F. Goubard, D. Gigmes, D. Bertin, G. Wantz and C. R. Mayer, Chem. Commun., 2011, 47, 10698 RSC.
- A. Ionescu, E. I. Szerb, Y. J. Yadav, A. M. Talarico, M. Ghedini and N. Godbert, Dalton Trans., 2014, 43, 784 RSC.
- C. Wu, H. F. Chen, K. T. Wong and M. E. Thompson, J. Am. Chem. Soc., 2010, 132, 3133 CrossRef CAS PubMed.
- F. Dumur, G. Nasr, G. Wantz, C. R. Mayer, E. Dumas, A. Guerlin, F. Miomandre, G. Clavier, D. Bertin and D. Gigmes, Org. Electron., 2011, 12, 1683 CrossRef CAS.
- X. L. Yang, Z. Huang, C. L. Ho, G. J. Zhou, D. R. Whang, C. L. Yao, X. B. Xu, S. Y. Park, C. H. Chui and W. Y. Wong, RSC Adv., 2013, 3, 6553 RSC.
- Y. Ma, H. Liang, Y. Zeng, H. R. Yang, C. L. Ho, W. J. Xu, Q. Zhao, W. Huang and W. Y. Wong, Chem. Sci., 2016, 7, 3338 RSC.
- W. Lv, T. S. Yang, Q. Yu, Q. Zhao, K. Y. Zhang, H. Liang, S. J. Liu, F. Y. Li and W. Huang, Adv. Sci., 2015, 2, 1500107 CrossRef.
- Q. Zhao, X. B. Zhou, T. Y. Cao, K. Y. Zhang, L. J. Yang, S. J. Liu, H. Liang, H. R. Yang, F. Y. Li and W. Huang, Chem. Sci., 2015, 6, 1825 RSC.
- K. Y. Zhang, J. Zhang, Y. H. Liu, S. J. Liu, P. L. Zhang, Q. Zhao, Y. Tang and W. Huang, Chem. Sci., 2015, 6, 301 RSC.
- S. J. Liu, J. Zhang, D. F. Shen, H. Liang, X. M. Liu, Q. Zhao and W. Huang, Chem. Commun., 2015, 51, 12839 RSC.
- S. J. Liu, H. B. Sun, Y. Ma, S. H. Ye, X. M. Liu, X. H. Zhou, X. Mou, L. H. Wang, Q. Zhao and W. Huang, J. Mater. Chem., 2012, 22, 22167 RSC.
- Q. Yu, K. Y. Zhang, H. Liang, Q. Zhao, T. S. Yang, S. J. Liu, C. Q. Zhang, Z. J. Shi, W. J. Xu and W. Huang, ACS Appl. Mater. Interfaces, 2015, 7, 5462 CAS.
- D. L. Ma, H. Z. He, K. H. Leung, D. S. H. Chan and C. H. Leung, Angew. Chem., Int. Ed., 2013, 52, 7666 CrossRef CAS PubMed.
- L. Lu, D. S. H. Chan, D. W. J. Kwong, H. Z. He, C. H. Leung and D. L. Ma, Chem. Sci., 2014, 5, 4561 RSC.
- D. L. Ma, D. S. H. Chan and C. H. Leung, Acc. Chem. Res., 2014, 47, 3614 CrossRef CAS PubMed.
- H. Yang, J. J. Qian, L. T. Li, Z. G. Zhou, D. Li, H. X. Wu and S. P. Yang, Inorg. Chim. Acta, 2010, 363, 1755 CrossRef CAS.
- Q. Zhao, C. Y. Jiang, M. Shi, F. Y. Li, T. Yi, Y. Cao and C. H. Huang, Organometallics, 2006, 25, 3631 CrossRef CAS.
- Q. Zhao, S. J. Liu, M. Shi, F. Y. Li, H. Jing, T. Yi and C. H. Huang, Organometallics, 2007, 26, 5922 CrossRef CAS.
- H. B. Wei, Z. F. Zhao, C. Wei, G. Yu, Z. W. Liu, B. Zhang, J. Bian, Z. Q. Bian and C. H. Huang, Adv. Funct. Mater., 2016, 26, 2085 CrossRef CAS.
Footnotes |
| † Electronic supplementary information (ESI) available: Details of NMR and MS spectra. See DOI: 10.1039/c6sc02837c |
| ‡ S. Guo and T. Huang contributed equally to this work. |
| This journal is © The Royal Society of Chemistry 2017 |