 Open Access Article
Creative Commons Attribution 3.0 Unported Licence
Self-generated hollow NaTi2(PO4)3 nanocubes decorated with graphene as a large capacity and long lifetime anode for sodium-ion batteries†
Shaocheng Yea,
Zhihong Lia,
Tianbing Songa,
Danhong Chenga,
Qunjie Xua,
Haimei Liu *a and
Yonggang Wang
 *b
*b
aShanghai Key Laboratory of Materials Protection and Advanced Materials in Electric Power, College of Environmental and Chemical Engineering, Shanghai University of Electric Power, Shanghai 200090, China. E-mail: liuhm@mail.buct.edu.cn
bDepartment of Chemistry, Shanghai Key Laboratory of Molecular Catalysis and Innovative Materials, Institute of New Energy, Fudan University, Shanghai 200433, China. E-mail: ygwang@fudan.edu.cn
First published on 15th December 2017
Abstract
NaTi2(PO4)3 is a promising anode material for sodium-ion batteries due to its sodium-super-ion-conductor type structure. However, the inherent low conductivity of the NaTi2(PO4)3 limits its cyclability and rate capability. Herein, to overcome these shortcomings, an electrode material that combines the hollow NaTi2(PO4)3 nanocubes with the reduced graphene oxide is synthesized by a simple hydrothermal method. The as-synthesized products demonstrate a high specific capacity of 128 mA h g−1, nearly achieving its theoretical capacity of the NaTi2(PO4)3 electrode at 0.1C; even when the discharging rate reached 50C, it still achieved a capacity retention of 60%. Simultaneously, the sample also shows stable cycling performance with a discharge capacity of 60 mA h g−1 after 500 cycles at a high rate of 20C. This excellent electrochemical performance of the NaTi2(PO4)3@rGO is attributed to the large surface area of the hollow structure and high conductivity of the three-dimensional reduced graphene oxide that facilitate the electrolyte to soak in, increase the contact area between the nanocubes and electrolyte, and speed up Na+/e− transfer in the nanocomposites. In addition, the unique hollow structure and the combination with the graphene could effectively accommodate the volume variation during repeated sodiation/desodiation processes.
Introduction
In recent years, sodium ion batteries (SIBs), characterized by low cost and abundance of sodium resources on earth,1 as an important supplement to lithium-ion batteries (LIBs), have been widely studied and applied on a small scale.2,3 However, with the deepening of the study for SIBs, researchers also found a lot of problems at the same time. One of the most prominent is that the ionic radius of Na+ (radius: 1.02 Å) is larger than that of Li+ (0.76 Å), and some materials used in the LIBs cannot be applied to SIBs though they have similar chemical properties and principles.4 Moreover, the larger ion radius of Na+ also leads to a lower energy density of SIBs compared to LIBs under the same conditions.4,5 For the above reasons, the development of suitable electrode materials which exhibit stable capability and fast Na+ intercalation/extraction is a big challenge for SIBs.At present, the study of cathode materials of SIBs has made great progress and found many cathode materials that can meet the demands, such as Na3V2(PO4)3,6–8 NaFePO4,9–11 Na0.44MnO2,12–14 Na2/3Co2/3Mn1/3O2,15,16 and Na4Fe3(PO4)2(P2O7).17,18 However, for the anode materials of SIBs, there have been somewhat few studied, mainly including metal alloys,19–21 and metal oxides.22–24 Among them, the volume of the metal alloy is easy to expand during the sodium ion insertion and extraction, resulting in poor electrochemical performance,25 and the cycle performance of the metal oxide also is very poor, and these shortcomings make them far from ideal in practical application.24 Fortunately, the “zero-stress” framework of the typically NASICON-type NaTi2(PO4)3 have generated huge interest in recent years due to the high theoretical capacity of 133 mA h g−1, high Na+ conductivity and excellent electrochemical performance.26–31
However, some literatures about the NaTi2(PO4)3 exhibit poor rate capability and cyclability due to the low intrinsic electrical conductivity and kinetics of sodium ions in the NaTi2(PO4)3 samples.5,25,32 In order to overcome the various limitations of NaTi2(PO4)3, many strategies including particle size reduction,26 carbon coating,33–36 and compositing with conductive carbonaceous materials have been reported. Wang et al. demonstrated the controllable synthesis to fabricate the porous NTP nanocubes by one-pot solvethermal method.34 The products showed excellent cycling stability with 75.5% capacity retention over 10![[thin space (1/6-em)]](https://www.rsc.org/images/entities/char_2009.gif) 000 cycles at 10C. After the careful analysis, they thought that the unique nanostructures can effectively improve the electrochemical performances. Cao et al. proposed and realized a promising structural design an ordinary of NTP through layered graphene-embedding process by using a simple spray-drying method.25 The outstanding electrochemical performance of 3D graphene decorated NTP microspheres was described in detail. This work proposed a simple method to fabricate the uniquely structure of the material which can effectively improve the electrochemical performance.
000 cycles at 10C. After the careful analysis, they thought that the unique nanostructures can effectively improve the electrochemical performances. Cao et al. proposed and realized a promising structural design an ordinary of NTP through layered graphene-embedding process by using a simple spray-drying method.25 The outstanding electrochemical performance of 3D graphene decorated NTP microspheres was described in detail. This work proposed a simple method to fabricate the uniquely structure of the material which can effectively improve the electrochemical performance.
Hollow nanostructure materials are widely used in various fields, such as technology, catalysis, energy conversion, adsorption, drug deliver and gas sensor.37–40 Because of the unique structures which have uniform size, regular shape, large surface area, and so on. Especially in the area of LIBs, great achievements have been made. Lou et al. reported that the synthesis of double-shelled CoMn2O4 hollow microcubes via a facile co-precipitation and annealing method.41–44 When used as an anode material for LIBs, the as-synthesized CoMn2O4 hollow structure shows a high specific capacity and good cycling performance. The hollow porous SiO2 nanocubes had been prepared by Chen et al. as anode materials for LIBs synthesized by two-step hard-template method.42 The reduced the expanding volume of structure during Li+ insertion/extraction and the allowed rapid access of Li+ during reversible cycling were due to the unique hollow nanostructure which has large volume and numerous cracks, which improved the performance of SiO2 electrodes.
In this work, we firstly demonstrate a facile one-step hydrothermal method to prepare hollow NaTi2(PO4)3 nanocubes@reduced graphene oxide (H-NTP NC@rGO), and it is proposed by a possible growth mechanism of the uniform hollow nanocubes constructed by iso-oriented tiny nanocrystals that are built by bottom-up assemblies of many nanocrystals with a mutual growth orientation, which has been reported in previous work.45 Hollow NaTi2(PO4)3 nanocubes with internal and external surface have larger surface area, and can increase the contact area with the electrolyte, which can reduce sodium diffusion path length and improve ion conductivity to increase the electrochemical performances. Moreover, to further enhance the electrochemical properties of the material, a practical way is to embed nanostructured NaTi2(PO4)3 in highly conductive graphene frameworks. An electronic wiring pathways formed by the graphene among the NaTi2(PO4)3 particles not only improves the electronic conductivity but also plays the role of volume change buffer during the repeated Na+ insertion/extraction process.
Experimental section
Materials synthesis
Materials characterization
The product X-ray diffraction patterns were measured at the 2θ range from 10° to 60° at the scanning of 3 min−1 rate in using the Bruker D8 advance at 40 kV and 40 mA with Cu-Kα radiation (λ = 0.154 nm). The SEM of the samples were investigated by using field-emission scanning electron microscopy (FESEM, Zeiss Supra 55). The HRTEM images were obtained using a high-resolution transmission electron microscope (Hitachi H-800) and energy-dispersive X-ray spectroscopy (EDX). The Raman spectroscopy was performed at Raman spectroscopy (LabRAM) with a 633 nm Ar-ion laser. The content of rGO in the sample was measured by thermogravimetric analysis (TGA; STA409PC) at a heating rate of 5 °C min−1 in air. The XPS spectra were performed on a PHI Quantera SXM scanning X-ray microprobe with a 100 mm beam size, using an Al Kα (hn = 1486.7 eV, l = 0.83 nm) X-ray source operated at 2 kV and 20 mA. The Brunauer–Emmett–Teller (BET) equation from the nitrogen adsorption data was used to calculate the specific surface area.Electrochemical measurement
The electrochemical measurements of the samples (the NaTi2(PO4)3@rGO hollow nanocube or the pure NaTi2(PO4)3) are carried out by using CR2016-type coin half-cells. The working electrode was prepared from a mixture of 70 wt% active material, 20 wt% Super P and 10 wt% of poly(vinyl difluoride) PVDF onto a Cu foil. The fabrication of the electrode is that the mixture of active material, Super P and PVDF was treated with ball mill for two hours. Then the mixture was uniformly tiled on Cu foil that was used as current collector. Finally the electrode was dried under vacuum at 80 °C for 12 h. The average mass loading of the active material was about 1.5–1.8 mg cm−2. 1 M NaClO4 dissolved in ethylene carbonate (EC)/diethyl carbonate (DEC) which the volume ratio is 1![[thin space (1/6-em)]](https://www.rsc.org/images/entities/char_2009.gif) :
:![[thin space (1/6-em)]](https://www.rsc.org/images/entities/char_2009.gif) 1 was used as the electrolyte, and the metallic Na was used as anode. To avoid short circuit the septum was the glass microfiber fiber (Whatman GF/C). All the half-cells were fabricated in an argon-filled glove box with the concentrations of oxygen and water below 1 ppm. The galvanostatic charge–discharge were measured at different current densities in the voltage range from 1.2 V to 2.8 V vs. Na+/Na on LAND CT2001A test system. Cyclic voltammetry was measured on an electrochemical workstation (CHI650D).
1 was used as the electrolyte, and the metallic Na was used as anode. To avoid short circuit the septum was the glass microfiber fiber (Whatman GF/C). All the half-cells were fabricated in an argon-filled glove box with the concentrations of oxygen and water below 1 ppm. The galvanostatic charge–discharge were measured at different current densities in the voltage range from 1.2 V to 2.8 V vs. Na+/Na on LAND CT2001A test system. Cyclic voltammetry was measured on an electrochemical workstation (CHI650D).
Results and discussion
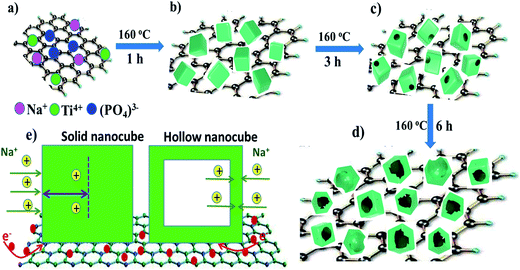
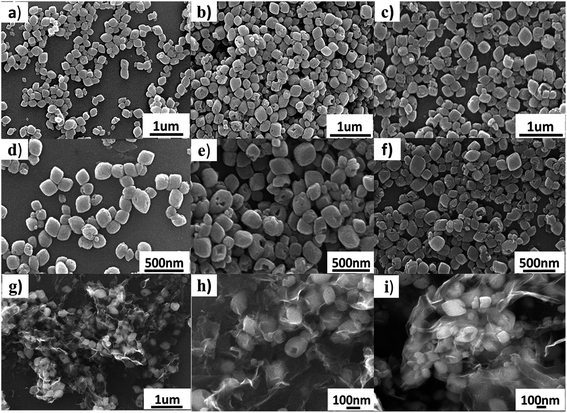
Fig. 1 shows a schematical illustration of the procedure of generating hollow NaTi2(PO4)3 nanocubes@reduced graphene oxide (H-NTP NC@rGO). Typically, CH3COONa, (C4H9O)4Ti, and phosphoric acid that used as raw materials for the preparation of NaTi2(PO4)3 nanocubes were dissolved in ethanol, and then the graphene oxide was added into the mixed solution. After a high temperature hydrothermal process at 160 °C for 1 hour, it was proposed that a large number of solid NaTi2(PO4)3 nanocubes (S-NTP NC) had been generated in Fig. 1b, which was significantly shorter than the time required for the previously reported literature.41,42,46 In Fig. 1c, when the hydrothermal time was 3 hours, some voids had been found in nanocubes at different positions, which mean that the nanocubes had begun a new morphological change. When the hydrothermal time was extended to 6 hours, mesopores-like cavities had appeared in the NaTi2(PO4)3 nanocubes in Fig. 1d. The unique hollow nanocube structure will be very beneficial to improve the electrochemical properties of the NaTi2(PO4)3 material. Specifically, compared to the solid nanocubes, the nanosize materials provide short distances for Na+ diffusion and large electrode–electrolyte contact area for high Na+ flux across the interface in Fig. 1e, leading to better rate capability. However, when the hydrothermal time was 9 hours shown in Fig. S1,† some of hollow structured NaTi2(PO4)3 samples showed collapsed and even some nanoparticles appeared agglomeration, leading to the reducing of the specific surface area of the material, which have a negative impact on the materials electrochemical properties. In addition, the structural strain and volume change associated with the repeated Na+ insertion/extraction processes could be buffered effectively by the porosity and interior void space, thus improving the cycling stability. In addition, graphene has a very good conductivity. The graphene oxide added before the hydrothermal reaction not only can be reduced to form reduced graphene oxide but also enables to completely coat the formed NaTi2(PO4)3 nanocubes, which further enhances the conductivity of the material.To investigate the growth process of generating hollow NaTi2(PO4)3 nanocubes (H-NTP NC), the NaTi2(PO4)3 precursor with different hydrothermal times was investigated in detail from 1 hour to 6 hours as illustrated in Fig. 2a–f by SEM images. Fig. 2a and d shows the SEM images of the NaTi2(PO4)3 materials through the hydrothermal process at 160 °C for 1 hour. It can be seen that many solid nanocubes have been formed and distributed evenly. With the extension of the hydrothermal reaction time, as in Fig. 2b and e, the morphology of the nanocubes is still maintained, but it has already begun to change and there are some voids in these nanocubes for 3 hours. Fig. 2c and f are the products of the H-NTP NC samples under the hydrothermal condition of 160 °C and 6 h. Clearly seen in Fig. 2c that it shows very neatly arranged nanocubes, and the hollow structure of the nanocubes can be seen via the further amplification in Fig. 2f. At the same time, it was further confirmed the morphology by transmission electron microscopy (TEM) analyses of the S-NTP NC and H-NTP NC samples. Fig. S2a–c† show the TEM images of the S-NTP NC samples. Lots of neatly arranged nanocubes can be observed, and in addition, by carefully anatomizing pictures including dark spots and highlights (Fig. S2a and g†), the porosity of the materials is also confirmed, which has been described in the previous literature.45 From the TEM images of the H-NTP NC samples, we can find that except of the same porous structure as the solid nanocubes, an obvious hollow structure of the H-NTP NC samples is observed in Fig. S2d–f,† which corresponds to analysis results from the SEM.
These fully shows that through the hydrothermal process of 160 °C and 6 h, the H-NTP NC samples can be generated, which perfectly complies with our schematic and ideas. And then, H-NTP NC@rGO was prepared successfully via the hydrothermal process at 160 °C for 6 h. Morphologies of the H-NTP NC@rGO samples were characterized by SEM, which shown in Fig. 2g–i. As can be seen from the figure, graphene and nanocubes have mixed evenly, and the nanocubes are completely coated with graphene, which will be conducive to significantly improve the conductivity of the material. In addition, hollow structure of the nanocubes still can be clearly seen in Fig. 2h and i, which obviously increases the surface area of the material, and improves the contact area with the electrolyte, thus will be conducive to the infiltration of electrolyte.
The carbon content of the samples is about 15.36% by TG analysis that carried out from 25 °C to 1000 °C in an air atmosphere shown in Fig. S3a,† which completely conforms to the design requests for the preparation of electrode materials. The existence of the graphene network is also confirmed by Raman spectra which reveal pronounced D and G bands at around 1358 and 1599 cm−1, respectively (Fig. S3b†). Compared to a similar sample of S-NTP NC@rGO sample (hydrothermal time of 1 h) with ID/IG = 1.09, the H-NTP NC@rGO samples shows a lager peak intensity ration of the D to G bands (ID/IG = 1.13), indicating the defective degree of the graphene becomes larger after reduction,47,48 and hence high electronic conductivity, resulting in remarkable rate-performance of H-NTP NC@rGO. Fig. S3c† shows the TG analysis of the pure NaTi2(PO4)3 and it is clearly displayed that, for pure NaTi2(PO4)3, there is nearly no weight loss from 400 °C to 700 °C, which indicates the absence of the carbon in this sample.
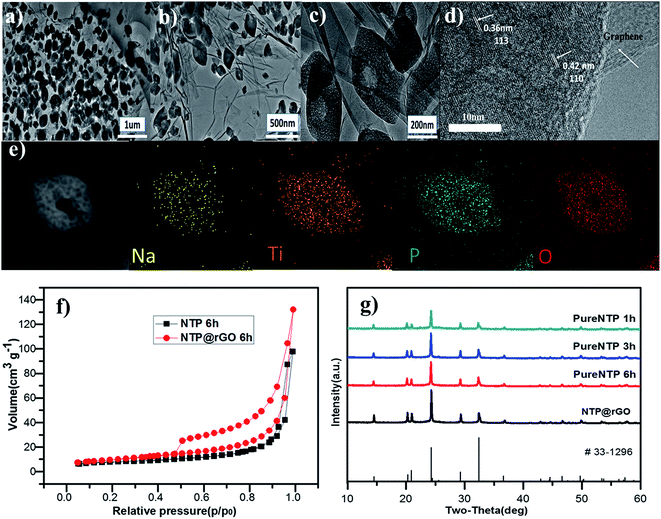
To further understand the structure of the H-NTP NC@rGO anode material, TEM was applied to observe the hollow NaTi2(PO4)3 nanocubes coated with graphene. Fig. 3a–c shows the low-magnification TEM image of the H-NTP NC@rGO samples. Obviously, Fig. 3a and b displays that the nanocubes are neatly arranged and uniform in size. As can be seen from Fig. 3c, the nanocubes are evenly wrapped in graphene at first. Secondly, the length of the nanocubes is about 200–300 nm. Finally, it is clearly seen that the middle of the nanocube is hollow from the photo perspective of a single nanocube. A high-resolution TEM (HRTEM) image in Fig. 3d shows clear lattice fringes. The widths of 0.36 nm and 0.42 nm between neighboring lattice fringes can be ascribed to (113) and (110) planes of NTP. Fig. 3e shows energy dispersive spectrum (EDS) of Na, Ti, P and O with uniformly distributed, and once again, the hollow structure and porous surface of the NTP can be noticeably observed.
The above hollow structure and porous surface is believed to be beneficial for its electrochemical performance for an electrode material. In order to further determine the hollow structure and check the surface area of various samples, N2 adsorption–desorption measurements were carried out. In Fig. 3f, it is verified that the H-NTP NC samples and the H-NTP NC@rGO have specific surface areas of 26.525 and 36.112 m2 g−1, respectively. However, the specific surface area of the S-NTP NC samples and the S-NTP NC@rGO samples is only 23.711 and 33.676 m2 g−1 (Fig. S4†). It is clear that the specific surface area of the hollow structure is larger than it of the solid structure, which not only significantly enlarges the contact area between the active material and electrolyte, but also facilitates fast transport of Na+ ion/electrons. To further indentify the samples of the different hydrothermal reaction time, the XRD pattern of the as-prepared samples are described in Fig. 3g, which is consistent with the pattern of NaTi2(PO4)3 (JCPDS#33-1296).5,32 The diffraction peaks of sharp and strong imply that the NaTi2(PO4)3 samples have a highly crystallinity without any parasitic phase. Furthermore, the crystal planes of NaTi2(PO4)3 in TEM images such as (110) and (113) also correspond to the strongest diffraction peaks.
The XPS is used to determine the surface chemical bonding state of the H-NTP NC@rGO (Fig. 4a–c). According to Fig. 4b and c the high-resolution XPS spectra of C 1s and O 1s can be well fitted, respectively. The C 1s peaks of the samples is fitted by four peaks, corresponding to C![[double bond, length as m-dash]](https://www.rsc.org/images/entities/char_e001.gif) C/C–C (284.6 eV), C–O (286.1 eV), C
C/C–C (284.6 eV), C–O (286.1 eV), C![[double bond, length as m-dash]](https://www.rsc.org/images/entities/char_e001.gif) O (287.0 eV), and O–C
O (287.0 eV), and O–C![[double bond, length as m-dash]](https://www.rsc.org/images/entities/char_e001.gif) O (288.5 eV), which is similar with the literature and report. In Fig. 4c and d, we can clearly find that compared with the S-NTP NC samples containing only a peak (530.6 eV) attributed to the lattice Ti–O–Ti, the H-NTP NC@rGO samples reveal another two O 1s peaks at 532.1 eV and 533.2 eV corresponding to Ti–O–C and C–O–C/C–OH, which is consistent with the C 1s peaks.5 The results indicate that the rGO and the H-NTP NC samples exist the chemical bonds, which also confirm that the NaTi2(PO4)3 are strongly anchored on the surface of rGO, and the 3D rGO network can provide more electron transport channels, contributing to a super long cycle and rate capability. Fig. S5† shows the high resolution spectrum of Ti 2p for the H-NTP NC and H-NTP NC@rGO. The spectrum of both samples were deconvoluted into two peaks at 460.2 and 465.9 eV, which were matching to Ti 2p3/2 and Ti 2p1/2 by Gaussian curve fitting and consistent with the chemically bonded of Ti4+.49–51
O (288.5 eV), which is similar with the literature and report. In Fig. 4c and d, we can clearly find that compared with the S-NTP NC samples containing only a peak (530.6 eV) attributed to the lattice Ti–O–Ti, the H-NTP NC@rGO samples reveal another two O 1s peaks at 532.1 eV and 533.2 eV corresponding to Ti–O–C and C–O–C/C–OH, which is consistent with the C 1s peaks.5 The results indicate that the rGO and the H-NTP NC samples exist the chemical bonds, which also confirm that the NaTi2(PO4)3 are strongly anchored on the surface of rGO, and the 3D rGO network can provide more electron transport channels, contributing to a super long cycle and rate capability. Fig. S5† shows the high resolution spectrum of Ti 2p for the H-NTP NC and H-NTP NC@rGO. The spectrum of both samples were deconvoluted into two peaks at 460.2 and 465.9 eV, which were matching to Ti 2p3/2 and Ti 2p1/2 by Gaussian curve fitting and consistent with the chemically bonded of Ti4+.49–51
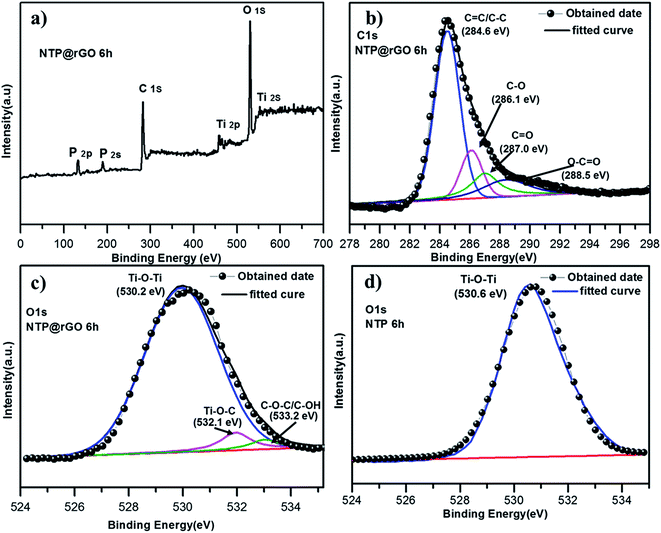 | ||
| Fig. 4 (a) XPS survey spectra; (b) C 1s; (c) O 1s peaks of the NaTi2(PO4)3@rGO; (d) O 1s peaks of the bare NaTi2(PO4)3. | ||
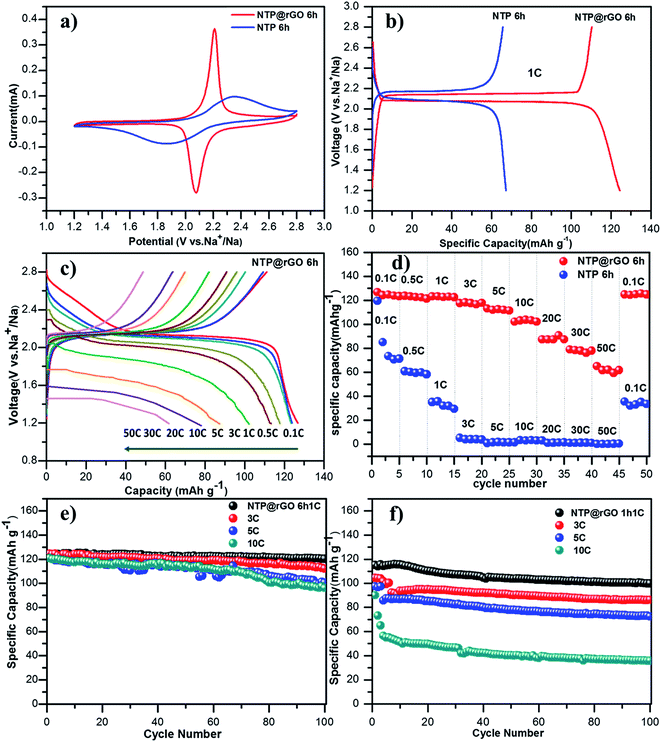
To evaluate the potential application in sodium-ion batteries, the electrochemical properties of the H-NTP NC@rGO anode was carried out in 2016-type coin cells at room temperature. The CV curves in Fig. 5a shows a pair of redox peaks with the potential window of 1.2–2.8 V (vs. Na/Na+) at a scanning rate of 0.1 mV s−1. The oxidation and reduction peaks were located at 2.2 V peak and 2.1 V, respectively, which indicate the phase transition of the H-NTP NC@rGO anode. However, the CV curves of the H-NTP NC@rGO electrode have more clear and sharp redox peaks than that of the H-NTP NC electrode, which indicates the low electrochemical polarization and ideal reversibility of the H-NTP NC@rGO electrode. And the reason of the excellent performance is attributed to the high conductivity of rGO framework in the H-NTP NC@rGO. The first charge and discharge profiles of the H-NTP NC@rGO electrode and the H-NTP NC electrode at 1C were shown in Fig. 5b. The initial discharge capacity of the H-NTP NC@rGO electrode is 128 mA h g−1 that is much higher than the capacity of the H-NTP NC electrode (67 mA h g−1), which means that 3D conductive graphene matrix does contribute to the improvement of the electrochemical properties of the H-NTP NC electrode. In addition, the charge–discharge curves show a charge/discharge plateau at about 2.1 V (vs. Na/Na+), and the polarization of the H-NTP NC@rGO is less than that of the H-NTP NC, which are consistent with the results of the CV curves. The rate capability of the H-NTP NC@rGO electrodes is carried out at first. The galvanostatic discharge/charge profiles of the H-NTP NC@rGO electrode with a potential window range from 1.2 and 2.8 V at the current density of 0.1C to 50C were shown in Fig. 5c. A discharge capacity of 128 mA h g−1 was obtained at 0.1C, which is close to the theoretical capacity of NaTi2(PO4)3 (133 mA h g−1).31,52–54 From the charge and discharge platform can be seen, the polarization of the electrode is very small, and with the increasing of the current density, the polarization is growing. However, even if the current density is up to 50C, a specific discharge capacity of 63 mA h g−1 is also achieved, showing the excellent rate capability of the obtained H-NTP NC@rGO materials. As shown in Fig. 5d, the rate performance between the H-NTP NC@rGO and H-NTP NC electrode was tested by cycling at different current densities. It is noticeable that the H-NTP NC@rGO exhibits excellent the reversible capacities of 128, 125, 125, 118, 116, 106, 90, 78.9, and 63 mA h g−1 at 0.1, 0.5, 1, 3, 5, 10, 20, 30, and 50C, respectively. The discharge capacity of the H-NTP NC@rGO electrodes is much superior to that of the H-NTP NC electrodes. For H-NTP NC sample, it can hardly work even at 3C. In fact, it is easy to understand that the excellent electrochemical performance of the H-NTP NC@rGO sample may be ascribed to its unique hollow structure that enhanced the contact opportunity between the active materials and the electrolyte; on the other hand, the establishment of the 3D graphene network has promoted the significant increase of the electrons transfer among the whole electrode materials.
The above argument is further supported by the cycle performance test of various electrode materials. Fig. S6† shows the cycle performance of the electrode materials prepared under the different hydrothermal reaction time (1 h, 3 h, 6 h) at 1C. With the extension of the hydrothermal time, the materials developed from a solid structure to a hollow structure. In Fig. S6,† it can be obviously seen, the hollow structured electrodes (6 h) show the best electrochemical performance than the others. However, if without the conductive graphene, the electrochemical performance of all these pure NaTi2(PO4)3 samples is far from the practical application. Remarkably, after adding the graphene, the target sample of H-NTP NC@rGO exhibits excellent cycling performance, shown in Fig. 5e. It is noted that even after 100 cycles, there is no distinct capacity decay and maintains a high reversible capacity of 124, 118, 104 and 100 mA h g−1 at 1, 3, 5 and 10C, respectively, which exhibit the outstanding performance of long lifetime and the sodium-ion storage, and this performance is also superior to those similar NaTi2(PO4)3 electrodes reported previously (see Table S1†). However, for the solid sample of S-NTP NC@rGO electrodes, the electrode only delivers discharge capacities of 100, 90, 80, and 40 mA h g−1 under the same condition, respectively. From the above description, it fully demonstrates that the construction of a hollow structure and the design of 3D graphene can be used to promote the electrochemical properties of the material. This hollow structure can accommodate the volume change during the Na-ion insertion/extraction process and also shorten the diffusion path of Na+ and electrons. Moreover, the H-NTP embedding reticular graphene can provide large surface for the particles and the fast electronic transport.
Finally, the H-NTP NC@rGO samples exhibit stable long cycling performance at 3C and 20C (Fig. 6a). The electrode retains a high capacity of 103 mA h g−1 at 3C, even after 500 cycles, and the coulombic efficiency can be up to 99.8%, which confirms the excellent performance of long lifetime and high coulombic efficiency. It can even retain 63 mA h g−1 after 500 cycles at 20C, which may be due to the formation of a stable structure between the highly crystalline NaTi2(PO4)3 nanocubes and the 3D rGO network, as discussed earlier.
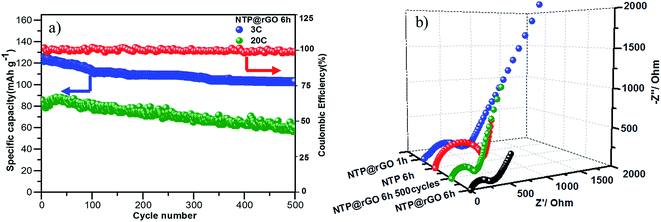 | ||
| Fig. 6 (a) Long-term cycling performance of the NTP@rGO-6 h composite at 3C and 20C over 500 cycles; (b) impedance spectra of the NaTi2(PO4)3 and NaTi2(PO4)3@rGO nanocube electrodes. | ||
In order to further understand the reasons of the as-prepared H-NTP NC@rGO electrodes with the excellent performance, the electrochemical impedance spectroscopy (EIS) measurements of the different samples were carried out. From Fig. 6b, it is apparently seen that the Nyquist plots are composed of an independent semicircles at high frequency regions and an inclined line at low frequency regions. In general, the semicircle is usually ascribed to summation of the contact, interface capacitance of electrode/electrolyte, and charge-transfer resistance (Rct), while the straight slopping line to the ion-diffusion processes into the host materials. As observed in the Nyquist plots, the Rct value of the H-NTP NC@rGO is merely ∼290 Ω that is far less than the H-NTP NC and the S-NTP NC@rGO, implying that the diffusion of Na+ in the NTP is quick enough. At the same time, it also shows that the hollow structure and graphene play a synergistic effect on the improvement of electrode ionic conductivity. In addition, the Rct value of the cycled battery after 500 cycles is smaller than that of the pristine cell, which implies that a well cycling performance is consistent well with the charge transfer resistances.
Conclusions
In summary, we successfully synthesized high crystallinity hollow NaTi2(PO4)3 nanocubes@rGO electrode materials through a simple one step hydrothermal method combined with high temperature calcination. Such novel architecture make the electrodes have the excellent electrochemical performance in terms of high rate-capability and long cycle-life. The electrode can delivers high reversible capacities at different current density, for example, 128 mA h g−1 at 0.1C; even keep considerably reversible capacity of 63 mA h g−1 at the high current density of 50C. In addition, significantly, during the long-term cycling performance test, after 500 cycles, a high reversible capacity of 103 mA h g−1 was achieved at a current density of 3C, maintaining 63 mA h g−1 of the discharge capacity at 20C. It can be shown that the outstanding electrochemical performances are due to the structure that effectively combines unique hollow NaTi2(PO4)3 nanocubes with highly conductive rGO. With the formation of the structure, the ion and electron transfer and the structural stability are significantly improved during Na-ion insertion/extraction. The results of this work provide a simple method to fabricate the structure of the anode materials which have outstanding electrochemical performance for energy storage.Conflicts of interest
There are no conflicts to declare.Acknowledgements
This work was financially supported by the National Nature Science Foundation of China (21336003, 21371021), the National Key Research Program of China (No. 2016YFB0901500) and Science and Technology Commission of Shanghai Municipality (No. 14DZ2261000).References
- H. Pan, Y.-S. Hu and L. Chen, Energy Environ. Sci., 2013, 6, 2338 CAS.
- S.-W. Kim, D.-H. Seo, X. Ma, G. Ceder and K. Kang, Adv. Energy Mater., 2012, 2, 710 CrossRef CAS.
- C.-X. Zu and H. Li, Energy Environ. Sci., 2011, 4, 2614 CAS.
- V. Palomares, P. Serras, I. Villaluenga, K. B. Hueso, J. Carretero-González and T. Rojo, Energy Environ. Sci., 2012, 5, 5884 CAS.
- H.-K. Roh, H.-K. Kim, M.-S. Kim, D.-H. Kim, K. Y. Chung, K. C. Roh and K.-B. Kim, Nano Res., 2016, 9, 1844 CrossRef CAS.
- W. Shen, H. Li, C. Wang, Z. Li, Q. Xu, H. Liu and Y. Wang, J. Mater. Chem. A, 2015, 3, 15190 CAS.
- W. Shen, C. Wang, H. Liu and W. Yang, Chem.–Eur. J., 2013, 19, 14712 CrossRef CAS PubMed.
- W. Shen, C. Wang, Q. Xu, H. Liu and Y. Wang, Adv. Energy Mater., 2015, 5, 1400982 CrossRef.
- Q. Liu, Z. Hu, M. Chen, Q. Gu, Y. Dou, Z. Sun, S. Chou and S. X. Dou, ACS Appl. Mater. Interfaces, 2017, 9, 3644 CAS.
- G. Ali, J. H. Lee, D. Susanto, S. W. Choi, B. W. Cho, K. W. Nam and K. Y. Chung, ACS Appl. Mater. Interfaces, 2016, 8, 15422 CAS.
- J. Kim, D.-H. Seo, H. Kim, I. Park, J.-K. Yoo, S.-K. Jung, Y.-U. Park, W. A. Goddard Iii and K. Kang, Energy Environ. Sci., 2015, 8, 540 CAS.
- K. Dai, J. Mao, X. Song, V. Battaglia and G. Liu, J. Power Sources, 2015, 285, 161 CrossRef CAS.
- M. Xu, Y. Niu, C. Chen, J. Song, S. Bao and C. M. Li, RSC Adv., 2014, 4, 38140 RSC.
- R. Qiao, K. Dai, J. Mao, T.-C. Weng, D. Sokaras, D. Nordlund, X. Song, V. S. Battaglia, Z. Hussain, G. Liu and W. Yang, Nano Energy, 2015, 16, 186 CrossRef CAS.
- D. Carlier, J. H. Cheng, R. Berthelot, M. Guignard, M. Yoncheva, R. Stoyanova, B. J. Hwang and C. Delmas, Dalton Trans., 2011, 40, 9306 RSC.
- J.-H. Cheng, C.-J. Pan, J.-F. Lee, J.-M. Chen, M. Guignard, C. Delmas, D. Carlier and B.-J. Hwang, Chem. Mater., 2014, 26, 1219 CrossRef CAS.
- J. Y. Jang, H. Kim, Y. Lee, K. T. Lee, K. Kang and N.-S. Choi, Electrochem. Commun., 2014, 44, 74 CrossRef CAS.
- H. Kim, I. Park, S. Lee, H. Kim, K.-Y. Park, Y.-U. Park, H. Kim, J. Kim, H.-D. Lim, W.-S. Yoon and K. Kang, Chem. Mater., 2013, 25, 3614 CrossRef CAS.
- L. Ji, M. Gu, Y. Shao, X. Li, M. H. Engelhard, B. W. Arey, W. Wang, Z. Nie, J. Xiao, C. Wang, J. G. Zhang and J. Liu, Adv. Mater., 2014, 26, 2901 CrossRef CAS PubMed.
- A. Darwiche, C. Marino, M. T. Sougrati, B. Fraisse, L. Stievano and L. Monconduit, J. Am. Chem. Soc., 2012, 134, 20805 CrossRef CAS PubMed.
- B. Farbod, K. Cui, W. P. Kalisvart, M. Kupsta, B. Zahiri, A. Kohaudehghan, E. Lotfabad, Z. Li, E. Luber and D. Mitlin, J. Am. Chem. Soc., 2014, 5, 4415 Search PubMed.
- Y. Cao, L. Xiao, W. Wang, D. Choi, Z. Nie, J. Yu, L. V. Saraf, Z. Yang and J. Liu, Adv. Mater., 2011, 23, 3155 CrossRef CAS PubMed.
- L. Wang, K. Zhang, Z. Hu, W. Duan, F. Cheng and J. Chen, Nano Res., 2013, 7, 199 CrossRef.
- Z. Jian, B. Zhao, P. Liu, F. Li, M. Zheng, M. Chen, Y. Shi and H. Zhou, Chem. Commun., 2014, 50, 1215 RSC.
- Y. Fang, L. Xiao, J. Qian, Y. Cao, X. Ai, Y. Huang and H. Yang, Adv. Energy Mater., 2016, 6, 1502197 CrossRef.
- C. Wu, P. Kopold, Y. Ding, P. AKen, J. Maier and Y. Yu, ACS Nano, 2015, 9, 6610 CrossRef CAS PubMed.
- Z. Li, D. Young, K. Xiang, W. C. Carter and Y.-M. Chiang, Adv. Energy Mater., 2013, 3, 290 CrossRef CAS.
- X. Wu, Y. Cao, X. Ai, J. Qian and H. Yang, Electrochem. Commun., 2013, 31, 145 CrossRef CAS.
- Q. Zhang, C. Liao, T. Zhai and H. Li, Electrochim. Acta, 2016, 196, 470 CrossRef CAS.
- Q. Zhang, Y. Guo, K. Guo, T. Zhai and H. Li, Chem. Commun., 2016, 52, 6229 RSC.
- S. I. Park, I. Gocheva, S. Okada and J.-i. Yamaki, J. Electrochem. Soc., 2011, 158, A1067 CrossRef CAS.
- J. Song, S. Park, J. Gim, V. Mathew, S. Kim, J. Jo, S. Kim and J. Kim, J. Mater. Chem. A, 2016, 4, 7815 CAS.
- D. Wang, Q. Liu, C. Chen, M. Li, X. Meng, X. Bie, Y. Wei, Y. Huang, F. Du, C. Wang and G. Chen, ACS Appl. Mater. Interfaces, 2016, 8, 2238 CAS.
- G. Yang, H. Song, M. Wu and C. Wang, J. Mater. Chem. A, 2015, 3, 18718 CAS.
- B. Zhao, Q. Wang, S. Zhang and C. Deng, J. Mater. Chem. A, 2015, 3, 12089 CAS.
- W. Wu, J. Yan, A. Wise, A. Rutt and J. F. Whitacre, J. Electrochem. Soc., 2014, 161, A561 CrossRef CAS.
- D. Chen and J. Ye, Adv. Funct. Mater., 2008, 18, 1922 CrossRef CAS.
- X. Lai, J. E. Halpert and D. Wang, Energy Environ. Sci., 2012, 5, 5604 CAS.
- B. Wang, H. Wu, L. Yu, R. Xu, T. T. Lim and X. W. Lou, Adv. Mater., 2012, 24, 1111 CrossRef CAS PubMed.
- K. Cheng and S. Sun, Nano Today, 2010, 5, 183 CrossRef CAS.
- L. Zhou, D. Zhao and X. W. Lou, Adv. Mater., 2012, 24, 745 CrossRef CAS PubMed.
- N. Yan, F. Wang, H. Zhong, Y. Li, Y. Wang, L. Hu and Q. Chen, Sci. Rep., 2013, 3, 1568 CrossRef PubMed.
- Q. Zhang, W. Wang, J. Goebl and Y. Yin, Nano Today, 2009, 4, 494 CrossRef CAS.
- J. Hu, M. Chen, X. Fang and L. Wu, Chem. Soc. Rev., 2011, 40, 5472 RSC.
- T. Wei, G. Yang and C. Wang, ACS Appl. Mater. Interfaces, 2017, 9, 31861 CAS.
- L. Zhou, D. Zhao and X. Lou, Angew. Chem., Int. Ed., 2012, 51, 239 CrossRef CAS PubMed.
- H. Kim, H. D. Lim, S. W. Kim, J. Hong, D. H. Seo, D. C. Kim, S. Jeon, S. Park and K. Kang, Sci. Rep., 2013, 3, 1506 CrossRef PubMed.
- S. Stankovich, D. A. Dikin, R. D. Piner, K. A. Kohlhaas, A. Kleinhammes, Y. Jia, Y. Wu, S. T. Nguyen and R. S. Ruoff, Carbon, 2007, 45, 1558 CrossRef CAS.
- H.-K. Roh, H.-K. Kim, K. C. Roh and K.-B. Kim, RSC Adv., 2014, 4, 31672 RSC.
- W. Ren, Z. Ai, F. Jia, L. Zhang, X. Fan and Z. Zou, Appl. Catal., B, 2007, 69, 138 CrossRef CAS.
- H. G. Yang, C. H. Sun, S. Z. Qiao, J. Zou, G. Liu, S. C. Smith, H. M. Cheng and G. Q. Lu, Nature, 2008, 453, 638 CrossRef CAS PubMed.
- S. Park, I. Gocheva, S. Okada and J. Yamaki, J. Electrochem. Soc., 2011, 158, A1067 CrossRef CAS.
- C. Delmas, F. Cherkaoui, A. Nadiri and P. Hagenmuller, Mater. Res. Bull., 1987, 22, 631 CrossRef CAS.
- G. Pang, P. Nie, C. Yuan, L. Shen, X. Zhang, J. Zhu and B. Ding, Energy Technol., 2014, 2, 705 CrossRef CAS.
Footnote |
| † Electronic supplementary information (ESI) available. See DOI: 10.1039/c7ra12291h |
| This journal is © The Royal Society of Chemistry 2017 |

