
 Open Access Article
 This Open Access Article is licensed under a Creative Commons Attribution-Non Commercial 3.0 Unported Licence
Electrospun polyacrylonitrile/β-cyclodextrin based porous carbon nanofiber self-supporting electrode for capacitive deionization
Hexuan Zhang,
Zhengzheng Xie,
Yanbo Wang,
Xiaohong Shang,
Pengfei Nie and
Jianyun Liu *
*
College of Environment Science and Engineering, State Environment Protection Engineering Center For Pollution Treatment and Control in Textile Industry, Donghua University, 201620 Shanghai, People's Republic of China. E-mail: jianyun.liu@dhu.edu.cn
First published on 5th December 2017
Abstract
With β-cyclodextrin (β-CD) as an additive, porous carbon nanofibers (PCNFβ-CD) with good graphitization have been fabricated by electrospinning polyacrylonitrile/β-cyclodextrin (PAN/β-CD) pristine fibers followed by preoxidation and carbonization. The nanopores were formed by the dehydration and decomposition of β-CD at high temperature. The specific surface area and pore density can be conveniently tuned by adding different amounts of β-CD in the precursor solution. The resultant porous carbon fibers were characterized by scanning electron microscopy, N2 adsorption/desorption analysis and fourier transform infrared spectroscopy. Raman analysis indicates that the graphitic network of the porous carbon is improved with the addition of β-CD. With the porous carbon fiber web as a self-standing electrode, the electrochemical properties of the electrodes were investigated by cyclic voltammetry and electrochemical impedance spectroscopy. PCNFβ-CD were employed as active electrodes for capacitive deionization (CDI). The optimal desalination amount of 11.65 mg g−1 was achieved on the PCNFβ-CD fabricated with the PAN/β-CD ratio of 1![[thin space (1/6-em)]](https://www.rsc.org/images/entities/char_2009.gif) :0.8, which is significantly higher than that of pure PAN-based carbon nanofibers. Multiple charge–discharge cycling of the CDI cell was tested and the regeneration of the electrode was demonstrated.
:0.8, which is significantly higher than that of pure PAN-based carbon nanofibers. Multiple charge–discharge cycling of the CDI cell was tested and the regeneration of the electrode was demonstrated.
1. Introduction
Capacitive deionization (CDI) is a desalination method for removing dissolved salts from saline water by their adsorption onto electrode surfaces with the formation of electric double-layers upon applying an external voltage between two oppositely charged carbon electrodes. Of late, attention has become focused on the development of CDI technology because of its advantages, such as low direct voltages, low operation pressure, low-cost, no-secondary pollution and environmentally-friendliness in water desalination.1,2 To achieve the desired desalination efficacy, the electrode materials must have the following characteristics such as high specific surface area, good electrical conductivity, robust chemical inertness, and large capacitance etc.3 Various porous carbon materials including activated carbon,4–6 carbon aerogels,7–9 ordered mesoporous carbon,10–12 carbon nanofibers,13,14 carbon nanotubes15–17 and graphene18,19 have been employed as the CDI electrode, due to high conductivity, high specific surface area and excellent chemical stability. Among of them, carbon nanofiber is an excellent candidate for ionic adsorption. It can be used as a self-supporting electrode with good electrical conductivity since no insulting adhesive (such as PTFE, PVDF) is added in the electrode. Recently, electrospinning technique, as a simple and low-cost method, has become a popular tool for producing carbon nanofibers.20 Polyacrylonitrile (PAN) is often used as a carbon source due to its good mechanical property and high carbon yield.21 However the resulting carbon fibers have low surface area owing to the lack of pores.13 Polymethyl methacrylate (PMMA), polystyrene (PS), polyvinyl alcohol (PVA) or dimethyl sulfone (DMSO2) have been mixed with PAN as the sacrificial components to obtain the porous carbon fibers.22–25 These chemicals can decompose and pores are formed upon carbonization at high temperature. However, the formation of nonuniform macro pores in the fibers often leads to the poor mechanical property of carbon fiber and low carbon yield. Some inorganic oxides such as ZnO, Al2O3 or SiO2, could also been used as pore-forming reagents to mix with the carbon precursor PAN.26,27 Following the carbonization at high temperature, these inorganic oxides can be removed by chemical etching and the pores are then formed. This procedure is undoubtedly complex and the aggressive process such as chemical etching is inevitable.28Cyclodextrins (CDs) are one class of the cyclic oligosaccharides compounds being composed of six or more α-(1-4)-linked D-glucopyranose units.29 There are α-CD, β-CDs and γ-CD corresponding to the D-glucopyranose of 6, 7 and 8 units. It presents a typical inner hydrophobic and outer hydrophilic structure. CDs are known to be a desirable carbon precursor which can dehydrate and decompose into a fine graphitic sp2 network during carbonization because of strong bonding between the CDs which would lead to an ordered structure.30,31 The cavity of CDs may contribute to the porosity of the resultant carbon. CDs can be dissolved compatibly in a PAN solution. The PAN/CD fibers have been prepared for adsorption application.32 However, to the best of our knowledge, the porous carbon fiber with CDs as both pore-forming reagent and carbon source has not yet been explored.
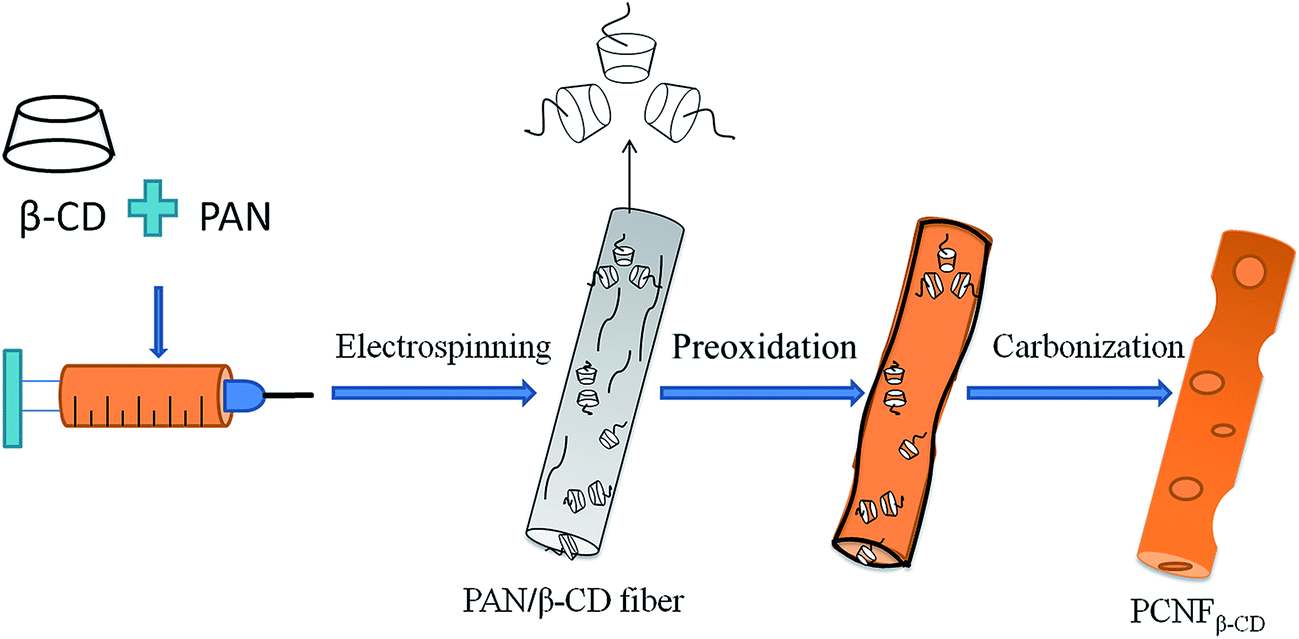
In this paper, the porous carbon nanofibers were fabricated by electrospinning the mixture of PAN and β-CD followed by heat treatment. In light of the dehydration and decomposition property of β-CD at high temperature, the meso/micropores can be formed in the nanofibers in one carbonization step, without additional activation. In addition, the pore density is tunable, depending on the PAN/β-CD ratio. The obtained porous carbon nanofiber (PCNFβ-CD) web is used as a self-supporting electrode in capacitor. The electrochemical behavior and CDI desalination properties of the PCNFβ-CD were investigated. This work presents a new way to the preparation of a porous carbon material with cyclodextrin as both a secondary carbon source and a pore-forming reagent.
2. Experimentals
2.1 Preparation of porous carbon nanofibers (PCNFs)
1 g of polyacrylonitrile (PAN, MW = 150000, Aldrich, 99.8%) was dissolved in a 10 mL of N,N-dimethyl formamide solvent (DMF, Sinopharm Chemical Reagents, 99.5%) to get a homogeneous PAN solution by stirring at 60 °C for 12 h. Different amount of β-cyclodextrin (β-CD, Sinopharm Chemical Reagent Co., Ltd) was then added into the PAN solution and stirred again to form the precursor solutions with different mass ratios of PAN/β-CD (PAN:β-CD = 1:0.4, 1:0.6, 1:0.8, 1:1). The PAN solution without β-CD (PAN:β-CD = 1:0) was used to prepare the control sample.
The electrospinning process is similar to the literature method,25 but a rotating drum wrapped with Al foil was used as a collector. The rotation rate of the drum was 60 rpm. The optimal operation parameters including the voltage of 15 kV, flow rate of 1 mL h−1 and tip-collector distance of 15 cm were used to get the uniform and continuous nanofibers (NFs). The pristine NFs (1:0), (1:0.4), (1:0.6), (1:0.8) and (1:1) were obtained by electrospinning the PAN/β-CD solution (1:0, 1:0.4, 1:0.6, 1:0.8 and 1:1), respectively.
The pristine nanofibers were heated till 260 °C at 2 °C min−1 in a furnace in an air atmosphere, and held at 260 °C for 90 min to get the pre-oxidized NFs. After cooling down, the samples were then transferred into a tube furnace for carbonization in N2 atmosphere. The fibers were heated under temperature-programmed heating conditions where the reaction temperature was raised to 800 °C at a rate of 5 °C min−1. After holding at 800 °C for 2 h, the furnace cooled down to room temperature to get the porous carbon nanofibers (PCNFβ-CD). The PCNFs derived from different pristine NFs (1:0, 1:0.4, 1:0.6, 1:0.8 and 1:1) were represented with PCNFβ-CD (1:0, 1:0.4, 1:0.6, 1:0.8 and 1:1), respectively.
2.2 Characterization
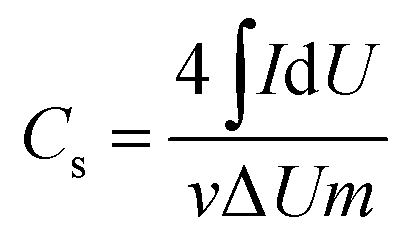
The morphology of electrospun nanofibers was examined by scanning electron microscopy (SEM, S-4800, Hitachi, Japan). Fourier transform infrared spectroscopy (FTIR) experiment was performed in a range of 400–4000 cm−1 using a Nicolet iN10 MX spectrometer (ThermoFisher, USA). Raman spectra were obtained with the inVia-Reflex from Britain. Thermal gravimetric (TG) analyzer (TGA 4000, PerkinElmer) was used for the study of the decomposition process of the samples. Nitrogen sorption analysis was carried out with porosimetry instrument (ASAP2020, Micromeritics). The specific surface area was obtained using Brunauer Emmette Teller (BET) calculation. The pore size distribution plots were recorded from the desorption part of the isotherms in light of the Barrette Joynere Halenda (BJH) model.33The electrochemical capacitor property of the electrode was investigated in a two-electrode cell using cyclic voltammetry (CV) on the CHI760D workstation (Shanghai Chenhua instrument Co., Ltd). The specific capacitance of the electrode was obtained from CV curves according to the equation:34,35
 | (1) |
The electrochemical impedance spectroscopy (EIS) (in 58.5 g L−1 NaCl) was carried out using the μAUTOLAB-III potentiostat (Metrohm, Switzerland) controlled by FRA software with a two-electrode cell system.
2.3 Capacitor assembly and desalination test
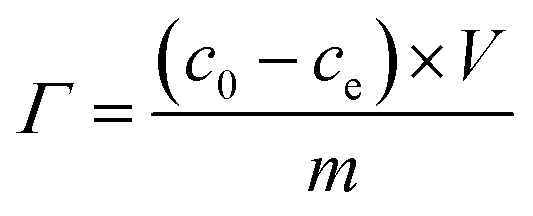
The obtained two pieces of PCNFβ-CD web were cut into a 50 mm × 70 mm sheet, and assembled into a CDI cell. The mass of each PCNFβ-CD sheet is around 70–80 mg. Before CDI test, 0.5 g L−1 NaCl solution was circulated in the cell by a peristaltic pump overnight to arrive at physical adsorption equilibration. The desalination experiment of the capacitor was performed in a 0.5 g L−1 NaCl aqueous solution (50 mL) by a battery test system (LANHE, CT2001A, Wuhan, China). All the desalination experiments were done at room temperature with a flow rate of 10 mL min−1. The desalination amount (Γ) was calculated with the following equation:34,36
 | (2) |
3. Results and discussion
3.1 Characterization of fibers
The surface morphology of the PAN/β-CD NFs at different heat treatment stages was investigated in order to understand the structural variation of fibers. Fig. 1 exhibits the SEM images of the PAN/β-CD NFs (1:0.8) in comparison with pure PAN-based pristine NFs (1:0) at different heat treatment stages. The pristine PAN/β-CD NFs present a rough surface. After carbonization, the obtained PCNFβ-CD exhibits a porous structure, and the pores are also found inside the fiber as shown in the cross-section image in the bottom-left inlay of Fig. 1F. In contrast, pure PAN-based pristine NFs (1:0) keep a smooth surface and no pores are found before and after heat treatment. The rough surface of fiber is probably caused by phase separation in the PAN/β-CDs composite owing to various evaporation ratio of solvent and/or hydrophobic–hydrophilic interaction.37 β-CD molecules are supposed to be bonded together tightly by hydrogen bonding interaction. Upon high temperature treatment, the cavity structure is broken with pores being formed in companying with the dehydration and decomposition of β-CD phase. Scheme 1 illustrates the pore-forming process of the PCNFβ-CD. In addition, the obtained porous fibers are still flexible (upper-right inlay of Fig. 1F) and easy to be handled as a self-supporting electrode for electrochemical experiment.
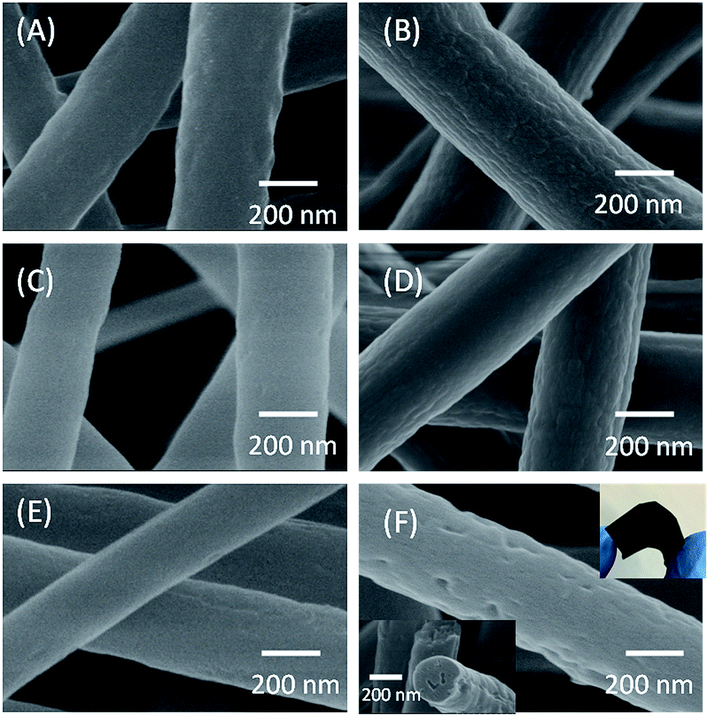 | ||
| Fig. 1 SEM images of the electrospun pristine nanofibers (A, B), pre-oxidized nanofibers (C, D), and PCNFβ-CD (E, F) made from pure PAN (A, C, E) and PAN/β-CD (B, D, F). The cross section image is at the left-bottom of (F). Upper-right inlay of image (F) is the photo image of the flexible PCNFβ-CD sheet. | ||
 | ||
| Scheme 1 The schematic illustration of the pore-forming progress on the PCNFβ-CD. | ||
Fig. 2 exhibits the SEM images of PCNFβ-CD obtained with different PAN/β-CD blend ratios. Clearly, with the increase of β-CD, the PCNFβ-CD surface became rougher and presents more pores. This further confirms that β-CD plays a major role in forming the pores in the PCNFβ-CD. Whereas the pores disappear when the PAN/β-CD ratio arrives at 1:1 (Fig. 2D), and some grooves are found, due to phase separation and shrinkage of fibers. Meanwhile, the fiber web becomes brittle, which makes CDI cell assembling difficult and causes poor conductivity in the further electrochemical study.
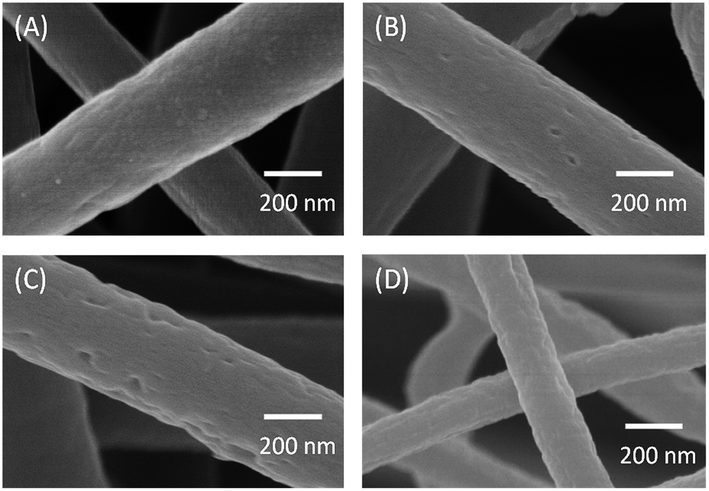 | ||
| Fig. 2 SEM images of the PCNFβ-CD produced with the PAN/β-CD ratio of (A) 1:0.4, (B) 1:0.6, (C) 1:0.8 and (D) 1:1. | ||
The TG analysis measurement was conducted in order to reveal the dehydration and decomposition of β-CD. Fig. 3 shows the TG curves of pristine PAN and PAN/β-CD fibers. Inset is the TG curve of pure β-CD. There is a slight weight loss below 100 °C for the pristine NF (1:0) sample owing to the release of residual DMF from the fiber, whereas for PAN/β-CD NFs, an obvious loss in weight is found at 60–100 °C due to the removal of the adsorbed H2O in β-CD. Following a plateau, there is a gradual weight loss stage starting at 220 °C, indicating the intramolecular or intermolecular dehydration of β-CD. As temperature further rises, β-CD phase continues to decompose. At the same time, the cyclization and carbonization of PAN phase occur when the temperature is over 300 °C. The low carbon residual is obtained compared with pristine NF (1:0). The production of large amount of H2O during decomposition of β-CD is supposed to be beneficial to the activation and the formation of micropores during carbonization.38
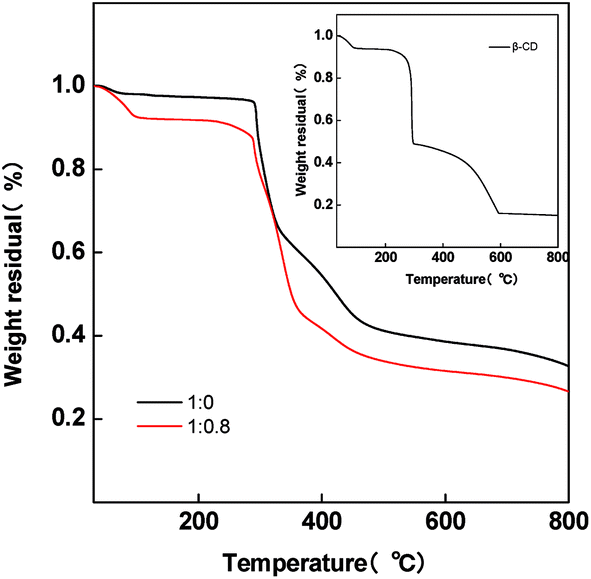 | ||
| Fig. 3 Thermo-gravimetric curves of pristine PAN/β-CD nanofibers (1:0 and 1:0.8). Inset is the TG curve of pure β-CD. | ||
The pore structure of PAN/β-CD with different blend ratios is examined by N2 adsorption/desorption isotherms, and the results are shown in Fig. 4. Generally, the N2 uptake at a low relative pressure range of 0 < p/p0 < 0.1 corresponds the relative volume of the micropores and the N2 uptake at pressure range of 0.5–0.6 indicates the existence of mesopores.39,40 The adsorption volume of the pure PAN-based PCNFβ-CD (1:0) is pretty low. It indicates that few pores exist in the fibers. With the addition of β-CD, there is an obvious increase of adsorption in the low relative pressure zone. A steeper increase is found for the PCNFβ-CD (1:0.8) sample, suggesting the presence of micro pores.41 Moreover, it exhibits a type I plus IV adsorption accompanied with a type H2/H3 hysteresis loop. This wide desorption hysteresis is usually due to the broad pore size distribution.42 The corresponding BET surface area and pore structure information of different PCNFβ-CD are summarized in Table 1. With the addition of the β-CD, the BET surface area and pore volume are improved obviously. In addition, the micropores are dominant in the fibers, which contributes to the specific surface area.43 However, PCNFβ-CD (1:1) obtained from high content of β-CD shows a poor performance due to severe shrinkage of the fibers and disappear of the pores, as observed in SEM image.
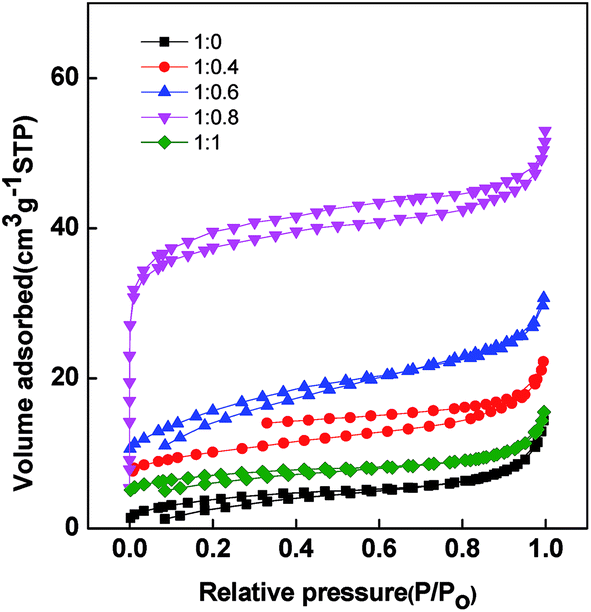 | ||
| Fig. 4 Nitrogen sorption isotherms for PCNFβ-CD obtained from different ratios of PAN/β-CD. | ||
| Samples | SBET (m2 g−1) | Vtotal (cm3 g−1) | Vmeso (cm3 g−1) | Vmicro (cm3 g−1) | Average pore size (nm) |
|---|---|---|---|---|---|
| PCNFβ-CD (1:0) |
12.2 | 0.020 | 0.018 | 0.003 | 6.17 |
| PCNFβ-CD (1:0.4) |
58.4 | 0.037 | 0.023 | 0.013 | 5.61 |
| PCNFβ-CD (1:0.6) |
92.7 | 0.043 | 0.029 | 0.014 | 4.62 |
| PCNFβ-CD (1:0.8) |
156.2 | 0.084 | 0.025 | 0.059 | 2.18 |
| PCNFβ-CD (1:1) |
20.0 | 0.027 | 0.015 | 0.013 | 6.33 |
Raman spectroscopy is used to analyze the graphitization level of the carbon materials. As shown in the Raman spectra in Fig. 5, two peaks are found at 1358 cm−1 and 1580 cm−1, which correspond to the characteristic D and G peaks of carbon materials, respectively.38,44 The D band is ascribed to the amorphous carbon and defective graphitic structures in PCNF, whereas the G band is assigned to the C![[double bond, length as m-dash]](https://www.rsc.org/images/entities/char_e001.gif) C stretching vibrations of graphite.45 The ratio of ID/IG is used to express the level of graphitization.46 The lower the ID/IG ratio is, the higher crystallization and graphitization are achieved. With the increase of PAN/β-CD ratios, G peak at the corresponding carbon fiber becomes clear and the ID/IG ratio becomes low, indicating the improvement of graphitization. Therefore, the high graphitic carbon fibers are obtained with the addition of β-CD, which is beneficial to the electrical conductivity of fibers.
C stretching vibrations of graphite.45 The ratio of ID/IG is used to express the level of graphitization.46 The lower the ID/IG ratio is, the higher crystallization and graphitization are achieved. With the increase of PAN/β-CD ratios, G peak at the corresponding carbon fiber becomes clear and the ID/IG ratio becomes low, indicating the improvement of graphitization. Therefore, the high graphitic carbon fibers are obtained with the addition of β-CD, which is beneficial to the electrical conductivity of fibers.
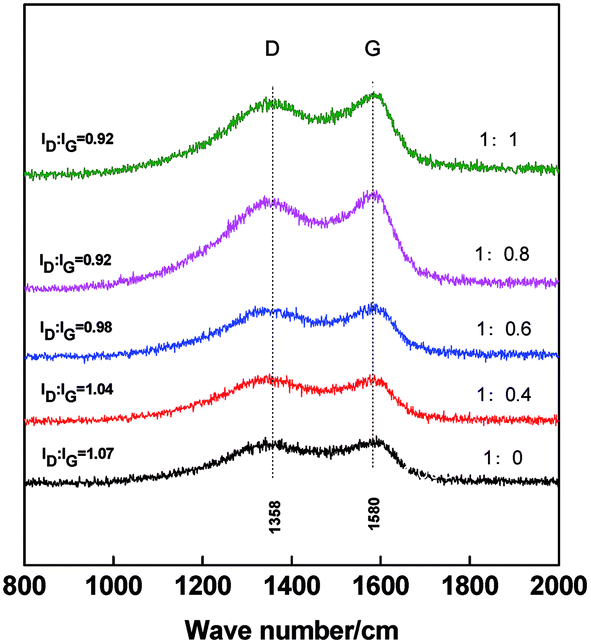 | ||
| Fig. 5 Raman spectra of PCNFβ-CD (1:0, 1:0.4, 1:0.6, 1:0.8 and 1:1). | ||
FTIR spectra of the nanofibers at different heat treatment stages were scanned as shown in Fig. 6. The curve a of Fig. 6 exhibits the typical absorbance spectrum of pure β-CD. The bands at 3382, 2926 and 1150 cm−1 are assigned to the stretching vibration of –OH, CH/CH2 and the coupled C–C–O groups, respectively.47 In PAN/β-CD, the characteristic vibration from β-CD was found at 3421, 2926 and 1160 cm−1. The band at 2250 cm−1 is assigned to the stretching vibration of nitrile group in PAN. It indicates the uniform doping of β-CD in the PAN fiber. After preoxidation and carbonization, the absorbance peaks of nitrile groups at 2280 cm−1 and C–C–O groups at 1020 cm−1 and 1150 cm−1 disappear, and the new bands at 2780 and 1100 cm−1 come out, indicating the decomposition of β-CD and occurrence of PAN cyclization.
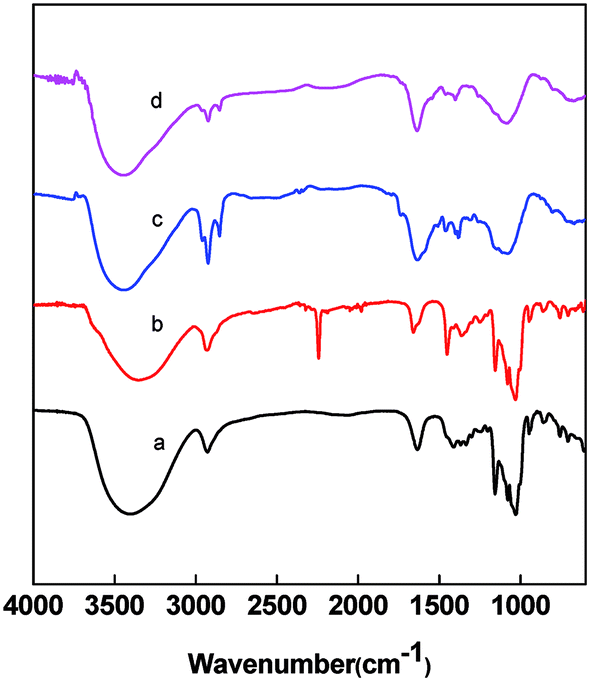 | ||
| Fig. 6 FTIR spectra of β-CD (a), pristine PAN/β-CD NF (b), preoxidized NF (c) and PCNFβ-CD (d). | ||
3.2 Electrochemical characterization
CV measurements are widely applied as an effective way to determine the capacitance characteristics of electrode materials. Fig. 7A shows the cyclic voltammograms of the PCNFβ-CD electrode in a 58.5 g L−1 NaCl aqueous solution. It presents the typical characteristics of the electric double layer capacitors. PCNFβ-CD (1:0) shows a low specific capacitance. Based on eqn (1), the capacitance of the nanofiber PCNFβ-CD (1:0) was calculated to be 9.5 F g−1. The low capacitance is due to the limited ion-adsorption sites and poor ionic diffusion at the nonporous carbon surface. With increasing the β-CD content, the CV curves become near to a rectangular shape, suggesting the rapid and efficient adsorption/desorption of ion at the electrode.48 It proves that there are rich pores in PCNFβ-CD, which facilitate the diffusion and transportation of ions. The higher the ratio of PAN/β-CD is, the larger the specific capacitance is, and a Cs value of 174.4 F g−1 is obtained at the PCNFβ-CD (1:0.8) electrode. However the capacitance current is pretty low on the PCNFβ-CD (1:1) electrode, due to the severe shrinkage of fibers and disappearance of pores.
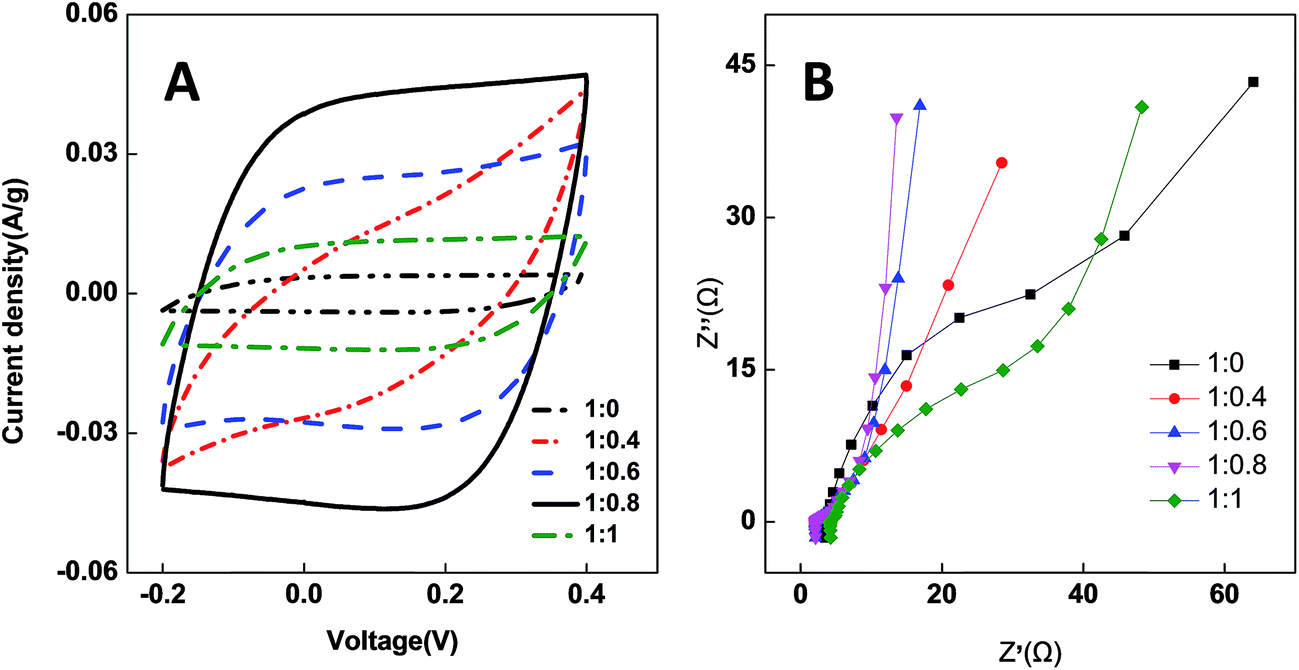 | ||
| Fig. 7 (A) CV curves of different PCNFβ-CD (1:0, 1:0.4, 1:0.6, 1:0.8 and 1:1) electrodes in 58.5 g L−1 NaCl aqueous solution. Scan rate: 1 mV s−1; (B) impedance plots of different PCNFβ-CD electrodes. | ||
EIS is used to determine the conductivity of CDI electrode and ionic diffusion properties.49 Fig. 7B shows the impedance plots of the PCNFβ-CD electrodes. The intersection of the curves at the real axis at the high-frequency position represents the cell resistance. The semicircle diameter represents the charge transfer resistance (Rct). The slope of line at the low-frequency range indicates the diffusion behavior of ions.50,51 PCNFβ-CD (1:0) presents a huge Rct and low slope, indicating a high resistance and poor ionic diffusion. In contrast, Rct of the PCNFβ-CD electrodes reduces greatly and the slope at low frequency becomes inclining towards the imaginary axis, indicative of the rapid diffusion/adsorption and improved capacitor behavior. The PCNFβ-CD (1:0.8) has the best conductivity and fastest ionic transportation, whereas PCNFβ-CD (1:1) presents high resistance due to breaking of carbon sheet and poor contact to current collector.
3.3 Capacitive deionization measurements
PCNFβ-CD sheets as a self-supporting electrode are assembled in parallel in the symmetric capacitor cell to evaluate the desalination performance of the electrodes. All the desalination experiments are performed in 0.5 g L−1 NaCl solution. The desalination is near to equilibration when a charge input of 2 mA h was used in a CDI cell, and additional adsorption is ignorable when more charge (2.5 mA h) was applied. Therefore, the constant current density during the charge process is applied and charging is terminated when the charge input of 2 mA h is achieved in the cell. The electrode performance can be reflected from the cell voltage during the charging process. Fig. 8A and B exhibit the voltage variation and solution conductivity variation of the CDI cell containing different PCNFβ-CD electrodes in one charging–discharging cycle, respectively. PCNFβ-CD (1:0), the control one, exhibits a fast voltage rising, indicative of low capacitance, and a pretty low variation of conductivity is obtained (Fig. 8B). In contrast, the PCNFβ-CD (1:0.8) electrode exhibits excellent capacitance characteristics, with a low cell voltage (around 1.25 V) at the end of charging step, and a fast conductivity descent is found in Fig. 8B, indicating a fast ion transportation and large salt adsorption capacity. PCNFβ-CD (1:1) shows a high IR drop upon a current being applied. This PCNFβ-CD (1:1) is fragile and hard to be assembled as a self-supporting electrode in the CDI cell. This may result in high resistance and unfavorable charge transportation along fibers. In light of the conductivity variation, the desalination amount (Γ) is calculated using eqn (2) and the Γ values of different electrodes are summarized in Table 2, together with the cell voltage. It concludes that the conductivity of the porous PCNFβ-CD electrode is increased, and the ion adsorption is improved with the addition of appropriate amount of β-CD. The desalination amount of 11.65 mg g−1 is achieved at the PCNFβ-CD (1:0.8) electrode, which is 5 times higher than that at the nonporous PCNFβ-CD (1:0) electrode. The CDI performance of the current PCNFβ-CD (1:0.8) electrode is compared with those reported in the literatures and the results are summarized in Table 3. The PCNFβ-CD (1:0.8) electrode presents an excellent desalination amount at the low voltage of 1.25 V, compared to other porous carbons or hybrid carbon material.
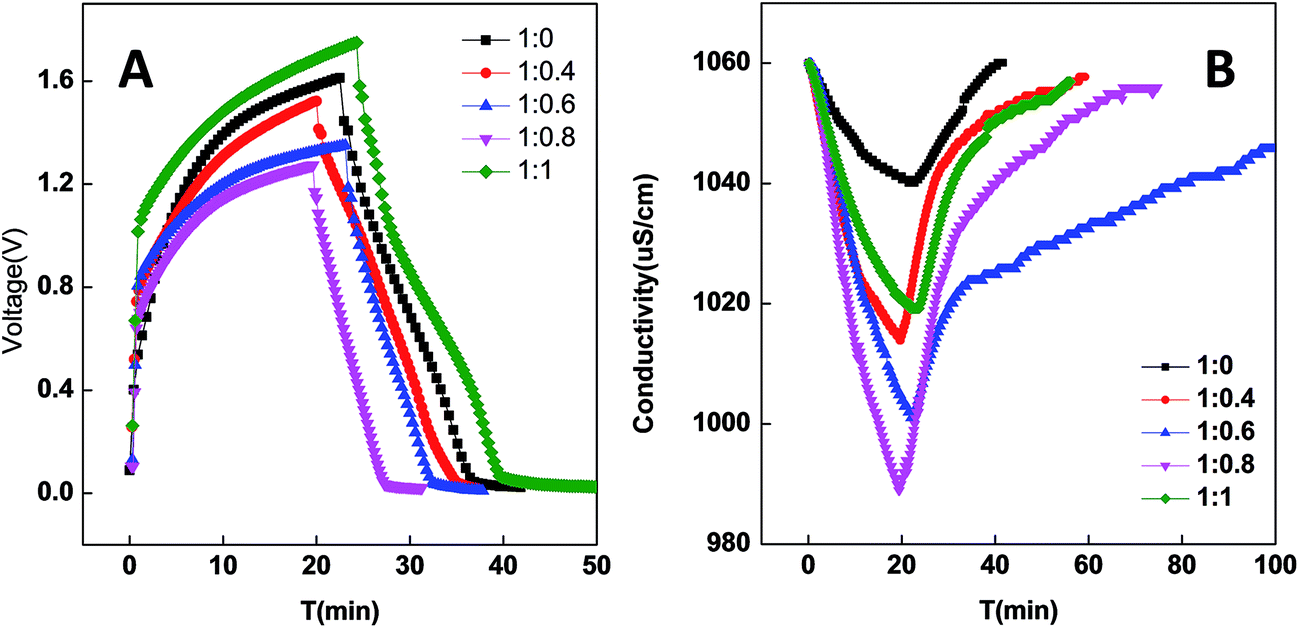 | ||
| Fig. 8 Voltage variation during a charge–discharge process of capacitor (A), and conductivity variation (B) of CDI cell. Charging current: 80 mA g−1, charge quantity: 2 mA h. | ||
| Electrodes | Cs (F g−1) | Terminal voltage (V) | IR drop (V) | Γ (mg g−1) |
|---|---|---|---|---|
| PCNFβ-CD (1:0) |
9.5 | 1.6 | 0.16 | 2.80 |
| PCNFβ-CD (1:0.4) |
100.8 | 1.5 | 0.14 | 6.74 |
| PCNFβ-CD (1:0.6) |
141.6 | 1.3 | 0.11 | 8.34 |
| PCNFβ-CD (1:0.8) |
174.4 | 1.2 | 0.10 | 11.65 |
| PCNFβ-CD (1:1) |
53.4 | 1.7 | 0.17 | 3.28 |
| Carbon material | Initial NaCl conc. (mg L−1) | Operating voltage (V) | Salt adsorption (mg g−1) | Ref. |
|---|---|---|---|---|
| a PMMA/CNF (porous carbon nanofibers derived with polymethyl methacrylate additive); ACNF (activated carbon nanofibers); DMSO2/PCNF (porous carbon nanofibers with dimethyl sulfone as additive); SG-CNF (carbon nanofibers with sulfonated graphene additive); RGO/ACNF (activated carbon nanofibers with reduced graphene oxide additive); SnO2/CNF (carbon nanofibers doped with SnO2). | ||||
| PMMA/PCNF | 45 | 1.2 | 1.9 | 14 |
| ACNF | 500 | 1.2 | 10.5 | 52 |
| DMSO2/PCNF | 500 | 1.2 | 8.1 | 25 |
| SG/CNF | 100 | 1.6 | 8.3 | 53 |
| RGO/ACNF | 100 | 1.2 | 7.2 | 54 |
| SnO2/CNF | 50 | 1.2 | 3.42 | 55 |
| β-CD/PCNF | 500 | 1.25 | 11.65 | This work |
The influence of current density on the desalination amount is investigated using a same charge input of 2 mA h. As shown in Fig. 9, there is a slight increase in salt adsorption as current increasing, but descend at high current density. At the same time we found that the terminal cell voltage arrived at 1.5 V at the current density of 120 mA g−1. The polarization may happen at high current density, resulting in the decrease of the desalination amount since high voltage may cause water electrolysis (>1.2 V). The low cell voltage in CDI is favorable for a stable desalination which avoids the oxidation of electrodes. This present PCNFβ-CD electrode can be operated in a wide current range of 60–100 mA g−1, in which a similar desalination amount is obtained. Considering that the fast desalination rate is obtained at high current density (dotted curve), 100 mA g−1 of current density is preferred.
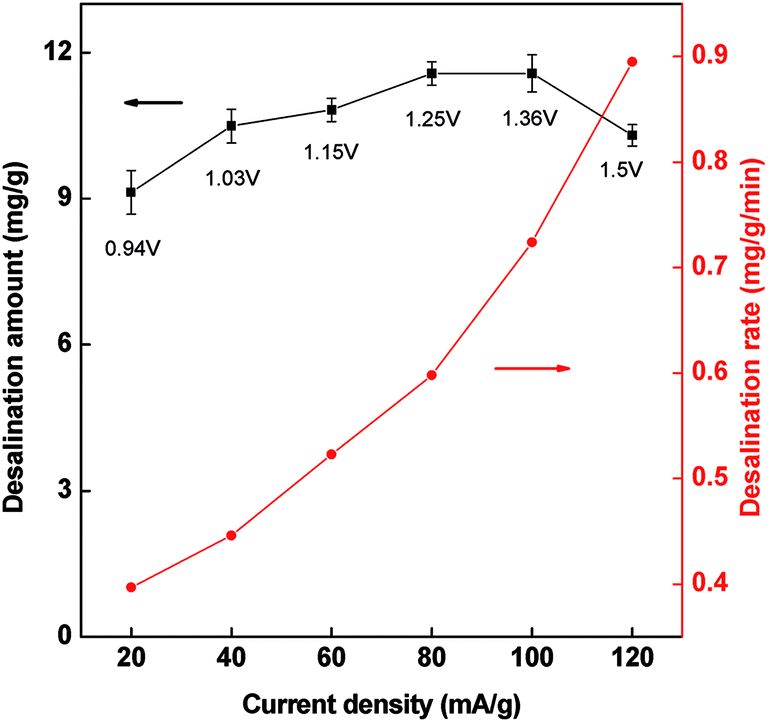 | ||
| Fig. 9 Desalination amount and desalination rate versus the current density in the CDI cell with PCNFβ-CD (1:0.8) as electrode. Charge input: 2 mA h. | ||
The cycle stability represents the regeneration performance of the CDI cell and the feasibility of practical application. The charging current was applied with the total charge amount of 2 mA h in each cycle. Fig. 10 shows the conductivity variation of solution with time in near 50 charge–discharge cycles in 0.5 g L−1 NaCl solution. At the charging current of 80 mA g−1, the charge process is slow, while it becomes fast and comparable desalination amount is achieved under 100 mA g−1 charging condition. There is only less than 85% decrease in desalination amount after 50 charge–discharge cycles. Therefore, the PCNFβ-CD electrode is stable and renewable for CDI.
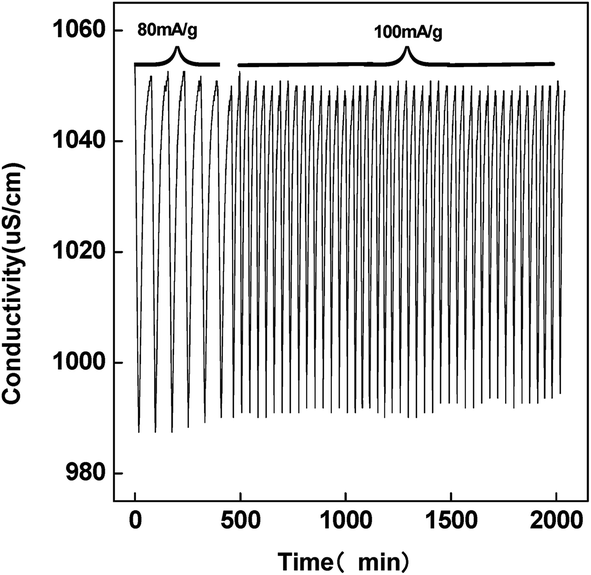 | ||
| Fig. 10 Conductivity variation with time in the PCNFβ-CD (1:0.8) capacitor cell during the continuous charge–discharge process by different current densities. | ||
4. Conclusion
In summary, the self-supporting porous carbon fibers have been fabricated by electrospinning PAN/β-CD followed by heat treatment. The meso/micro pores have been formed in the fibers due to the dehydration and decomposition of β-CD at high temperature. The obtained porous carbon fibers keep good flexibility with no break inside CDI cell. By adjusting the PAN/β-CD ratio, the PCNFβ-CD with high specific surface area and excellent electrochemical capacitor properties has been obtained. The optimal desalination amount of the electrode arrives at 11.65 mg g−1 with PCNFβ-CD as CDI electrodes, which is 4 times as much as that of pure PAN-derived carbon fiber.Conflicts of interest
There are no conflicts of interest to declare.Acknowledgements
This work was financially supported by National Nature Science Foundation of China (Grant No. 21476047, 21105009, 21776045), Foundation of State Key of Electroanalytical Chemistry (Grant No. SKLEAC201205).References
- C. Huyskens, J. Helsen and A. B. de Haan, Desalination, 2013, 328, 8–16 CrossRef CAS.
- Y. A. C. Jande and W. S. Kim, Sep. Purif. Technol., 2013, 115, 224–230 CrossRef CAS.
- T. J. Welgemoed and C. F. Schutte, Desalination, 2005, 183, 327–340 CrossRef CAS.
- J.-H. Choi, Sep. Purif. Technol., 2010, 70, 362–366 CrossRef CAS.
- J.-S. Kim and J.-H. Choi, J. Membr. Sci., 2010, 355, 85–90 CrossRef CAS.
- Y.-J. Kim and J.-H. Choi, Water Res., 2012, 46, 6033–6039 CrossRef CAS PubMed.
- P. Xu, J. E. Drewes, D. Heil and G. Wang, Water Res., 2008, 42, 2605–2617 CrossRef CAS PubMed.
- M. C. Zafra, P. Lavela, G. Rasines, C. Macías, J. L. Tirado and C. O. Ania, Electrochim. Acta, 2014, 135, 208–216 CrossRef CAS.
- L. Zou, G. Morris and D. Qi, Desalination, 2008, 225, 329–340 CrossRef CAS.
- Z. Peng, D. Zhang, T. Yan, J. Zhang and L. Shi, Appl. Surf. Sci., 2013, 282, 965–973 CrossRef CAS.
- C. Tsouris, R. Mayes, J. Kiggans, K. Sharma, S. Yiacoumi, D. DePaoli and S. Dai, Environ. Sci. Technol., 2011, 45, 10243–10249 CrossRef CAS PubMed.
- X. Wen, D. Zhang, L. Shi, T. Yan, H. Wang and J. Zhang, J. Mater. Chem., 2012, 22, 23835 RSC.
- A. G. El-Deen, N. A. M. Barakat, K. A. Khalil and H. Y. Kim, J. Mater. Chem. A, 2013, 1, 11001 (New J. Chem., 2014, 38, 198–205) CAS.
- A. G. El-Deen, N. A. M. Barakat, K. A. Khalil and H. Y. Kim, New J. Chem., 2014, 38, 198–205 RSC.
- H. B. Li, Y. Gao, L. K. Pan, Y. P. Zhang, Y. W. Chen and Z. Sun, Water Res., 2008, 42, 4923–4928 CrossRef CAS PubMed.
- Y. Liu, H. B. Li, C. Y. Nie, L. K. Pan and Z. Sun, Desalin. Water Treat., 2013, 51, 3988–3994 CrossRef CAS.
- D. Zhang, T. Yan, L. Shi, Z. Peng, X. Wen and J. Zhang, J. Mater. Chem., 2012, 22, 14696–14704 RSC.
- P. Liu, T. Yan, L. Shi, H. S. Park, X. Chen, Z. Zhao and D. Zhang, J. Mater. Chem. A, 2017, 5, 13907–13943 CAS.
- H. Wang, D. Zhang, T. Yan, X. Wen, J. Zhang, L. Shi and Q. Zhong, J. Mater. Chem. A, 2013, 1, 11778 CAS.
- Z.-M. Huang, Y. Z. Zhang, M. Kotaki and S. Ramakrishna, Compos. Sci. Technol., 2003, 63, 2223–2253 CrossRef CAS.
- L. Zhang, A. Aboagye, A. Kelkar, C. Lai and H. Fong, J. Mater. Sci., 2013, 49, 463–480 CrossRef.
- H. Niu, J. Zhang, Z. Xie, X. Wang and T. Lin, Carbon, 2011, 49, 2380–2388 CrossRef CAS.
- C. Tran and V. Kalra, J. Power Sources, 2013, 235, 289–296 CrossRef CAS.
- E. Jo, J.-G. Yeo, D. K. Kim, J. S. Oh and C. K. Hong, Polym. Int., 2014, 63, 1471–1477 CrossRef CAS.
- H. Pan, J. Yang, S. Wang, Z. Xiong, W. Cai and J. Liu, J. Mater. Chem. A, 2015, 3, 13827–13834 CAS.
- H. Zhao, W. Han, W. Lan, J. Zhou, Z. Zhang, W. Fu and E. Xie, Electrochim. Acta, 2016, 222, 1931–1939 CrossRef CAS.
- X. Xie, X. Yin, L. Song, P. Du, N. Li, L. Qi and J. Xiong, Thin Solid Films, 2017, 636, 710–716 CrossRef CAS.
- H.-J. Oh, J.-H. Lee, H.-J. Ahn, Y. Jeong, Y.-J. Kim and C.-S. Chi, Thin Solid Films, 2006, 515, 220–225 CrossRef CAS.
- T. Loftsson, K. Matthiasson and M. Masson, Int. J. Pharm., 2003, 262, 101–107 CrossRef CAS PubMed.
- X. Wang, W. Xing, B. Wang, P. Wen, L. Song, Y. Hu and P. Zhang, Ind. Eng. Chem. Res., 2013, 52, 3287–3294 CrossRef CAS.
- Z.-C. Yang, Y. Zhang, J.-H. Kong, S. Y. Wong, X. Li and J. Wang, Chem. Mater., 2013, 25, 704–710 CrossRef CAS.
- A. Heydari, H. Khoshnood, H. Sheibani and F. Doostan, Polym. Adv. Technol., 2017, 28, 524–532 CrossRef CAS.
- M. Hayati-Ashtiani, Part. Part. Syst. Charact., 2011, 28, 71–76 CrossRef.
- Y. Liu, T. Chen, T. Lu, Z. Sun, D. H. C. Chua and L. Pan, Electrochim. Acta, 2015, 158, 403–409 CrossRef CAS.
- M. D. Stoller and R. S. Ruoff, Energy Environ. Sci., 2010, 3, 1294 CAS.
- T. Wu, G. Wang, Q. Dong, B. Qian, Y. Meng and J. Qiu, Electrochim. Acta, 2015, 176, 426–433 CrossRef CAS.
- D. Noreña-Caro and M. Álvarez-Láinez, Mater. Des., 2016, 95, 632–640 CrossRef.
- J. Zhang, D. Xu, W. Qian, J. Zhu and F. Yan, Carbon, 2016, 105, 183–190 CrossRef CAS.
- X. Yu, J.-g. Wang, Z.-H. Huang, W. Shen and F. Kang, Electrochem. Commun., 2013, 36, 66–70 CrossRef CAS.
- X. Yu, C. Zhan, R. Lv, Y. Bai, Y. Lin, Z.-H. Huang, W. Shen, X. Qiu and F. Kang, Nano Energy, 2015, 15, 43–53 CrossRef CAS.
- X. Yu, J. Zhao, R. Lv, Q. Liang, C. Zhan, Y. Bai, Z.-H. Huang, W. Shen and F. Kang, J. Mater. Chem. A, 2015, 3, 18400–18405 CAS.
- H. Fan, F. Ran, X. Zhang, H. Song, W. Jing, K. Shen, L. Kong and L. Kang, J. Energy Chem., 2014, 23, 684–693 CrossRef.
- G. Hasegawa, M. Aoki, K. Kanamori, K. Nakanishi, T. Hanada and K. Tadanaga, J. Mater. Chem., 2011, 21, 2060 RSC.
- X. Liu, Y. Zhou, W. Zhou, L. Li, S. Huang and S. Chen, Nanoscale, 2015, 7, 6136–6142 RSC.
- E. Samuel, H. S. Jo, B. Joshi, H. G. Park, Y. I. Kim, S. An, M. T. Swihart, J. M. Yun, K. H. Kim and S. S. Yoon, Appl. Surf. Sci., 2017, 423, 210–218 CrossRef CAS.
- H. Wang, L. Shi, T. Yan, J. Zhang, Q. Zhong and D. Zhang, J. Mater. Chem. A, 2014, 2, 4739–4750 CAS.
- L. Ji and X. Zhang, Mater. Lett., 2008, 62, 2161–2164 CrossRef.
- H. Li, S. Liang, J. Li and L. He, J. Mater. Chem. A, 2013, 1, 6335 CAS.
- R. Kötz, M. Hahn and R. Gallay, J. Power Sources, 2006, 154, 550–555 CrossRef.
- H. R. Ghenaatian, M. F. Mousavi, S. H. Kazemi and M. Shamsipur, Synth. Met., 2009, 159, 1717–1722 CrossRef CAS.
- A. K. Mishra and S. Ramaprabhu, J. Phys. Chem. C, 2011, 115, 14006–14013 CAS.
- J. Liu, S. Wang, J. Yang, J. Liao, M. Lu, H. Pan and L. An, Desalination, 2014, 344, 446–453 CrossRef CAS.
- B. Qian, G. Wang, Z. Ling, Q. Dong, T. Wu, X. Zhang and J. Qiu, Adv. Mater. Interfaces, 2015, 2, 1500372 CrossRef.
- Q. Dong, G. Wang, B. Qian, C. Hu, Y. Wang and J. Qiu, Electrochim. Acta, 2014, 137, 388–394 CrossRef CAS.
- A. S. Yasin, J. Jeong, I. M. A. Mohamed, C. H. Park and C. S. Kim, J. Alloys Compd., 2017, 729, 764–775 CrossRef CAS.
| This journal is © The Royal Society of Chemistry 2017 |