
 Open Access Article
 This Open Access Article is licensed under a
 Creative Commons Attribution 3.0 Unported Licence
First-principles analysis of the stability of water on oxidised and reduced CuO(111) surfaces
Marco Fronzi *ab and
Michael Nolanb
*ab and
Michael Nolanb
aInternational Research Centre for Renewable Energy, State Key Laboratory of Multiphase Flow in Power Engineering, Xi’an Jiaotong University, Xi’an 710049, Shaanxi, China. E-mail: marco.fronzi@mail.xjtu.edu.cn
bTyndall National Institute, University College Cork, Lee Maltings, Cork, Ireland
First published on 15th December 2017
Abstract
We use first-principles density functional theory calculations including the Hubbard + U correction (PBE + U) on Cu-3d states to investigate the interaction of water with a CuO(111) surface. We compute adsorption energies and the stability of different water coverages, with a particular focus on the interaction of water with oxygen vacancy sites, and how vacancy stabilization occurs. We study the energetics, geometry and electronic structure of relevant configurations, finding that there are only small changes to the local geometry around the water adsorption site(s) and the electronic properties. The inclusion of van der Waals interactions has no significant impact on the stability of water on CuO(111). We extend the analysis to include realistic environmental conditions within the ab initio atomistic thermodynamics framework, which allows us to assess the stability of the water/copper-oxide system as a function of ambient conditions, and focus on three important surface processes: water adsorption/desorption on the stoichiometric surface, conditions for dissociation, and oxygen vacancy stabilization.
1 Introduction
Copper oxides are important and useful materials for many technological applications, from gas sensors to nano-electronics and nano-catalysis.1,2 This compound is present in nature in different stoichiometries, each one showing particular properties. The most commonly used forms in technological applications are cupric and cuprous oxides (CuO and Cu2O, respectively) with +2 and +1 Cu oxidation states. Both crystal structures show catalytically active surfaces and a relatively high photo-sensitivity, together with chemical stability and low production cost. Moreover, their band gap is small enough (1.2–2.4 eV) to allow harvesting of a substantial portion of the solar spectrum, which can give good photo-catalytic efficiency.3–6 Several investigations, using both experimental and theoretical computational approaches, have been presented to analyse the properties of copper oxides. For CuO, the subject of this paper, experimental work indicates a monoclinic crystal structure, with lattice constants a = 4.6837, b = 3.4226, c = 5.1288 A, α = 90°, β = 99.54°, and γ = 90°. The band gap is 1.4–1.7 eV and CuO takes an antiferromagnetic spin distribution (ferromagnetic in each layer), with a Cu magnetic moment of 0.68 μB. The presence of Cu2+ cations in the bulk structure, with a 3d9 electronic configuration, makes DFT studies of CuO particularly challenging.7,8 A number of Density Functional Theory (DFT) studies have explored the properties of CuO, with approximate LDA or GGA functionals, which give a metallic system. Corrections such as self-interaction correction, DFT + U or hybrid DFT can open up the band gap and recover the anti-ferromagnetic structure, to give a consistent description of the properties of CuO.9–16For the possible exploitation of CuO in solar to chemical energy conversion, generically termed artificial photosynthesis, we also have to consider, in addition to the properties of CuO, the fact that water will most likely be present and water can interact with metal oxide surfaces to modify them compared to the pristine surfaces. Water can be present either in the atmosphere or within the solution in which the reaction takes place. Thus, from one perspective, water may actively participate in the chemical reactions, contributing by donating either hydrogen or oxygen atoms, or from another perspective the water present can dissociate to form surface hydroxyl groups, which can then alter the properties of the catalyst.
Unlike other metal oxide surfaces such as (110) rutile and (101) anatase TiO2 or CeO2(111),17–19,35,36 little is known about the interaction of water with CuO surfaces. An attempt to study surface-water interactions has been presented by Zhang et al.20 They investigated the interaction of a single water molecule with perfect and defective CuO(111) surfaces using density functional theory within the GGA approximation, using the Perdew and Wang functional (PW91) for the exchange–correlation term where copper atoms were kept frozen and substituted by a DFT semi-core pseudopotential and other atoms are treated with an all-electron basis set. However, they neglected to include any consistent description of localized electron in the Cu-3d shell. The authors obtained adsorption energies and dissociation barriers, and concluded that the oxygen vacancy can exhibit a strong catalytic activity towards H2O dissociation. However, by not including any correction for the electron self-interaction, this can cause issues in describing hydrogen and hydroxyl interactions at and vacancies on the CuO(111) surface. In another study of CuO(111), it was shown by Maimaiti et al. that CuO shows some activity with respect to water formation as a result of the interaction of hydrogen with CuO.21 In particular the most stable CuO(111) surface was investigated and the authors demonstrated the formation of water after H2 adsorption, with surface oxygen atoms being removed. However, the adsorption and dissociation of H2O on the CuO(111) surface under realistic environmental conditions and at different coverages, within a consistent theoretical approach, is not at all understood and therefore a detailed analysis of the interaction of water with the CuO(111) surface under realistic catalytic conditions is still required and forms the subject of this paper.
We present a significant advance on these previous investigations, to give new insights into the stability of water at different coverages under different conditions on CuO(111). We analyse the properties of water adsorption on the clean and defective (111) surface at different coverages using first principles density functional theory, within the Generalized Gradient Approximation (GGA) using the Perdew–Burke–Ernzerhof (PBE) functional for the exchange–correlation term. To correct the un-physical electron self-interaction that is present in the localized Cu-3d shell, which is a fundamental problem in strongly correlated systems, we apply the Hubbard + U correction, giving so-called PBE + U. PBE + U has been applied to describe the localized Cu-3d states in bulk CuO and in Cu doping of metal oxides, and has been successful in correctly describing many properties of Cu.8,21,22 We further extend the analysis of the water–CuO interaction to treat more realistic environmental conditions, using our PBE + U energies within the framework of the ab initio atomistic thermodynamics formalism to model our system when in contact with a humid atmosphere consisting of oxygen and water vapour.23,24 Taken together, these results will give new insights into the interaction of CuO(111) and water, giving an understanding of the potential reactivity of CuO in a water environment.
2 Calculation methods
The calculations presented in this work are performed using a density functional theory approach, within the Generalized Gradient Approximation (GGA) using the Perdew–Burke–Ernzerhof (PBE) functional for the exchange–correlation term.25 We use periodic boundary conditions with a plane wave basis set as implemented in the VASP code.26 The cut-off energy for the valence electrons has been set at 400 eV, and the core-valence interaction is described by the projected augmented wave approach, with 11 valence electrons for Cu, 6 for O and 1 for H.27 Γ point calculations have been used for a (2 × 6) super-cell expansion of the CuO(111) surface, which consists of 24 atomic layers, with a vacuum gap of 20 Å. The convergence criteria for the energy and forces are 10−5 eV and 10−5 eV Å−1, respectively.In order to correctly describe the partially occupied states of Cu-3d and O-2p, the use of the Hubbard correction becomes crucial. The partially occupied states are described with U (Cu-3d) = 4.0 eV and U (O-2p) = 5.5 eV. These are in line with previous works.21 For some specific cases, a value of 7.0 eV has been also employed for the Cu-3d state, in order to test trends in the key quantities as a function of the magnitude of the Hubbard + U term. In previous studies, we have found that the +U correction is required to describe O-2p hole states that result after valence band hole formation; this is relevant for our ongoing work in studying the excited states of metal oxides.28,29 This +U correction on oxygen can also improve the binding energy of O2 which is important for vacancy formation. To estimate the contribution of van der Waals (vdW) interactions arising from the interaction of electric dipole moments, we repeated the calculations including a correction developed by Grimme (DFT-D3), and report the effect on the geometries and energetics.30 Using this set up we found that the anti-ferromagnetic configuration is the most stable for bulk CuO, and our computed lattice constants are a = 4.683 Å, b = 3.43 Å, c = 5.138 Å, and β = 99.2°.
3 Results
3.1 Energetics of different water adsorption coverages on CuO(111)
In this section we analyse the geometry and energetics of the interaction between water and CuO(111) surfaces, focusing on the adsorption of water at different coverages. The geometry of water at each coverage has been determined by the structural optimization of different initial water adsorption configurations. The adsorption energies are calculated per adsorbed water molecule as follows:
 | (1) |
 | ||
| Fig. 1 Atomic structure of a clean CuO(111) surface, highlighting the different types of Cu and oxygen atom at the surface. Light red and dark red spheres represent copper and oxygen atoms, respectively. | ||
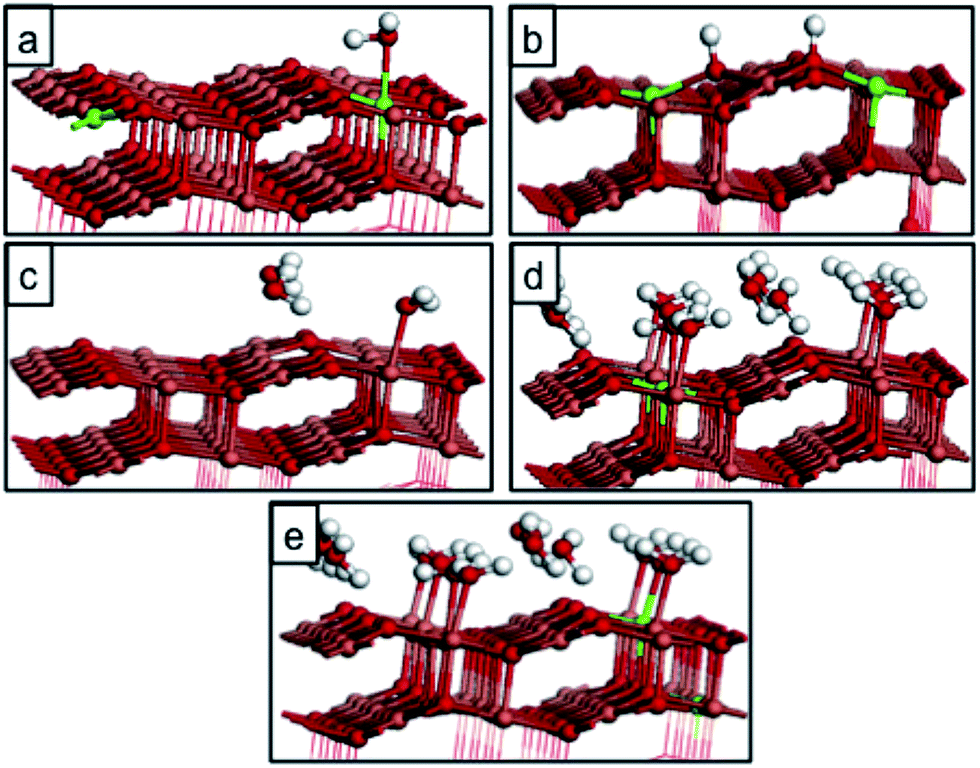
In a (2 × 6) expansion of the CuO super-cell, there are 24 Cu atoms that represent potentially favourable water adsorption sites and when 1, 3, 6, 8 or 12 water molecules adsorb on the CuO surface, the corresponding water coverages are 1/24, 1/8, 1/4, 1/3 and 1/2 monolayer (ML). Tables 1 and 2 report the computed water adsorption energies calculated for different water coverages and for different adsorption modes, within our PBE + U computational set-up. Table 1 also reports a direct comparison with the adsorption energies for a single water molecule calculated by Zhang et al. in ref. 20. A single water molecule adsorbs most favourably at the Cusurf2 site in a molecular fashion, with a computed adsorption energy of −0.32 eV. However, adsorption at the Cusurf1 site is only 0.03 eV less stable; see Fig. 2 and Table 1. Dissociative adsorption of water to give two surface hydroxyls is more stable by 0.03 eV. This very small energy difference between the adsorption modes indicates that all three adsorption modes are favourable and that when we consider the effect of water coverage, with multiple adsorbed water molecules, we have to consider adsorption configurations that take into account water adsorption at the Cusurf1 and Cusurf2 sites that were indicated in Fig. 1.
| Coverage | Ads. E (eV) |
|---|---|
| 1/8 molecular (Fig. 3(a)) | −0.30 |
| 1/8 molecular (Fig. 3(b)) | −0.62 |
| 1/8 molecular (Fig. 3(c)) | −0.40 |
| 1/8 dissociative (Fig. 3(d)) | −0.60 |
| 1/4 molecular (Fig. 4(a)) | −0.55 |
| 1/4 molecular (Fig. 4(b)) | −0.61 |
| 1/4 molecular (Fig. 4(c)) | −0.59 |
| 1/4 dissociative (Fig. 4(d)) | −0.60 |
| 1/4 dissociative (Fig. 4(e)) | −0.59 |
| 1/3 molecular (Fig. 5(a)) | −0.52 |
| 1/2 molecular (Fig. 5(b)) | −0.61 |
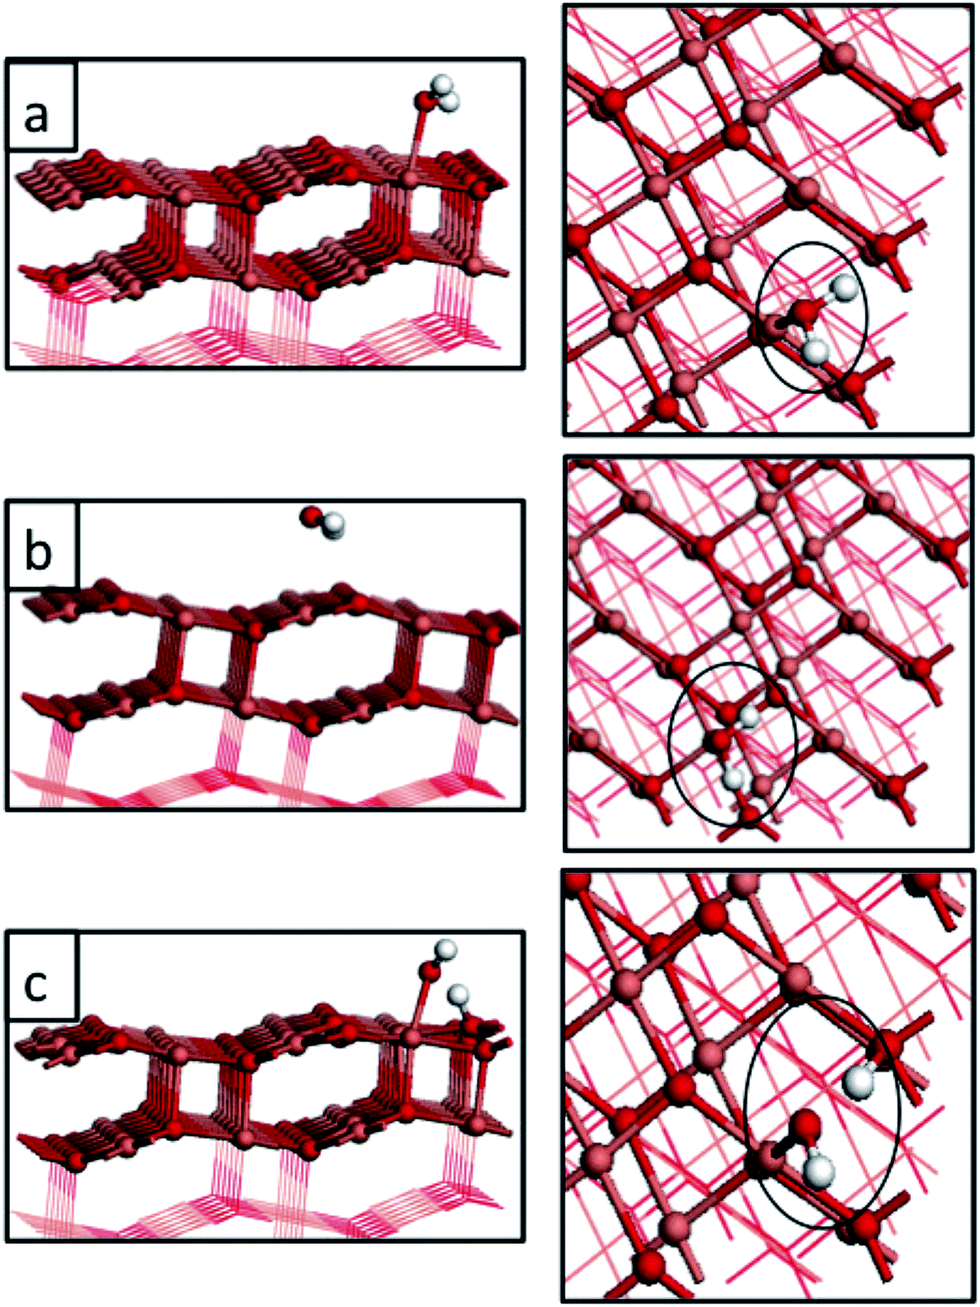 | ||
| Fig. 2 Atomic structure of water adsorbed on the CuO(111) surface at coverages of 1/24 ML. Panels (a) and (b) represent molecular adsorption at two different Cu sites, namely Cusurf2 and Cusurf1 (see Fig. 1). Panel (c) represents the dissociative adsorption of water. Light red, dark red and white spheres represent copper, oxygen and hydrogen atoms, respectively. | ||
We find a significant effect of the computational methodology on the magnitude of the adsorption energy of a single water molecule on the CuO(111) surface. Zhang et al. calculate, using plain DFT, adsorption energies of a single water molecule to be −0.90 eV and −0.41 eV for adsorption at the Cusurf2 and Cusurf1, respectively, indicating a clear preference for the Cusurf2 site. In contrast our water adsorption energies for 1/24 ML coverage at the same Cu sites are essentially iso-energetic using the +U correction to the Cu-3d states. This comparison indicates a very strong dependence on the description of the Cu2+ oxidation state, when going from U (Cu) = 0 eV (incorrect description of Cu2+) to U (Cu) = 4.0 eV (consistent description of Cu2+). Not only are the magnitudes of the adsorption energies reduced with the inclusion of the Hubbard + U term, but the stabilities of the two Cu adsorption sites are now very similar. To further examine the effect of the magnitude of the +U correction on the adsorption energies, we recalculated the 1/24 ML water adsorption energies with U (Cu) = 7.0 eV and this changes the adsorption energy by only 0.02 eV, compared to the result determined with U (Cu) = 4.0 eV. This result indicates that the description of electron localization in CuO can play a crucial role in molecular adsorption. Its effect is to strongly modify the adsorption energy once U is large enough to consistently describe the Cu2+ oxidation state. Further increases in the magnitude of U lead to insignificant changes.
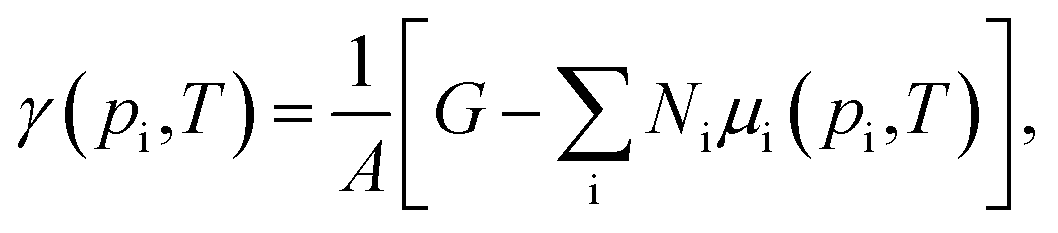
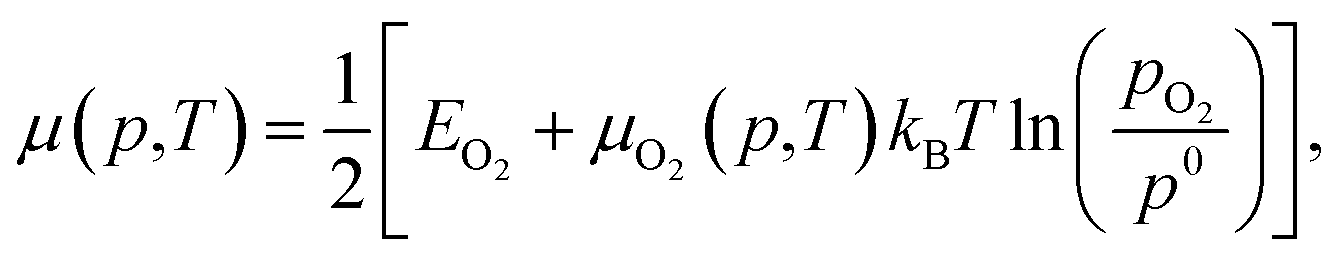
As we increase the water coverage, there are multiple adsorption modes to consider and these are shown for coverages of 1/8, 1/4, 1/3 and 1/2 ML of water in Fig. 3, 4 and 5, and reported in Table 2. We have explored adsorption of water at exclusively Cusurf2 or Cusurf1 sites and a mix of Cusurf2/Cusurf1 sites and we find that the adsorption modes that maximise the number of Cusurf2 sites involved are the most favourable for these coverages. As coverage increases, we observe a significant change in the water adsorption energies, which increases from −0.32 eV per water molecule at 1/24 ML coverage to −0.61 eV per water molecule at high coverages of 1/2 ML. A possible origin of the enhanced stability of water on CuO(111) with higher coverage is the increase in water–water interactions that could stabilize the high coverages, which in our system was calculated to be 0.1 eV per water molecule at 1/2 ML coverage, driven by the preference to adsorb water molecules along the Cusurf2 sites which allows strong water–water interactions.
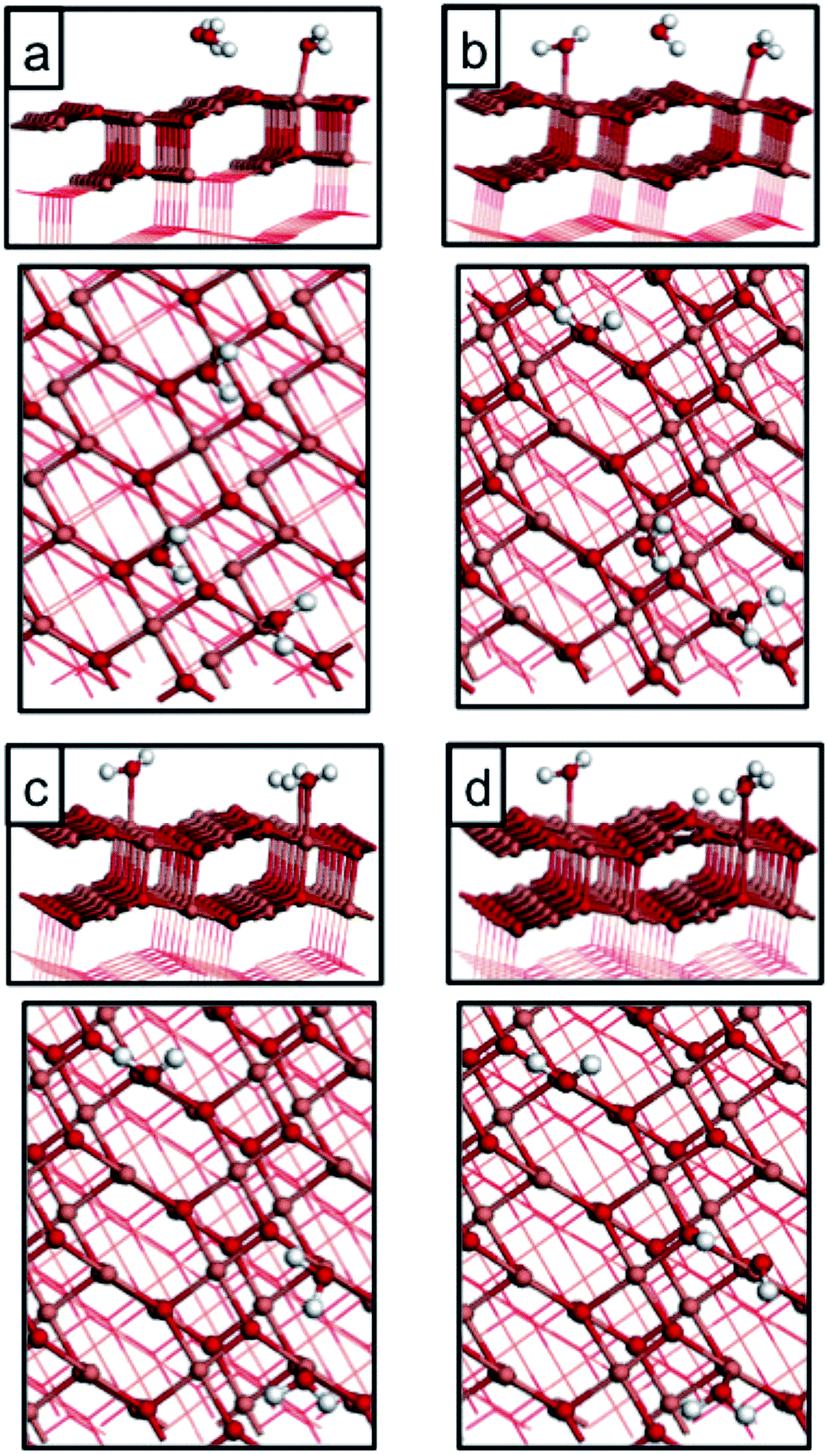 | ||
| Fig. 3 Atomic structure of water adsorbed on the CuO(111) surface at coverages of 1/8 ML. Panels (a)–(c) represent different molecular adsorption configurations at both Cusurf1 and Cusurf2, and panel (d) represents a dissociated adsorption mode upon adsorption at Cusurf2. Light red, dark red and white spheres represent copper, oxygen and hydrogen atoms, respectively. | ||
 | ||
| Fig. 4 Atomic structure of water adsorbed on the CuO(111) surface at coverages of 1/4 ML. Panels (a)–(c) represent different adsorption configurations of molecular water at this coverage at both Cusurf1 and Cusurf2 for (a) and (b), and only Cusurf2 for (c). Panels (d) and (e) represent different dissociative adsorption configurations at this coverage upon adsorption at both Cusurf1 and Cusurf2 in panel (d), and Cusurf2 in panel (e). Light red, dark red and white spheres represent copper, oxygen and hydrogen atoms, respectively. | ||
 | ||
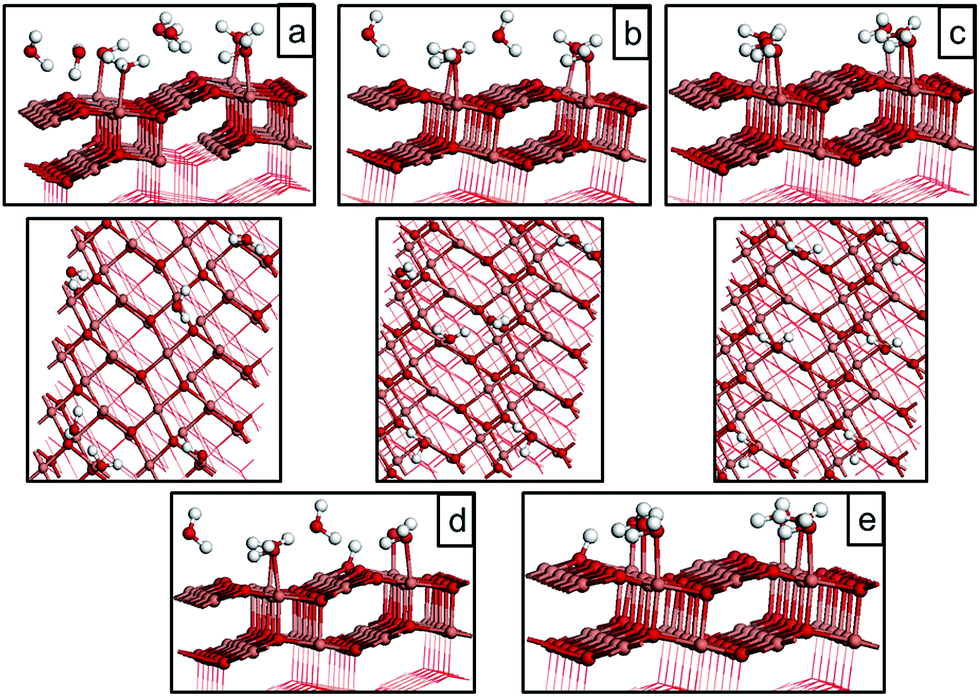
| Fig. 5 Atomic structure of water adsorbed on the CuO(111) surface at coverages of (a) 1/3 ML and (b) 1/2 ML at both Cusurf1 and Cusurf2. Light red, dark red and white spheres represent copper, oxygen and hydrogen atoms, respectively. | ||
We repeated the calculations with the inclusion of the vdW functional at different coverages, and the computed adsorption energies show an increased stability of ∼0.11 eV per water molecule at each coverage. For dissociation of a single water molecule, the adsorption energy increases by 0.18 eV, suggesting that the relative stability trend will not change with the inclusion of the vdW correction. Furthermore, water–water interactions are not significantly affected by non-local correction to DFT, and we calculated this contribution to be 0.02 eV per water molecule in 1/2 ML adsorption. This is consistent with the results obtained by Carrasco et al., who showed for water adsorption on CeO2(111) that the relative stability, adsorption sites, and adsorption geometries of competing water adstructures rarely differ when comparing results obtained with semi-local functionals and non-local vdW density functionals.31
3.2 Geometric and electronic properties of water adsorbed on CuO(111) at different coverages
Table 3 reports, for each adsorption configuration at each coverage corresponding to the adsorption configuration energies reported in Tables 1 and 2, important atomic distances for molecular and dissociated water. The average distance between Cu and water oxygen is significantly different, with a value between 1.99–2.12 Å at Cusurf1 and 2.77/3.11 Å at Cusurf2. The trend shows an average short distance with increasing the coverage, however this effect is less evident at Cusurf2, due to a weaker Cu–O interaction. Also, when increasing the coverage, the Cu–OH distance increases, although this effect is not as pronounced, and there is an elongation in the O–H bond distance in water molecules.| Water coverage (ML) | Cusurf1–OH2O | Cusurf2–OH2O | Cu–OH | Hdiss–OH | H–OH2O |
|---|---|---|---|---|---|
| 1/24 molecular Fig. 2(a) | 2.11 | 0.97 | |||
| 1/24 molecular Fig. 2(b) | 2.70 | 0.97 | |||
| 1/24 dissociative Fig. 2(c) | 1.85 | 1.73 | |||
| 1/8 molecular Fig. 3(a) | 2.12 | 2.64 | 0.96/0.98 | ||
| 1/8 molecular Fig. 3(b) | 2.12/2.05 | 2.69 | 0.96/0.98 | ||
| 1/8 molecular Fig. 3(c) | 2.12/2.04 | 2.69 | 0.99/0.96 | ||
| 1/8 dissociative Fig. 3(d) | 2.05 | 1.86 | 1.73 | 0.99/0.96 | |
| 1/4 molecular Fig. 4(a) | 1.99/2.05/2.03 | 2.77/3.01 | 0.96/1.01 | ||
| 1/4 molecular Fig. 4(b) | 2.00/2.07 | 2.90/3.06 | 0.96/1.00 | ||
| 1/4 molecular Fig. 4(c) | 2.07/2.09 | 0.96/1.00 | |||
| 1/4 molecular Fig. 4(d) | 2.00/2.07 | 2.90/3.06 | 0.96/1.00 | ||
| 1/4 dissociative Fig. 4(e) | 2.07/2.08 | 1.87 | 1.73 | 0.96/1.00 | |
| 1/3 molecular Fig. 5(a) | 2.00/2.07 | 2.85/3.06 | 0.96/1.02 | ||
| 1/2 molecular Fig. 5(b) | 2.01/2.08 | 2.91/3.11 | 0.96/1.02 |
The pristine CuO surface has six Cu–O distances, as illustrated in Fig. 6. After water adsorption we examined the lattice distortions associated with the change in Cu–O distance upon water adsorption. When a single water molecule adsorbs at the Cusurf1 site, we find a change in Cusurf1–Osurf and Cusurf1–Osub distances to 1.91 Å and 1.99 Å, respectively, and Cusurf2–Osurf distances to 1.93 Å and 1.89 Å, while a second layer O atom shifts toward Cusurf1 by 0.01 Å. On the other hand, when water adsorbs at the Cusurf2 site, Cusurf2–O distances will have a change between 0.02–0.06 Å, while the Cusurf2 distance from the second layer oxygen is not significantly affected. We do not observe a significant deviation by this trend in the lattice distortion at higher water coverages. When the vdW correction is introduced, our calculated Cu–O and Cu–H distances are, in both the high and low water coverage, around 0.02 Å and 0.03 Å, respectively, shorter than plain PBE + U.
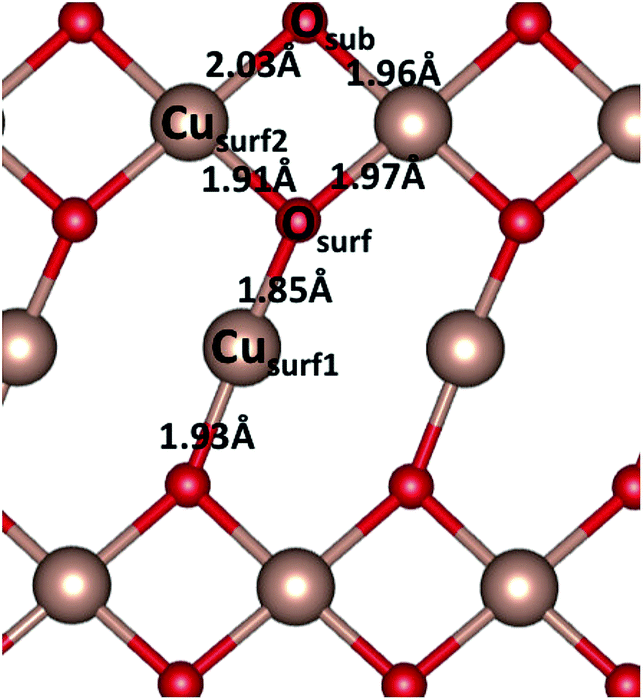 | ||
| Fig. 6 Schematic representation of the CuO(111) pristine surface, indicating the two Cu and two O sites. The figure reports Cu–O bond distances. | ||
Turning now to the electronic properties of water covered CuO(111), we examine the computed Bader charges and spin magnetisations in bare CuO(111) and after water adsorption. In the bare CuO(111) surface, the computed Bader charges are 9.8 electrons, which are typical values of Cu2+ species in different systems. The computed spin magnetisations are 0.5 μB per atom, which are in reasonable agreement with the experimental magnetic moment of 0.68 μB and a significant improvement on the GGA results with no + U correction, which are 0 μB.21 When we examine the Bader charges and spin magnetisations for the different water adsorption modes we find that these deviate very little from the pure CuO values. This suggests that the interaction of water with CuO surfaces induces little perturbation to the CuO electronic properties which would be consistent with the quite low adsorption energies per water molecule that we have computed. Fig. 7(a) shows the calculated spin polarised density of states (DOS) of pristine CuO(111), which reveal the antiferromagnetic nature of the crystal and its semiconducting character, as indicated by the quasi symmetric spin-up and spin-down channels, and the band gap around the Fermi level. The projected density of states (pDOS) shows that, in stoichiometric CuO, Cu-3d states consist of two relatively sharp peaks of Cu-t2g states (red line in Fig. 7(b)) at ∼−4 eV and ∼1 eV, and into two non degenerate eg peaks (green line in Fig. 7(b)) at similar energies, due to the “planar-like” fourfold coordination of Cu atoms in this crystal. The position of Cu-3d peaks (Fig. 7(b)) and the surface O-2p peak at ∼−2 eV (Fig. 7(c)) below the Valence Band Maximum (VBM) suggests that CuO behaves as a charge transfer insulator, in line with other results in the literature.32
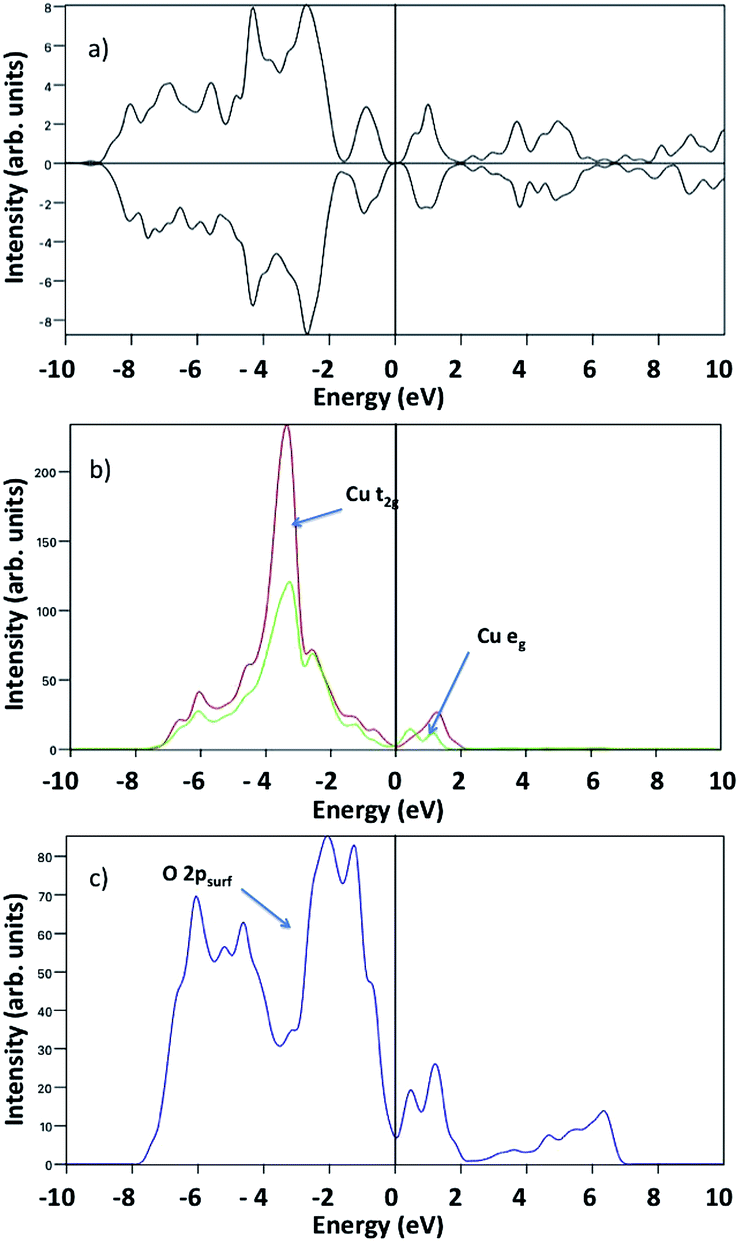 | ||
| Fig. 7 (a) Total density of states of the pristine CuO(111) surface. (b) and (c) represent respectively the projected density of states of pristine CuO(111) of surface Cu-t2g and Cu-eg (red and green lines), and surface O-2p (blue line). | ||
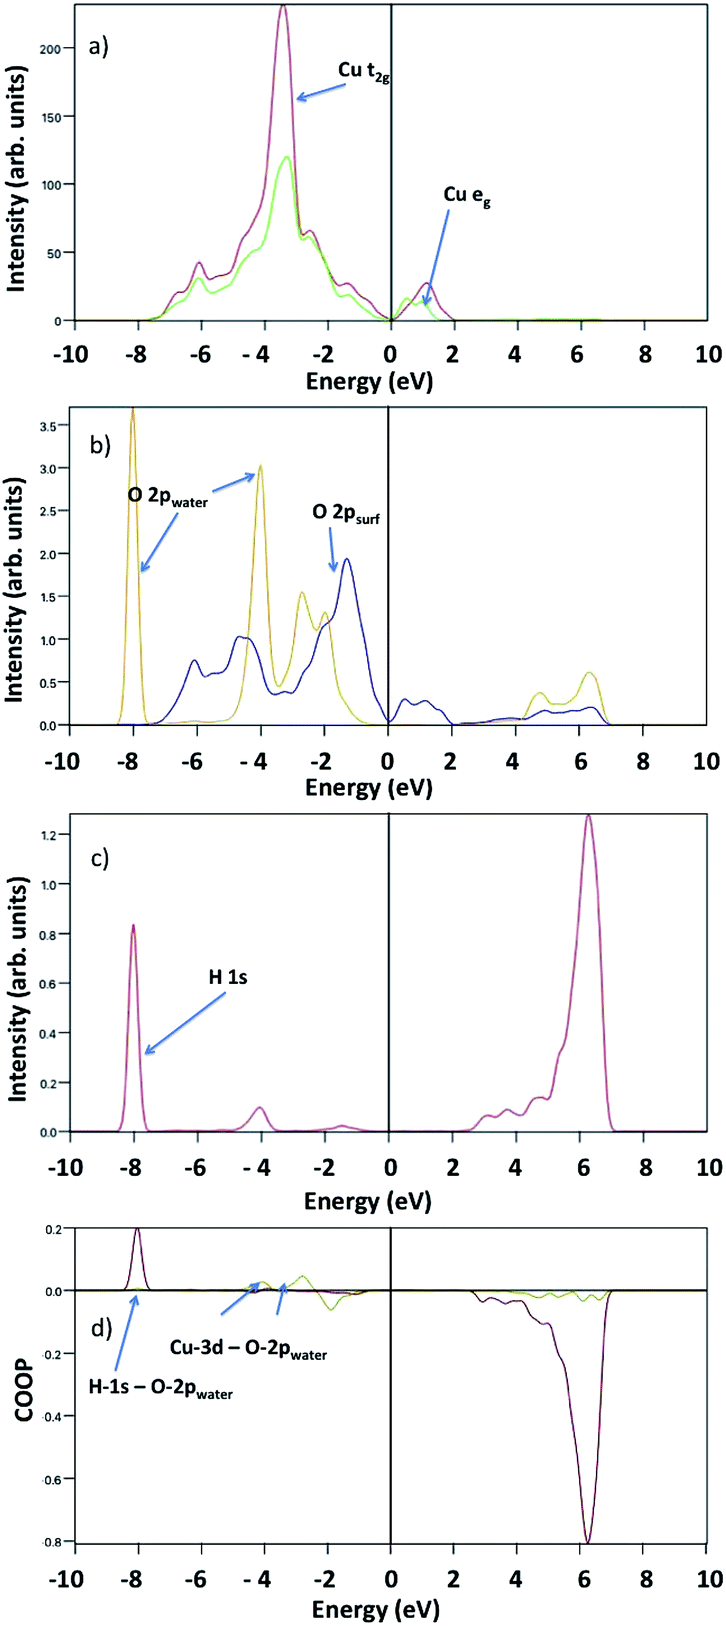
Fig. 8 shows the surface Cu-3d and O-2p, water O-2p and H-1s pDOS at 1/2 ML coverage. The surface O-2p states show two peaks with a maximum at about −4.5 eV and −2 eV below the VBM, while the water O-2p shows three peaks at −4 eV, −5 eV and −9 eV, where the first indicates a strong hybridization with surface Cu atoms. Here, we do not observe any evidence of overlapping peaks between water oxygen and surface oxygen. The H-1s pDOS show an intense double peak around −9 eV, and a less pronounced broad peak between −7 eV and −5 eV, where the first indicates a strong hybridization with water O-2p, whereas the second indicates a weak interaction with surface O-2p.
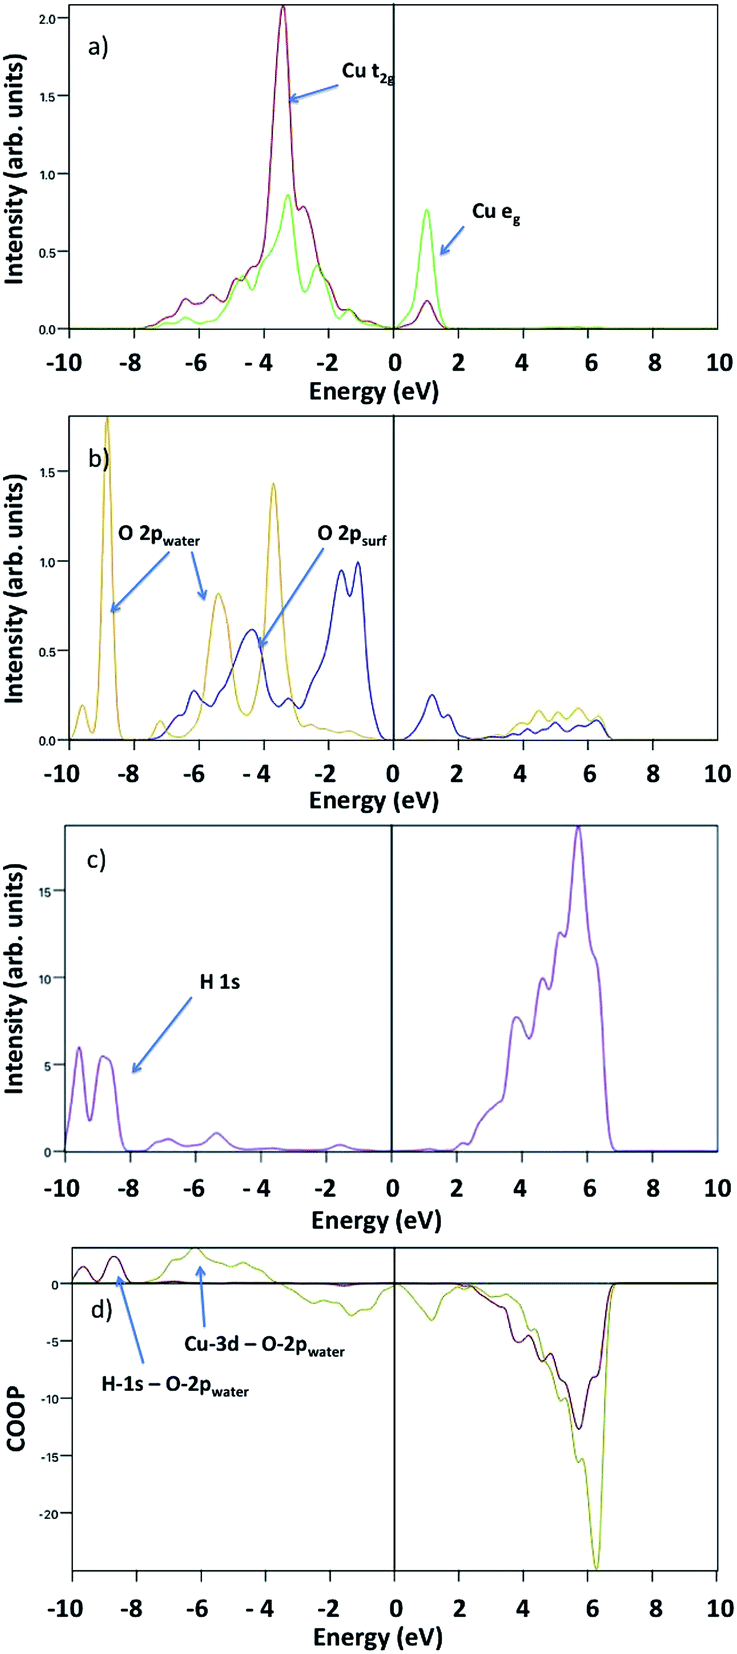 | ||
| Fig. 8 Projected density of states upon 1/2 ML water adsorption of (a) surface Cu-t2g and Cu-eg (red and green lines), (b) surface O-2p (blue line) and water O-2p (yellow line), and (c) water H-1s (purple line). (d) Calculated crystal orbital overlap population for H-1s-O-2p (dark red line) and Cu-3d-O-2p (dark yellow line). | ||
To analyse the bonding nature of Cu–O and O–H, we determined the Crystal Orbital Overlap Population (COOP) by multiplying the signs of two overlapping atomic wave-functions by the corresponding DOS, providing additional information regarding the bonding character: positive and negative values indicate bonding and antibonding interactions, respectively. Our COOP analysis suggests that the Cu-3d–O-2p bonding states are between −4 eV and −7 eV, whereas the H-1s–O-2p bonding states are between −10 eV and −8 eV. Other peaks correspond to either non-bonding or anti-bonding states.
No significant qualitative differences are reported at lower water coverages as suggested by the similar pDOS and COOP features in the single water molecule adsorption plot reported in Fig. 9. However, there is a shift of water O-2p peaks together with the Cu-3d–O-2p bonding peaks towards the Fermi level with relatively low intensity that reflects the lower binding energy at 1/24 ML coverage (see Fig. 9(b) and (d)).
 | ||
| Fig. 9 Projected density of states upon 1/24 ML water adsorption of (a) surface Cu-t2g and Cu-eg (red and green lines), (b) surface O-2p (blue line) and water O-2p (yellow line), and (c) water H-1s (red line). (d) Calculated crystal orbital overlap population for H-1s-O-2p (dark red line) and Cu-3d-O-2p (dark yellow line). | ||
Upon water dissociation, new features appear indicating bond formation, as depicted in Fig. 10. There are two evident hybridizations suggested by the overlapping peaks: one at −8 eV between surface O-2p and atomic H-1s, and another at −6 eV between O-2p, H-1s and Cu-t2g. COOP analysis confirms the formation of H-1s bonds with both surface and hydroxyl oxygen, and hydroxyl O-2p bond with Cu-3d.
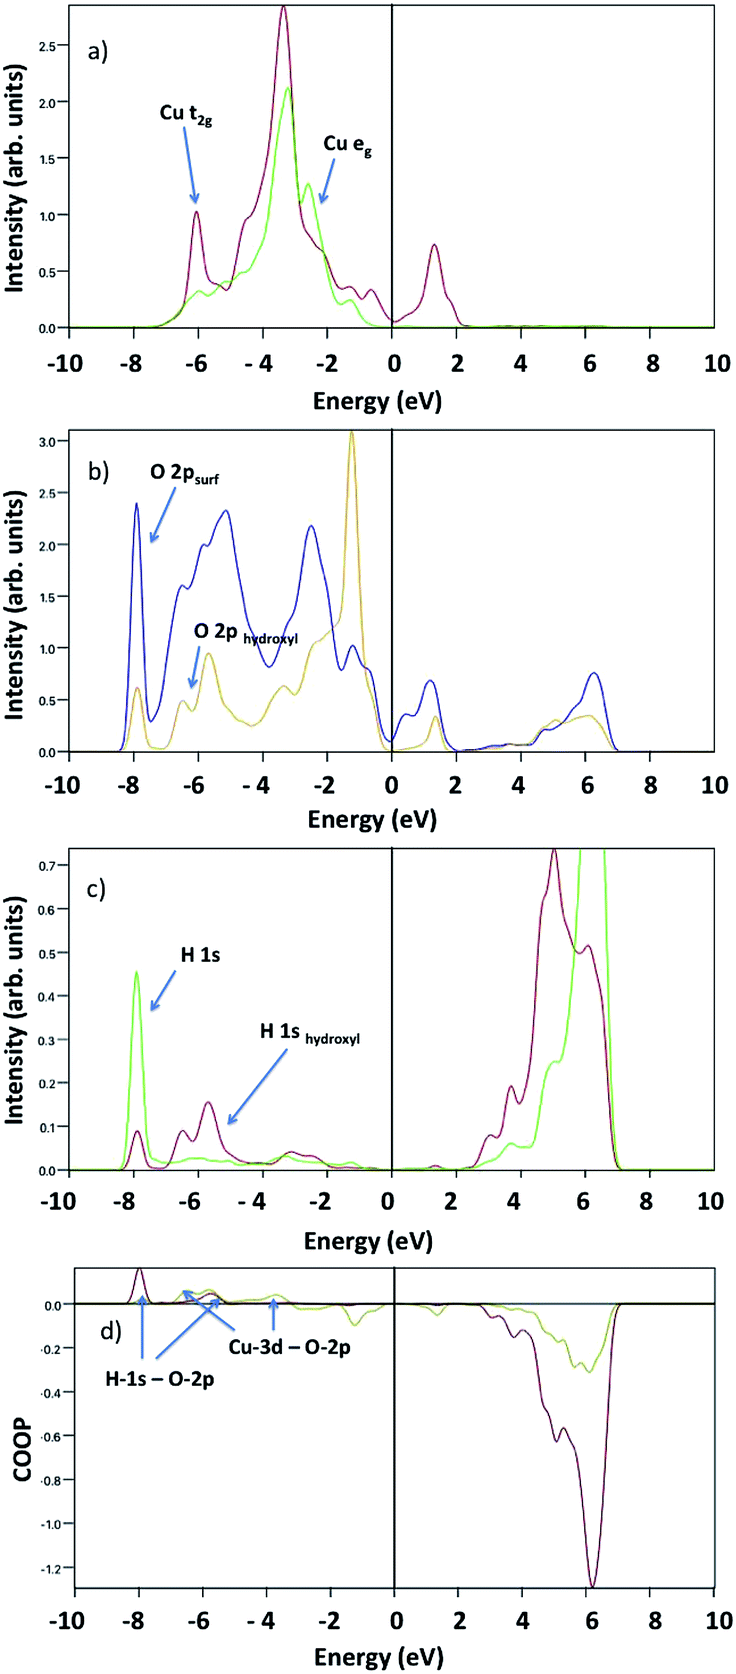 | ||
| Fig. 10 Projected density of states upon dissociative water adsorption at 1/24 ML coverage of (a) Cu-t2g and Cu-eg (red and green line, respectively), (b) water and surface O-2p (yellow and blue line, respectively), and (c) hydroxyl and atomic H-1s (red and green line). (d) Calculated crystal orbital overlap population for H-1s-O-2p (dark red line) and Cu-3d-O-2p (dark yellow line). | ||
The same calculations repeated with the Hubbard correction U = 0 eV do not consistently describe a spin configuration consistent with crystal field theory, instead favouring a non magnetic electron configuration. This is because the DFT wrongly describes the partially filled Cu 3d orbitals, with the d orbital at the Fermi energy. This suggests a metallic character as shown in Fig. 11. Harris et al. correlated the D-HOMO occupation and its position with respect to the Fermi level, the metal chalcogenide bond co-valence and the transition metal chalcogenide bond strength with the catalytic activity.33 The more electrons in a D-HOMO, at comparable bond strength, the better the catalytic activity. Smith et al. performed a DFT calculation on octahedral transition metal chalcogenide clusters and suggest that the strength of interaction between the metal 3d and the adsorbed p electrons, together with the d orbital occupation at the Fermi level, is responsible for the catalytic activity trends.34 These considerations suggest that both the occupation of the d states at the Fermi level and the d–d peak energies are crucial to correctly evaluate adsorption energies, which implies that for this crystal the inclusion of the Hubbard correction not only gives a correct description of the magnetic and semiconducting character, but also gives a better description of adsorption energies. This is the origin of the difference between our computed H2O adsorption energies and those of ref. 20.
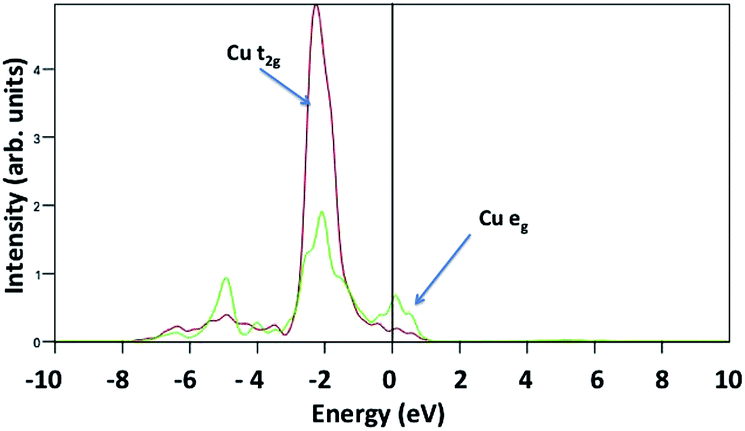 | ||
| Fig. 11 Projected density of states of the pristine CuO(111) surface calculated with U = 0. Here, Cu-t2g and Cu-eg are plotted in red and green lines, respectively. | ||
3.3 Interaction of water with oxygen vacancy sites in CuO(111)
We now analyse the interaction of water at the CuO(111) surface in the presence of oxygen vacancies. Oxygen vacancies typically act as catalytically active sites. For bare CuO(111), we have computed the oxygen vacancy formation energy as follows:
 | (2) |
 | ||
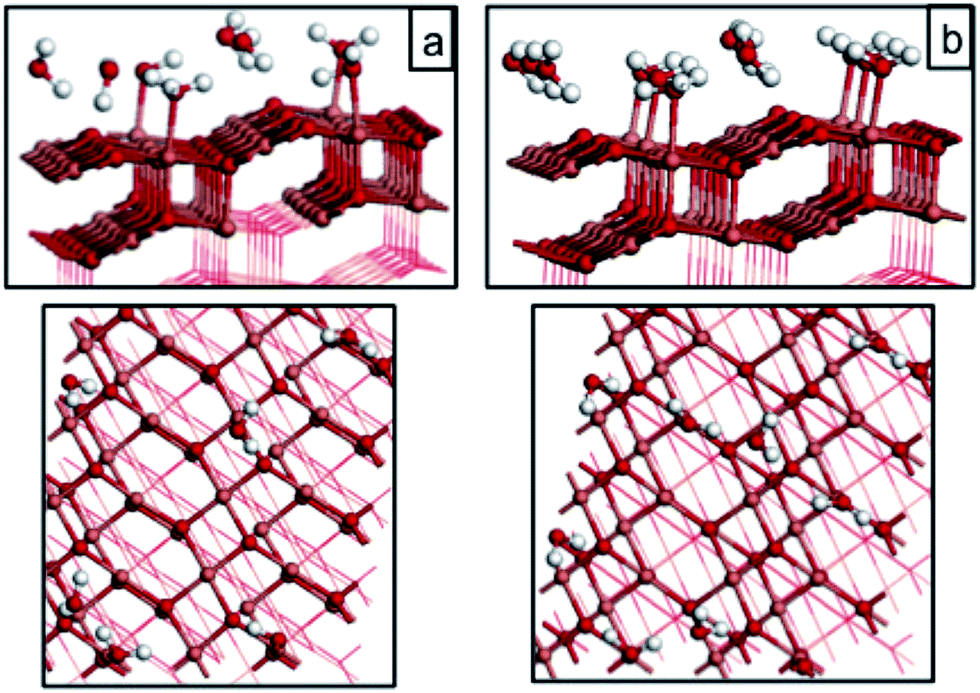
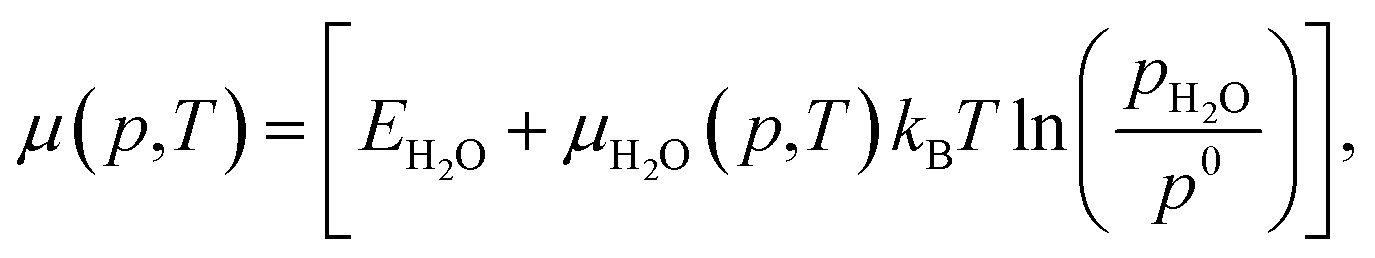
| Fig. 12 Atomic structure for water adsorbed on CuO(111) with a surface oxygen vacancy. (a) molecular water at 1/24 ML coverage, (b) dissociative water adsorption at 1/24 ML coverage, (c) molecular water adsorption at 1/8 ML coverage, (d and e) water adsorption structures at different O vacancy sites at 1/2 ML coverage. Reduced Cu+ species resulting from the formation of the oxygen vacancy are shown by green spheres. | ||
| Water coverage | Ads. E (eV) | VO E (eV) |
|---|---|---|
| 1/24 ML molecular (Fig. 12(a)) | −0.08 | 1.75 |
| 1/24 ML dissociative (Fig. 12(b)) | −0.73 | 1.08 |
| 1/8 ML molecular (Fig. 12(c)) | −0.30 | 2.48 |
| 1/2 ML molecular (Fig. 12(d)) | −0.58 | 1.81 |
We obtain an energy cost of 1.50 eV for the formation of an oxygen vacancy in the bare CuO(111) surface, indicating that oxygen atoms will be stable at the surface, consistent with the temperatures required for vacancy formation under vacuum.21 However, Maimaiti et al. show that CuO is easily reduced by hydrogen and it is therefore important to investigate the interaction of water with the defective CuO surface. The computed adsorption energies in Table 4 show that when an O vacancy is present on the surface, the water adsorption energies depend on the coverage, with the molecular adsorption at 1/24 ML being the least favourable. At this coverage, dissociative water adsorption is more stable by almost 0.7 eV. At higher coverages molecular water adsorption becomes more stable, and shows similar energetics to water adsorption at the oxidised CuO surface. If we consider O vacancy formation, with water already adsorbed on the oxidised CuO surface at the same coverages, there is a notable coverage dependence in the vacancy formation energies. For example, the least favourable vacancy is at 1/8 ML coverage and the 1/2 ML water coverage also has a higher vacancy formation energy than the clean surface. Thus, the presence of water may act to increase the temperature at which oxygen vacancies form in CuO (111).
From this first description of the interaction of water with CuO(111) at zero temperature and pressure, we conclude that there is some dependence of water stability on water coverage. There is a gain in energy upon dissociation on both stoichiometric and reduced CuO(111) surfaces. Therefore, when water adsorbs on a stoichiometric surface it can likely form a mix of molecular and dissociated water. We can conclude that such analysis, within bare DFT calculations at zero temperature and zero pressure conditions predicts the surface to have a mixture of molecular water, OH and H terminations; the precise details of which will depend on the state of the surface.
4 Thermodynamics of water adsorption on CuO(111)
To analyse the thermodynamic stability of an adsorbate–surface system, such as water on a metal oxide when exposed to a specific environment, it is crucial to include the effects of temperature and pressure of the surrounding atmosphere. This is achieved by employing ab initio atomistic thermodynamics.37 Within this approach the system is considered to be in thermodynamic equilibrium with a gas reservoir, representing the atmosphere, that exchanges particles with the system without changing its chemical potential. The surface energy can be calculated as the change in Gibbs free energy of the surface due to the formation of a particular composition, which, normalized by the unit area, is:
 | (3) |
| γbond(pi,T) = γclean(pi,T) − γsurf−mol(pi,T), | (4) |
 | (5) |
 | (6) |
Each chemical potential can be expressed as a function of the thermodynamic variables T and p. Here, we explicitly give the expression for water and oxygen, since our analysis includes these as independent variables. We can now, for convenience, re-define these quantities so that 0 eV represents the oxygen and water rich limiting conditions, and the plot is constructed as a function of ΔμO and ΔμH2O. The rich and poor limit for the chemical potential can be calculated considering oxygen and water to be in thermal equilibrium with the CuO(111) surface. The oxygen-poor limit corresponds to the condition when CuO dissociates into Cu and O2, while the oxygen-rich limit corresponds to the condition in which oxygen molecules condense on the surface. Analogous considerations apply for water, where an additional restriction has to be applied for the water-rich limit by considering water staying in the gas phase at any temperature or pressure. For this specific system, the limits for the chemical potentials are 0 ≥ ΔμO ≥ −3.0 eV and 0 ≥ ΔμH2O ≥ −0.91 eV. A more detailed description of the methodology used here, as well as the derivation of these quantities, can be found in previous works, where a similar approach has been used to investigate comparable systems.19,24,37,38
By employing this methodology, we are able to calculate the binding energy of the water-surface system at different water coverages. This will result in a two dimensional surface, plotted in a three dimensional space, where the x–y plane is here ΔμO–ΔμH2O, and the z axis is the binding energy. In the plot we consider the binding of the water in equilibrium with the environment. This means that the oxygen and the water in the atmosphere will have an effect on the binding energy of the molecule on the surface and the CuO bulk is not affected by any change in the chemical potentials. Therefore, we are able to plot the stability of the adsorbate–surface system and calculate the desorption pressure and temperature at different water coverages. If we then project the lowest binding energy surface γbond on the x–y plane, we obtain the phase diagram shown in Fig. 13. We use eqn (5) and (6) to express the chemical potential of oxygen and water in terms of partial pressure at different temperatures. The temperature range of interest is between 300 K and 1200 K, while the typical experimental pressure range is between 1 atm and 10−14 atm (UHV). Fig. 13 shows the water adsorption phase diagram, which is clearly divided in six different areas, and each area represents, for a given value of the chemical potential of the species, a thermodynamically stable structure. For a given temperature, at high values of the partial pressures of each species, the most stable structure is CuO(111) with a high water coverage. If we then move to lower partial pressure in each direction, the binding of water at lower coverage becomes more favourable, showing a relatively narrow area where an intermediate coverage, from 8 to 1 water molecules per super-cell (corresponding to 1/3 to 1/24 ML), is stable. Finally at a very low partial pressure of each species, a clean CuO(111) surface is stable. We can immediately see that both water and oxygen chemical potentials play the same role in the water adsorption–desorption trend. However, this is only a qualitative observation, since the actual transitions occur at different conditions if we consider the two directions of ΔμO and ΔμH2O.
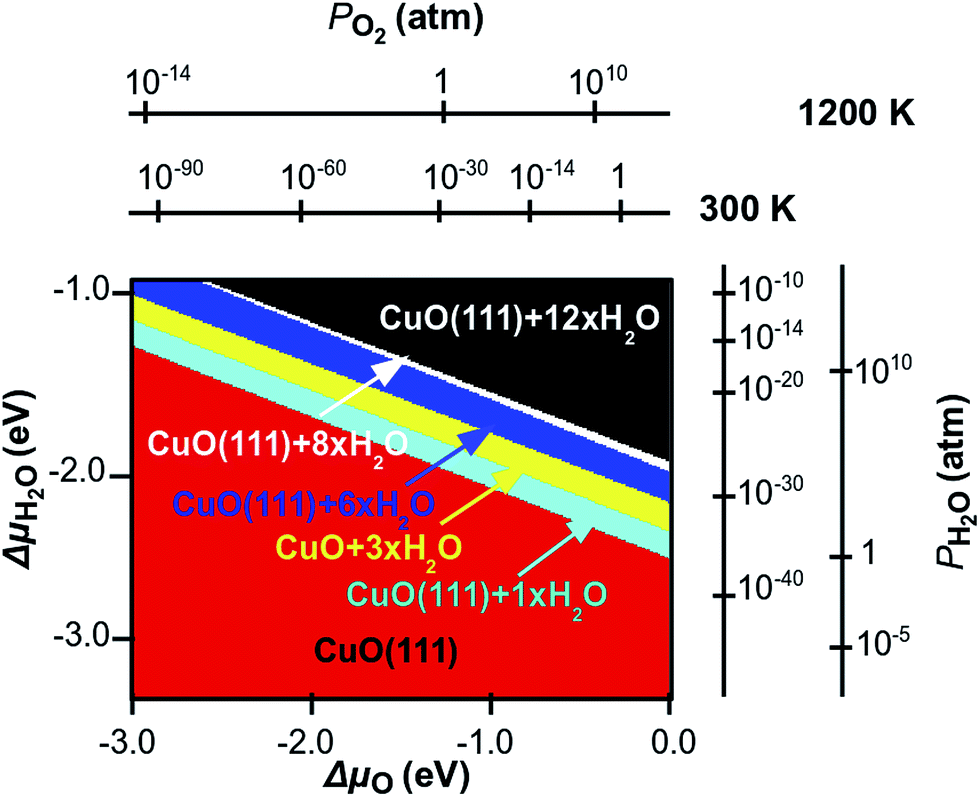 | ||
| Fig. 13 Surface phase diagram of stable structures of CuO(111) in equilibrium with a “humid environment”, as a function of ΔμO and ΔμH2O in the gas phase. The additional axes show the corresponding pressure scales at T = 300 K and 1200 K. Coloured areas are associated to different water coverages as follows: black (1/2 ML), white (1/3 ML), blue (1/4 ML), yellow (1/8 ML), turquoise (1/24 ML) and red (pristine). | ||
For quantitative consideration, we can group the above mentioned areas into three main groups, namely the red area, which represents the stability region of the clean surface, the black area, which represents the stability region of high coverage and the remaining area, which represents the stability region of medium coverage. If we fix the chemical potential of one species and let the other change, we can identify the conditions for phase-transitions that involve water desorption. If we fix the chemical potential of oxygen to be 0 eV and let ΔμH2O change, we are simulating an oxygen rich atmosphere at different humidity. Within these conditions if water pressure is at 1 atm, we find that the transition between high coverage and medium coverage is at ∼800 K, while the transition between medium coverage and a clean surface after desorption is at ∼1000 K, so that CuO will be covered with water up to high temperatures. This would be relevant for using CuO in catalysis where surface water could be involved in chemical reactions. The values of the transition temperature drop to ∼400 K and ∼650 K when the partial pressure of the water is 10−14 atm. If we repeat this analysis, but this time fixing the chemical potential of water at rich conditions and let the oxygen chemical potential vary, we calculate the transition between high and medium coverage to occur at very high temperatures above 3000 K, while if the pressure of the oxygen drops to 10−14 (UHV), the same transition will occur at ∼950 K. In this case the other transition would occur outside of our scale, where the CuO bulk dissociates into Cu and O, therefore we do not consider this here. The effect of the partial pressure of oxygen and water on the water desorption process is the same, however it takes place at different temperatures in each case.
It is interesting to analyse the same transition when the temperature of the environment is fixed at 450 K, which is a typical condition for catalytic reactions. If the oxygen partial pressure is 1 atm., then the transition from high to medium coverage occurs when water partial pressure is below 10−14 atm. The transition from medium coverage of water to a bare surface is at 10−10 atm. On the other hand if we fix pO2 around 10−14 (UHV) then the same transitions occur at pH2O = 10−5 and 10−14 atm.
The phase diagram represented here is calculated for adsorption energies computed for a Hubbard term U = 4.0 eV. The effect on the water binding energies is relatively small for a change of U up to 7.0 eV and it would not bring any substantial qualitative change in the extrapolated adsorption–desorption. However what is most important is the effect of including the +U correction in the first place (with a sufficiently large value of U) – failure to account for the correlated nature of the Cu2+ oxidation state in the thermodynamics analysis will lead to very different results, given the large difference in water binding energy between our calculations and those of Zhang et al.20 After these considerations we can conclude that water dissociation may occur only in the areas of the phase diagram where water adsorbed on the surface is stable. As seen in the last section, this would bring a gain in energy, which therefore indicates that the process is thermodynamically favourable. A further energy gain will occur after water dissociation at the vacancy site, with the formation of H species adsorbed at the O sites, and the oxygen filling the vacancy. However, although this process is favoured, it would occur outside our limits, since oxygen vacancies have an energy cost to form, which is confirmed in previous analysis.21 From the previous section we predict that water can be present on the CuO(111) surface both molecularly and dissociated (forming hydroxyl groups on the surface), and the necessary thermodynamic conditions are within the black area. However, after dissociation and hydrogen desorption the environmental conditions to analyse in detail the stability of the surface will change, and a detailed investigation of such conditions is beyond the scope of this work. Also, although in the previous section we concluded that water desorption at the vacancy site is highly favourable, the vacancy formation occurs outside the stability of the CuO surface. This result indicates the fundamental role of the chemical potential of both water and oxygen in the description of molecule–surface interaction.
5 Conclusions
We performed DFT calculations in order to analyse the energetics and the structure of H2O adsorption on the stoichiometric and reduced CuO(111) surface at different water coverages. Our results show that, on the stoichiometric surface, the most stable structure is the one in which water is adsorbed at the Cusurf2 site. However, the adsorption energy indicates a very small difference if compared to the adsorption at the Cusurf1 site. We found the adsorption energy to increase with the coverage up to 1/2 ML, while a dissociative adsorption is stable with a very small energy gain at low coverages. We found that water stabilizes a stoichiometric surface, while having little influence on the magnetic moment and charge of the surface copper atoms. We impose the Hubbard correction to the energy to describe electron localization and we find a significant effect on the adsorption energies for values up to U = 4.0 eV, while at higher values, up to U = 7.0 eV, the effect is negligible. To include realistic environmental variables such as temperature and pressure, we employ our DFT results within the ab initio thermodynamics framework. This approach allows us to calculate the conditions for water desorption, and we found a few interesting transitions. When the pressure is 1 atm, we calculate the transition between high coverage and medium coverage to be at ∼800 K, while total water desorption occurs only at ∼1000 K. The same values of temperature drop respectively to ∼400 and ∼650 K when the partial pressure of the water is 10−14 atm. It is crucial to point out the fundamental role of the ab initio thermodynamics as a methodology to predict surface reactivity. In fact, while plain DFT calculations, which consider the system to be at T = 0 and p = 0, predict an H and OH terminated surface, after the inclusion of a thermodynamic variable we conclude that water will not dissociate on CuO(111) under typical reaction conditions.Conflicts of interest
There are no conflict to declare.Acknowledgements
The authors gratefully acknowledge the financial support from the National Natural Science Foundation of China (No. 51323011), and from the Science Foundation Ireland (SFI) through the US-Ireland R&D Partnership Program, grant number SFI 14/US/E2915 and the European Commission through the COST Action CM1104 “Reducible Metal Oxides, Structure and Function”. We acknowledge access to computing resources at Tyndall provided by SFI and by the SFI and Higher Education Authority funded Irish Centre for High End Computing.References
- Z. Fang, D. Wang, P. Chang, W. Tseng and J. Lu, Appl. Phys. Lett., 2004, 85, 5929 CrossRef.
- C. Li, D. Zhang, X. Liu, S. Han, T. Tang, J. Han and C. Zhou, Appl. Phys. Lett., 2003, 82, 1613 CrossRef CAS.
- S. C. Ray, Sol. Energy Mater. Sol. Cells, 2001, 68, 307 CrossRef CAS.
- K. Hardee and A. Bard, J. Electrochem. Soc., 1977, 124, 215 CrossRef CAS.
- F. Marabelli, G. Parravicini and F. Salghetti-Drioli, Phys. Rev. B: Condens. Matter Mater. Phys., 1995, 52, 1433 CrossRef CAS.
- J. Ghijsen, L. H. Tjeng, J. Elp and H. Eskes, Phys. Rev. B: Condens. Matter Mater. Phys., 1988, 38, 11322 CrossRef CAS.
- M. Heinemann, B. Eifert and C. Heiliger, Phys. Rev. B: Condens. Matter Mater. Phys., 2013, 87, 115111 CrossRef.
- M. Nolan and S. D. Elliott, Phys. Chem. Chem. Phys., 2006, 8, 5350 RSC.
- K. Terakura, T. Oguchi, A. R. Williams and J. Kubler, Phys. Rev. B: Condens. Matter Mater. Phys., 1984, 30, 4373 CrossRef.
- M. Grioni, M. T. Czyzyk, F. M. F. de Groot, J. C. Fuggle and B. E. Watts, Phys. Rev. B: Condens. Matter Mater. Phys., 1989, 39, 4886 CrossRef.
- W. Y. Ching, Y. N. Xu and K. W. Wong, Phys. Rev. B: Condens. Matter Mater. Phys., 1989, 40, 7684 CrossRef CAS.
- C. E. Ekuma, V. I. Anisimov, J. Moreno and M. Jarrell, Eur. Phys. J. B, 2014, 87, 40949 CrossRef.
- V. I. Anisimov, J. Zaanen and O. K. Andersen, Phys. Rev. B: Condens. Matter Mater. Phys., 1991, 44, 943 CrossRef CAS.
- R. C. Albers, N. E. Christensen and A. Svane, J. Phys.: Condens. Matter, 2009, 21, 343201 CrossRef CAS PubMed.
- A. Svane and O. Gunnarsson, Phys. Rev. Lett., 1990, 65, 1148 CrossRef CAS PubMed.
- M. Takahashi and J.-I. Igarashi, Phys. Rev. B: Condens. Matter Mater. Phys., 1997, 56, 12818 CrossRef CAS.
- M. Fronzi, A. Iwaszuk, A. Lucid and M. Nolan, J. Phys.: Condens. Matter, 2016, 28, 074006 CrossRef PubMed.
- M. Posternak, A. Baldereschi and B. Delley, J. Phys. Chem. C, 2009, 113, 15862 CAS.
- M. Fronzi, S. Piccinin, B. Delley, E. Traversa and C. Stampfl, Phys. Chem. Chem. Phys., 2009, 11, 9188 RSC.
- J. Zhang, R. Zhang, B. Wang and L. Ling, Appl. Surf. Sci., 2016, 364, 758 CrossRef CAS.
- Y. Maimaiti, M. Nolan and S. Elliott, Phys. Chem. Chem. Phys., 2014, 16, 3036 RSC.
- J. J. Carey and M. Nolan, Appl. Catal., B, 2016, 197, 324 CrossRef CAS.
- C. Stampfl, Catal. Today, 2005, 105, 17 CrossRef CAS.
- K. Reuter and M. Scheffler, Phys. Rev. B: Condens. Matter Mater. Phys., 2001, 65, 035406 CrossRef.
- J. P. Perdew, K. Burke and M. Ernzerhof, Phys. Rev. Lett., 1996, 77, 3865 CrossRef CAS PubMed.
- G. Kresse and J. Furthmuller, Comput. Mater. Sci., 1996, 6, 15 CrossRef CAS.
- P. E. Blöchl, Phys. Rev. B: Condens. Matter Mater. Phys., 1994, 50, 17953 CrossRef.
- M. Nolan, S. C. Parker and G. W. Watson, Surf. Sci., 2005, 595, 223 CrossRef CAS.
- M. Nolan, ACS Appl. Mater. Interfaces, 2012, 4, 5863 CAS.
- S. Grimme, J. Antony, S. Ehrlich and S. Krieg, J. Chem. Phys., 2010, 132, 154104 CrossRef PubMed.
- J. Carrasco, J. Klimeš and A. Michaelides, J. Chem. Phys., 2013, 138, 024708 CrossRef PubMed.
- Y. Wang, S. Lany, J. Ghanbaja, Y. Fagot-Revurat, Y. P. Chen, F. Soldera, D. Horwat, F. Mücklich and J. F. Pierson, Phys. Rev. B: Condens. Matter Mater. Phys., 2016, 94, 245418 CrossRef.
- S. Harris and R. Chianelli, J. Catal., 1984, 86, 400 CrossRef CAS.
- T. S. Smith and K. H. Johnson, Catal. Lett., 1994, 28, 361 CrossRef.
- M. Nolan, A. Iwaszuk and K. A. Gray, J. Phys. Chem. C, 2014, 118, 27890 CAS.
- A. Iwaszuk, A. K. Lucid, K. M. Razeeb and M. Nolan, J. Mater. Chem. A, 2014, 2, 18796 CAS.
- K. Reuter and M. Scheffler, Phys. Rev. B: Condens. Matter Mater. Phys., 2003, 68, 045407 CrossRef.
- M. Fronzi, S. Piccinin, B. Delley, E. Traversa and C. Stampfl, RSC Adv., 2014, 4, 12245 RSC.
| This journal is © The Royal Society of Chemistry 2017 |